Cleveland County, OK
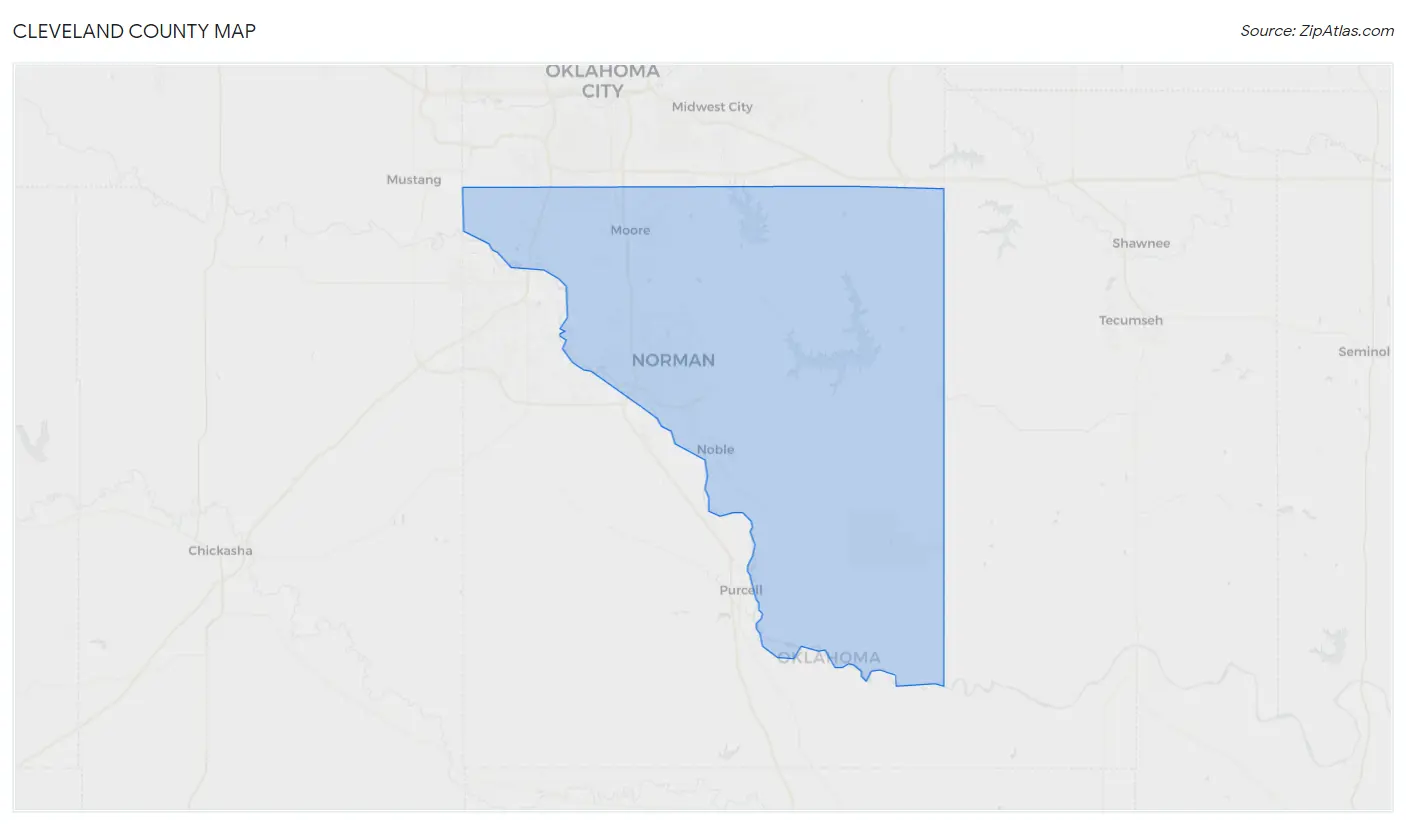
Cleveland County Map
Cleveland County Overview
295,060
TOTAL POPULATION
147,722
MALE POPULATION
147,338
FEMALE POPULATION
100.26
MALES / 100 FEMALES
99.74
FEMALES / 100 MALES
34.8
MEDIAN AGE
3.0
AVG FAMILY SIZE
2.5
AVG HOUSEHOLD SIZE
$36,913
PER CAPITA INCOME
$91,818
AVG FAMILY INCOME
$71,757
AVG HOUSEHOLD INCOME
34.5%
WAGE / INCOME GAP [ % ]
65.5¢/ $1
WAGE / INCOME GAP [ $ ]
$11,607
FAMILY INCOME DEFICIT
0.44
INEQUALITY / GINI INDEX
157,787
LABOR FORCE [ PEOPLE ]
65.4%
PERCENT IN LABOR FORCE
4.7%
UNEMPLOYMENT RATE
Cleveland County Area Codes
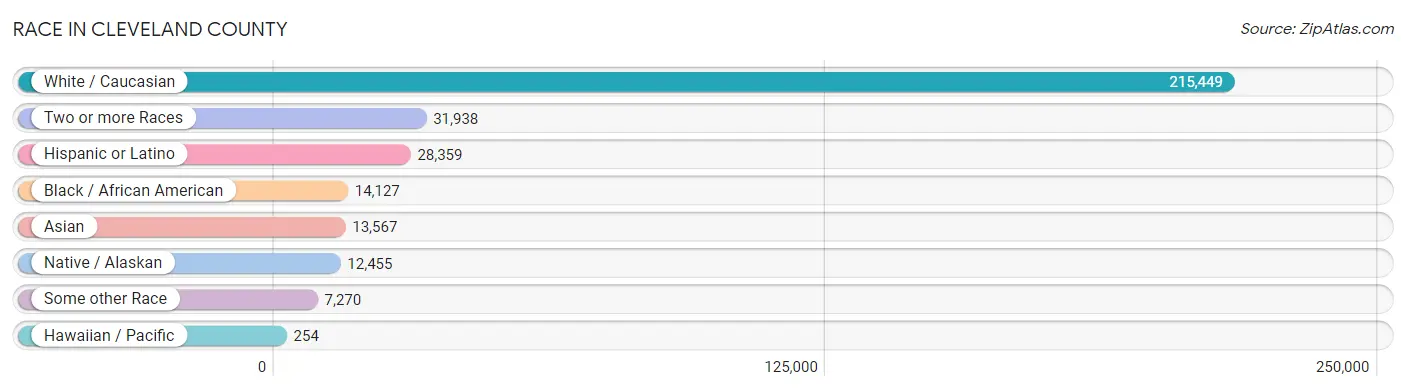
Race in Cleveland County
The most populous races in Cleveland County are White / Caucasian (215,449 | 73.0%), Two or more Races (31,938 | 10.8%), and Hispanic or Latino (28,359 | 9.6%).
| Race | # Population | % Population |
| Asian | 13,567 | 4.6% |
| Black / African American | 14,127 | 4.8% |
| Hawaiian / Pacific | 254 | 0.1% |
| Hispanic or Latino | 28,359 | 9.6% |
| Native / Alaskan | 12,455 | 4.2% |
| White / Caucasian | 215,449 | 73.0% |
| Two or more Races | 31,938 | 10.8% |
| Some other Race | 7,270 | 2.5% |
| Total | 295,060 | 100.0% |
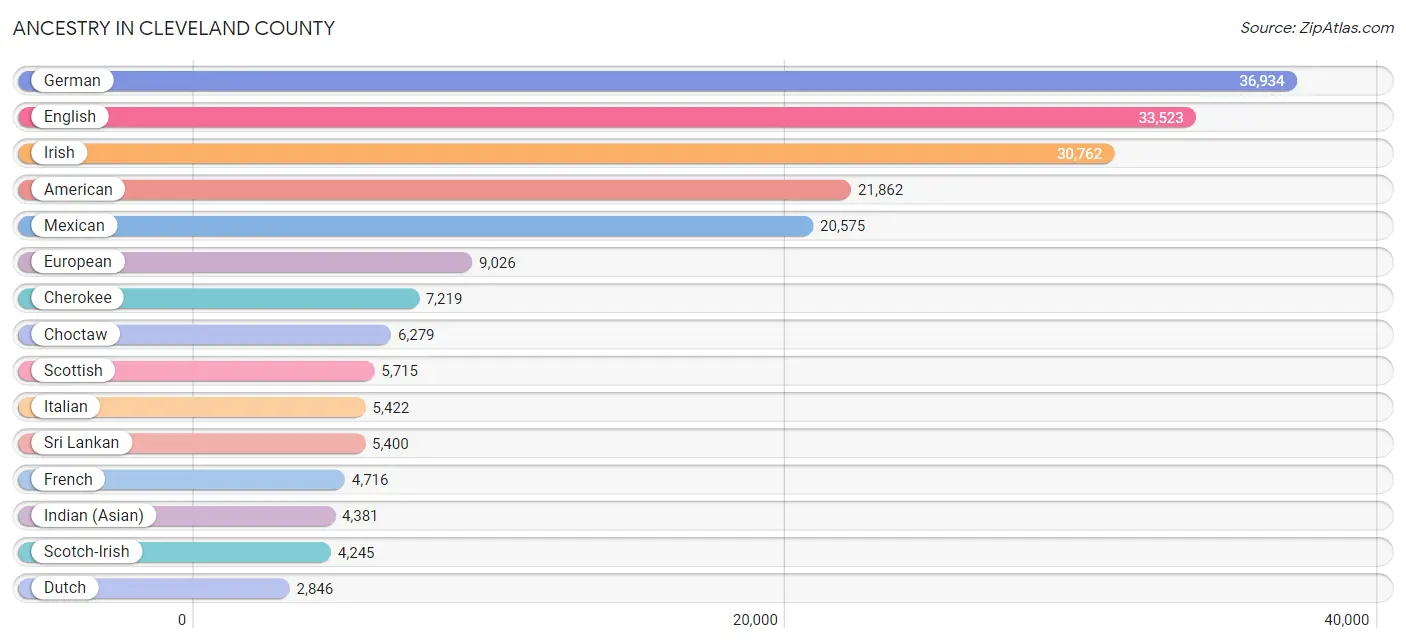
Ancestry in Cleveland County
The most populous ancestries reported in Cleveland County are German (36,934 | 12.5%), English (33,523 | 11.4%), Irish (30,762 | 10.4%), American (21,862 | 7.4%), and Mexican (20,575 | 7.0%), together accounting for 48.7% of all Cleveland County residents.
| Ancestry | # Population | % Population |
| Afghan | 28 | 0.0% |
| African | 1,001 | 0.3% |
| Alaska Native | 89 | 0.0% |
| Albanian | 59 | 0.0% |
| Aleut | 3 | 0.0% |
| Alsatian | 23 | 0.0% |
| American | 21,862 | 7.4% |
| Apache | 294 | 0.1% |
| Arab | 1,022 | 0.4% |
| Arapaho | 6 | 0.0% |
| Argentinean | 212 | 0.1% |
| Armenian | 126 | 0.0% |
| Australian | 29 | 0.0% |
| Austrian | 153 | 0.1% |
| Bahamian | 55 | 0.0% |
| Bangladeshi | 68 | 0.0% |
| Barbadian | 16 | 0.0% |
| Belgian | 200 | 0.1% |
| Belizean | 15 | 0.0% |
| Bhutanese | 1,205 | 0.4% |
| Blackfeet | 203 | 0.1% |
| Bolivian | 49 | 0.0% |
| Brazilian | 81 | 0.0% |
| British | 2,668 | 0.9% |
| Bulgarian | 68 | 0.0% |
| Burmese | 1,595 | 0.5% |
| Cajun | 83 | 0.0% |
| Canadian | 315 | 0.1% |
| Celtic | 118 | 0.0% |
| Central American | 2,354 | 0.8% |
| Central American Indian | 628 | 0.2% |
| Cherokee | 7,219 | 2.5% |
| Cheyenne | 127 | 0.0% |
| Chickasaw | 2,796 | 0.9% |
| Chilean | 10 | 0.0% |
| Chippewa | 96 | 0.0% |
| Choctaw | 6,279 | 2.1% |
| Colombian | 333 | 0.1% |
| Comanche | 427 | 0.1% |
| Costa Rican | 208 | 0.1% |
| Cree | 21 | 0.0% |
| Creek | 2,314 | 0.8% |
| Croatian | 30 | 0.0% |
| Crow | 38 | 0.0% |
| Cuban | 291 | 0.1% |
| Czech | 1,178 | 0.4% |
| Czechoslovakian | 148 | 0.1% |
| Danish | 553 | 0.2% |
| Delaware | 70 | 0.0% |
| Dominican | 56 | 0.0% |
| Dutch | 2,846 | 1.0% |
| Dutch West Indian | 462 | 0.2% |
| Eastern European | 581 | 0.2% |
| Ecuadorian | 82 | 0.0% |
| Egyptian | 11 | 0.0% |
| English | 33,523 | 11.4% |
| Ethiopian | 33 | 0.0% |
| European | 9,026 | 3.1% |
| Filipino | 5 | 0.0% |
| Finnish | 165 | 0.1% |
| French | 4,716 | 1.6% |
| French American Indian | 27 | 0.0% |
| French Canadian | 548 | 0.2% |
| German | 36,934 | 12.5% |
| German Russian | 13 | 0.0% |
| Ghanaian | 264 | 0.1% |
| Greek | 448 | 0.2% |
| Guamanian / Chamorro | 137 | 0.1% |
| Guatemalan | 521 | 0.2% |
| Haitian | 49 | 0.0% |
| Honduran | 249 | 0.1% |
| Hungarian | 483 | 0.2% |
| Icelander | 40 | 0.0% |
| Indian (Asian) | 4,381 | 1.5% |
| Indonesian | 25 | 0.0% |
| Inupiat | 13 | 0.0% |
| Iranian | 916 | 0.3% |
| Iraqi | 45 | 0.0% |
| Irish | 30,762 | 10.4% |
| Iroquois | 69 | 0.0% |
| Israeli | 12 | 0.0% |
| Italian | 5,422 | 1.8% |
| Jamaican | 193 | 0.1% |
| Japanese | 29 | 0.0% |
| Jordanian | 82 | 0.0% |
| Kenyan | 134 | 0.1% |
| Kiowa | 540 | 0.2% |
| Korean | 1,644 | 0.6% |
| Laotian | 117 | 0.0% |
| Lebanese | 372 | 0.1% |
| Lithuanian | 181 | 0.1% |
| Luxembourger | 19 | 0.0% |
| Macedonian | 16 | 0.0% |
| Malaysian | 305 | 0.1% |
| Maltese | 7 | 0.0% |
| Mexican | 20,575 | 7.0% |
| Mexican American Indian | 655 | 0.2% |
| Mongolian | 28 | 0.0% |
| Moroccan | 156 | 0.1% |
| Native Hawaiian | 305 | 0.1% |
| Navajo | 126 | 0.0% |
| New Zealander | 4 | 0.0% |
| Nicaraguan | 24 | 0.0% |
| Nigerian | 298 | 0.1% |
| Northern European | 558 | 0.2% |
| Norwegian | 1,979 | 0.7% |
| Osage | 236 | 0.1% |
| Ottawa | 11 | 0.0% |
| Pakistani | 747 | 0.3% |
| Panamanian | 124 | 0.0% |
| Paraguayan | 9 | 0.0% |
| Pennsylvania German | 39 | 0.0% |
| Peruvian | 266 | 0.1% |
| Polish | 2,516 | 0.9% |
| Portuguese | 548 | 0.2% |
| Potawatomi | 1,077 | 0.4% |
| Pueblo | 42 | 0.0% |
| Puerto Rican | 1,420 | 0.5% |
| Puget Sound Salish | 96 | 0.0% |
| Romanian | 230 | 0.1% |
| Russian | 838 | 0.3% |
| Salvadoran | 1,228 | 0.4% |
| Samoan | 140 | 0.1% |
| Scandinavian | 915 | 0.3% |
| Scotch-Irish | 4,245 | 1.4% |
| Scottish | 5,715 | 1.9% |
| Seminole | 750 | 0.3% |
| Serbian | 17 | 0.0% |
| Shoshone | 2 | 0.0% |
| Sierra Leonean | 2 | 0.0% |
| Sioux | 261 | 0.1% |
| Slavic | 16 | 0.0% |
| Slovak | 107 | 0.0% |
| Slovene | 121 | 0.0% |
| South African | 19 | 0.0% |
| South American | 1,210 | 0.4% |
| South American Indian | 7 | 0.0% |
| Spaniard | 1,201 | 0.4% |
| Spanish | 545 | 0.2% |
| Spanish American | 2 | 0.0% |
| Sri Lankan | 5,400 | 1.8% |
| Subsaharan African | 1,882 | 0.6% |
| Swedish | 1,786 | 0.6% |
| Swiss | 387 | 0.1% |
| Syrian | 69 | 0.0% |
| Thai | 1,938 | 0.7% |
| Tlingit-Haida | 33 | 0.0% |
| Trinidadian and Tobagonian | 15 | 0.0% |
| Turkish | 159 | 0.1% |
| Ugandan | 22 | 0.0% |
| Ukrainian | 273 | 0.1% |
| Uruguayan | 27 | 0.0% |
| Venezuelan | 222 | 0.1% |
| Vietnamese | 142 | 0.1% |
| Welsh | 2,432 | 0.8% |
| West Indian | 88 | 0.0% |
| Yakama | 22 | 0.0% |
| Yugoslavian | 69 | 0.0% |
| Zimbabwean | 5 | 0.0% | View All 159 Rows |
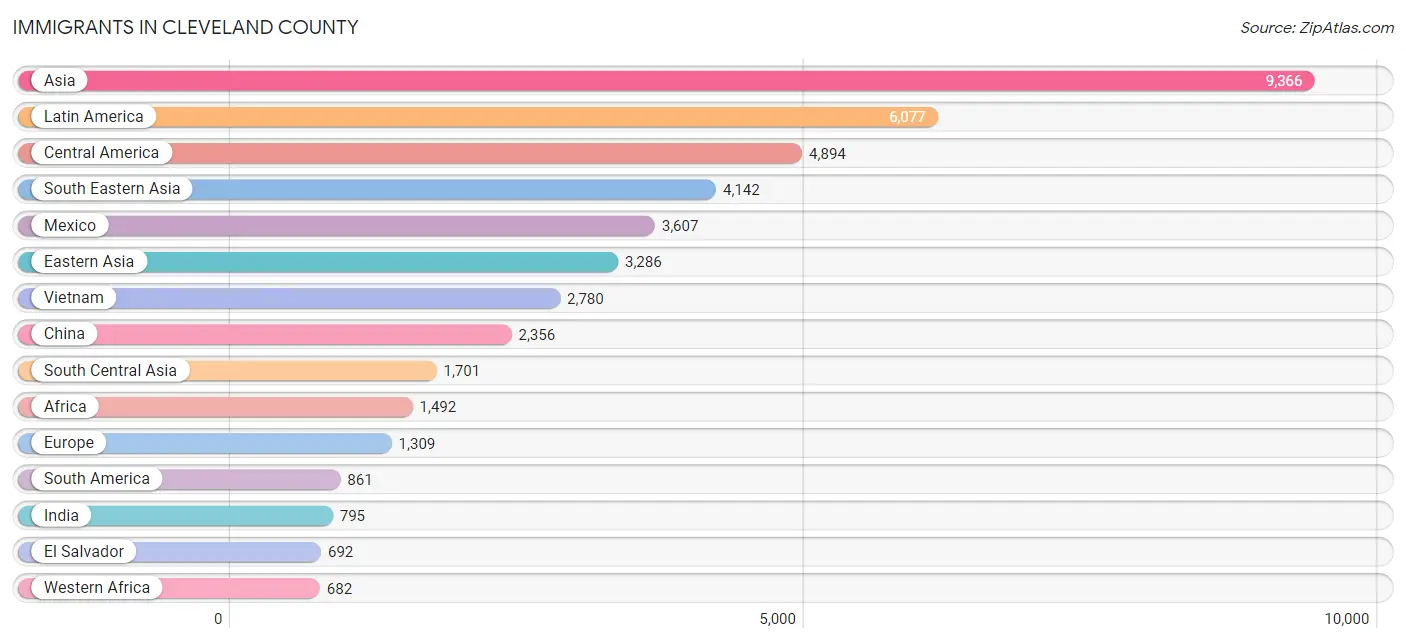
Immigrants in Cleveland County
The most numerous immigrant groups reported in Cleveland County came from Asia (9,366 | 3.2%), Latin America (6,077 | 2.1%), Central America (4,894 | 1.7%), South Eastern Asia (4,142 | 1.4%), and Mexico (3,607 | 1.2%), together accounting for 9.5% of all Cleveland County residents.
| Immigration Origin | # Population | % Population |
| Afghanistan | 66 | 0.0% |
| Africa | 1,492 | 0.5% |
| Albania | 59 | 0.0% |
| Argentina | 148 | 0.1% |
| Asia | 9,366 | 3.2% |
| Australia | 31 | 0.0% |
| Bahamas | 70 | 0.0% |
| Bangladesh | 257 | 0.1% |
| Belize | 15 | 0.0% |
| Bolivia | 36 | 0.0% |
| Bosnia and Herzegovina | 47 | 0.0% |
| Brazil | 34 | 0.0% |
| Cambodia | 46 | 0.0% |
| Cameroon | 60 | 0.0% |
| Canada | 445 | 0.2% |
| Caribbean | 322 | 0.1% |
| Central America | 4,894 | 1.7% |
| Chile | 23 | 0.0% |
| China | 2,356 | 0.8% |
| Colombia | 254 | 0.1% |
| Congo | 39 | 0.0% |
| Costa Rica | 10 | 0.0% |
| Cuba | 83 | 0.0% |
| Czechoslovakia | 11 | 0.0% |
| Dominican Republic | 7 | 0.0% |
| Eastern Africa | 390 | 0.1% |
| Eastern Asia | 3,286 | 1.1% |
| Eastern Europe | 354 | 0.1% |
| Ecuador | 90 | 0.0% |
| Egypt | 11 | 0.0% |
| El Salvador | 692 | 0.2% |
| England | 183 | 0.1% |
| Ethiopia | 81 | 0.0% |
| Europe | 1,309 | 0.4% |
| France | 15 | 0.0% |
| Germany | 429 | 0.2% |
| Ghana | 272 | 0.1% |
| Guatemala | 256 | 0.1% |
| Haiti | 36 | 0.0% |
| Honduras | 186 | 0.1% |
| Hong Kong | 84 | 0.0% |
| Hungary | 25 | 0.0% |
| India | 795 | 0.3% |
| Indonesia | 80 | 0.0% |
| Iran | 295 | 0.1% |
| Iraq | 53 | 0.0% |
| Ireland | 13 | 0.0% |
| Israel | 11 | 0.0% |
| Italy | 3 | 0.0% |
| Jamaica | 97 | 0.0% |
| Japan | 275 | 0.1% |
| Jordan | 54 | 0.0% |
| Kenya | 208 | 0.1% |
| Korea | 655 | 0.2% |
| Laos | 237 | 0.1% |
| Latin America | 6,077 | 2.1% |
| Lebanon | 38 | 0.0% |
| Lithuania | 6 | 0.0% |
| Malaysia | 155 | 0.1% |
| Mexico | 3,607 | 1.2% |
| Middle Africa | 141 | 0.1% |
| Morocco | 74 | 0.0% |
| Nepal | 83 | 0.0% |
| Netherlands | 58 | 0.0% |
| Nicaragua | 16 | 0.0% |
| Nigeria | 267 | 0.1% |
| Northern Africa | 169 | 0.1% |
| Northern Europe | 390 | 0.1% |
| Norway | 12 | 0.0% |
| Oceania | 88 | 0.0% |
| Pakistan | 112 | 0.0% |
| Panama | 112 | 0.0% |
| Peru | 114 | 0.0% |
| Philippines | 505 | 0.2% |
| Poland | 34 | 0.0% |
| Romania | 11 | 0.0% |
| Russia | 49 | 0.0% |
| Scotland | 29 | 0.0% |
| Sierra Leone | 104 | 0.0% |
| Singapore | 6 | 0.0% |
| South Africa | 34 | 0.0% |
| South America | 861 | 0.3% |
| South Central Asia | 1,701 | 0.6% |
| South Eastern Asia | 4,142 | 1.4% |
| Southern Europe | 52 | 0.0% |
| Spain | 49 | 0.0% |
| Sri Lanka | 27 | 0.0% |
| Sudan | 34 | 0.0% |
| Taiwan | 27 | 0.0% |
| Thailand | 333 | 0.1% |
| Trinidad and Tobago | 29 | 0.0% |
| Turkey | 42 | 0.0% |
| Uganda | 10 | 0.0% |
| Ukraine | 20 | 0.0% |
| Uzbekistan | 54 | 0.0% |
| Venezuela | 153 | 0.1% |
| Vietnam | 2,780 | 0.9% |
| Western Africa | 682 | 0.2% |
| Western Asia | 219 | 0.1% |
| Western Europe | 513 | 0.2% |
| Zaire | 42 | 0.0% |
| Zimbabwe | 64 | 0.0% | View All 102 Rows |
Sex and Age in Cleveland County
Sex and Age in Cleveland County
The most populous age groups in Cleveland County are 20 to 24 Years (17,093 | 11.6%) for men and 20 to 24 Years (16,017 | 10.9%) for women.
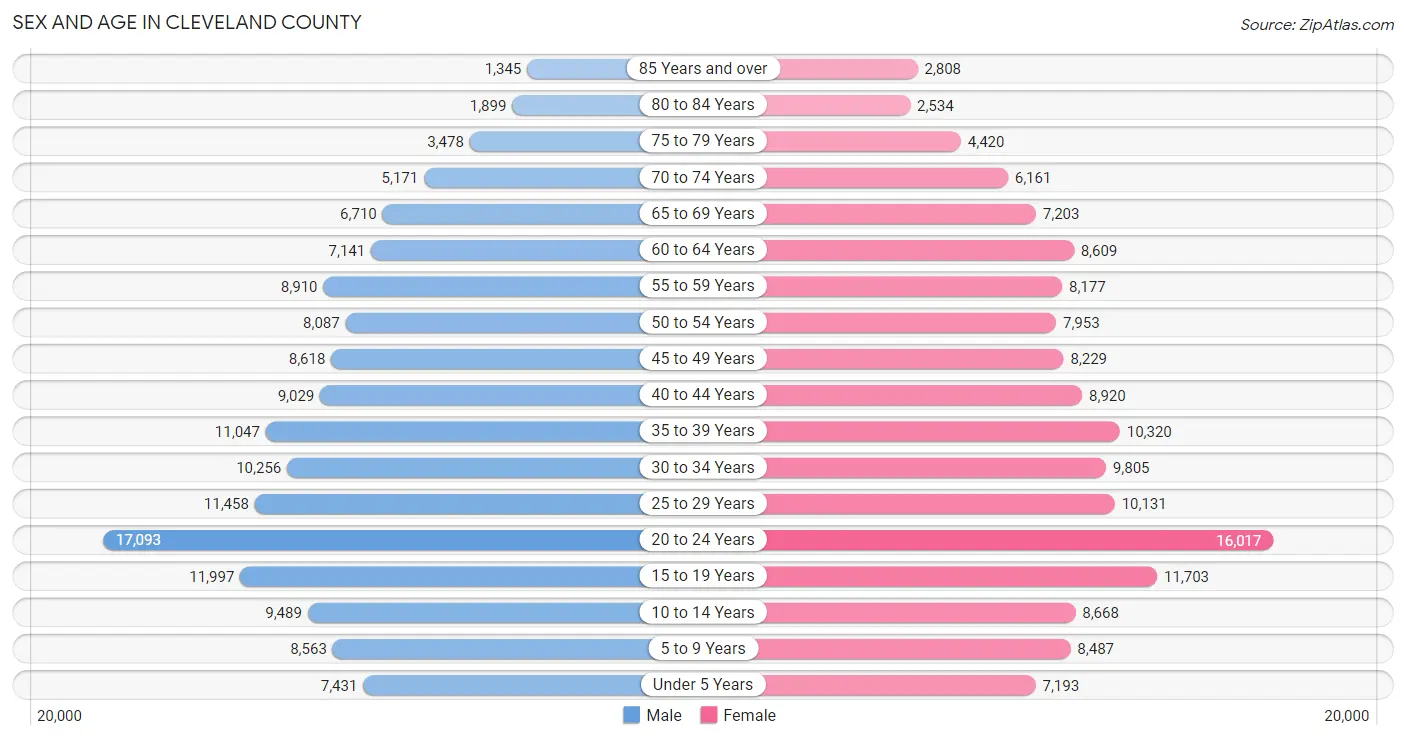
| Age Bracket | Male | Female |
| Under 5 Years | 7,431 (5.0%) | 7,193 (4.9%) |
| 5 to 9 Years | 8,563 (5.8%) | 8,487 (5.8%) |
| 10 to 14 Years | 9,489 (6.4%) | 8,668 (5.9%) |
| 15 to 19 Years | 11,997 (8.1%) | 11,703 (7.9%) |
| 20 to 24 Years | 17,093 (11.6%) | 16,017 (10.9%) |
| 25 to 29 Years | 11,458 (7.8%) | 10,131 (6.9%) |
| 30 to 34 Years | 10,256 (6.9%) | 9,805 (6.7%) |
| 35 to 39 Years | 11,047 (7.5%) | 10,320 (7.0%) |
| 40 to 44 Years | 9,029 (6.1%) | 8,920 (6.0%) |
| 45 to 49 Years | 8,618 (5.8%) | 8,229 (5.6%) |
| 50 to 54 Years | 8,087 (5.5%) | 7,953 (5.4%) |
| 55 to 59 Years | 8,910 (6.0%) | 8,177 (5.6%) |
| 60 to 64 Years | 7,141 (4.8%) | 8,609 (5.8%) |
| 65 to 69 Years | 6,710 (4.5%) | 7,203 (4.9%) |
| 70 to 74 Years | 5,171 (3.5%) | 6,161 (4.2%) |
| 75 to 79 Years | 3,478 (2.4%) | 4,420 (3.0%) |
| 80 to 84 Years | 1,899 (1.3%) | 2,534 (1.7%) |
| 85 Years and over | 1,345 (0.9%) | 2,808 (1.9%) |
| Total | 147,722 (100.0%) | 147,338 (100.0%) |
Families and Households in Cleveland County
Median Family Size in Cleveland County
The median family size in Cleveland County is 2.99 persons per family, with married-couple families (54,749 | 75.3%) accounting for the largest median family size of 3.07 persons per family. On the other hand, single male/father families (6,051 | 8.3%) represent the smallest median family size with 2.58 persons per family.
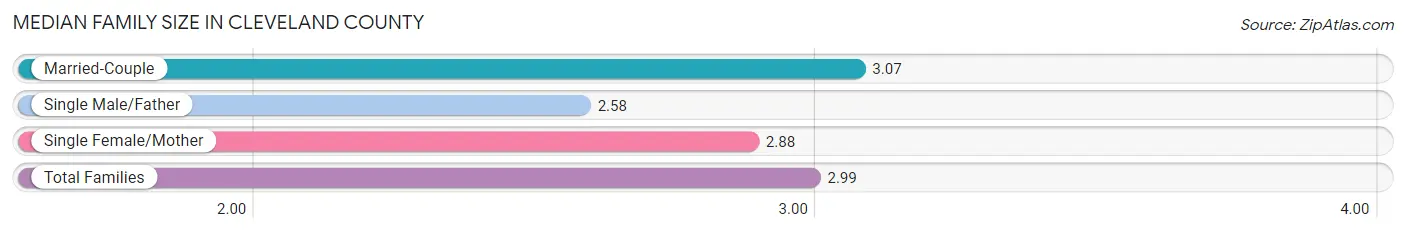
| Family Type | # Families | Family Size |
| Married-Couple | 54,749 (75.3%) | 3.07 |
| Single Male/Father | 6,051 (8.3%) | 2.58 |
| Single Female/Mother | 11,911 (16.4%) | 2.88 |
| Total Families | 72,711 (100.0%) | 2.99 |
Median Household Size in Cleveland County
The median household size in Cleveland County is 2.47 persons per household, with married-couple households (54,749 | 47.9%) accounting for the largest median household size of 3.11 persons per household. non-family households (41,659 | 36.4%) represent the smallest median household size with 1.39 persons per household.
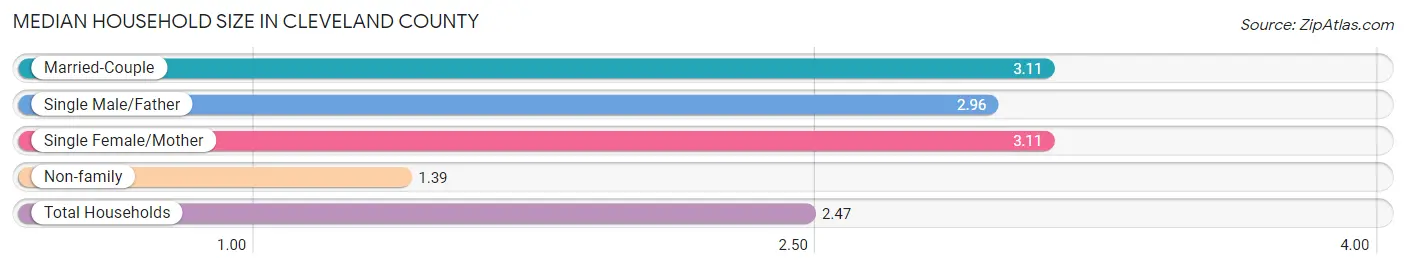
| Household Type | # Households | Household Size |
| Married-Couple | 54,749 (47.9%) | 3.11 |
| Single Male/Father | 6,051 (5.3%) | 2.96 |
| Single Female/Mother | 11,911 (10.4%) | 3.11 |
| Non-family | 41,659 (36.4%) | 1.39 |
| Total Households | 114,370 (100.0%) | 2.47 |
Household Size by Marriage Status in Cleveland County
Out of a total of 114,370 households in Cleveland County, 72,711 (63.6%) are family households, while 41,659 (36.4%) are nonfamily households. The most numerous type of family households are 2-person households, comprising 31,087, and the most common type of nonfamily households are 1-person households, comprising 31,765.
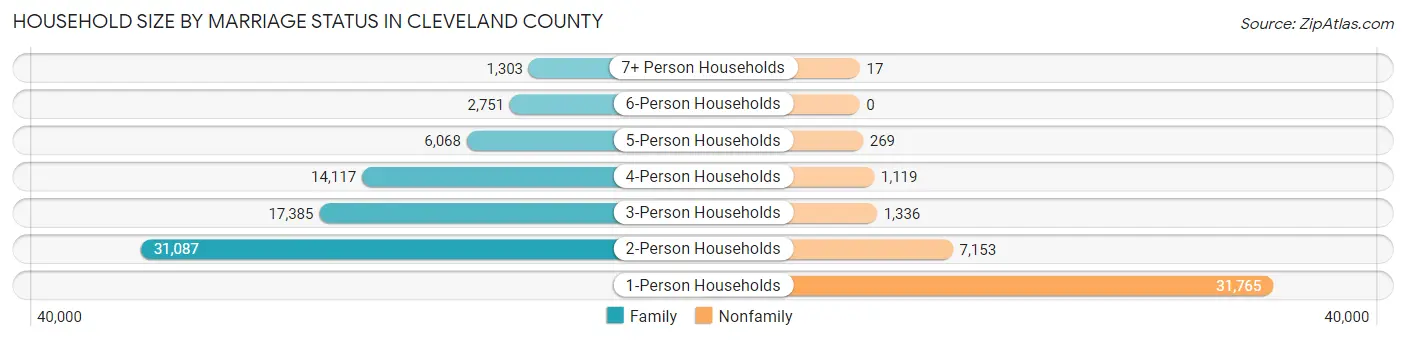
| Household Size | Family Households | Nonfamily Households |
| 1-Person Households | - | 31,765 (27.8%) |
| 2-Person Households | 31,087 (27.2%) | 7,153 (6.2%) |
| 3-Person Households | 17,385 (15.2%) | 1,336 (1.2%) |
| 4-Person Households | 14,117 (12.3%) | 1,119 (1.0%) |
| 5-Person Households | 6,068 (5.3%) | 269 (0.2%) |
| 6-Person Households | 2,751 (2.4%) | 0 (0.0%) |
| 7+ Person Households | 1,303 (1.1%) | 17 (0.0%) |
| Total | 72,711 (63.6%) | 41,659 (36.4%) |
Female Fertility in Cleveland County
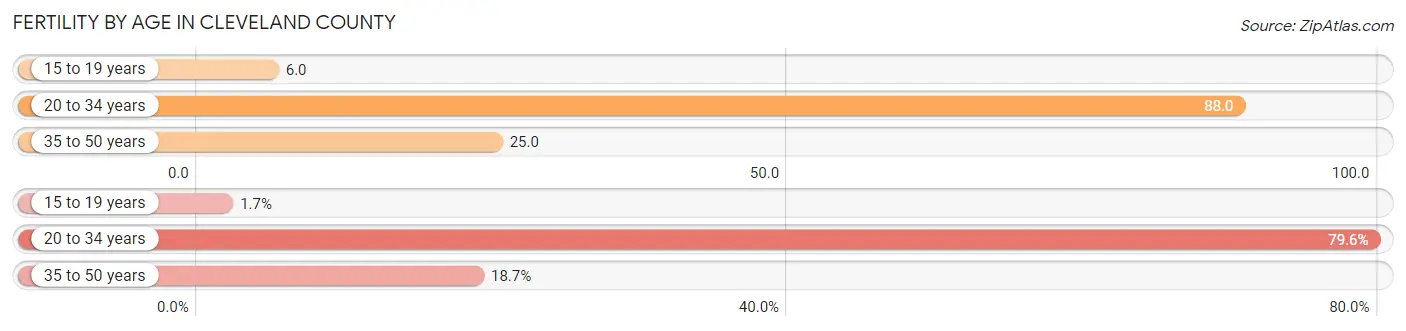
Fertility by Age in Cleveland County
Average fertility rate in Cleveland County is 52.0 births per 1,000 women. Women in the age bracket of 20 to 34 years have the highest fertility rate with 88.0 births per 1,000 women. Women in the age bracket of 20 to 34 years acount for 79.6% of all women with births.
| Age Bracket | Women with Births | Births / 1,000 Women |
| 15 to 19 years | 68 (1.7%) | 6.0 |
| 20 to 34 years | 3,156 (79.6%) | 88.0 |
| 35 to 50 years | 743 (18.7%) | 25.0 |
| Total | 3,967 (100.0%) | 52.0 |
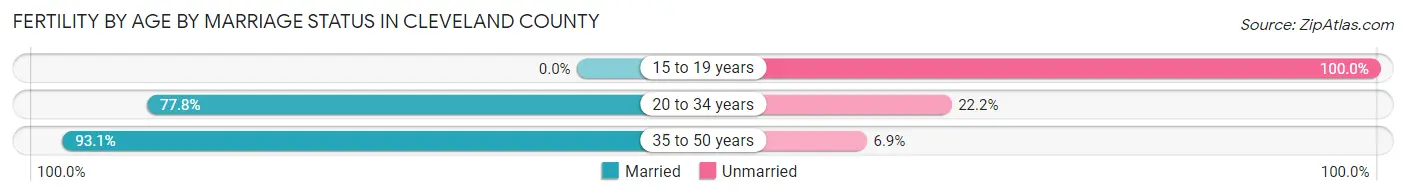
Fertility by Age by Marriage Status in Cleveland County
79.4% of women with births (3,967) in Cleveland County are married. The highest percentage of unmarried women with births falls into 15 to 19 years age bracket with 100.0% of them unmarried at the time of birth, while the lowest percentage of unmarried women with births belong to 35 to 50 years age bracket with 6.9% of them unmarried.
| Age Bracket | Married | Unmarried |
| 15 to 19 years | 0 (0.0%) | 68 (100.0%) |
| 20 to 34 years | 2,455 (77.8%) | 701 (22.2%) |
| 35 to 50 years | 692 (93.1%) | 51 (6.9%) |
| Total | 3,150 (79.4%) | 817 (20.6%) |
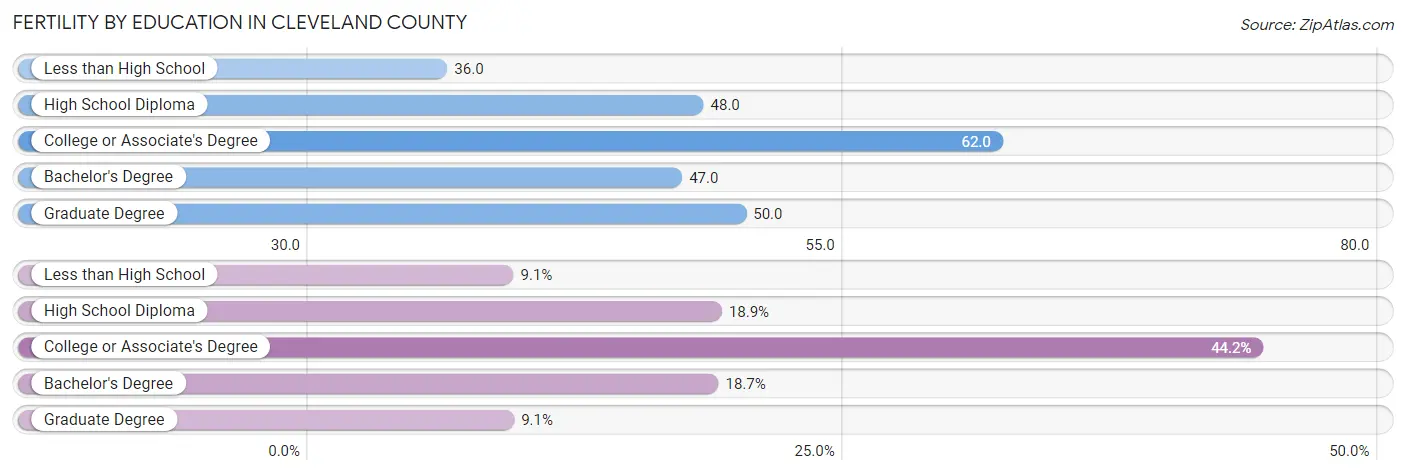
Fertility by Education in Cleveland County
Average fertility rate in Cleveland County is 52.0 births per 1,000 women. Women with the education attainment of college or associate's degree have the highest fertility rate of 62.0 births per 1,000 women, while women with the education attainment of less than high school have the lowest fertility at 36.0 births per 1,000 women. Women with the education attainment of college or associate's degree represent 44.2% of all women with births.
| Educational Attainment | Women with Births | Births / 1,000 Women |
| Less than High School | 361 (9.1%) | 36.0 |
| High School Diploma | 748 (18.9%) | 48.0 |
| College or Associate's Degree | 1,754 (44.2%) | 62.0 |
| Bachelor's Degree | 742 (18.7%) | 47.0 |
| Graduate Degree | 362 (9.1%) | 50.0 |
| Total | 3,967 (100.0%) | 52.0 |
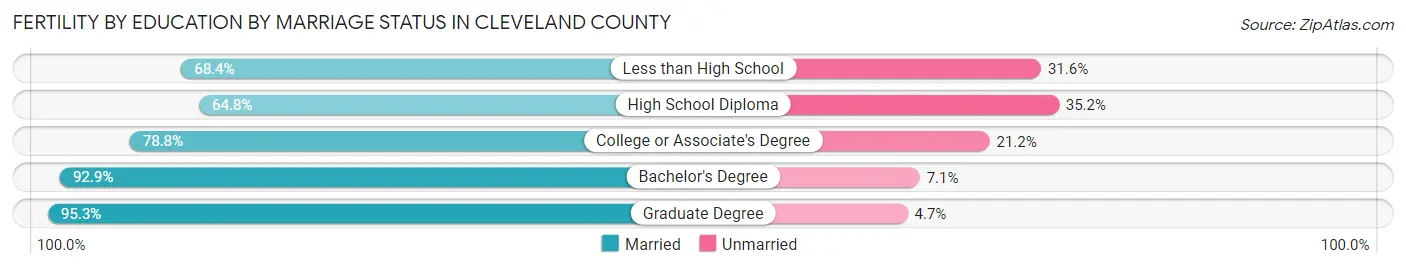
Fertility by Education by Marriage Status in Cleveland County
20.6% of women with births in Cleveland County are unmarried. Women with the educational attainment of graduate degree are most likely to be married with 95.3% of them married at childbirth, while women with the educational attainment of high school diploma are least likely to be married with 35.2% of them unmarried at childbirth.
| Educational Attainment | Married | Unmarried |
| Less than High School | 247 (68.4%) | 114 (31.6%) |
| High School Diploma | 485 (64.8%) | 263 (35.2%) |
| College or Associate's Degree | 1,382 (78.8%) | 372 (21.2%) |
| Bachelor's Degree | 689 (92.9%) | 53 (7.1%) |
| Graduate Degree | 345 (95.3%) | 17 (4.7%) |
| Total | 3,150 (79.4%) | 817 (20.6%) |
Income in Cleveland County
Income Overview in Cleveland County
Per Capita Income in Cleveland County is $36,913, while median incomes of families and households are $91,818 and $71,757 respectively.
| Characteristic | Number | Measure |
| Per Capita Income | 295,060 | $36,913 |
| Median Family Income | 72,711 | $91,818 |
| Mean Family Income | 72,711 | $111,507 |
| Median Household Income | 114,370 | $71,757 |
| Mean Household Income | 114,370 | $92,471 |
| Income Deficit | 72,711 | $11,607 |
| Wage / Income Gap (%) | 295,060 | 34.51% |
| Wage / Income Gap ($) | 295,060 | 65.49¢ per $1 |
| Gini / Inequality Index | 295,060 | 0.44 |
Earnings by Sex in Cleveland County
Average Earnings in Cleveland County are $37,870, $46,729 for men and $30,605 for women, a difference of 34.5%.
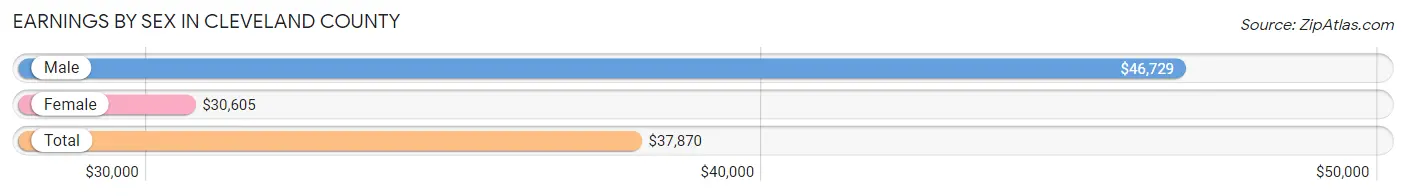
| Sex | Number | Average Earnings |
| Male | 88,977 (53.0%) | $46,729 |
| Female | 78,815 (47.0%) | $30,605 |
| Total | 167,792 (100.0%) | $37,870 |
Earnings by Sex by Income Bracket in Cleveland County
The most common earnings brackets in Cleveland County are $100,000+ for men (13,867 | 15.6%) and $25,000 to $29,999 for women (5,829 | 7.4%).
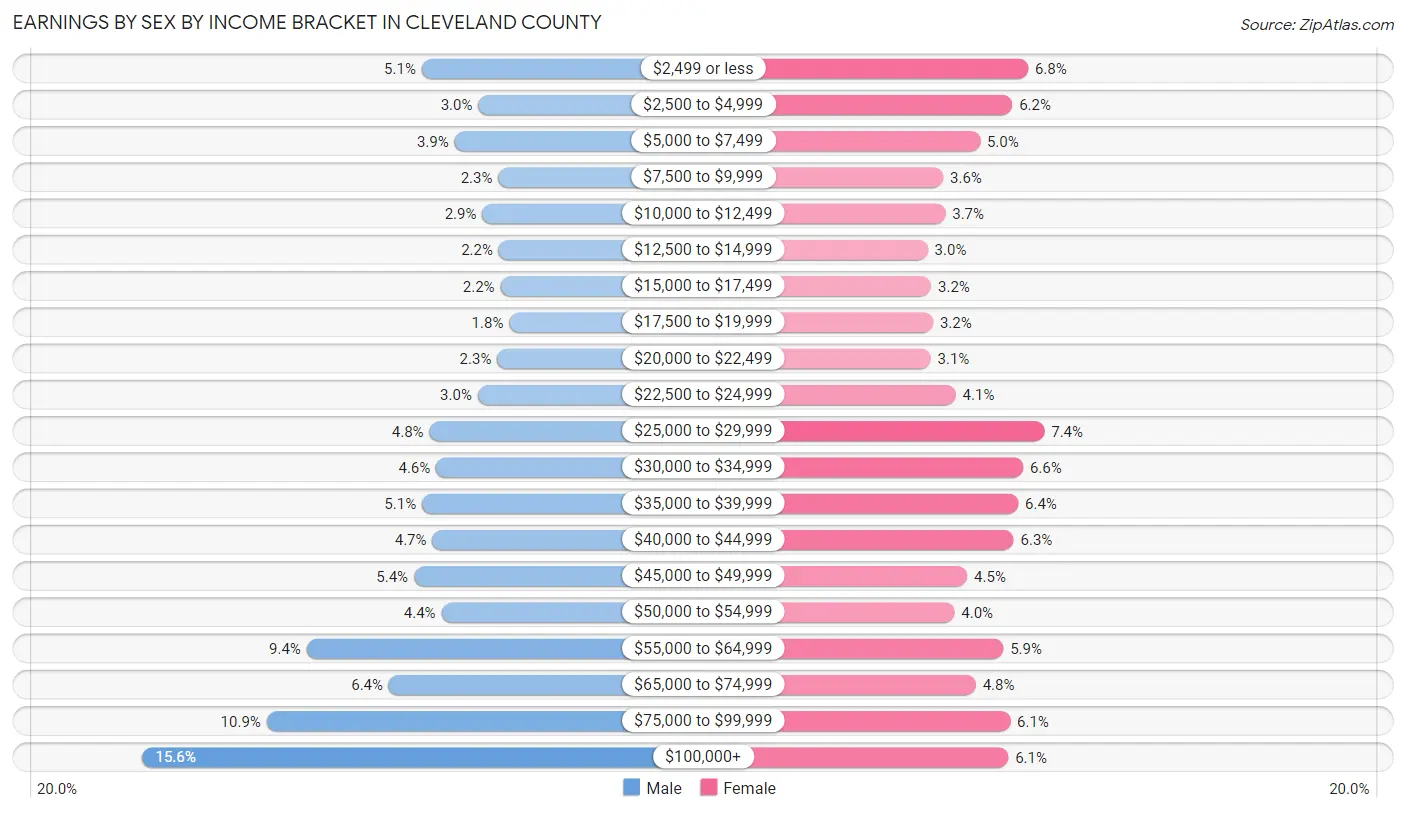
| Income | Male | Female |
| $2,499 or less | 4,554 (5.1%) | 5,349 (6.8%) |
| $2,500 to $4,999 | 2,668 (3.0%) | 4,889 (6.2%) |
| $5,000 to $7,499 | 3,459 (3.9%) | 3,932 (5.0%) |
| $7,500 to $9,999 | 2,001 (2.2%) | 2,848 (3.6%) |
| $10,000 to $12,499 | 2,539 (2.9%) | 2,909 (3.7%) |
| $12,500 to $14,999 | 1,981 (2.2%) | 2,389 (3.0%) |
| $15,000 to $17,499 | 1,934 (2.2%) | 2,493 (3.2%) |
| $17,500 to $19,999 | 1,641 (1.8%) | 2,548 (3.2%) |
| $20,000 to $22,499 | 2,039 (2.3%) | 2,476 (3.1%) |
| $22,500 to $24,999 | 2,684 (3.0%) | 3,214 (4.1%) |
| $25,000 to $29,999 | 4,298 (4.8%) | 5,829 (7.4%) |
| $30,000 to $34,999 | 4,073 (4.6%) | 5,205 (6.6%) |
| $35,000 to $39,999 | 4,551 (5.1%) | 5,062 (6.4%) |
| $40,000 to $44,999 | 4,201 (4.7%) | 4,926 (6.2%) |
| $45,000 to $49,999 | 4,816 (5.4%) | 3,557 (4.5%) |
| $50,000 to $54,999 | 3,899 (4.4%) | 3,178 (4.0%) |
| $55,000 to $64,999 | 8,392 (9.4%) | 4,615 (5.9%) |
| $65,000 to $74,999 | 5,653 (6.4%) | 3,803 (4.8%) |
| $75,000 to $99,999 | 9,727 (10.9%) | 4,824 (6.1%) |
| $100,000+ | 13,867 (15.6%) | 4,769 (6.0%) |
| Total | 88,977 (100.0%) | 78,815 (100.0%) |
Earnings by Sex by Educational Attainment in Cleveland County
Average earnings in Cleveland County are $56,947 for men and $38,791 for women, a difference of 31.9%. Men with an educational attainment of graduate degree enjoy the highest average annual earnings of $87,200, while those with less than high school education earn the least with $40,499. Women with an educational attainment of graduate degree earn the most with the average annual earnings of $59,794, while those with less than high school education have the smallest earnings of $23,027.
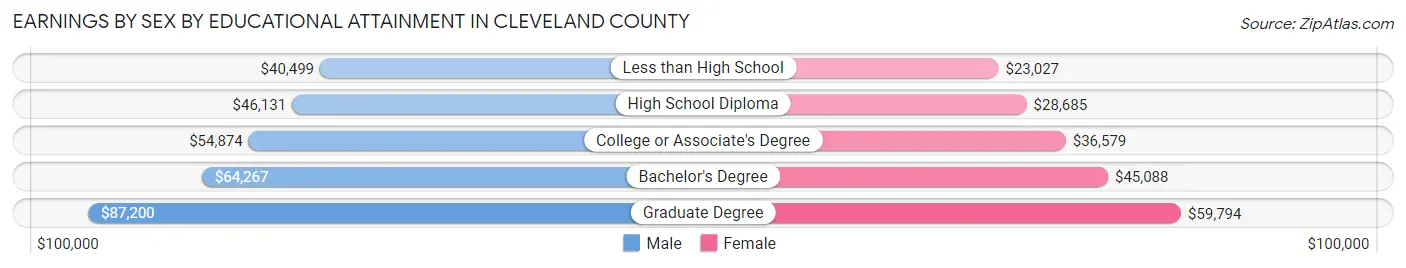
| Educational Attainment | Male Income | Female Income |
| Less than High School | $40,499 | $23,027 |
| High School Diploma | $46,131 | $28,685 |
| College or Associate's Degree | $54,874 | $36,579 |
| Bachelor's Degree | $64,267 | $45,088 |
| Graduate Degree | $87,200 | $59,794 |
| Total | $56,947 | $38,791 |
Family Income in Cleveland County
Family Income Brackets in Cleveland County
According to the Cleveland County family income data, there are 17,596 families falling into the $100,000 to $149,999 income range, which is the most common income bracket and makes up 24.2% of all families. Conversely, the $10,000 to $14,999 income bracket is the least frequent group with only 1,018 families (1.4%) belonging to this category.
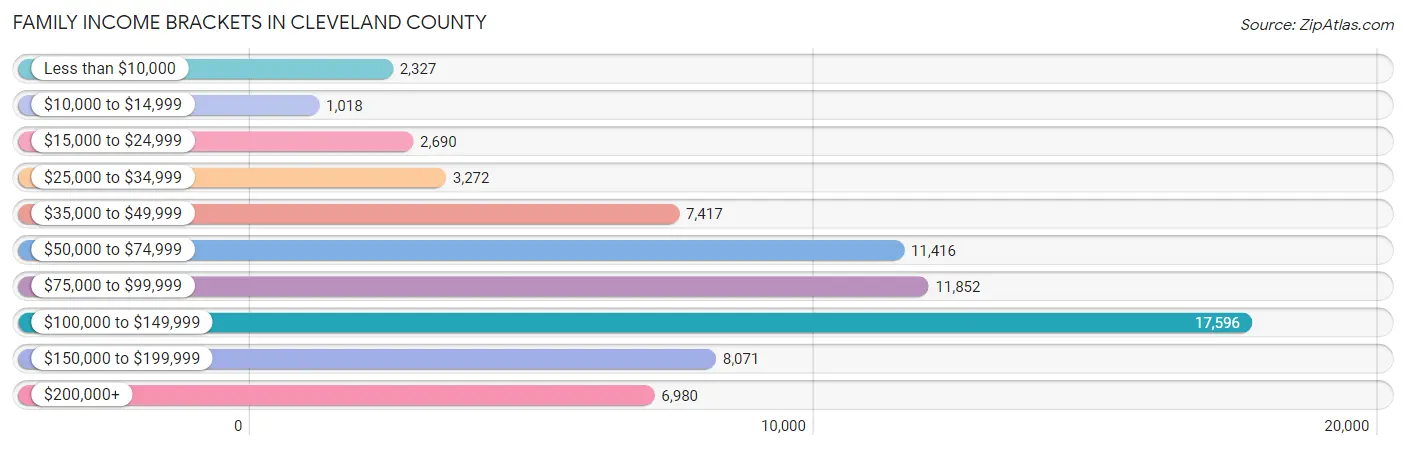
| Income Bracket | # Families | % Families |
| Less than $10,000 | 2,327 | 3.2% |
| $10,000 to $14,999 | 1,018 | 1.4% |
| $15,000 to $24,999 | 2,690 | 3.7% |
| $25,000 to $34,999 | 3,272 | 4.5% |
| $35,000 to $49,999 | 7,417 | 10.2% |
| $50,000 to $74,999 | 11,416 | 15.7% |
| $75,000 to $99,999 | 11,852 | 16.3% |
| $100,000 to $149,999 | 17,596 | 24.2% |
| $150,000 to $199,999 | 8,071 | 11.1% |
| $200,000+ | 6,980 | 9.6% |
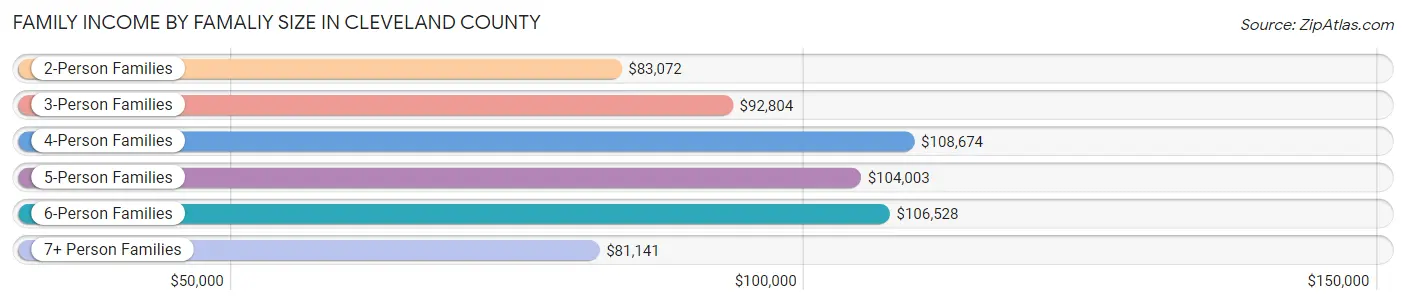
Family Income by Famaliy Size in Cleveland County
4-person families (13,092 | 18.0%) account for the highest median family income in Cleveland County with $108,674 per family, while 2-person families (33,660 | 46.3%) have the highest median income of $41,536 per family member.
| Income Bracket | # Families | Median Income |
| 2-Person Families | 33,660 (46.3%) | $83,072 |
| 3-Person Families | 16,739 (23.0%) | $92,804 |
| 4-Person Families | 13,092 (18.0%) | $108,674 |
| 5-Person Families | 5,741 (7.9%) | $104,003 |
| 6-Person Families | 2,381 (3.3%) | $106,528 |
| 7+ Person Families | 1,098 (1.5%) | $81,141 |
| Total | 72,711 (100.0%) | $91,818 |
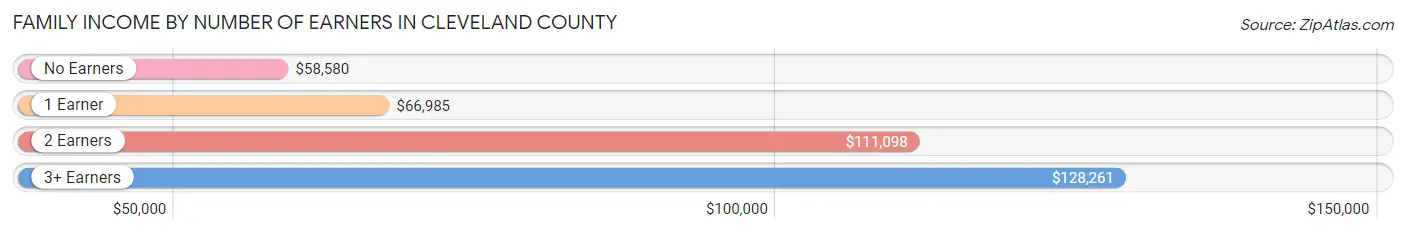
Family Income by Number of Earners in Cleveland County
The median family income in Cleveland County is $91,818, with families comprising 3+ earners (7,250) having the highest median family income of $128,261, while families with no earners (8,702) have the lowest median family income of $58,580, accounting for 10.0% and 12.0% of families, respectively.
| Number of Earners | # Families | Median Income |
| No Earners | 8,702 (12.0%) | $58,580 |
| 1 Earner | 23,826 (32.8%) | $66,985 |
| 2 Earners | 32,933 (45.3%) | $111,098 |
| 3+ Earners | 7,250 (10.0%) | $128,261 |
| Total | 72,711 (100.0%) | $91,818 |
Household Income in Cleveland County
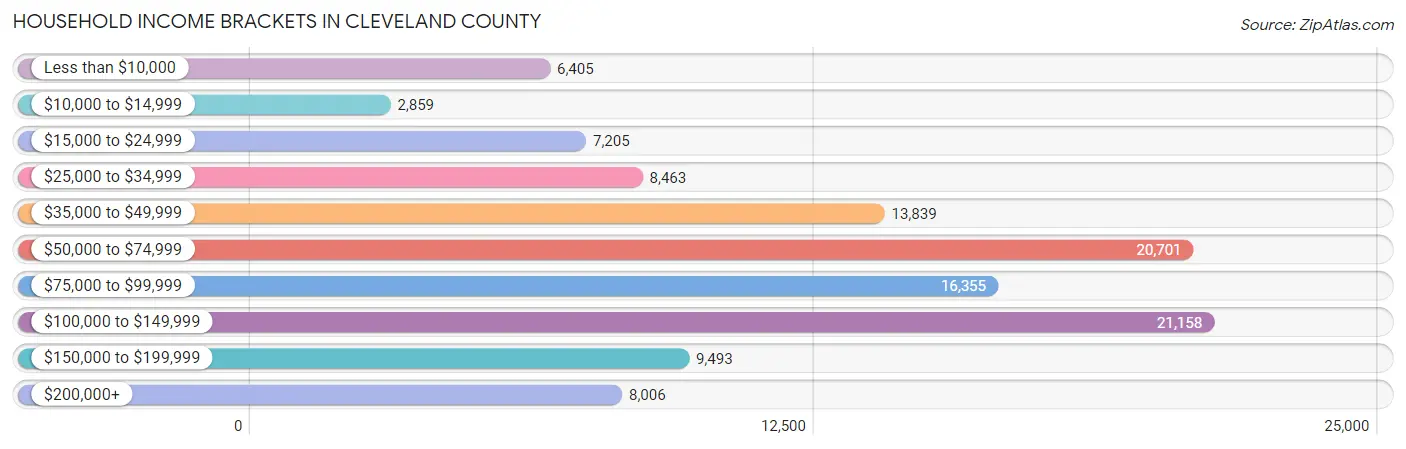
Household Income Brackets in Cleveland County
With 21,158 households falling in the category, the $100,000 to $149,999 income range is the most frequent in Cleveland County, accounting for 18.5% of all households. In contrast, only 2,859 households (2.5%) fall into the $10,000 to $14,999 income bracket, making it the least populous group.
| Income Bracket | # Households | % Households |
| Less than $10,000 | 6,405 | 5.6% |
| $10,000 to $14,999 | 2,859 | 2.5% |
| $15,000 to $24,999 | 7,205 | 6.3% |
| $25,000 to $34,999 | 8,463 | 7.4% |
| $35,000 to $49,999 | 13,839 | 12.1% |
| $50,000 to $74,999 | 20,701 | 18.1% |
| $75,000 to $99,999 | 16,355 | 14.3% |
| $100,000 to $149,999 | 21,158 | 18.5% |
| $150,000 to $199,999 | 9,493 | 8.3% |
| $200,000+ | 8,006 | 7.0% |
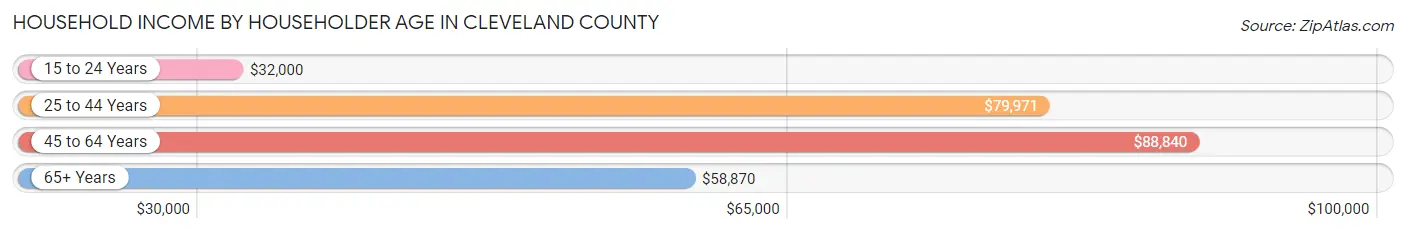
Household Income by Householder Age in Cleveland County
The median household income in Cleveland County is $71,757, with the highest median household income of $88,840 found in the 45 to 64 years age bracket for the primary householder. A total of 36,390 households (31.8%) fall into this category. Meanwhile, the 15 to 24 years age bracket for the primary householder has the lowest median household income of $32,000, with 11,222 households (9.8%) in this group.
| Income Bracket | # Households | Median Income |
| 15 to 24 Years | 11,222 (9.8%) | $32,000 |
| 25 to 44 Years | 40,184 (35.1%) | $79,971 |
| 45 to 64 Years | 36,390 (31.8%) | $88,840 |
| 65+ Years | 26,574 (23.2%) | $58,870 |
| Total | 114,370 (100.0%) | $71,757 |
Poverty in Cleveland County
Income Below Poverty by Sex and Age in Cleveland County
With 12.0% poverty level for males and 13.7% for females among the residents of Cleveland County, 18 to 24 year old males and 18 to 24 year old females are the most vulnerable to poverty, with 6,315 males (32.5%) and 7,005 females (37.4%) in their respective age groups living below the poverty level.
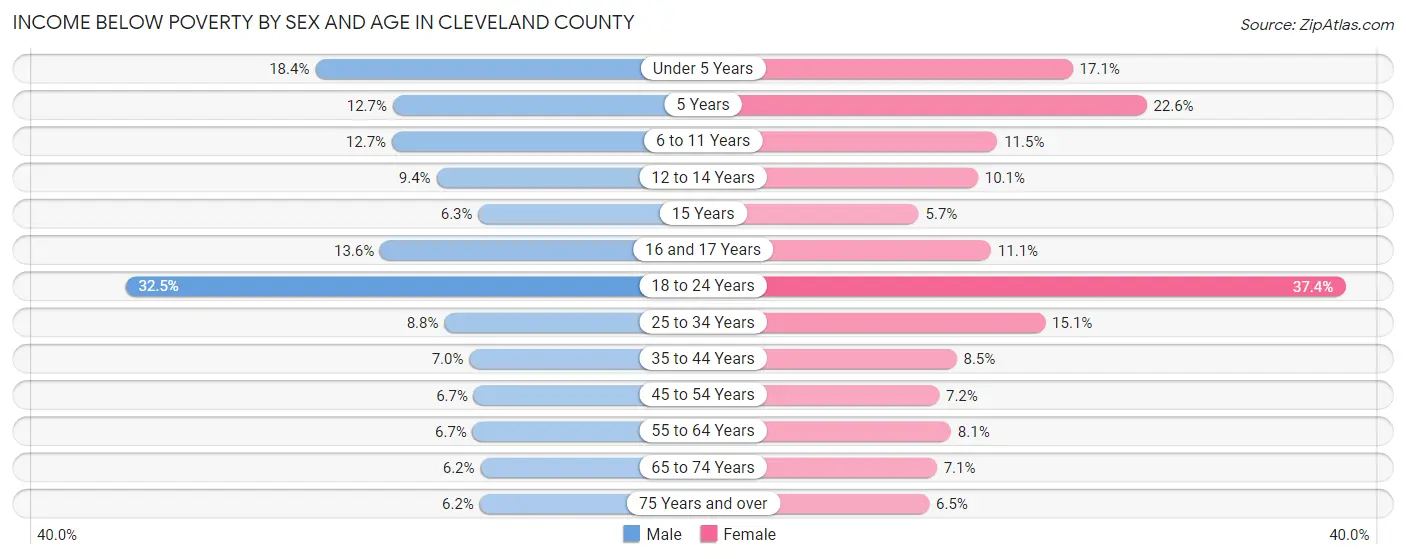
| Age Bracket | Male | Female |
| Under 5 Years | 1,332 (18.4%) | 1,202 (17.1%) |
| 5 Years | 214 (12.7%) | 465 (22.6%) |
| 6 to 11 Years | 1,319 (12.7%) | 1,090 (11.5%) |
| 12 to 14 Years | 524 (9.4%) | 538 (10.1%) |
| 15 Years | 134 (6.3%) | 104 (5.7%) |
| 16 and 17 Years | 504 (13.6%) | 404 (11.1%) |
| 18 to 24 Years | 6,315 (32.5%) | 7,005 (37.4%) |
| 25 to 34 Years | 1,844 (8.8%) | 2,996 (15.1%) |
| 35 to 44 Years | 1,336 (7.0%) | 1,632 (8.5%) |
| 45 to 54 Years | 1,079 (6.7%) | 1,164 (7.2%) |
| 55 to 64 Years | 1,038 (6.7%) | 1,348 (8.1%) |
| 65 to 74 Years | 719 (6.2%) | 929 (7.0%) |
| 75 Years and over | 405 (6.2%) | 612 (6.5%) |
| Total | 16,763 (12.0%) | 19,489 (13.7%) |
Income Above Poverty by Sex and Age in Cleveland County
According to the poverty statistics in Cleveland County, males aged 65 to 74 years and females aged 15 years are the age groups that are most secure financially, with 93.8% of males and 94.3% of females in these age groups living above the poverty line.
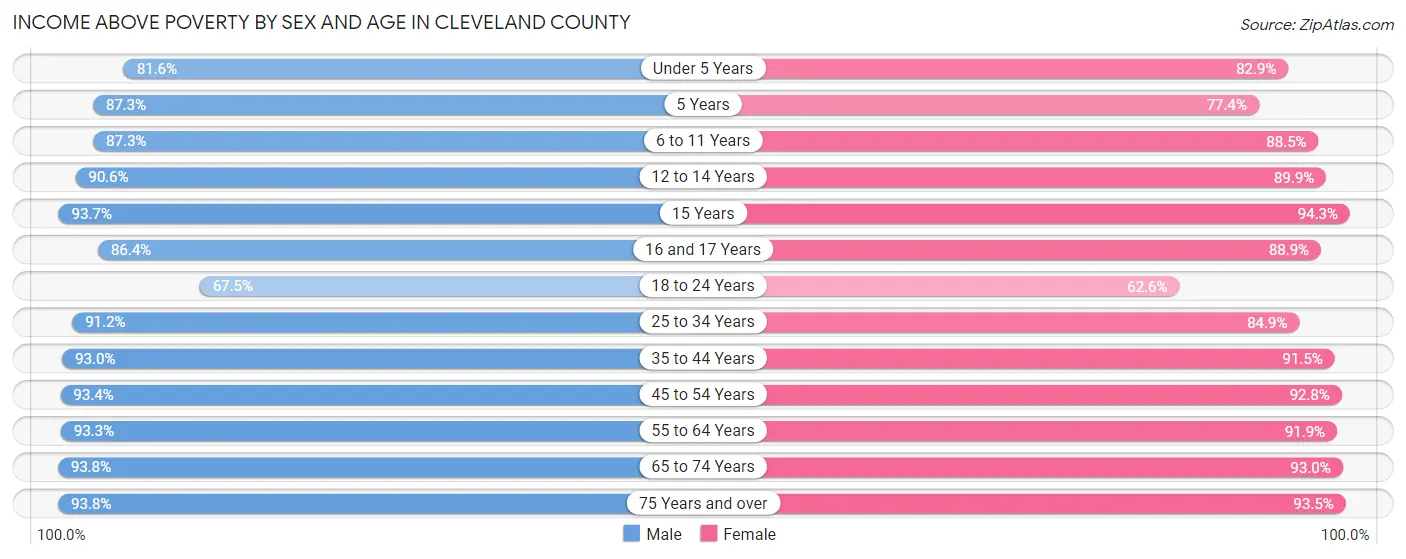
| Age Bracket | Male | Female |
| Under 5 Years | 5,901 (81.6%) | 5,811 (82.9%) |
| 5 Years | 1,476 (87.3%) | 1,591 (77.4%) |
| 6 to 11 Years | 9,039 (87.3%) | 8,355 (88.5%) |
| 12 to 14 Years | 5,040 (90.6%) | 4,791 (89.9%) |
| 15 Years | 1,988 (93.7%) | 1,719 (94.3%) |
| 16 and 17 Years | 3,199 (86.4%) | 3,246 (88.9%) |
| 18 to 24 Years | 13,110 (67.5%) | 11,745 (62.6%) |
| 25 to 34 Years | 19,020 (91.2%) | 16,846 (84.9%) |
| 35 to 44 Years | 17,818 (93.0%) | 17,529 (91.5%) |
| 45 to 54 Years | 15,140 (93.3%) | 14,947 (92.8%) |
| 55 to 64 Years | 14,393 (93.3%) | 15,301 (91.9%) |
| 65 to 74 Years | 10,947 (93.8%) | 12,253 (92.9%) |
| 75 Years and over | 6,121 (93.8%) | 8,835 (93.5%) |
| Total | 123,192 (88.0%) | 122,969 (86.3%) |
Income Below Poverty Among Married-Couple Families in Cleveland County
The poverty statistics for married-couple families in Cleveland County show that 3.5% or 1,923 of the total 54,749 families live below the poverty line. Families with 5 or more children have the highest poverty rate of 24.3%, comprising of 122 families. On the other hand, families with 1 or 2 children have the lowest poverty rate of 2.4%, which includes 439 families.
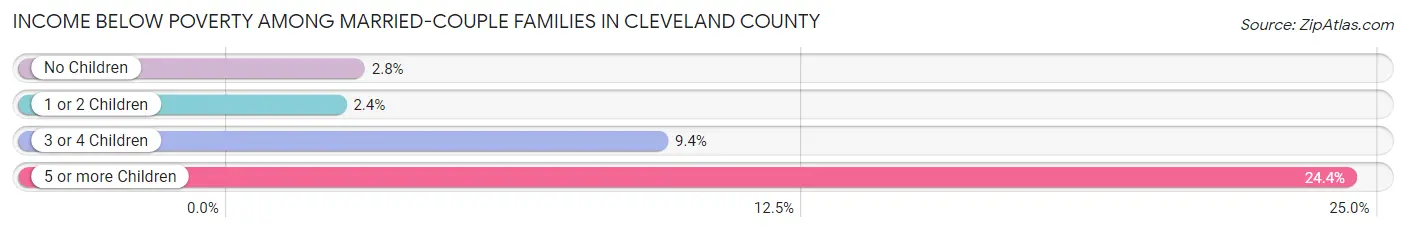
| Children | Above Poverty | Below Poverty |
| No Children | 29,117 (97.2%) | 826 (2.8%) |
| 1 or 2 Children | 18,138 (97.6%) | 439 (2.4%) |
| 3 or 4 Children | 5,192 (90.6%) | 536 (9.4%) |
| 5 or more Children | 379 (75.6%) | 122 (24.3%) |
| Total | 52,826 (96.5%) | 1,923 (3.5%) |
Income Below Poverty Among Single-Parent Households in Cleveland County
According to the poverty data in Cleveland County, 16.3% or 986 single-father households and 23.4% or 2,783 single-mother households are living below the poverty line. Among single-father households, those with 3 or 4 children have the highest poverty rate, with 80 households (23.1%) experiencing poverty. Likewise, among single-mother households, those with 5 or more children have the highest poverty rate, with 57 households (64.8%) falling below the poverty line.
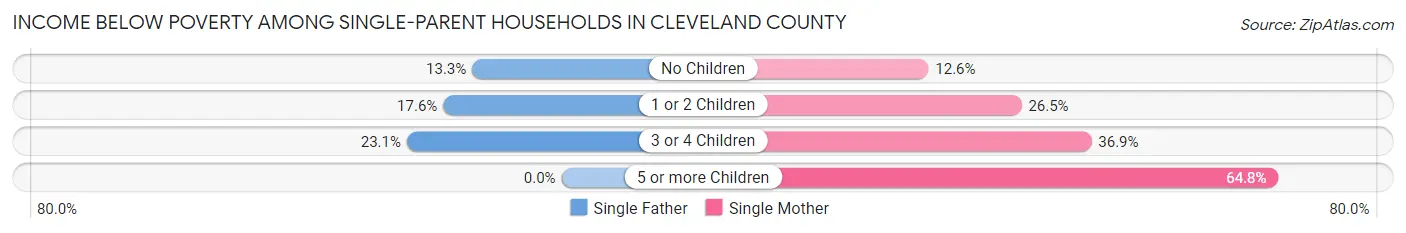
| Children | Single Father | Single Mother |
| No Children | 308 (13.3%) | 491 (12.6%) |
| 1 or 2 Children | 598 (17.6%) | 1,760 (26.5%) |
| 3 or 4 Children | 80 (23.1%) | 475 (36.9%) |
| 5 or more Children | 0 (0.0%) | 57 (64.8%) |
| Total | 986 (16.3%) | 2,783 (23.4%) |
Income Below Poverty Among Married-Couple vs Single-Parent Households in Cleveland County
The poverty data for Cleveland County shows that 1,923 of the married-couple family households (3.5%) and 3,769 of the single-parent households (21.0%) are living below the poverty level. Within the married-couple family households, those with 5 or more children have the highest poverty rate, with 122 households (24.3%) falling below the poverty line. Among the single-parent households, those with 5 or more children have the highest poverty rate, with 57 household (64.8%) living below poverty.
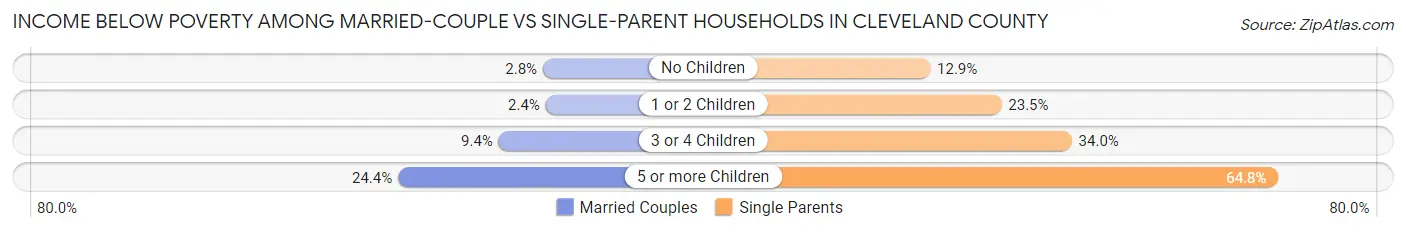
| Children | Married-Couple Families | Single-Parent Households |
| No Children | 826 (2.8%) | 799 (12.9%) |
| 1 or 2 Children | 439 (2.4%) | 2,358 (23.5%) |
| 3 or 4 Children | 536 (9.4%) | 555 (34.0%) |
| 5 or more Children | 122 (24.3%) | 57 (64.8%) |
| Total | 1,923 (3.5%) | 3,769 (21.0%) |
Employment Characteristics in Cleveland County
Employment by Class of Employer in Cleveland County
Among the 147,489 employed individuals in Cleveland County, private company employees (89,002 | 60.3%), state government employees (13,214 | 9.0%), and federal government employees (11,175 | 7.6%) make up the most common classes of employment.

| Employer Class | # Employees | % Employees |
| Private Company Employees | 89,002 | 60.3% |
| Self-Employed (Incorporated) | 5,282 | 3.6% |
| Self-Employed (Not Incorporated) | 8,962 | 6.1% |
| Not-for-profit Organizations | 10,947 | 7.4% |
| Local Government Employees | 8,692 | 5.9% |
| State Government Employees | 13,214 | 9.0% |
| Federal Government Employees | 11,175 | 7.6% |
| Unpaid Family Workers | 215 | 0.2% |
| Total | 147,489 | 100.0% |
Employment Status by Age in Cleveland County
According to the labor force statistics for Cleveland County, out of the total population over 16 years of age (241,265), 65.4% or 157,787 individuals are in the labor force, with 4.7% or 7,416 of them unemployed. The age group with the highest labor force participation rate is 35 to 44 years, with 84.3% or 33,143 individuals in the labor force. Within the labor force, the 16 to 19 years age range has the highest percentage of unemployed individuals, with 17.0% or 1,372 of them being unemployed.
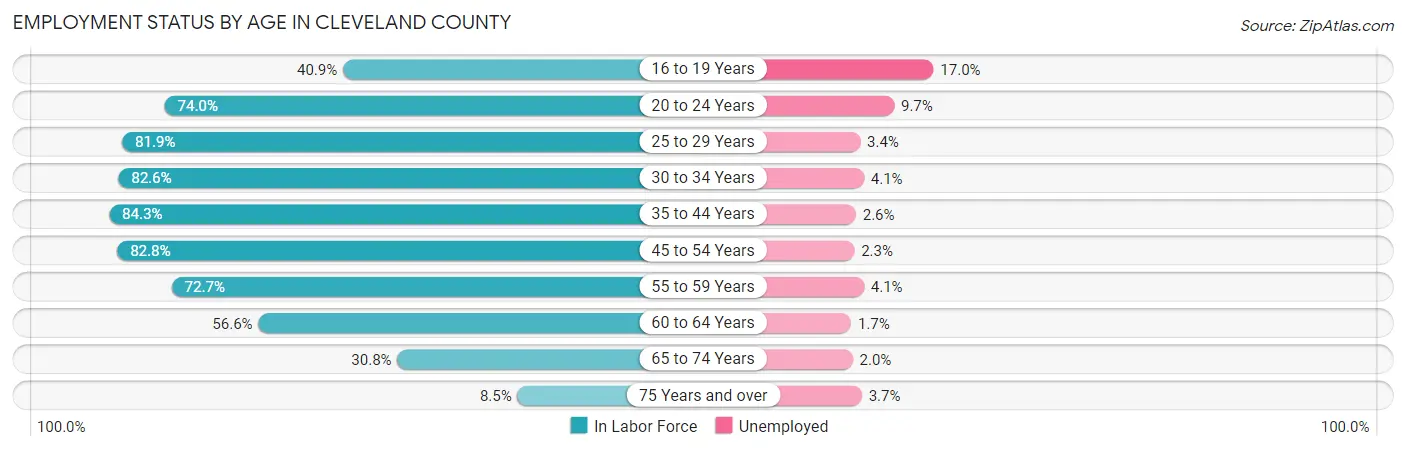
| Age Bracket | In Labor Force | Unemployed |
| 16 to 19 Years | 8,072 (40.9%) | 1,372 (17.0%) |
| 20 to 24 Years | 24,501 (74.0%) | 2,377 (9.7%) |
| 25 to 29 Years | 17,681 (81.9%) | 601 (3.4%) |
| 30 to 34 Years | 16,570 (82.6%) | 679 (4.1%) |
| 35 to 44 Years | 33,143 (84.3%) | 862 (2.6%) |
| 45 to 54 Years | 27,230 (82.8%) | 626 (2.3%) |
| 55 to 59 Years | 12,422 (72.7%) | 509 (4.1%) |
| 60 to 64 Years | 8,914 (56.6%) | 152 (1.7%) |
| 65 to 74 Years | 7,775 (30.8%) | 156 (2.0%) |
| 75 Years and over | 1,401 (8.5%) | 52 (3.7%) |
| Total | 157,787 (65.4%) | 7,416 (4.7%) |
Employment Status by Educational Attainment in Cleveland County
According to labor force statistics for Cleveland County, 79.1% of individuals (116,032) out of the total population between 25 and 64 years of age (146,690) are in the labor force, with 2.9% or 3,365 of them being unemployed. The group with the highest labor force participation rate are those with the educational attainment of bachelor's degree or higher, with 87.2% or 45,463 individuals in the labor force. Within the labor force, individuals with high school diploma education have the highest percentage of unemployment, with 5.1% or 1,308 of them being unemployed.
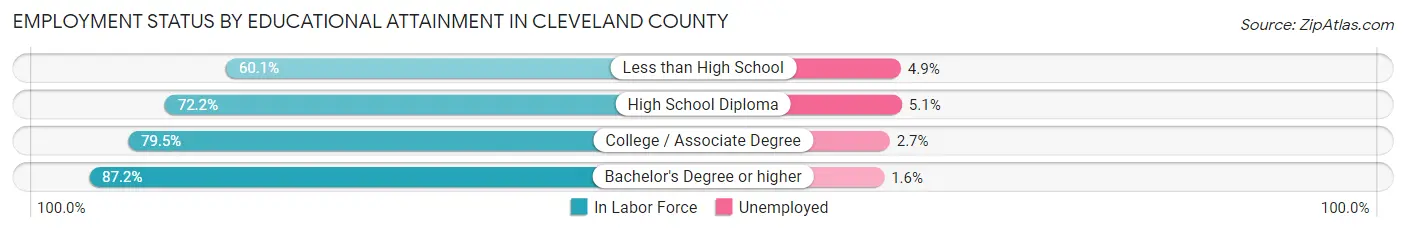
| Educational Attainment | In Labor Force | Unemployed |
| Less than High School | 6,495 (60.1%) | 530 (4.9%) |
| High School Diploma | 25,645 (72.2%) | 1,811 (5.1%) |
| College / Associate Degree | 38,340 (79.5%) | 1,302 (2.7%) |
| Bachelor's Degree or higher | 45,463 (87.2%) | 834 (1.6%) |
| Total | 116,032 (79.1%) | 4,254 (2.9%) |
Employment Occupations by Sex in Cleveland County
Management, Business, Science and Arts Occupations
The most common Management, Business, Science and Arts occupations in Cleveland County are Community & Social Service (18,943 | 12.8%), Management (15,269 | 10.3%), Education Instruction & Library (11,658 | 7.9%), Computers, Engineering & Science (11,614 | 7.8%), and Health Diagnosing & Treating (9,965 | 6.7%).

Management, Business, Science and Arts Occupations by Sex
Within the Management, Business, Science and Arts occupations in Cleveland County, the most male-oriented occupations are Architecture & Engineering (84.4%), Computers & Mathematics (77.2%), and Computers, Engineering & Science (76.9%), while the most female-oriented occupations are Health Technologists (73.1%), Health Diagnosing & Treating (72.2%), and Education Instruction & Library (67.2%).
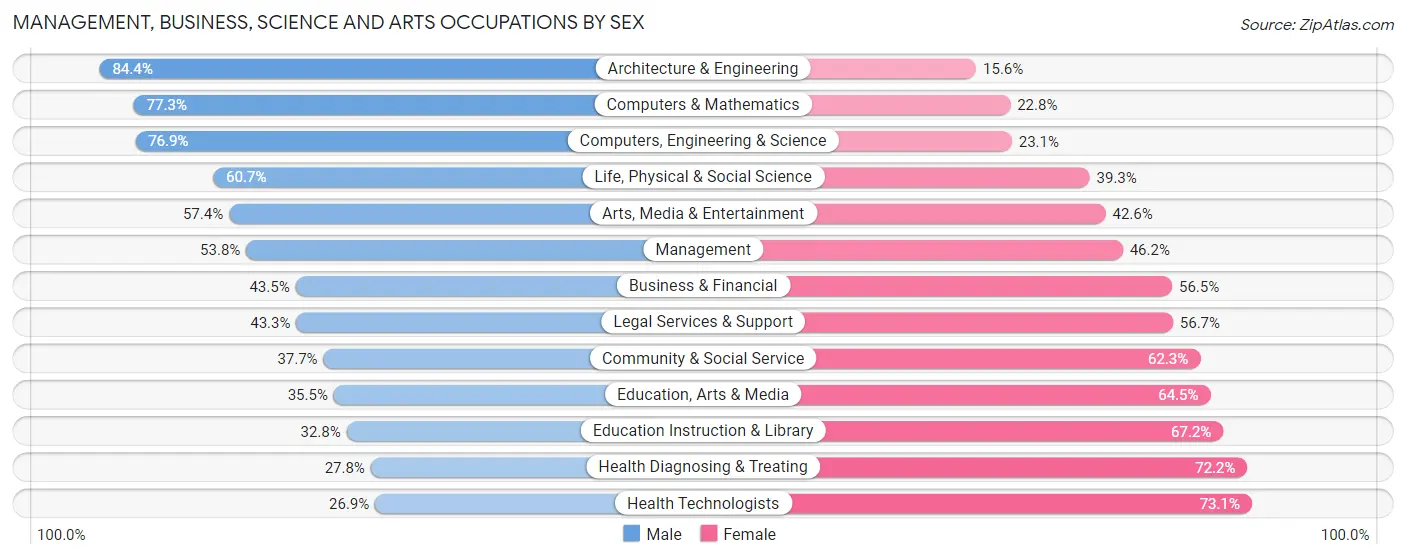
| Occupation | Male | Female |
| Management | 8,212 (53.8%) | 7,057 (46.2%) |
| Business & Financial | 3,241 (43.5%) | 4,212 (56.5%) |
| Computers, Engineering & Science | 8,934 (76.9%) | 2,680 (23.1%) |
| Computers & Mathematics | 4,711 (77.2%) | 1,387 (22.8%) |
| Architecture & Engineering | 3,119 (84.4%) | 578 (15.6%) |
| Life, Physical & Social Science | 1,104 (60.7%) | 715 (39.3%) |
| Community & Social Service | 7,134 (37.7%) | 11,809 (62.3%) |
| Education, Arts & Media | 880 (35.5%) | 1,598 (64.5%) |
| Legal Services & Support | 1,027 (43.3%) | 1,343 (56.7%) |
| Education Instruction & Library | 3,829 (32.8%) | 7,829 (67.2%) |
| Arts, Media & Entertainment | 1,398 (57.4%) | 1,039 (42.6%) |
| Health Diagnosing & Treating | 2,770 (27.8%) | 7,195 (72.2%) |
| Health Technologists | 1,740 (26.9%) | 4,733 (73.1%) |
| Total (Category) | 30,291 (47.9%) | 32,953 (52.1%) |
| Total (Overall) | 78,359 (52.9%) | 69,769 (47.1%) |
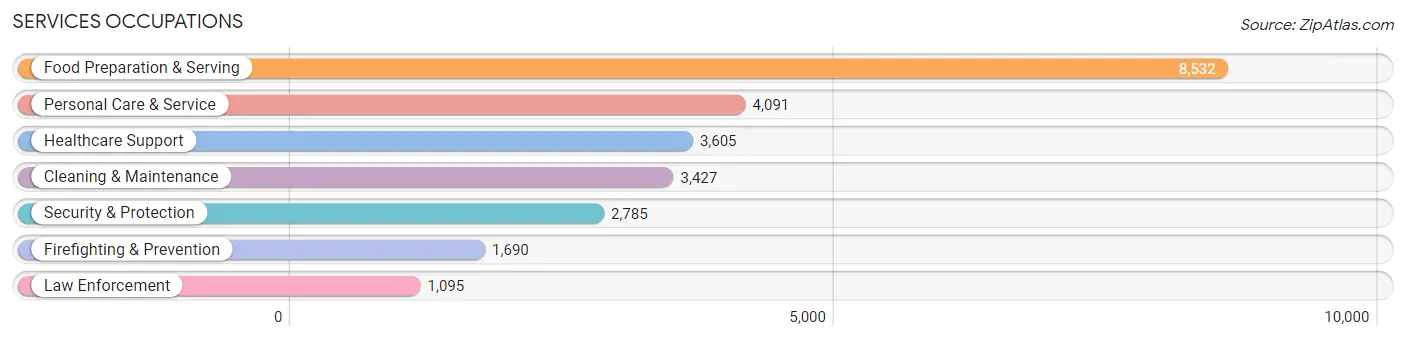
Services Occupations
The most common Services occupations in Cleveland County are Food Preparation & Serving (8,532 | 5.8%), Personal Care & Service (4,091 | 2.8%), Healthcare Support (3,605 | 2.4%), Cleaning & Maintenance (3,427 | 2.3%), and Security & Protection (2,785 | 1.9%).
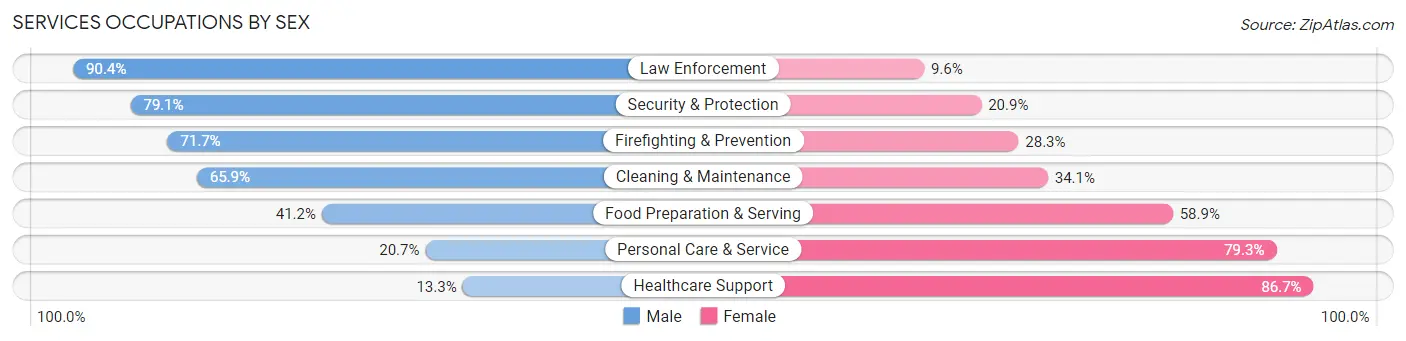
Services Occupations by Sex
Within the Services occupations in Cleveland County, the most male-oriented occupations are Law Enforcement (90.4%), Security & Protection (79.1%), and Firefighting & Prevention (71.7%), while the most female-oriented occupations are Healthcare Support (86.7%), Personal Care & Service (79.3%), and Food Preparation & Serving (58.9%).
| Occupation | Male | Female |
| Healthcare Support | 479 (13.3%) | 3,126 (86.7%) |
| Security & Protection | 2,202 (79.1%) | 583 (20.9%) |
| Firefighting & Prevention | 1,212 (71.7%) | 478 (28.3%) |
| Law Enforcement | 990 (90.4%) | 105 (9.6%) |
| Food Preparation & Serving | 3,511 (41.1%) | 5,021 (58.9%) |
| Cleaning & Maintenance | 2,258 (65.9%) | 1,169 (34.1%) |
| Personal Care & Service | 845 (20.7%) | 3,246 (79.3%) |
| Total (Category) | 9,295 (41.4%) | 13,145 (58.6%) |
| Total (Overall) | 78,359 (52.9%) | 69,769 (47.1%) |
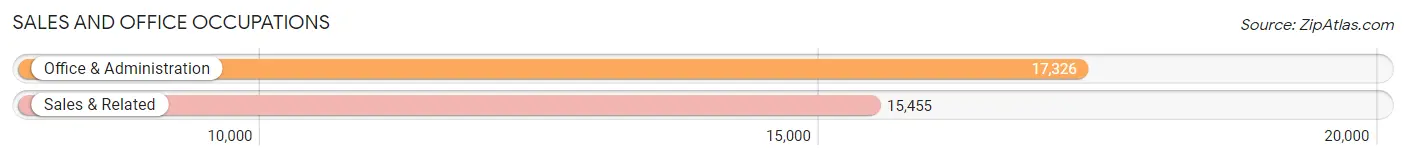
Sales and Office Occupations
The most common Sales and Office occupations in Cleveland County are Office & Administration (17,326 | 11.7%), and Sales & Related (15,455 | 10.4%).
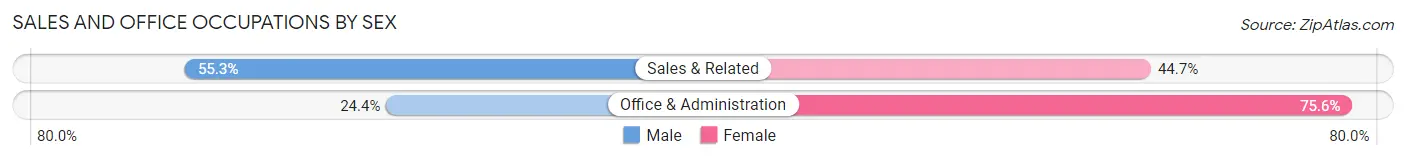
Sales and Office Occupations by Sex
| Occupation | Male | Female |
| Sales & Related | 8,550 (55.3%) | 6,905 (44.7%) |
| Office & Administration | 4,220 (24.4%) | 13,106 (75.6%) |
| Total (Category) | 12,770 (39.0%) | 20,011 (61.0%) |
| Total (Overall) | 78,359 (52.9%) | 69,769 (47.1%) |
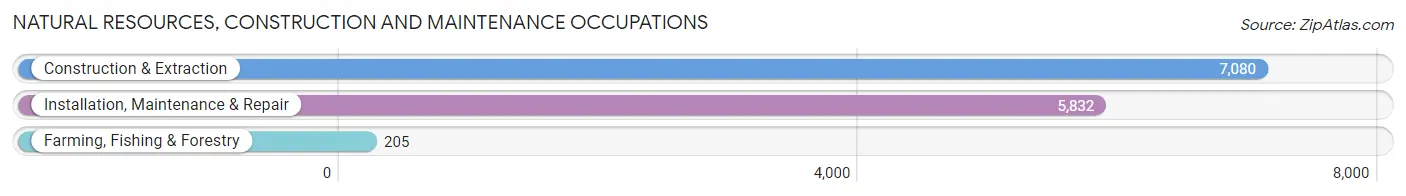
Natural Resources, Construction and Maintenance Occupations
The most common Natural Resources, Construction and Maintenance occupations in Cleveland County are Construction & Extraction (7,080 | 4.8%), Installation, Maintenance & Repair (5,832 | 3.9%), and Farming, Fishing & Forestry (205 | 0.1%).
Natural Resources, Construction and Maintenance Occupations by Sex
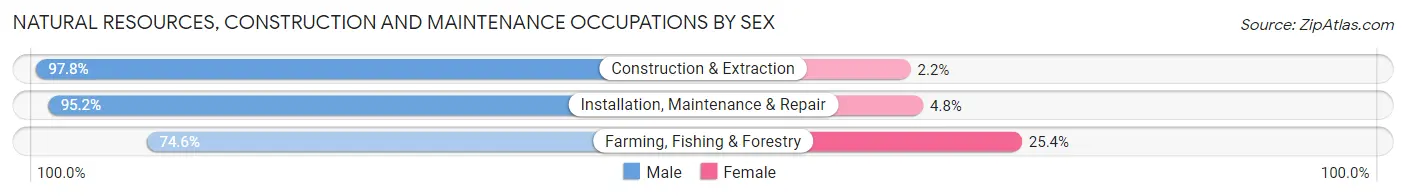
| Occupation | Male | Female |
| Farming, Fishing & Forestry | 153 (74.6%) | 52 (25.4%) |
| Construction & Extraction | 6,922 (97.8%) | 158 (2.2%) |
| Installation, Maintenance & Repair | 5,551 (95.2%) | 281 (4.8%) |
| Total (Category) | 12,626 (96.3%) | 491 (3.7%) |
| Total (Overall) | 78,359 (52.9%) | 69,769 (47.1%) |
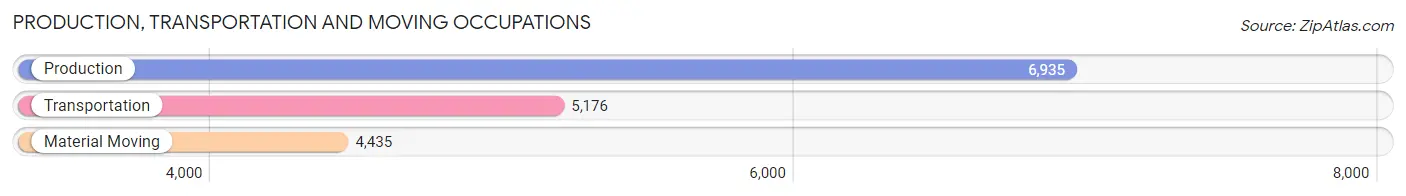
Production, Transportation and Moving Occupations
The most common Production, Transportation and Moving occupations in Cleveland County are Production (6,935 | 4.7%), Transportation (5,176 | 3.5%), and Material Moving (4,435 | 3.0%).
Production, Transportation and Moving Occupations by Sex
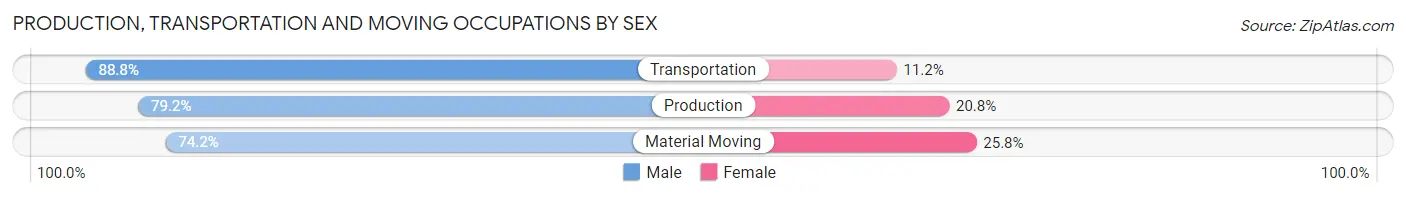
| Occupation | Male | Female |
| Production | 5,491 (79.2%) | 1,444 (20.8%) |
| Transportation | 4,597 (88.8%) | 579 (11.2%) |
| Material Moving | 3,289 (74.2%) | 1,146 (25.8%) |
| Total (Category) | 13,377 (80.8%) | 3,169 (19.2%) |
| Total (Overall) | 78,359 (52.9%) | 69,769 (47.1%) |
Employment Industries by Sex in Cleveland County
Employment Industries in Cleveland County
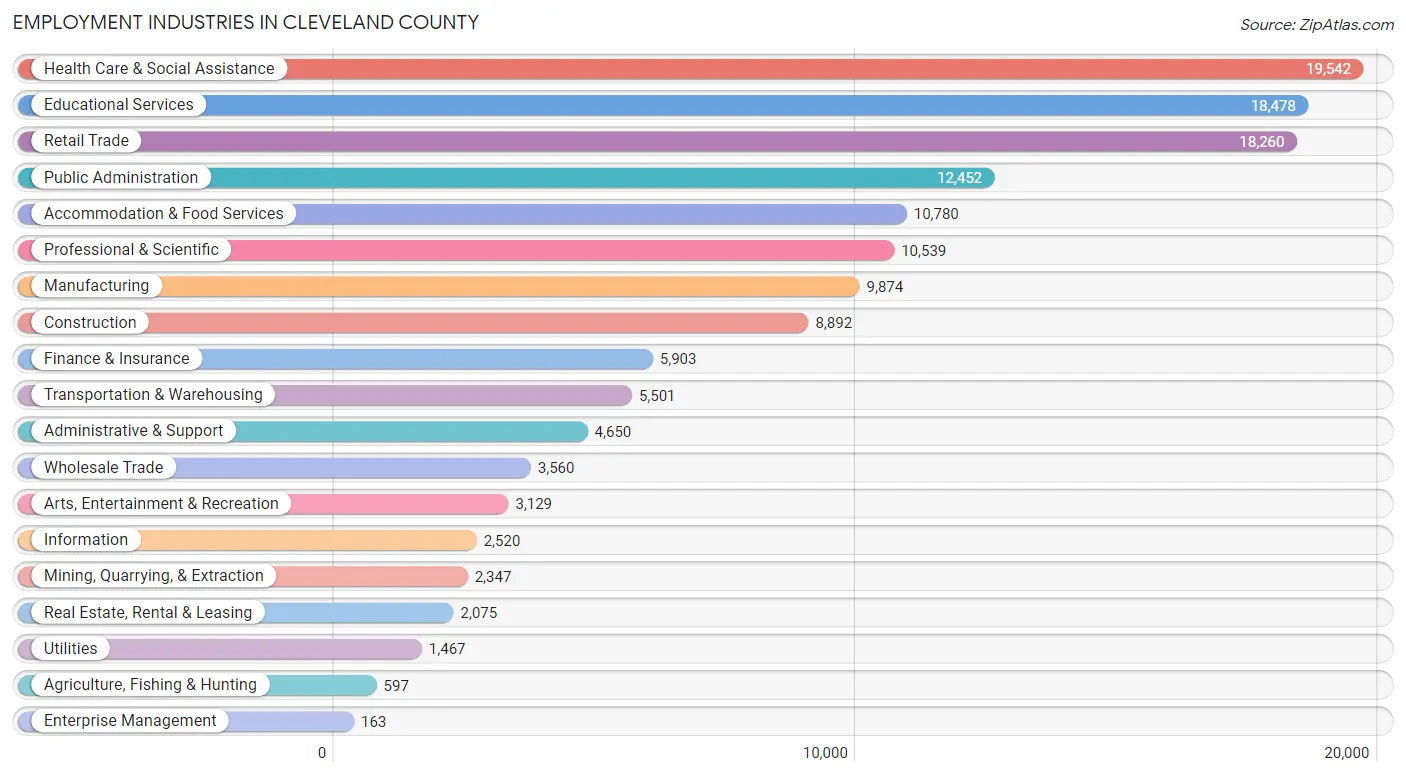
The major employment industries in Cleveland County include Health Care & Social Assistance (19,542 | 13.2%), Educational Services (18,478 | 12.5%), Retail Trade (18,260 | 12.3%), Public Administration (12,452 | 8.4%), and Accommodation & Food Services (10,780 | 7.3%).
Employment Industries by Sex in Cleveland County
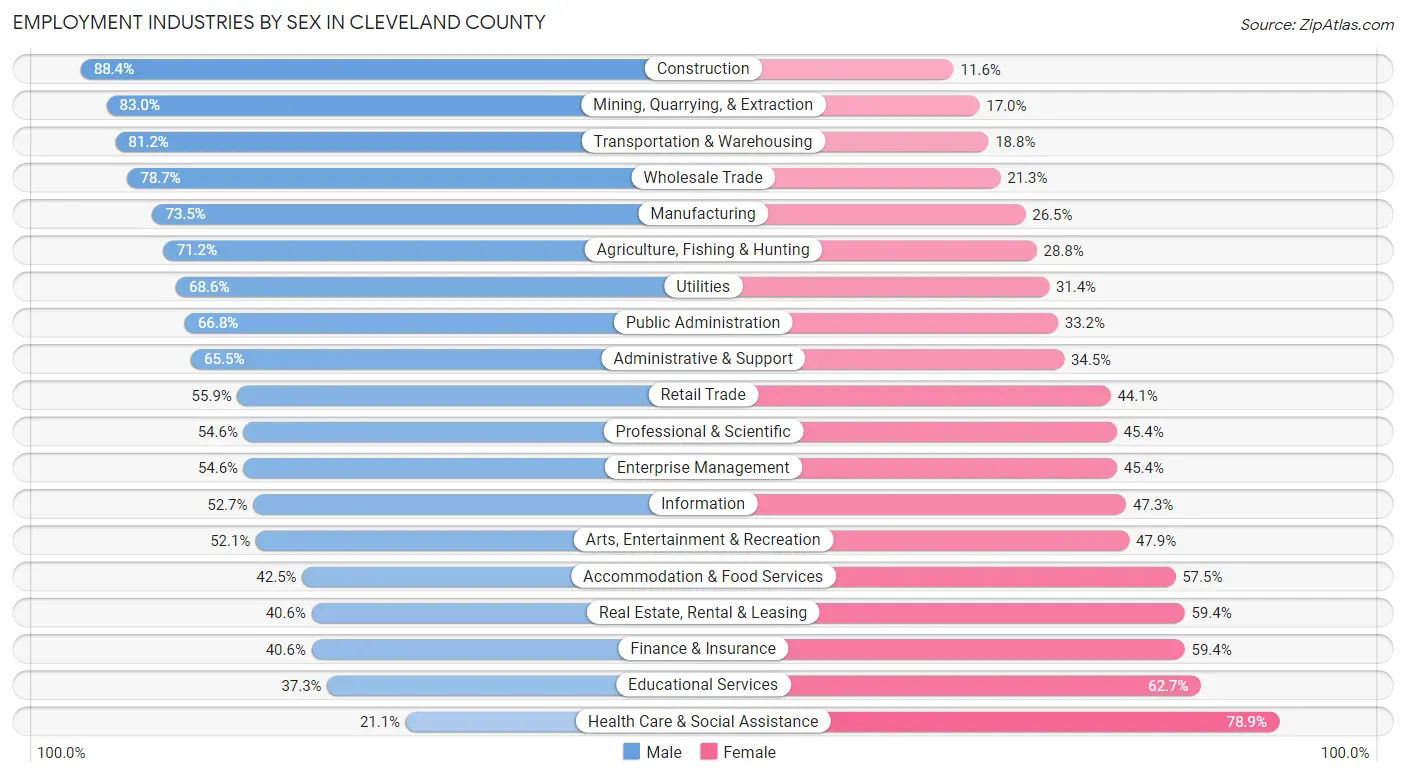
The Cleveland County industries that see more men than women are Construction (88.4%), Mining, Quarrying, & Extraction (83.0%), and Transportation & Warehousing (81.2%), whereas the industries that tend to have a higher number of women are Health Care & Social Assistance (78.9%), Educational Services (62.7%), and Finance & Insurance (59.4%).
| Industry | Male | Female |
| Agriculture, Fishing & Hunting | 425 (71.2%) | 172 (28.8%) |
| Mining, Quarrying, & Extraction | 1,949 (83.0%) | 398 (17.0%) |
| Construction | 7,857 (88.4%) | 1,035 (11.6%) |
| Manufacturing | 7,260 (73.5%) | 2,614 (26.5%) |
| Wholesale Trade | 2,802 (78.7%) | 758 (21.3%) |
| Retail Trade | 10,207 (55.9%) | 8,053 (44.1%) |
| Transportation & Warehousing | 4,467 (81.2%) | 1,034 (18.8%) |
| Utilities | 1,007 (68.6%) | 460 (31.4%) |
| Information | 1,327 (52.7%) | 1,193 (47.3%) |
| Finance & Insurance | 2,395 (40.6%) | 3,508 (59.4%) |
| Real Estate, Rental & Leasing | 842 (40.6%) | 1,233 (59.4%) |
| Professional & Scientific | 5,758 (54.6%) | 4,781 (45.4%) |
| Enterprise Management | 89 (54.6%) | 74 (45.4%) |
| Administrative & Support | 3,047 (65.5%) | 1,603 (34.5%) |
| Educational Services | 6,894 (37.3%) | 11,584 (62.7%) |
| Health Care & Social Assistance | 4,118 (21.1%) | 15,424 (78.9%) |
| Arts, Entertainment & Recreation | 1,629 (52.1%) | 1,500 (47.9%) |
| Accommodation & Food Services | 4,582 (42.5%) | 6,198 (57.5%) |
| Public Administration | 8,319 (66.8%) | 4,133 (33.2%) |
| Total | 78,359 (52.9%) | 69,769 (47.1%) |
Education in Cleveland County
School Enrollment in Cleveland County
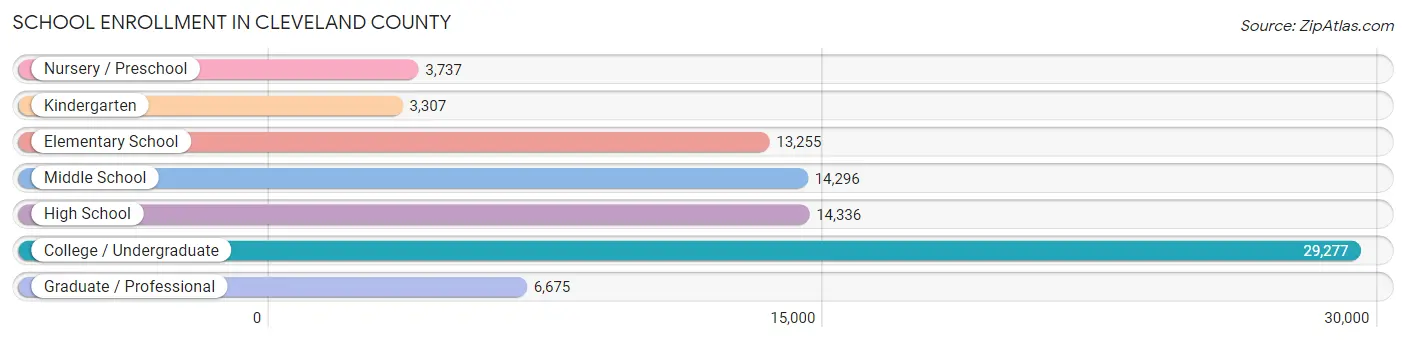
The most common levels of schooling among the 84,883 students in Cleveland County are college / undergraduate (29,277 | 34.5%), high school (14,336 | 16.9%), and middle school (14,296 | 16.8%).
| School Level | # Students | % Students |
| Nursery / Preschool | 3,737 | 4.4% |
| Kindergarten | 3,307 | 3.9% |
| Elementary School | 13,255 | 15.6% |
| Middle School | 14,296 | 16.8% |
| High School | 14,336 | 16.9% |
| College / Undergraduate | 29,277 | 34.5% |
| Graduate / Professional | 6,675 | 7.9% |
| Total | 84,883 | 100.0% |
School Enrollment by Age by Funding Source in Cleveland County
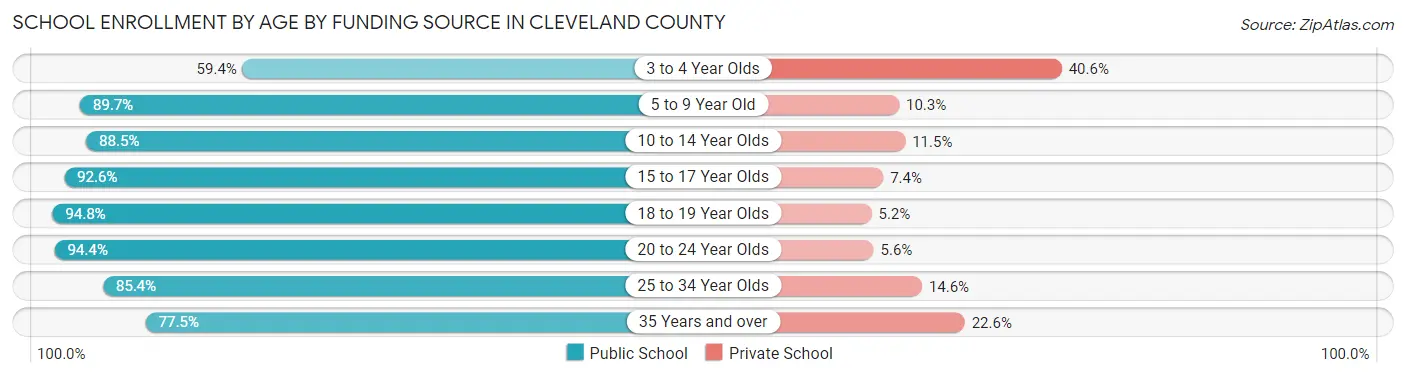
Out of a total of 84,883 students who are enrolled in schools in Cleveland County, 8,743 (10.3%) attend a private institution, while the remaining 76,140 (89.7%) are enrolled in public schools. The age group of 3 to 4 year olds has the highest likelihood of being enrolled in private schools, with 920 (40.6% in the age bracket) enrolled. Conversely, the age group of 18 to 19 year olds has the lowest likelihood of being enrolled in a private school, with 9,832 (94.8% in the age bracket) attending a public institution.
| Age Bracket | Public School | Private School |
| 3 to 4 Year Olds | 1,345 (59.4%) | 920 (40.6%) |
| 5 to 9 Year Old | 14,442 (89.7%) | 1,660 (10.3%) |
| 10 to 14 Year Olds | 15,625 (88.5%) | 2,025 (11.5%) |
| 15 to 17 Year Olds | 10,056 (92.6%) | 800 (7.4%) |
| 18 to 19 Year Olds | 9,832 (94.8%) | 538 (5.2%) |
| 20 to 24 Year Olds | 16,559 (94.4%) | 977 (5.6%) |
| 25 to 34 Year Olds | 4,949 (85.4%) | 845 (14.6%) |
| 35 Years and over | 3,338 (77.4%) | 972 (22.6%) |
| Total | 76,140 (89.7%) | 8,743 (10.3%) |
Educational Attainment by Field of Study in Cleveland County
Business (13,805 | 19.3%), education (9,341 | 13.1%), science & technology (6,846 | 9.6%), engineering (5,022 | 7.0%), and arts & humanities (5,007 | 7.0%) are the most common fields of study among 71,401 individuals in Cleveland County who have obtained a bachelor's degree or higher.
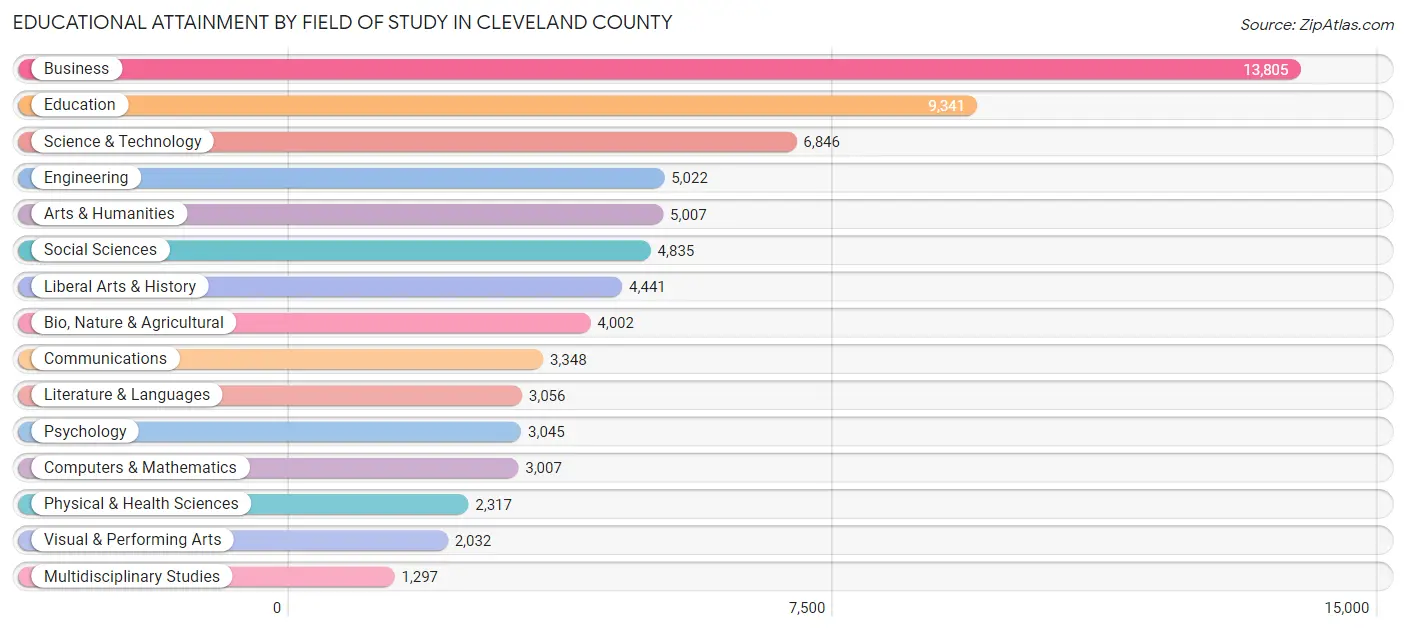
| Field of Study | # Graduates | % Graduates |
| Computers & Mathematics | 3,007 | 4.2% |
| Bio, Nature & Agricultural | 4,002 | 5.6% |
| Physical & Health Sciences | 2,317 | 3.3% |
| Psychology | 3,045 | 4.3% |
| Social Sciences | 4,835 | 6.8% |
| Engineering | 5,022 | 7.0% |
| Multidisciplinary Studies | 1,297 | 1.8% |
| Science & Technology | 6,846 | 9.6% |
| Business | 13,805 | 19.3% |
| Education | 9,341 | 13.1% |
| Literature & Languages | 3,056 | 4.3% |
| Liberal Arts & History | 4,441 | 6.2% |
| Visual & Performing Arts | 2,032 | 2.9% |
| Communications | 3,348 | 4.7% |
| Arts & Humanities | 5,007 | 7.0% |
| Total | 71,401 | 100.0% |
Transportation & Commute in Cleveland County
Vehicle Availability by Sex in Cleveland County
The most prevalent vehicle ownership categories in Cleveland County are males with 2 vehicles (35,462, accounting for 45.4%) and females with 2 vehicles (28,802, making up 52.7%).
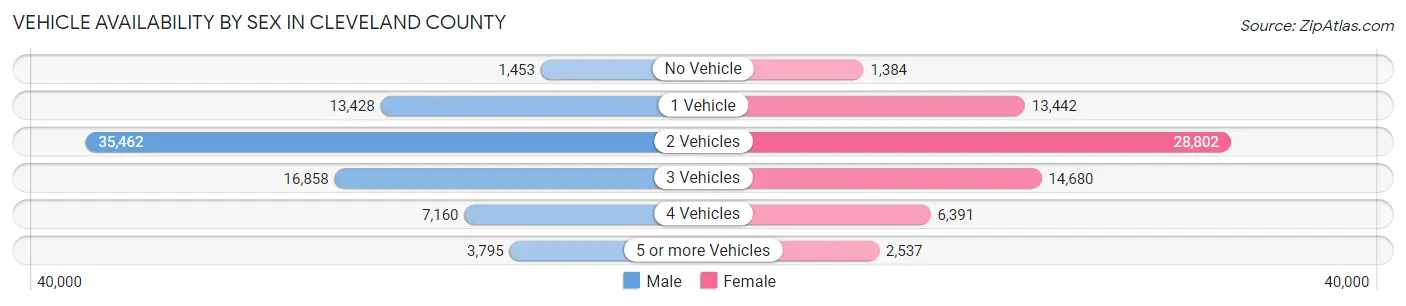
| Vehicles Available | Male | Female |
| No Vehicle | 1,453 (1.9%) | 1,384 (2.1%) |
| 1 Vehicle | 13,428 (17.2%) | 13,442 (20.0%) |
| 2 Vehicles | 35,462 (45.4%) | 28,802 (42.8%) |
| 3 Vehicles | 16,858 (21.6%) | 14,680 (21.8%) |
| 4 Vehicles | 7,160 (9.2%) | 6,391 (9.5%) |
| 5 or more Vehicles | 3,795 (4.9%) | 2,537 (3.8%) |
| Total | 78,156 (100.0%) | 67,236 (100.0%) |
Commute Time in Cleveland County
The most frequently occuring commute durations in Cleveland County are 15 to 19 minutes (24,236 commuters, 18.0%), 30 to 34 minutes (20,260 commuters, 15.1%), and 10 to 14 minutes (19,573 commuters, 14.6%).
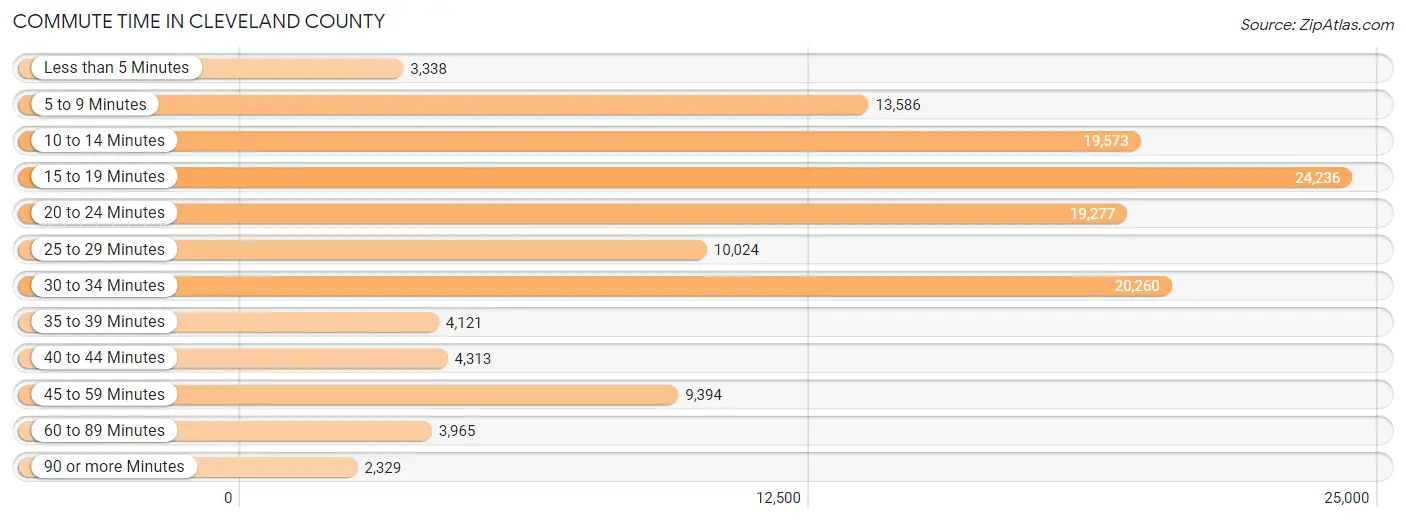
| Commute Time | # Commuters | % Commuters |
| Less than 5 Minutes | 3,338 | 2.5% |
| 5 to 9 Minutes | 13,586 | 10.1% |
| 10 to 14 Minutes | 19,573 | 14.6% |
| 15 to 19 Minutes | 24,236 | 18.0% |
| 20 to 24 Minutes | 19,277 | 14.3% |
| 25 to 29 Minutes | 10,024 | 7.5% |
| 30 to 34 Minutes | 20,260 | 15.1% |
| 35 to 39 Minutes | 4,121 | 3.1% |
| 40 to 44 Minutes | 4,313 | 3.2% |
| 45 to 59 Minutes | 9,394 | 7.0% |
| 60 to 89 Minutes | 3,965 | 2.9% |
| 90 or more Minutes | 2,329 | 1.7% |
Commute Time by Sex in Cleveland County
The most common commute times in Cleveland County are 15 to 19 minutes (12,561 commuters, 17.2%) for males and 15 to 19 minutes (11,675 commuters, 19.0%) for females.
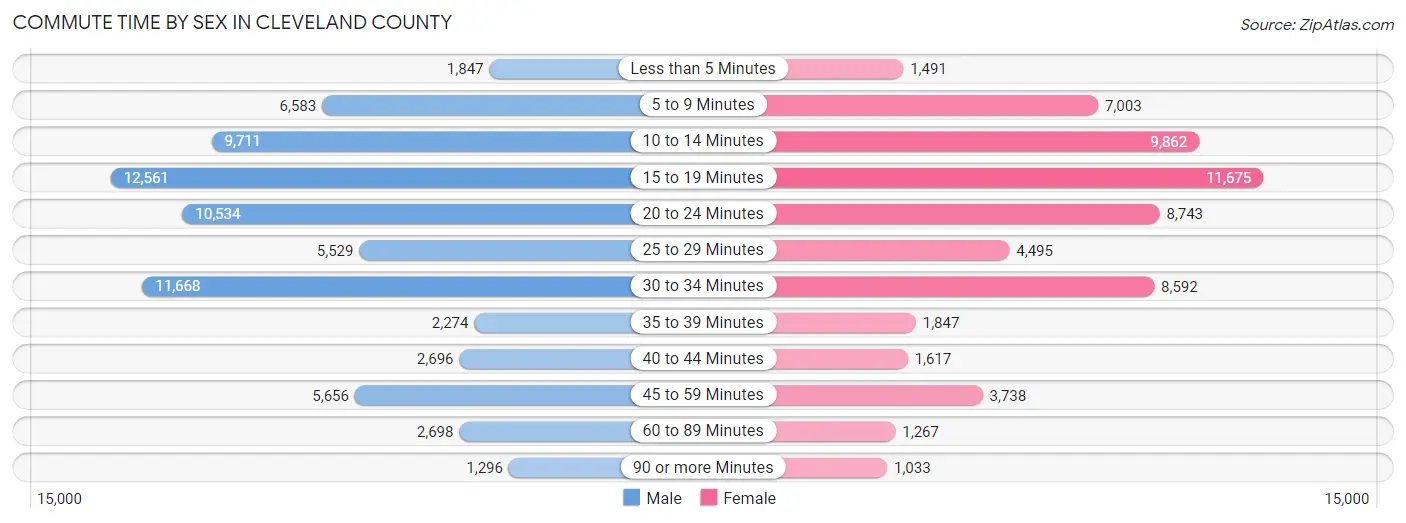
| Commute Time | Male | Female |
| Less than 5 Minutes | 1,847 (2.5%) | 1,491 (2.4%) |
| 5 to 9 Minutes | 6,583 (9.0%) | 7,003 (11.4%) |
| 10 to 14 Minutes | 9,711 (13.3%) | 9,862 (16.1%) |
| 15 to 19 Minutes | 12,561 (17.2%) | 11,675 (19.0%) |
| 20 to 24 Minutes | 10,534 (14.4%) | 8,743 (14.2%) |
| 25 to 29 Minutes | 5,529 (7.6%) | 4,495 (7.3%) |
| 30 to 34 Minutes | 11,668 (16.0%) | 8,592 (14.0%) |
| 35 to 39 Minutes | 2,274 (3.1%) | 1,847 (3.0%) |
| 40 to 44 Minutes | 2,696 (3.7%) | 1,617 (2.6%) |
| 45 to 59 Minutes | 5,656 (7.7%) | 3,738 (6.1%) |
| 60 to 89 Minutes | 2,698 (3.7%) | 1,267 (2.1%) |
| 90 or more Minutes | 1,296 (1.8%) | 1,033 (1.7%) |
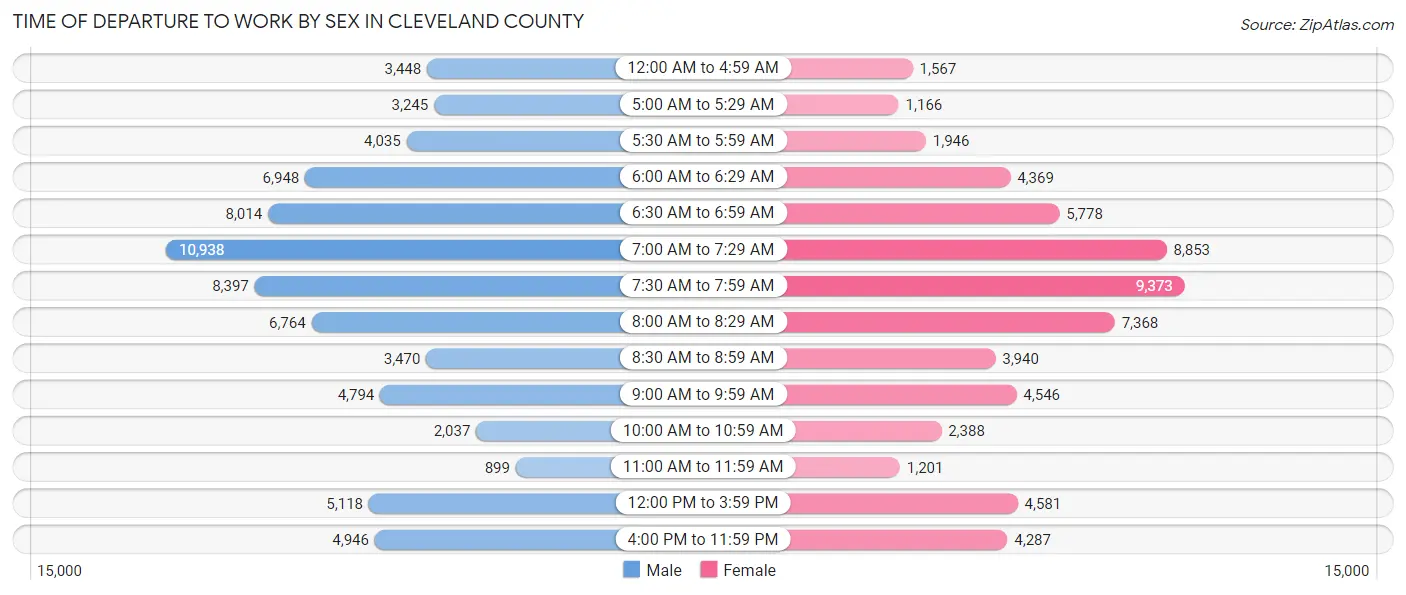
Time of Departure to Work by Sex in Cleveland County
The most frequent times of departure to work in Cleveland County are 7:00 AM to 7:29 AM (10,938, 15.0%) for males and 7:30 AM to 7:59 AM (9,373, 15.3%) for females.
| Time of Departure | Male | Female |
| 12:00 AM to 4:59 AM | 3,448 (4.7%) | 1,567 (2.5%) |
| 5:00 AM to 5:29 AM | 3,245 (4.4%) | 1,166 (1.9%) |
| 5:30 AM to 5:59 AM | 4,035 (5.5%) | 1,946 (3.2%) |
| 6:00 AM to 6:29 AM | 6,948 (9.5%) | 4,369 (7.1%) |
| 6:30 AM to 6:59 AM | 8,014 (11.0%) | 5,778 (9.4%) |
| 7:00 AM to 7:29 AM | 10,938 (15.0%) | 8,853 (14.4%) |
| 7:30 AM to 7:59 AM | 8,397 (11.5%) | 9,373 (15.3%) |
| 8:00 AM to 8:29 AM | 6,764 (9.3%) | 7,368 (12.0%) |
| 8:30 AM to 8:59 AM | 3,470 (4.8%) | 3,940 (6.4%) |
| 9:00 AM to 9:59 AM | 4,794 (6.6%) | 4,546 (7.4%) |
| 10:00 AM to 10:59 AM | 2,037 (2.8%) | 2,388 (3.9%) |
| 11:00 AM to 11:59 AM | 899 (1.2%) | 1,201 (2.0%) |
| 12:00 PM to 3:59 PM | 5,118 (7.0%) | 4,581 (7.5%) |
| 4:00 PM to 11:59 PM | 4,946 (6.8%) | 4,287 (7.0%) |
| Total | 73,053 (100.0%) | 61,363 (100.0%) |
Housing Occupancy in Cleveland County
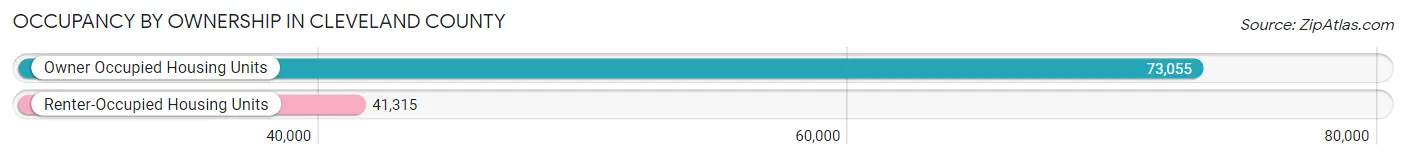
Occupancy by Ownership in Cleveland County
Of the total 114,370 dwellings in Cleveland County, owner-occupied units account for 73,055 (63.9%), while renter-occupied units make up 41,315 (36.1%).
| Occupancy | # Housing Units | % Housing Units |
| Owner Occupied Housing Units | 73,055 | 63.9% |
| Renter-Occupied Housing Units | 41,315 | 36.1% |
| Total Occupied Housing Units | 114,370 | 100.0% |
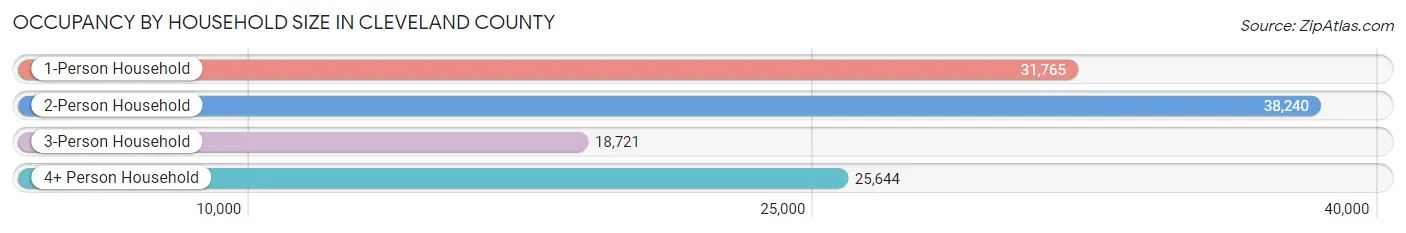
Occupancy by Household Size in Cleveland County
| Household Size | # Housing Units | % Housing Units |
| 1-Person Household | 31,765 | 27.8% |
| 2-Person Household | 38,240 | 33.4% |
| 3-Person Household | 18,721 | 16.4% |
| 4+ Person Household | 25,644 | 22.4% |
| Total Housing Units | 114,370 | 100.0% |
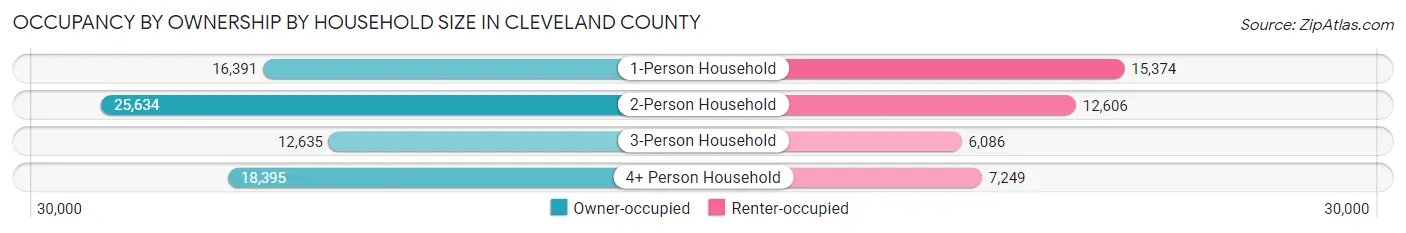
Occupancy by Ownership by Household Size in Cleveland County
| Household Size | Owner-occupied | Renter-occupied |
| 1-Person Household | 16,391 (51.6%) | 15,374 (48.4%) |
| 2-Person Household | 25,634 (67.0%) | 12,606 (33.0%) |
| 3-Person Household | 12,635 (67.5%) | 6,086 (32.5%) |
| 4+ Person Household | 18,395 (71.7%) | 7,249 (28.3%) |
| Total Housing Units | 73,055 (63.9%) | 41,315 (36.1%) |
Occupancy by Educational Attainment in Cleveland County
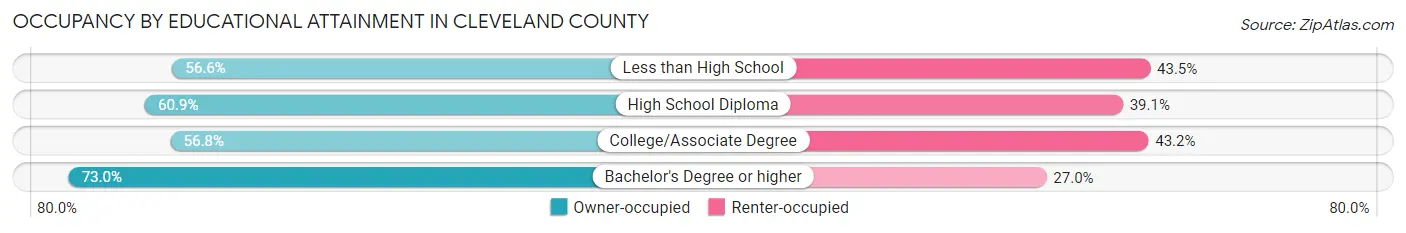
| Household Size | Owner-occupied | Renter-occupied |
| Less than High School | 3,839 (56.6%) | 2,950 (43.4%) |
| High School Diploma | 14,262 (60.9%) | 9,161 (39.1%) |
| College/Associate Degree | 22,789 (56.8%) | 17,307 (43.2%) |
| Bachelor's Degree or higher | 32,165 (73.0%) | 11,897 (27.0%) |
Occupancy by Age of Householder in Cleveland County
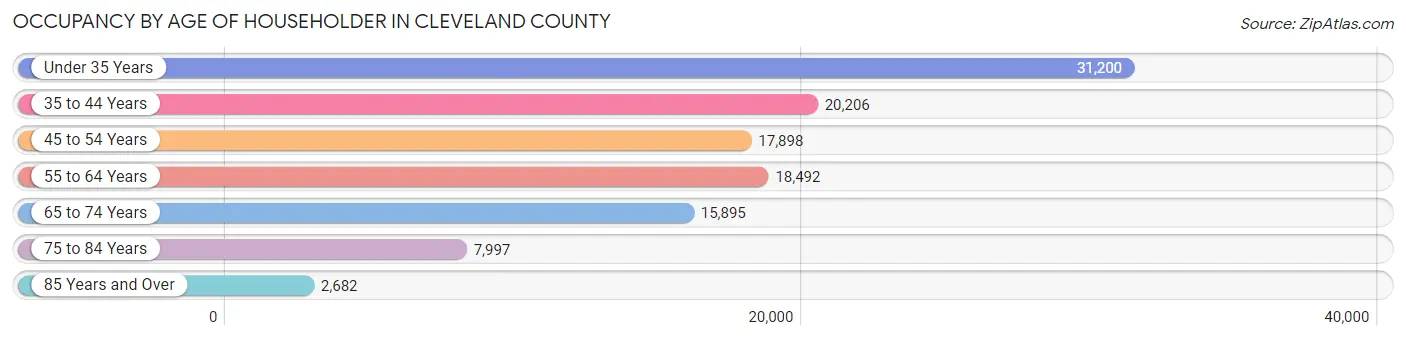
| Age Bracket | # Households | % Households |
| Under 35 Years | 31,200 | 27.3% |
| 35 to 44 Years | 20,206 | 17.7% |
| 45 to 54 Years | 17,898 | 15.7% |
| 55 to 64 Years | 18,492 | 16.2% |
| 65 to 74 Years | 15,895 | 13.9% |
| 75 to 84 Years | 7,997 | 7.0% |
| 85 Years and Over | 2,682 | 2.4% |
| Total | 114,370 | 100.0% |
Housing Finances in Cleveland County
Median Income by Occupancy in Cleveland County
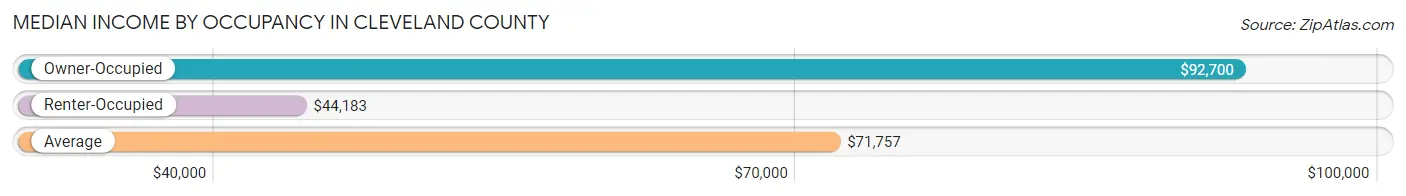
| Occupancy Type | # Households | Median Income |
| Owner-Occupied | 73,055 (63.9%) | $92,700 |
| Renter-Occupied | 41,315 (36.1%) | $44,183 |
| Average | 114,370 (100.0%) | $71,757 |
Occupancy by Householder Income Bracket in Cleveland County

| Income Bracket | Owner-occupied | Renter-occupied |
| Less than $5,000 | 1,214 (1.7%) | 2,642 (6.4%) |
| $5,000 to $9,999 | 805 (1.1%) | 1,782 (4.3%) |
| $10,000 to $14,999 | 744 (1.0%) | 2,070 (5.0%) |
| $15,000 to $19,999 | 1,244 (1.7%) | 2,402 (5.8%) |
| $20,000 to $24,999 | 1,659 (2.3%) | 1,874 (4.5%) |
| $25,000 to $34,999 | 3,486 (4.8%) | 5,030 (12.2%) |
| $35,000 to $49,999 | 6,750 (9.2%) | 7,037 (17.0%) |
| $50,000 to $74,999 | 11,971 (16.4%) | 8,684 (21.0%) |
| $75,000 to $99,999 | 11,819 (16.2%) | 4,506 (10.9%) |
| $100,000 to $149,999 | 17,680 (24.2%) | 3,468 (8.4%) |
| $150,000 or more | 15,683 (21.5%) | 1,820 (4.4%) |
| Total | 73,055 (100.0%) | 41,315 (100.0%) |
Monthly Housing Cost Tiers in Cleveland County
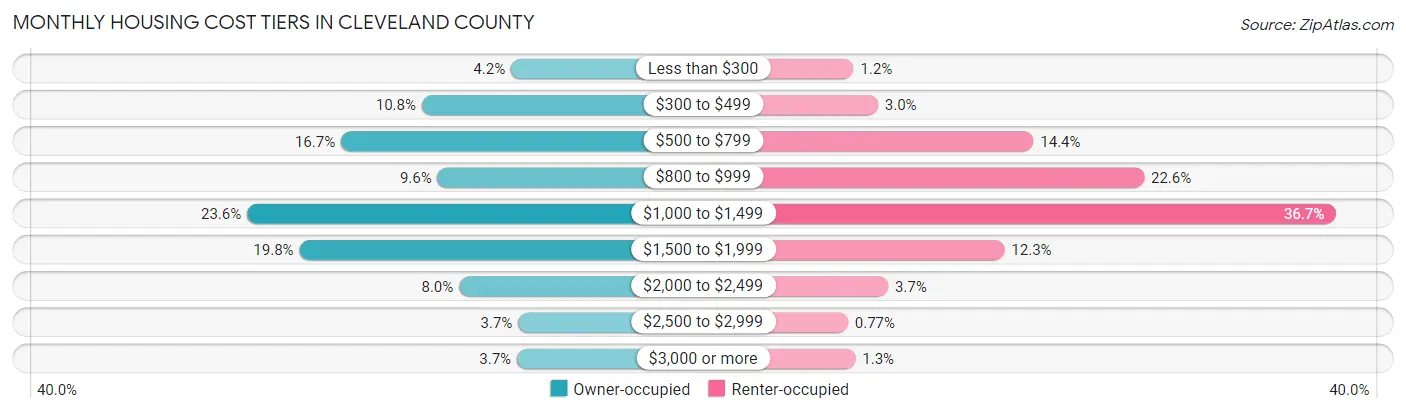
| Monthly Cost | Owner-occupied | Renter-occupied |
| Less than $300 | 3,056 (4.2%) | 491 (1.2%) |
| $300 to $499 | 7,853 (10.7%) | 1,231 (3.0%) |
| $500 to $799 | 12,198 (16.7%) | 5,960 (14.4%) |
| $800 to $999 | 7,006 (9.6%) | 9,330 (22.6%) |
| $1,000 to $1,499 | 17,259 (23.6%) | 15,172 (36.7%) |
| $1,500 to $1,999 | 14,434 (19.8%) | 5,083 (12.3%) |
| $2,000 to $2,499 | 5,846 (8.0%) | 1,537 (3.7%) |
| $2,500 to $2,999 | 2,669 (3.6%) | 319 (0.8%) |
| $3,000 or more | 2,734 (3.7%) | 547 (1.3%) |
| Total | 73,055 (100.0%) | 41,315 (100.0%) |
Physical Housing Characteristics in Cleveland County
Housing Structures in Cleveland County
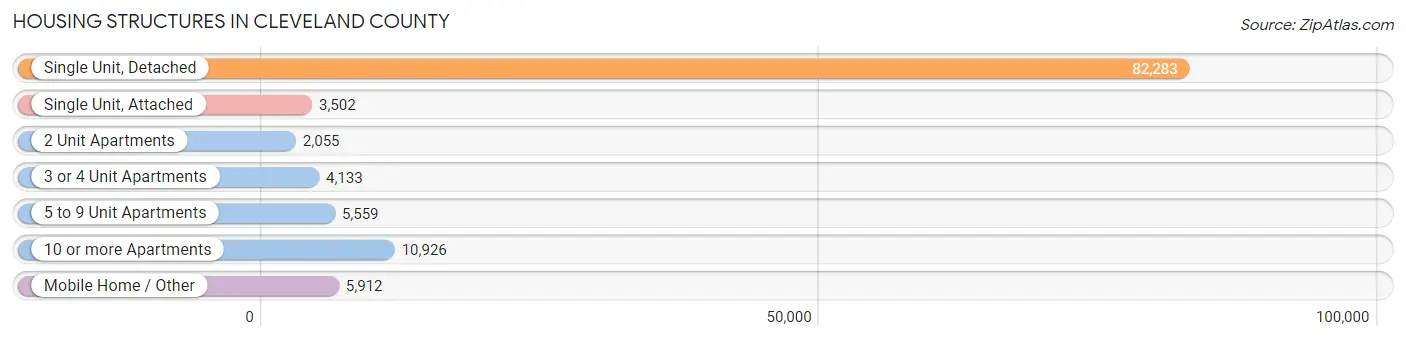
| Structure Type | # Housing Units | % Housing Units |
| Single Unit, Detached | 82,283 | 71.9% |
| Single Unit, Attached | 3,502 | 3.1% |
| 2 Unit Apartments | 2,055 | 1.8% |
| 3 or 4 Unit Apartments | 4,133 | 3.6% |
| 5 to 9 Unit Apartments | 5,559 | 4.9% |
| 10 or more Apartments | 10,926 | 9.6% |
| Mobile Home / Other | 5,912 | 5.2% |
| Total | 114,370 | 100.0% |
Housing Structures by Occupancy in Cleveland County
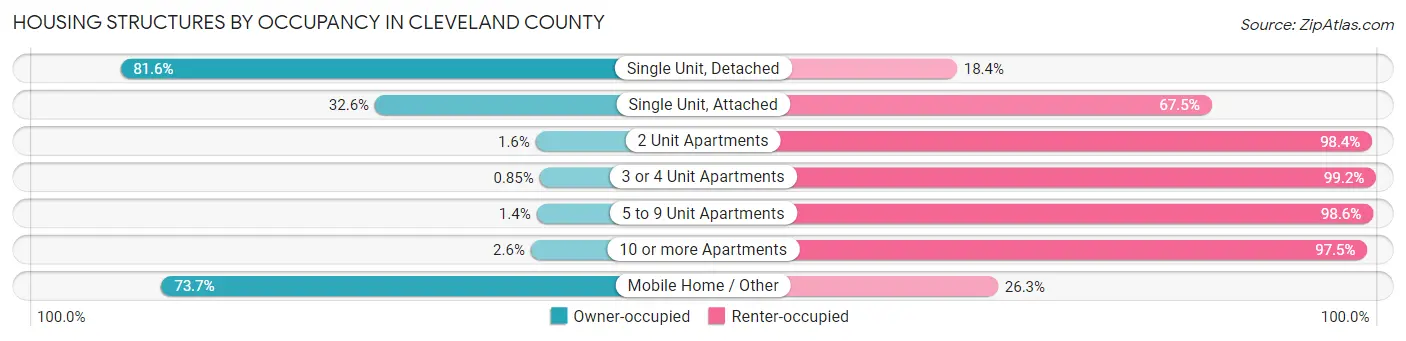
| Structure Type | Owner-occupied | Renter-occupied |
| Single Unit, Detached | 67,132 (81.6%) | 15,151 (18.4%) |
| Single Unit, Attached | 1,140 (32.6%) | 2,362 (67.4%) |
| 2 Unit Apartments | 33 (1.6%) | 2,022 (98.4%) |
| 3 or 4 Unit Apartments | 35 (0.9%) | 4,098 (99.2%) |
| 5 to 9 Unit Apartments | 80 (1.4%) | 5,479 (98.6%) |
| 10 or more Apartments | 279 (2.5%) | 10,647 (97.5%) |
| Mobile Home / Other | 4,356 (73.7%) | 1,556 (26.3%) |
| Total | 73,055 (63.9%) | 41,315 (36.1%) |
Housing Structures by Number of Rooms in Cleveland County
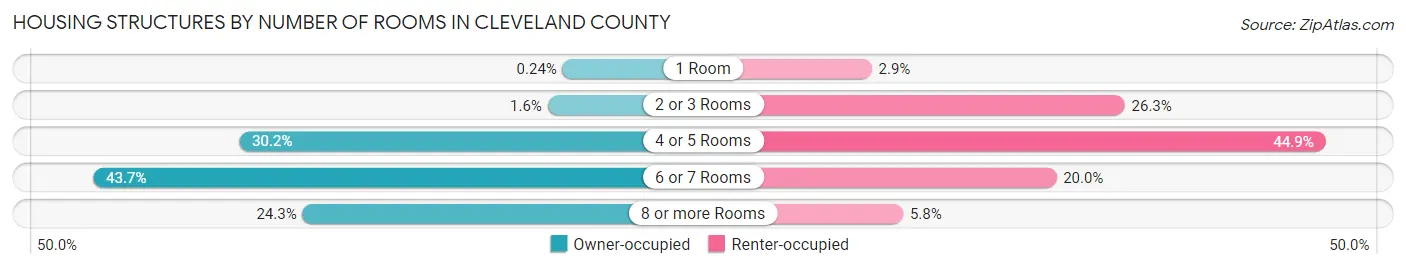
| Number of Rooms | Owner-occupied | Renter-occupied |
| 1 Room | 172 (0.2%) | 1,211 (2.9%) |
| 2 or 3 Rooms | 1,187 (1.6%) | 10,877 (26.3%) |
| 4 or 5 Rooms | 22,038 (30.2%) | 18,556 (44.9%) |
| 6 or 7 Rooms | 31,906 (43.7%) | 8,263 (20.0%) |
| 8 or more Rooms | 17,752 (24.3%) | 2,408 (5.8%) |
| Total | 73,055 (100.0%) | 41,315 (100.0%) |
Housing Structure by Heating Type in Cleveland County
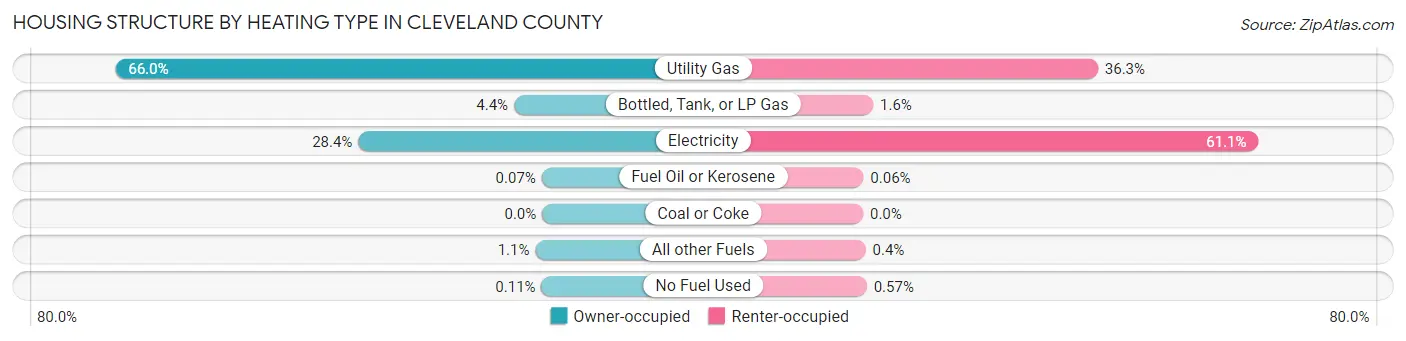
| Heating Type | Owner-occupied | Renter-occupied |
| Utility Gas | 48,203 (66.0%) | 14,996 (36.3%) |
| Bottled, Tank, or LP Gas | 3,179 (4.3%) | 646 (1.6%) |
| Electricity | 20,770 (28.4%) | 25,248 (61.1%) |
| Fuel Oil or Kerosene | 51 (0.1%) | 25 (0.1%) |
| Coal or Coke | 0 (0.0%) | 0 (0.0%) |
| All other Fuels | 770 (1.1%) | 166 (0.4%) |
| No Fuel Used | 82 (0.1%) | 234 (0.6%) |
| Total | 73,055 (100.0%) | 41,315 (100.0%) |
Household Vehicle Usage in Cleveland County
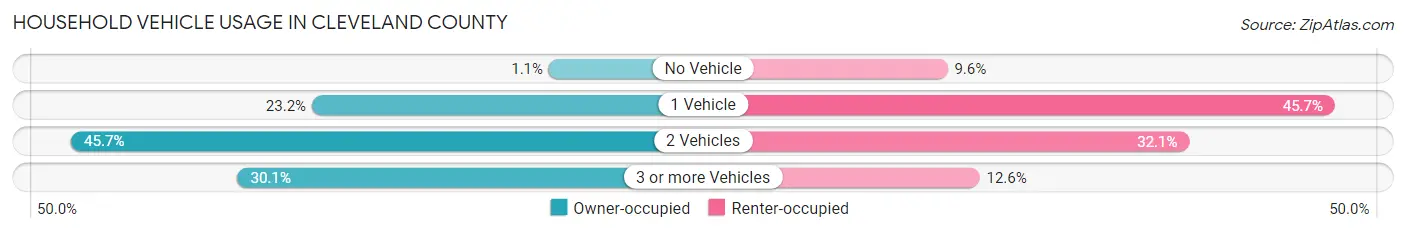
| Vehicles per Household | Owner-occupied | Renter-occupied |
| No Vehicle | 774 (1.1%) | 3,954 (9.6%) |
| 1 Vehicle | 16,931 (23.2%) | 18,892 (45.7%) |
| 2 Vehicles | 33,349 (45.7%) | 13,277 (32.1%) |
| 3 or more Vehicles | 22,001 (30.1%) | 5,192 (12.6%) |
| Total | 73,055 (100.0%) | 41,315 (100.0%) |
Real Estate & Mortgages in Cleveland County
Real Estate and Mortgage Overview in Cleveland County
| Characteristic | Without Mortgage | With Mortgage |
| Housing Units | 27,545 | 45,510 |
| Median Property Value | $198,200 | $207,200 |
| Median Household Income | $72,768 | $11,193 |
| Monthly Housing Costs | $568 | $2,688 |
| Real Estate Taxes | $1,993 | $2,227 |
Property Value by Mortgage Status in Cleveland County
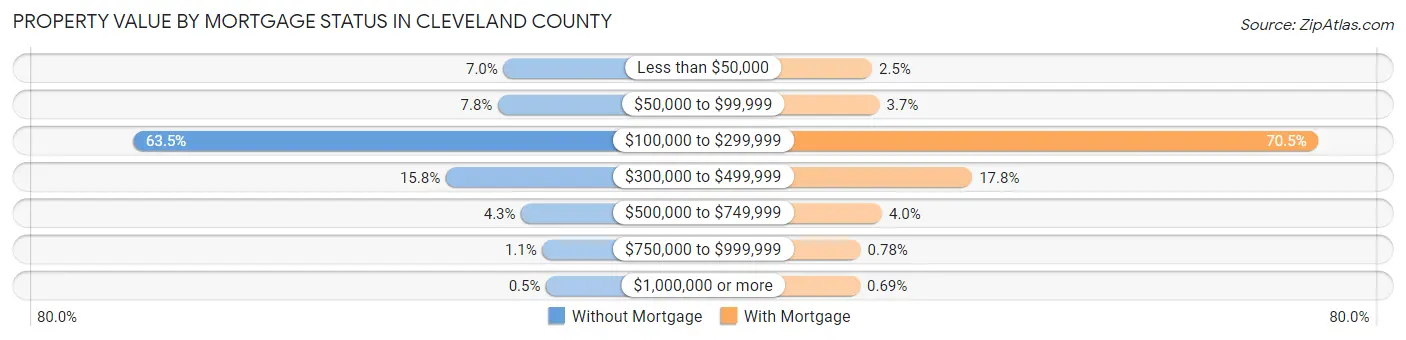
| Property Value | Without Mortgage | With Mortgage |
| Less than $50,000 | 1,932 (7.0%) | 1,146 (2.5%) |
| $50,000 to $99,999 | 2,159 (7.8%) | 1,667 (3.7%) |
| $100,000 to $299,999 | 17,489 (63.5%) | 32,102 (70.5%) |
| $300,000 to $499,999 | 4,348 (15.8%) | 8,093 (17.8%) |
| $500,000 to $749,999 | 1,184 (4.3%) | 1,837 (4.0%) |
| $750,000 to $999,999 | 295 (1.1%) | 353 (0.8%) |
| $1,000,000 or more | 138 (0.5%) | 312 (0.7%) |
| Total | 27,545 (100.0%) | 45,510 (100.0%) |
Household Income by Mortgage Status in Cleveland County
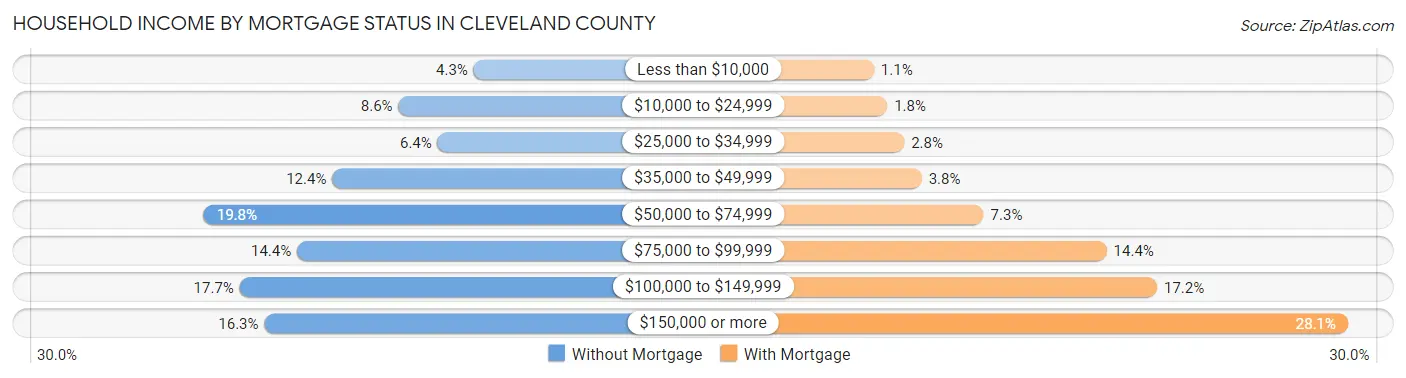
| Household Income | Without Mortgage | With Mortgage |
| Less than $10,000 | 1,195 (4.3%) | 476 (1.1%) |
| $10,000 to $24,999 | 2,380 (8.6%) | 824 (1.8%) |
| $25,000 to $34,999 | 1,764 (6.4%) | 1,267 (2.8%) |
| $35,000 to $49,999 | 3,420 (12.4%) | 1,722 (3.8%) |
| $50,000 to $74,999 | 5,442 (19.8%) | 3,330 (7.3%) |
| $75,000 to $99,999 | 3,976 (14.4%) | 6,529 (14.3%) |
| $100,000 to $149,999 | 4,878 (17.7%) | 7,843 (17.2%) |
| $150,000 or more | 4,490 (16.3%) | 12,802 (28.1%) |
| Total | 27,545 (100.0%) | 45,510 (100.0%) |
Property Value to Household Income Ratio in Cleveland County

| Value-to-Income Ratio | Without Mortgage | With Mortgage |
| Less than 2.0x | 10,030 (36.4%) | 104,385 (229.4%) |
| 2.0x to 2.9x | 5,766 (20.9%) | 21,591 (47.4%) |
| 3.0x to 3.9x | 3,304 (12.0%) | 11,362 (25.0%) |
| 4.0x or more | 8,217 (29.8%) | 5,435 (11.9%) |
| Total | 27,545 (100.0%) | 45,510 (100.0%) |
Real Estate Taxes by Mortgage Status in Cleveland County
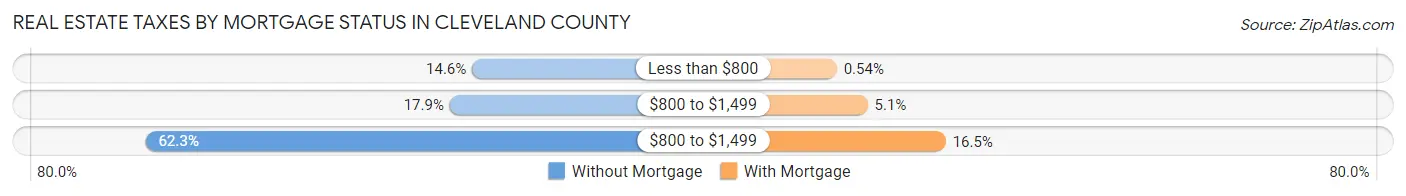
| Property Taxes | Without Mortgage | With Mortgage |
| Less than $800 | 4,023 (14.6%) | 247 (0.5%) |
| $800 to $1,499 | 4,924 (17.9%) | 2,297 (5.1%) |
| $800 to $1,499 | 17,168 (62.3%) | 7,490 (16.5%) |
| Total | 27,545 (100.0%) | 45,510 (100.0%) |
Health & Disability in Cleveland County
Health Insurance Coverage by Age in Cleveland County
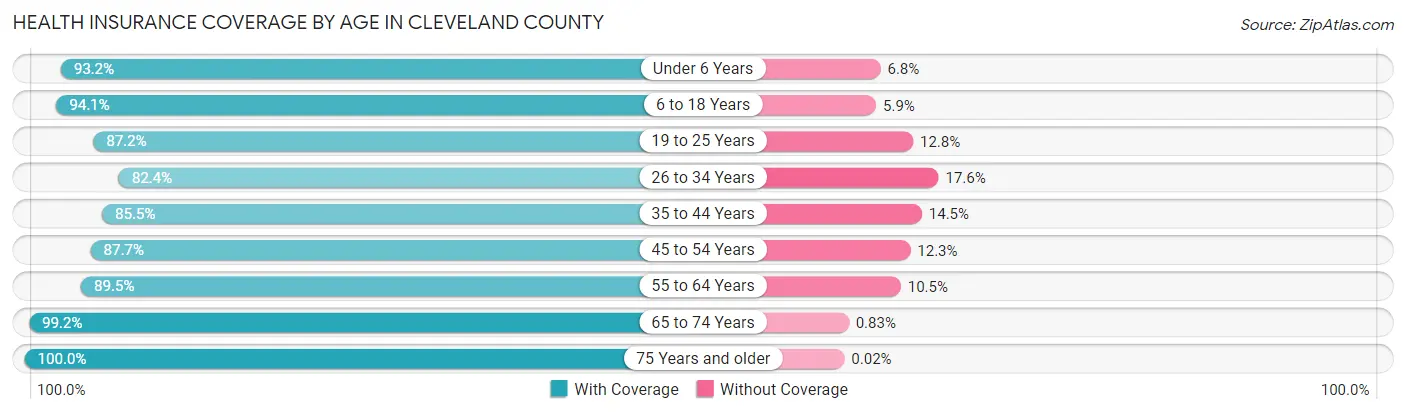
| Age Bracket | With Coverage | Without Coverage |
| Under 6 Years | 17,223 (93.2%) | 1,248 (6.8%) |
| 6 to 18 Years | 45,126 (94.1%) | 2,844 (5.9%) |
| 19 to 25 Years | 37,415 (87.2%) | 5,500 (12.8%) |
| 26 to 34 Years | 29,701 (82.4%) | 6,332 (17.6%) |
| 35 to 44 Years | 32,310 (85.5%) | 5,464 (14.5%) |
| 45 to 54 Years | 28,214 (87.7%) | 3,963 (12.3%) |
| 55 to 64 Years | 28,698 (89.5%) | 3,382 (10.5%) |
| 65 to 74 Years | 24,643 (99.2%) | 205 (0.8%) |
| 75 Years and older | 15,970 (100.0%) | 3 (0.0%) |
| Total | 259,300 (90.0%) | 28,941 (10.0%) |
Health Insurance Coverage by Citizenship Status in Cleveland County
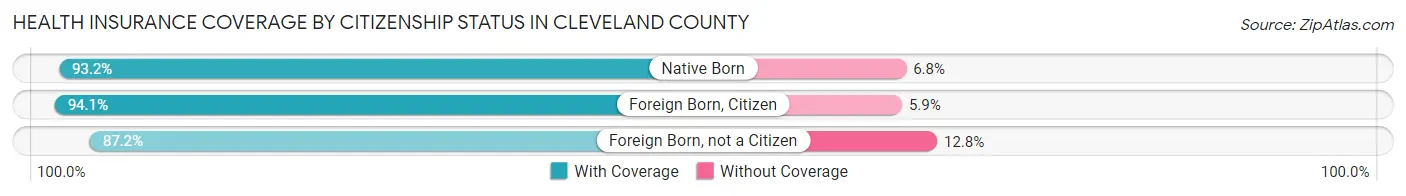
| Citizenship Status | With Coverage | Without Coverage |
| Native Born | 17,223 (93.2%) | 1,248 (6.8%) |
| Foreign Born, Citizen | 45,126 (94.1%) | 2,844 (5.9%) |
| Foreign Born, not a Citizen | 37,415 (87.2%) | 5,500 (12.8%) |
Health Insurance Coverage by Household Income in Cleveland County
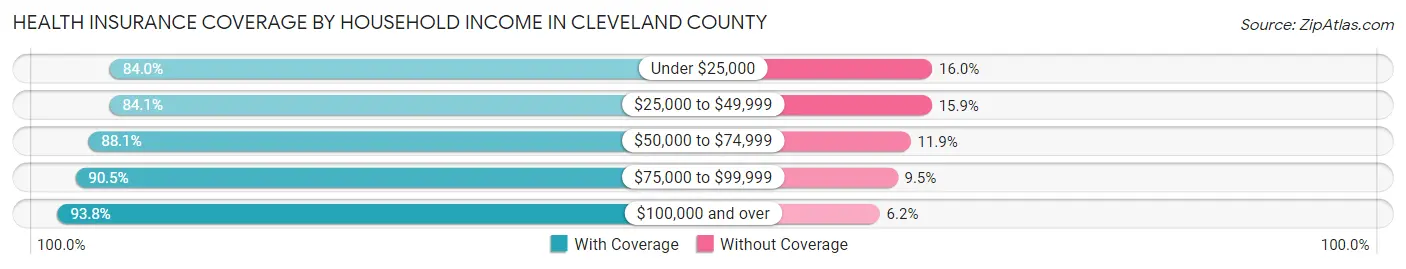
| Household Income | With Coverage | Without Coverage |
| Under $25,000 | 24,342 (84.0%) | 4,630 (16.0%) |
| $25,000 to $49,999 | 38,298 (84.1%) | 7,244 (15.9%) |
| $50,000 to $74,999 | 41,507 (88.1%) | 5,627 (11.9%) |
| $75,000 to $99,999 | 39,145 (90.5%) | 4,115 (9.5%) |
| $100,000 and over | 108,405 (93.8%) | 7,111 (6.2%) |
Public vs Private Health Insurance Coverage by Age in Cleveland County
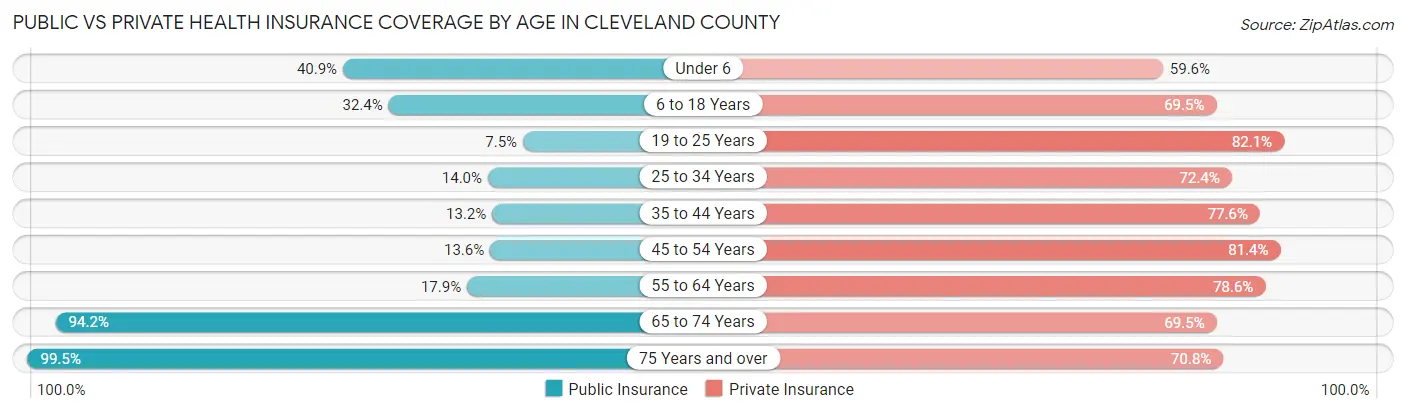
| Age Bracket | Public Insurance | Private Insurance |
| Under 6 | 7,556 (40.9%) | 11,007 (59.6%) |
| 6 to 18 Years | 15,561 (32.4%) | 33,333 (69.5%) |
| 19 to 25 Years | 3,217 (7.5%) | 35,216 (82.1%) |
| 25 to 34 Years | 5,047 (14.0%) | 26,073 (72.4%) |
| 35 to 44 Years | 4,994 (13.2%) | 29,306 (77.6%) |
| 45 to 54 Years | 4,378 (13.6%) | 26,191 (81.4%) |
| 55 to 64 Years | 5,738 (17.9%) | 25,210 (78.6%) |
| 65 to 74 Years | 23,415 (94.2%) | 17,279 (69.5%) |
| 75 Years and over | 15,885 (99.5%) | 11,306 (70.8%) |
| Total | 85,791 (29.8%) | 214,921 (74.6%) |
Disability Status by Sex by Age in Cleveland County
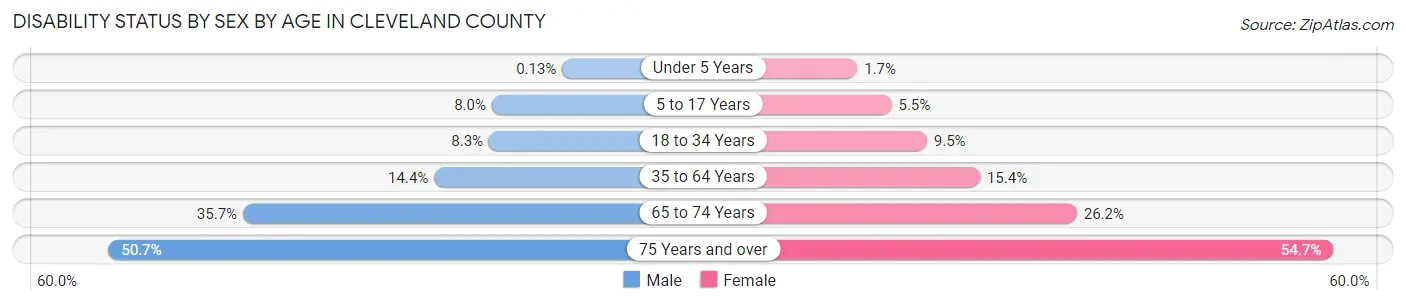
| Age Bracket | Male | Female |
| Under 5 Years | 10 (0.1%) | 124 (1.7%) |
| 5 to 17 Years | 1,904 (8.0%) | 1,253 (5.5%) |
| 18 to 34 Years | 3,517 (8.3%) | 3,964 (9.5%) |
| 35 to 64 Years | 7,240 (14.4%) | 7,959 (15.4%) |
| 65 to 74 Years | 4,164 (35.7%) | 3,450 (26.2%) |
| 75 Years and over | 3,307 (50.7%) | 5,169 (54.7%) |
Disability Class by Sex by Age in Cleveland County
Disability Class: Hearing Difficulty
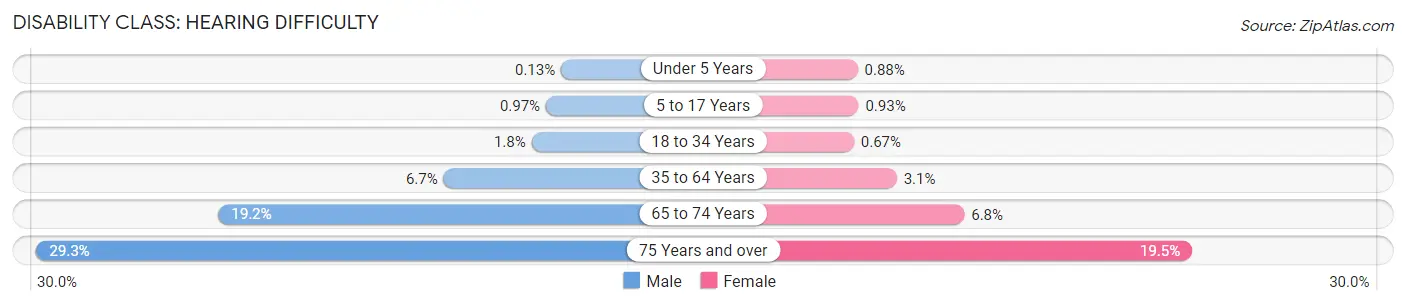
| Age Bracket | Male | Female |
| Under 5 Years | 10 (0.1%) | 63 (0.9%) |
| 5 to 17 Years | 233 (1.0%) | 210 (0.9%) |
| 18 to 34 Years | 750 (1.8%) | 279 (0.7%) |
| 35 to 64 Years | 3,357 (6.7%) | 1,584 (3.1%) |
| 65 to 74 Years | 2,241 (19.2%) | 899 (6.8%) |
| 75 Years and over | 1,915 (29.3%) | 1,842 (19.5%) |
Disability Class: Vision Difficulty

| Age Bracket | Male | Female |
| Under 5 Years | 0 (0.0%) | 75 (1.0%) |
| 5 to 17 Years | 275 (1.1%) | 306 (1.3%) |
| 18 to 34 Years | 770 (1.8%) | 659 (1.6%) |
| 35 to 64 Years | 1,428 (2.8%) | 1,697 (3.3%) |
| 65 to 74 Years | 444 (3.8%) | 404 (3.1%) |
| 75 Years and over | 594 (9.1%) | 841 (8.9%) |
Disability Class: Cognitive Difficulty

| Age Bracket | Male | Female |
| 5 to 17 Years | 1,408 (5.9%) | 821 (3.6%) |
| 18 to 34 Years | 2,162 (5.1%) | 2,959 (7.1%) |
| 35 to 64 Years | 2,310 (4.6%) | 3,054 (5.9%) |
| 65 to 74 Years | 491 (4.2%) | 687 (5.2%) |
| 75 Years and over | 752 (11.5%) | 1,064 (11.3%) |
Disability Class: Ambulatory Difficulty
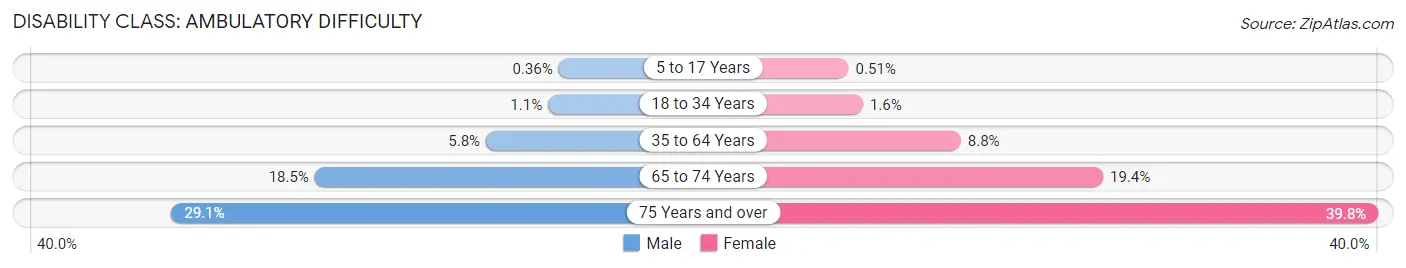
| Age Bracket | Male | Female |
| 5 to 17 Years | 85 (0.4%) | 115 (0.5%) |
| 18 to 34 Years | 482 (1.1%) | 656 (1.6%) |
| 35 to 64 Years | 2,891 (5.8%) | 4,572 (8.8%) |
| 65 to 74 Years | 2,154 (18.5%) | 2,557 (19.4%) |
| 75 Years and over | 1,899 (29.1%) | 3,762 (39.8%) |
Disability Class: Self-Care Difficulty
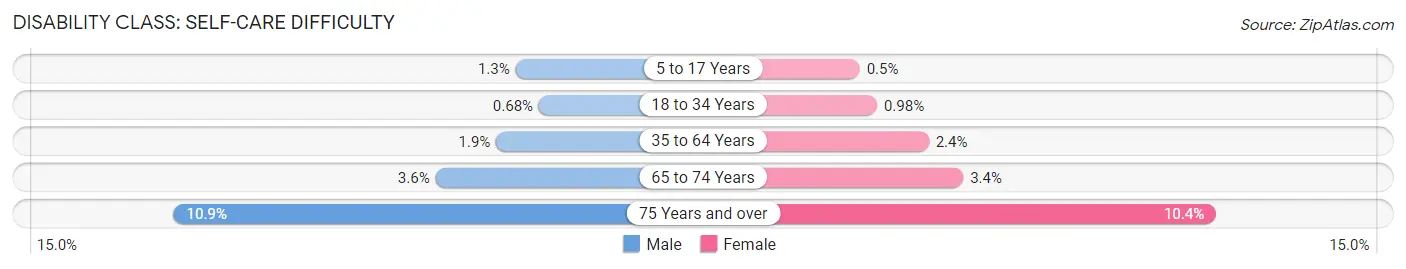
| Age Bracket | Male | Female |
| 5 to 17 Years | 317 (1.3%) | 113 (0.5%) |
| 18 to 34 Years | 288 (0.7%) | 411 (1.0%) |
| 35 to 64 Years | 941 (1.9%) | 1,251 (2.4%) |
| 65 to 74 Years | 415 (3.6%) | 446 (3.4%) |
| 75 Years and over | 708 (10.8%) | 984 (10.4%) |
Technology Access in Cleveland County
Computing Device Access in Cleveland County
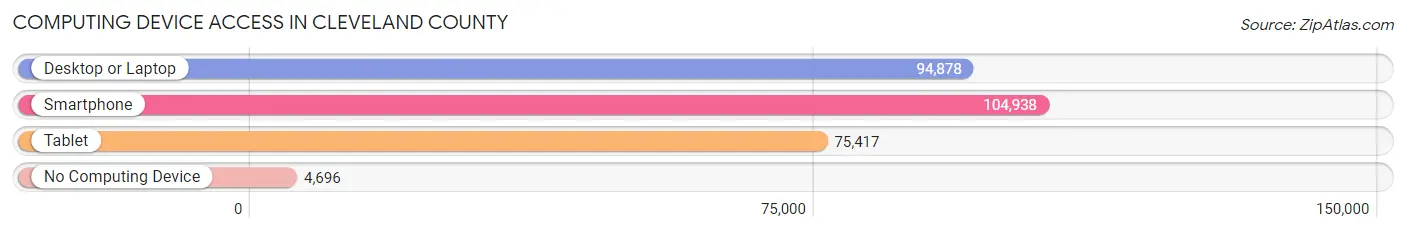
| Device Type | # Households | % Households |
| Desktop or Laptop | 94,878 | 83.0% |
| Smartphone | 104,938 | 91.7% |
| Tablet | 75,417 | 65.9% |
| No Computing Device | 4,696 | 4.1% |
| Total | 114,370 | 100.0% |
Internet Access in Cleveland County
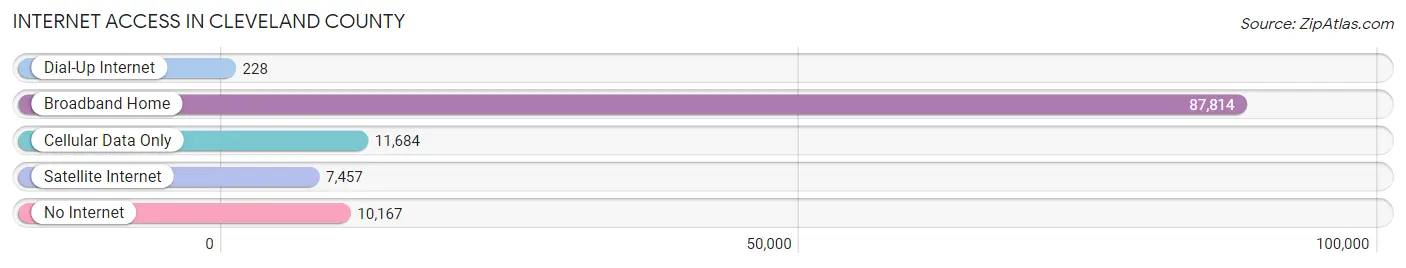
| Internet Type | # Households | % Households |
| Dial-Up Internet | 228 | 0.2% |
| Broadband Home | 87,814 | 76.8% |
| Cellular Data Only | 11,684 | 10.2% |
| Satellite Internet | 7,457 | 6.5% |
| No Internet | 10,167 | 8.9% |
| Total | 114,370 | 100.0% |
Cleveland County Summary
Cleveland County is located in the central part of Oklahoma and is part of the Oklahoma City metropolitan area. It is bordered by Canadian, McClain, Pottawatomie, and Oklahoma counties. The county seat is Norman, and the largest city is Moore. The county was named after U.S. President Grover Cleveland.
Geography
Cleveland County covers an area of 718 square miles and is located in the central part of Oklahoma. It is bordered by Canadian, McClain, Pottawatomie, and Oklahoma counties. The county is mostly flat with rolling hills in the east and south. The county is drained by the Canadian River and its tributaries. The county is part of the Sandstone Hills region of Oklahoma.
The climate of Cleveland County is humid subtropical, with hot summers and mild winters. The average annual temperature is 63°F, and the average annual precipitation is 37 inches.
Demographics
As of the 2010 census, the population of Cleveland County was 255,755, making it the third most populous county in Oklahoma. The population density was 355 people per square mile. The racial makeup of the county was 79.2% White, 8.3% Black or African American, 5.2% Native American, 2.7% Asian, 0.2% Pacific Islander, and 4.4% from other races. Hispanic or Latino of any race were 8.7% of the population.
The median household income was $50,867, and the median family income was $60,919. The per capita income was $24,845. About 8.7% of families and 11.7% of the population were below the poverty line.
Economy
Cleveland County is part of the Oklahoma City metropolitan area, and the economy is largely based on services, manufacturing, and retail. The largest employers in the county are the University of Oklahoma, Norman Regional Health System, and Tinker Air Force Base.
The county is home to several major companies, including Devon Energy, Chesapeake Energy, and AT&T. The county is also home to several major shopping centers, including Sooner Mall and Moore Plaza.
The county is served by the Norman Regional Airport, which offers flights to Dallas/Fort Worth International Airport and other destinations. The county is also served by Amtrak, with service to Oklahoma City and other destinations.
Conclusion
Cleveland County is located in the central part of Oklahoma and is part of the Oklahoma City metropolitan area. It is bordered by Canadian, McClain, Pottawatomie, and Oklahoma counties. The county was named after U.S. President Grover Cleveland. The county covers an area of 718 square miles and has a humid subtropical climate. As of the 2010 census, the population of Cleveland County was 255,755. The economy of the county is largely based on services, manufacturing, and retail. Major employers in the county include the University of Oklahoma, Norman Regional Health System, and Tinker Air Force Base. The county is served by the Norman Regional Airport and Amtrak.
Common Questions
What is the Total Population of Cleveland County?
Total Population of Cleveland County is 295,060.
What is the Total Male Population of Cleveland County?
Total Male Population of Cleveland County is 147,722.
What is the Total Female Population of Cleveland County?
Total Female Population of Cleveland County is 147,338.
What is the Ratio of Males per 100 Females in Cleveland County?
There are 100.26 Males per 100 Females in Cleveland County.
What is the Ratio of Females per 100 Males in Cleveland County?
There are 99.74 Females per 100 Males in Cleveland County.
What is the Median Population Age in Cleveland County?
Median Population Age in Cleveland County is 34.8 Years.
What is the Average Family Size in Cleveland County
Average Family Size in Cleveland County is 3.0 People.
What is the Average Household Size in Cleveland County
Average Household Size in Cleveland County is 2.5 People.
What is Per Capita Income in Cleveland County?
Per Capita income in Cleveland County is $36,913.
What is the Median Family Income in Cleveland County?
Median Family Income in Cleveland County is $91,818.
What is the Median Household income in Cleveland County?
Median Household Income in Cleveland County is $71,757.
What is Income or Wage Gap in Cleveland County?
Income or Wage Gap in Cleveland County is 34.5%.
Women in Cleveland County earn 65.5 cents for every dollar earned by a man.
What is Family Income Deficit in Cleveland County?
Family Income Deficit in Cleveland County is $11,607.
Families that are below poverty line in Cleveland County earn $11,607 less on average than the poverty threshold level.
What is Inequality or Gini Index in Cleveland County?
Inequality or Gini Index in Cleveland County is 0.44.
How Large is the Labor Force in Cleveland County?
There are 157,787 People in the Labor Forcein in Cleveland County.
What is the Percentage of People in the Labor Force in Cleveland County?
65.4% of People are in the Labor Force in Cleveland County.
What is the Unemployment Rate in Cleveland County?
Unemployment Rate in Cleveland County is 4.7%.