Carter County, OK
Carter County Map
Carter County Overview
48,202
TOTAL POPULATION
23,556
MALE POPULATION
24,646
FEMALE POPULATION
95.58
MALES / 100 FEMALES
104.63
FEMALES / 100 MALES
38.4
MEDIAN AGE
3.2
AVG FAMILY SIZE
2.5
AVG HOUSEHOLD SIZE
$31,036
PER CAPITA INCOME
$72,192
AVG FAMILY INCOME
$56,390
AVG HOUSEHOLD INCOME
35.6%
WAGE / INCOME GAP [ % ]
64.4¢/ $1
WAGE / INCOME GAP [ $ ]
$10,821
FAMILY INCOME DEFICIT
0.46
INEQUALITY / GINI INDEX
22,290
LABOR FORCE [ PEOPLE ]
59.7%
PERCENT IN LABOR FORCE
4.2%
UNEMPLOYMENT RATE
Carter County Area Codes
Race in Carter County
The most populous races in Carter County are White / Caucasian (33,751 | 70.0%), Two or more Races (6,079 | 12.6%), and Hispanic or Latino (4,088 | 8.5%).
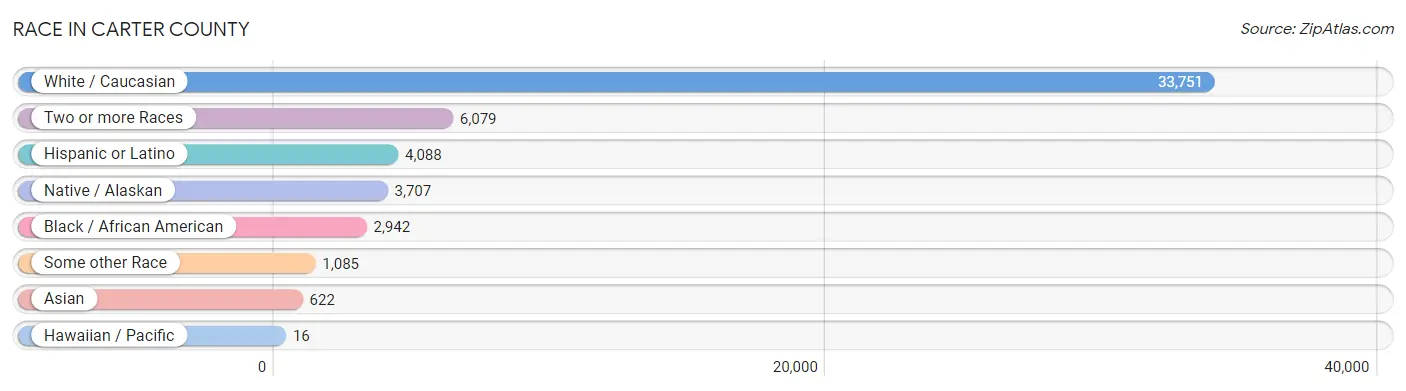
| Race | # Population | % Population |
| Asian | 622 | 1.3% |
| Black / African American | 2,942 | 6.1% |
| Hawaiian / Pacific | 16 | 0.0% |
| Hispanic or Latino | 4,088 | 8.5% |
| Native / Alaskan | 3,707 | 7.7% |
| White / Caucasian | 33,751 | 70.0% |
| Two or more Races | 6,079 | 12.6% |
| Some other Race | 1,085 | 2.2% |
| Total | 48,202 | 100.0% |
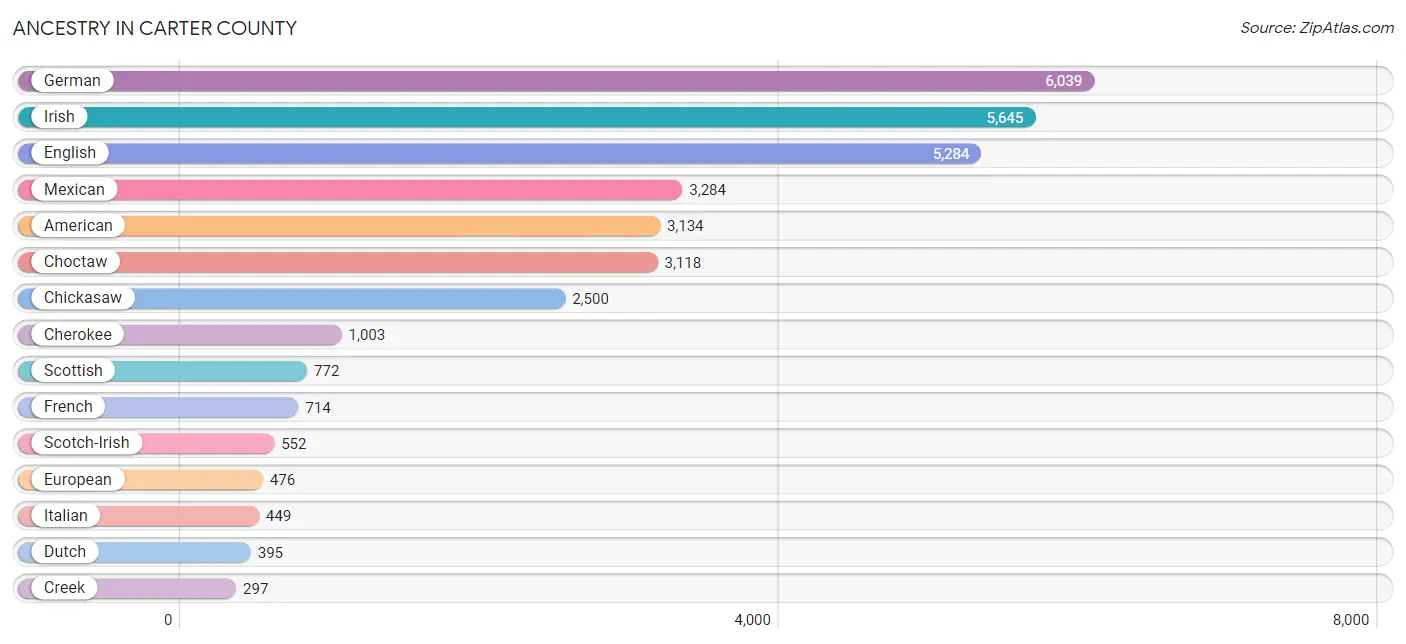
Ancestry in Carter County
The most populous ancestries reported in Carter County are German (6,039 | 12.5%), Irish (5,645 | 11.7%), English (5,284 | 11.0%), Mexican (3,284 | 6.8%), and American (3,134 | 6.5%), together accounting for 48.5% of all Carter County residents.
| Ancestry | # Population | % Population |
| African | 160 | 0.3% |
| Alaska Native | 22 | 0.1% |
| Albanian | 30 | 0.1% |
| American | 3,134 | 6.5% |
| Apache | 85 | 0.2% |
| Arab | 165 | 0.3% |
| Armenian | 4 | 0.0% |
| Austrian | 9 | 0.0% |
| Belgian | 21 | 0.0% |
| Bhutanese | 6 | 0.0% |
| Blackfeet | 59 | 0.1% |
| British | 227 | 0.5% |
| Burmese | 64 | 0.1% |
| Cajun | 12 | 0.0% |
| Canadian | 18 | 0.0% |
| Celtic | 4 | 0.0% |
| Central American | 258 | 0.5% |
| Central American Indian | 52 | 0.1% |
| Cherokee | 1,003 | 2.1% |
| Cheyenne | 23 | 0.1% |
| Chickasaw | 2,500 | 5.2% |
| Chippewa | 7 | 0.0% |
| Choctaw | 3,118 | 6.5% |
| Colombian | 3 | 0.0% |
| Comanche | 35 | 0.1% |
| Creek | 297 | 0.6% |
| Crow | 5 | 0.0% |
| Czech | 47 | 0.1% |
| Czechoslovakian | 12 | 0.0% |
| Danish | 123 | 0.3% |
| Delaware | 8 | 0.0% |
| Dominican | 5 | 0.0% |
| Dutch | 395 | 0.8% |
| Dutch West Indian | 294 | 0.6% |
| Eastern European | 35 | 0.1% |
| Ecuadorian | 13 | 0.0% |
| Egyptian | 10 | 0.0% |
| English | 5,284 | 11.0% |
| European | 476 | 1.0% |
| Finnish | 11 | 0.0% |
| French | 714 | 1.5% |
| French Canadian | 13 | 0.0% |
| German | 6,039 | 12.5% |
| German Russian | 30 | 0.1% |
| Greek | 69 | 0.1% |
| Guamanian / Chamorro | 10 | 0.0% |
| Haitian | 43 | 0.1% |
| Honduran | 106 | 0.2% |
| Hungarian | 4 | 0.0% |
| Indian (Asian) | 126 | 0.3% |
| Iranian | 12 | 0.0% |
| Irish | 5,645 | 11.7% |
| Italian | 449 | 0.9% |
| Jamaican | 51 | 0.1% |
| Kiowa | 28 | 0.1% |
| Korean | 99 | 0.2% |
| Lebanese | 44 | 0.1% |
| Lithuanian | 57 | 0.1% |
| Macedonian | 8 | 0.0% |
| Malaysian | 2 | 0.0% |
| Mexican | 3,284 | 6.8% |
| Mexican American Indian | 14 | 0.0% |
| Native Hawaiian | 51 | 0.1% |
| Navajo | 9 | 0.0% |
| Northern European | 44 | 0.1% |
| Norwegian | 274 | 0.6% |
| Osage | 89 | 0.2% |
| Ottawa | 36 | 0.1% |
| Pakistani | 90 | 0.2% |
| Palestinian | 108 | 0.2% |
| Peruvian | 26 | 0.1% |
| Polish | 151 | 0.3% |
| Portuguese | 9 | 0.0% |
| Potawatomi | 71 | 0.2% |
| Puerto Rican | 166 | 0.3% |
| Romanian | 20 | 0.0% |
| Russian | 173 | 0.4% |
| Salvadoran | 152 | 0.3% |
| Scandinavian | 65 | 0.1% |
| Scotch-Irish | 552 | 1.1% |
| Scottish | 772 | 1.6% |
| Seminole | 125 | 0.3% |
| Sioux | 69 | 0.1% |
| Slavic | 22 | 0.1% |
| Slovak | 8 | 0.0% |
| South African | 5 | 0.0% |
| South American | 51 | 0.1% |
| Spaniard | 193 | 0.4% |
| Spanish | 6 | 0.0% |
| Spanish American Indian | 9 | 0.0% |
| Sri Lankan | 185 | 0.4% |
| Subsaharan African | 178 | 0.4% |
| Swedish | 154 | 0.3% |
| Swiss | 126 | 0.3% |
| Thai | 209 | 0.4% |
| Ukrainian | 7 | 0.0% |
| Ute | 10 | 0.0% |
| Venezuelan | 9 | 0.0% |
| Vietnamese | 17 | 0.0% |
| Welsh | 207 | 0.4% |
| Yugoslavian | 7 | 0.0% | View All 101 Rows |
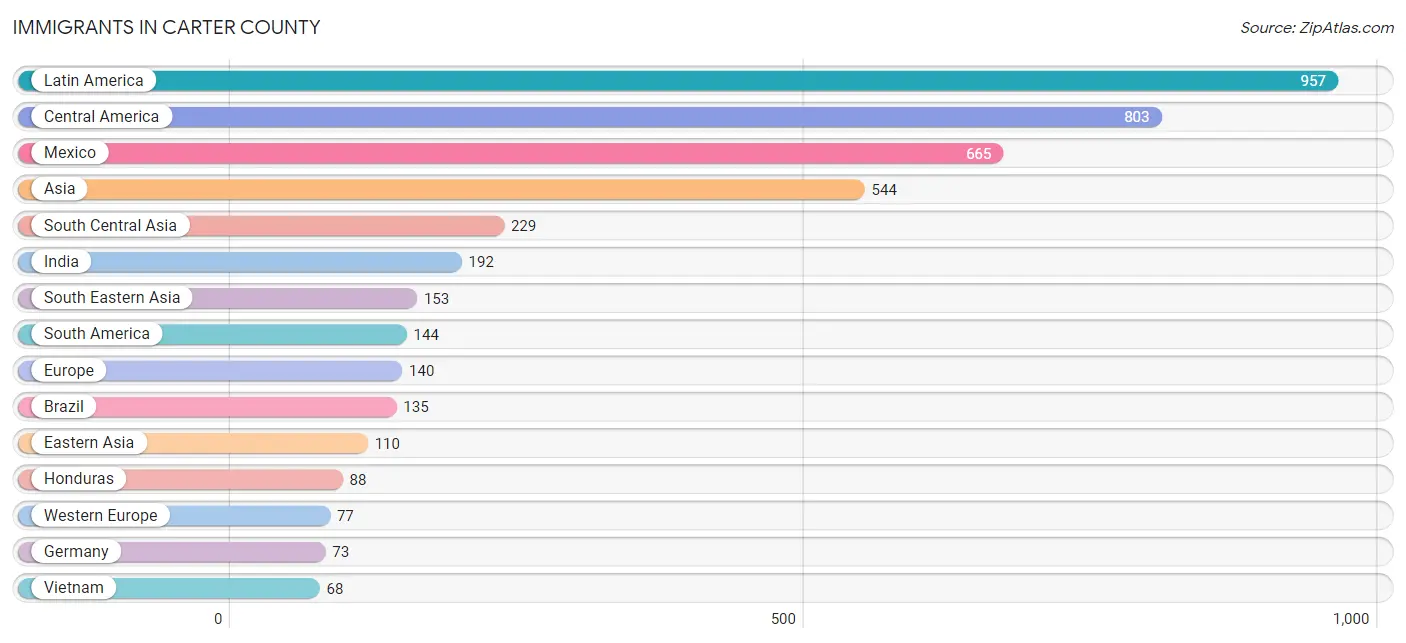
Immigrants in Carter County
The most numerous immigrant groups reported in Carter County came from Latin America (957 | 2.0%), Central America (803 | 1.7%), Mexico (665 | 1.4%), Asia (544 | 1.1%), and South Central Asia (229 | 0.5%), together accounting for 6.7% of all Carter County residents.
| Immigration Origin | # Population | % Population |
| Africa | 5 | 0.0% |
| Asia | 544 | 1.1% |
| Bangladesh | 37 | 0.1% |
| Brazil | 135 | 0.3% |
| Canada | 29 | 0.1% |
| Caribbean | 10 | 0.0% |
| Central America | 803 | 1.7% |
| China | 56 | 0.1% |
| Eastern Asia | 110 | 0.2% |
| Eastern Europe | 27 | 0.1% |
| El Salvador | 42 | 0.1% |
| England | 22 | 0.1% |
| Europe | 140 | 0.3% |
| France | 4 | 0.0% |
| Germany | 73 | 0.2% |
| Guatemala | 8 | 0.0% |
| Honduras | 88 | 0.2% |
| India | 192 | 0.4% |
| Jamaica | 10 | 0.0% |
| Korea | 54 | 0.1% |
| Kuwait | 34 | 0.1% |
| Latin America | 957 | 2.0% |
| Mexico | 665 | 1.4% |
| Northern Europe | 22 | 0.1% |
| Philippines | 53 | 0.1% |
| Russia | 9 | 0.0% |
| South Africa | 5 | 0.0% |
| South America | 144 | 0.3% |
| South Central Asia | 229 | 0.5% |
| South Eastern Asia | 153 | 0.3% |
| Southern Europe | 14 | 0.0% |
| Spain | 14 | 0.0% |
| Thailand | 32 | 0.1% |
| Ukraine | 3 | 0.0% |
| Venezuela | 9 | 0.0% |
| Vietnam | 68 | 0.1% |
| Western Asia | 52 | 0.1% |
| Western Europe | 77 | 0.2% | View All 38 Rows |
Sex and Age in Carter County
Sex and Age in Carter County
The most populous age groups in Carter County are 10 to 14 Years (2,112 | 9.0%) for men and 10 to 14 Years (1,828 | 7.4%) for women.
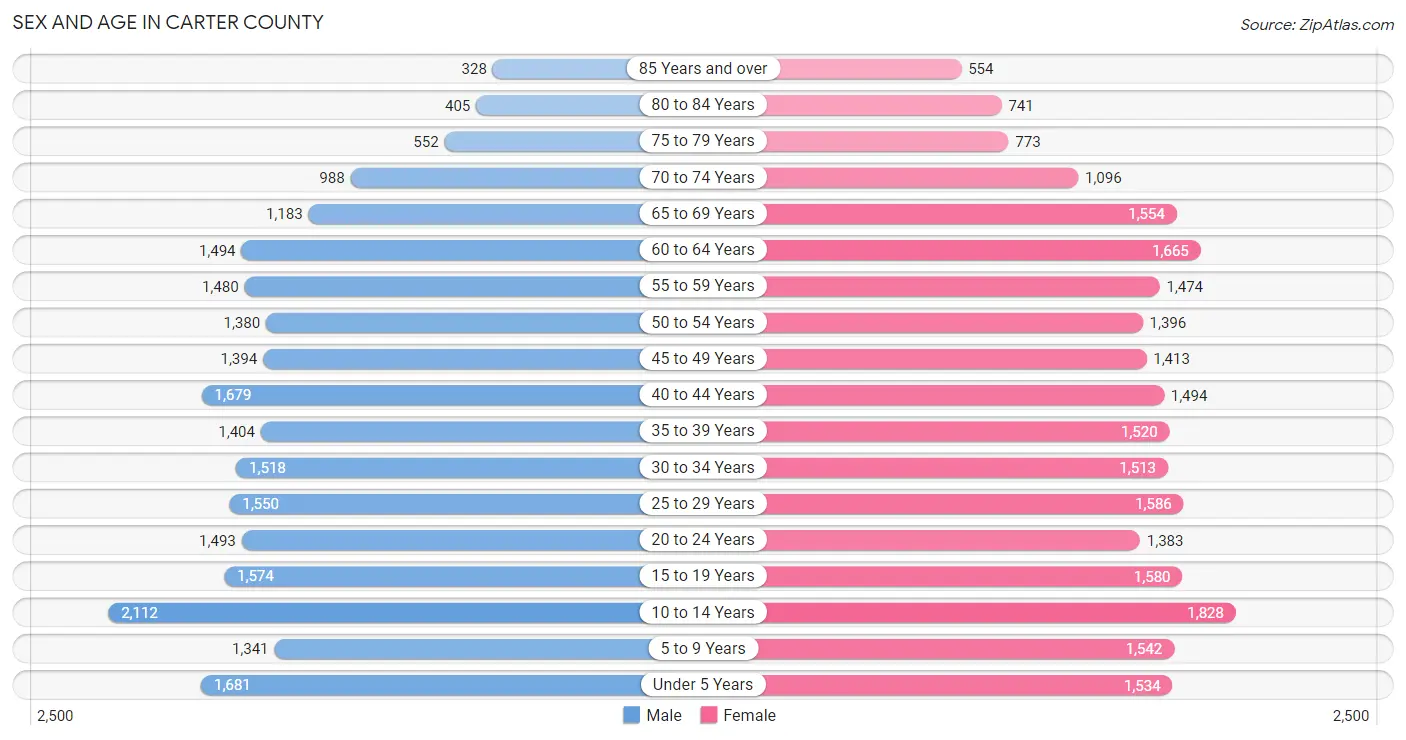
| Age Bracket | Male | Female |
| Under 5 Years | 1,681 (7.1%) | 1,534 (6.2%) |
| 5 to 9 Years | 1,341 (5.7%) | 1,542 (6.3%) |
| 10 to 14 Years | 2,112 (9.0%) | 1,828 (7.4%) |
| 15 to 19 Years | 1,574 (6.7%) | 1,580 (6.4%) |
| 20 to 24 Years | 1,493 (6.3%) | 1,383 (5.6%) |
| 25 to 29 Years | 1,550 (6.6%) | 1,586 (6.4%) |
| 30 to 34 Years | 1,518 (6.4%) | 1,513 (6.1%) |
| 35 to 39 Years | 1,404 (6.0%) | 1,520 (6.2%) |
| 40 to 44 Years | 1,679 (7.1%) | 1,494 (6.1%) |
| 45 to 49 Years | 1,394 (5.9%) | 1,413 (5.7%) |
| 50 to 54 Years | 1,380 (5.9%) | 1,396 (5.7%) |
| 55 to 59 Years | 1,480 (6.3%) | 1,474 (6.0%) |
| 60 to 64 Years | 1,494 (6.3%) | 1,665 (6.8%) |
| 65 to 69 Years | 1,183 (5.0%) | 1,554 (6.3%) |
| 70 to 74 Years | 988 (4.2%) | 1,096 (4.4%) |
| 75 to 79 Years | 552 (2.3%) | 773 (3.1%) |
| 80 to 84 Years | 405 (1.7%) | 741 (3.0%) |
| 85 Years and over | 328 (1.4%) | 554 (2.2%) |
| Total | 23,556 (100.0%) | 24,646 (100.0%) |
Families and Households in Carter County
Median Family Size in Carter County
The median family size in Carter County is 3.18 persons per family, with single male/father families (959 | 8.1%) accounting for the largest median family size of 3.34 persons per family. On the other hand, single female/mother families (2,506 | 21.1%) represent the smallest median family size with 3.09 persons per family.
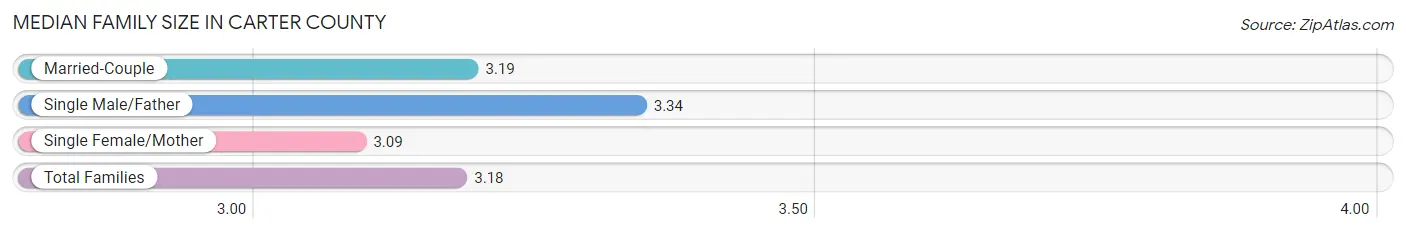
| Family Type | # Families | Family Size |
| Married-Couple | 8,401 (70.8%) | 3.19 |
| Single Male/Father | 959 (8.1%) | 3.34 |
| Single Female/Mother | 2,506 (21.1%) | 3.09 |
| Total Families | 11,866 (100.0%) | 3.18 |
Median Household Size in Carter County
The median household size in Carter County is 2.52 persons per household, with single male/father households (959 | 5.1%) accounting for the largest median household size of 3.83 persons per household. non-family households (6,872 | 36.7%) represent the smallest median household size with 1.19 persons per household.
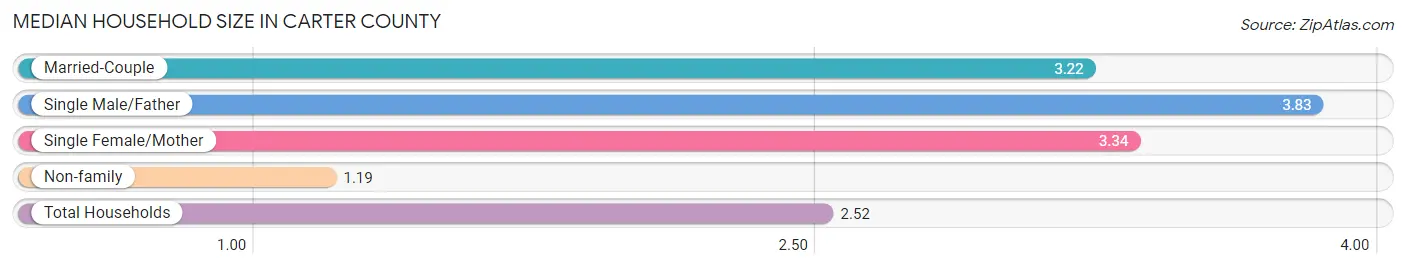
| Household Type | # Households | Household Size |
| Married-Couple | 8,401 (44.8%) | 3.22 |
| Single Male/Father | 959 (5.1%) | 3.83 |
| Single Female/Mother | 2,506 (13.4%) | 3.34 |
| Non-family | 6,872 (36.7%) | 1.19 |
| Total Households | 18,738 (100.0%) | 2.52 |
Household Size by Marriage Status in Carter County
Out of a total of 18,738 households in Carter County, 11,866 (63.3%) are family households, while 6,872 (36.7%) are nonfamily households. The most numerous type of family households are 2-person households, comprising 5,297, and the most common type of nonfamily households are 1-person households, comprising 5,985.
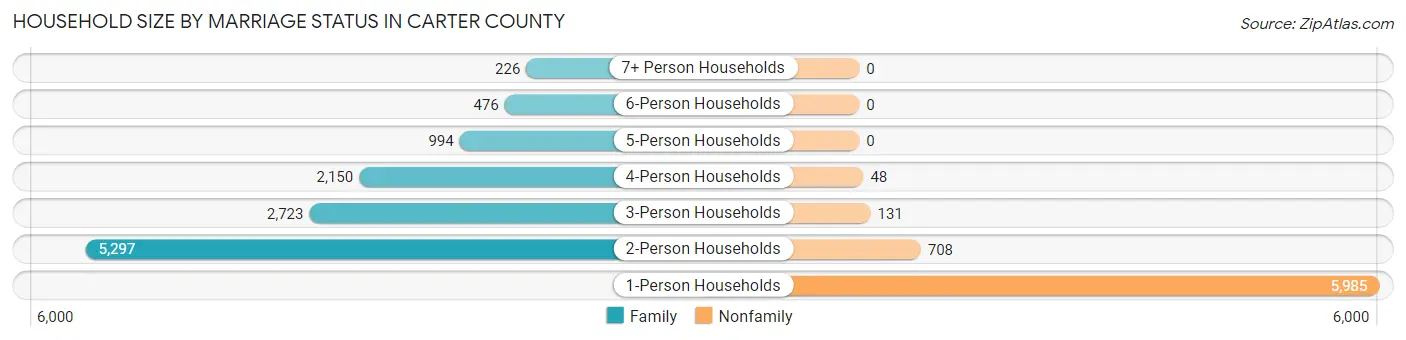
| Household Size | Family Households | Nonfamily Households |
| 1-Person Households | - | 5,985 (31.9%) |
| 2-Person Households | 5,297 (28.3%) | 708 (3.8%) |
| 3-Person Households | 2,723 (14.5%) | 131 (0.7%) |
| 4-Person Households | 2,150 (11.5%) | 48 (0.3%) |
| 5-Person Households | 994 (5.3%) | 0 (0.0%) |
| 6-Person Households | 476 (2.5%) | 0 (0.0%) |
| 7+ Person Households | 226 (1.2%) | 0 (0.0%) |
| Total | 11,866 (63.3%) | 6,872 (36.7%) |
Female Fertility in Carter County
Fertility by Age in Carter County
Average fertility rate in Carter County is 65.0 births per 1,000 women. Women in the age bracket of 20 to 34 years have the highest fertility rate with 131.0 births per 1,000 women. Women in the age bracket of 20 to 34 years acount for 84.2% of all women with births.
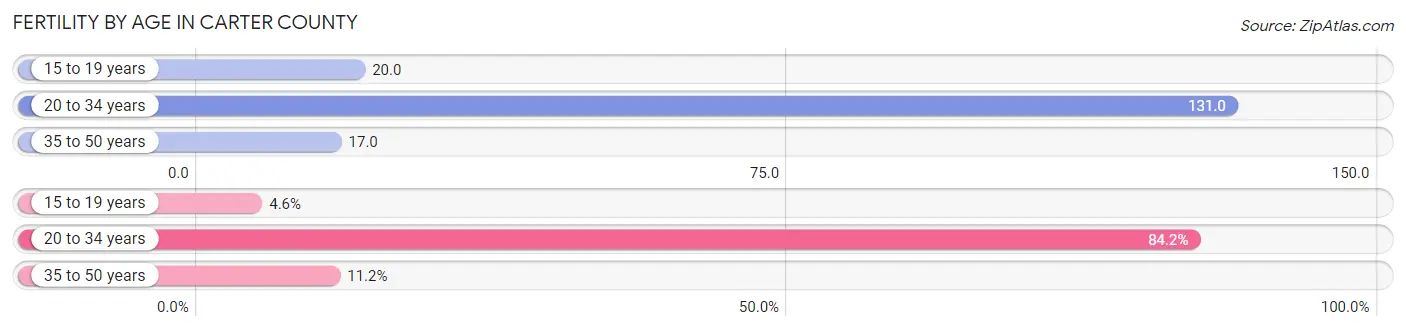
| Age Bracket | Women with Births | Births / 1,000 Women |
| 15 to 19 years | 32 (4.6%) | 20.0 |
| 20 to 34 years | 585 (84.2%) | 131.0 |
| 35 to 50 years | 78 (11.2%) | 17.0 |
| Total | 695 (100.0%) | 65.0 |
Fertility by Age by Marriage Status in Carter County
52.9% of women with births (695) in Carter County are married. The highest percentage of unmarried women with births falls into 15 to 19 years age bracket with 100.0% of them unmarried at the time of birth, while the lowest percentage of unmarried women with births belong to 20 to 34 years age bracket with 42.2% of them unmarried.
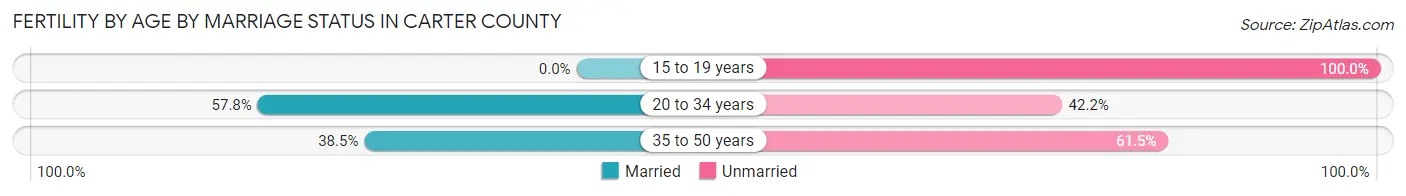
| Age Bracket | Married | Unmarried |
| 15 to 19 years | 0 (0.0%) | 32 (100.0%) |
| 20 to 34 years | 338 (57.8%) | 247 (42.2%) |
| 35 to 50 years | 30 (38.5%) | 48 (61.5%) |
| Total | 368 (52.9%) | 327 (47.0%) |
Fertility by Education in Carter County
Average fertility rate in Carter County is 65.0 births per 1,000 women. Women with the education attainment of high school diploma have the highest fertility rate of 105.0 births per 1,000 women, while women with the education attainment of less than high school have the lowest fertility at 20.0 births per 1,000 women. Women with the education attainment of high school diploma represent 44.6% of all women with births.
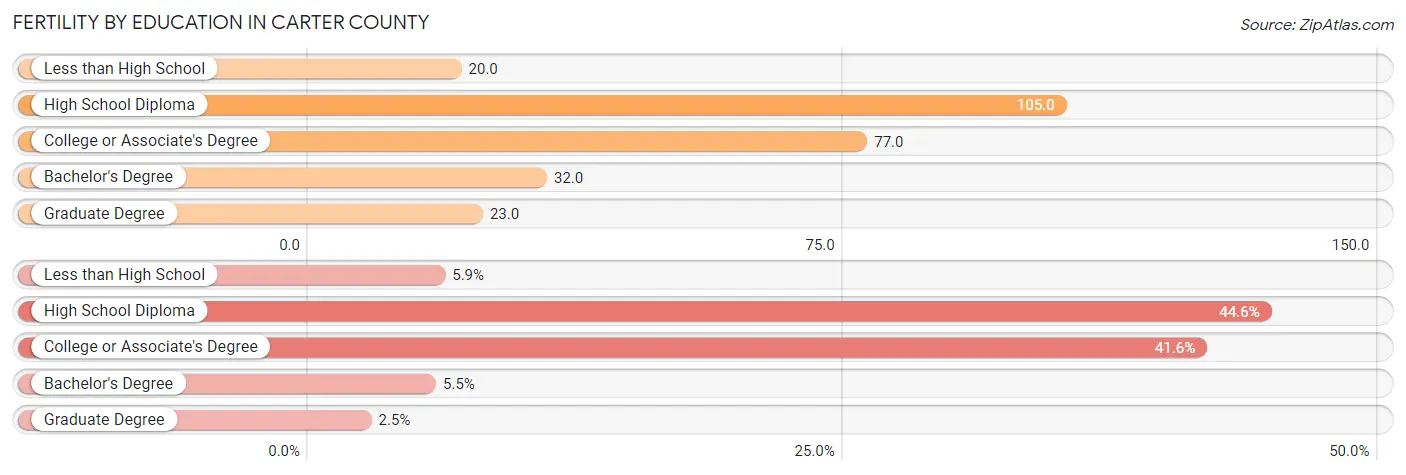
| Educational Attainment | Women with Births | Births / 1,000 Women |
| Less than High School | 41 (5.9%) | 20.0 |
| High School Diploma | 310 (44.6%) | 105.0 |
| College or Associate's Degree | 289 (41.6%) | 77.0 |
| Bachelor's Degree | 38 (5.5%) | 32.0 |
| Graduate Degree | 17 (2.5%) | 23.0 |
| Total | 695 (100.0%) | 65.0 |
Fertility by Education by Marriage Status in Carter County
47.0% of women with births in Carter County are unmarried. Women with the educational attainment of graduate degree are most likely to be married with 100.0% of them married at childbirth, while women with the educational attainment of high school diploma are least likely to be married with 57.1% of them unmarried at childbirth.
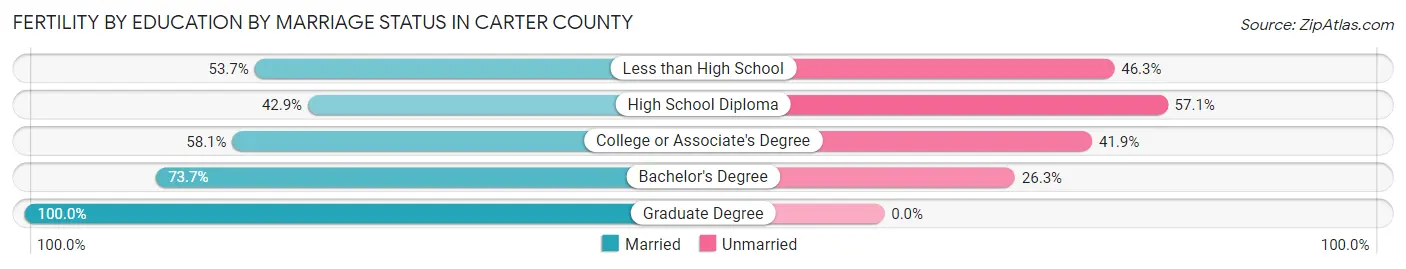
| Educational Attainment | Married | Unmarried |
| Less than High School | 22 (53.7%) | 19 (46.3%) |
| High School Diploma | 133 (42.9%) | 177 (57.1%) |
| College or Associate's Degree | 168 (58.1%) | 121 (41.9%) |
| Bachelor's Degree | 28 (73.7%) | 10 (26.3%) |
| Graduate Degree | 17 (100.0%) | 0 (0.0%) |
| Total | 368 (52.9%) | 327 (47.0%) |
Income in Carter County
Income Overview in Carter County
Per Capita Income in Carter County is $31,036, while median incomes of families and households are $72,192 and $56,390 respectively.
| Characteristic | Number | Measure |
| Per Capita Income | 48,202 | $31,036 |
| Median Family Income | 11,866 | $72,192 |
| Mean Family Income | 11,866 | $90,758 |
| Median Household Income | 18,738 | $56,390 |
| Mean Household Income | 18,738 | $76,697 |
| Income Deficit | 11,866 | $10,821 |
| Wage / Income Gap (%) | 48,202 | 35.62% |
| Wage / Income Gap ($) | 48,202 | 64.38¢ per $1 |
| Gini / Inequality Index | 48,202 | 0.46 |
Earnings by Sex in Carter County
Average Earnings in Carter County are $35,915, $45,153 for men and $29,068 for women, a difference of 35.6%.
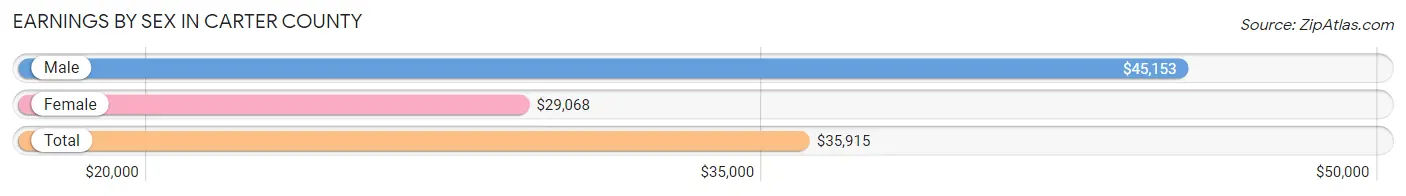
| Sex | Number | Average Earnings |
| Male | 12,316 (53.0%) | $45,153 |
| Female | 10,922 (47.0%) | $29,068 |
| Total | 23,238 (100.0%) | $35,915 |
Earnings by Sex by Income Bracket in Carter County
The most common earnings brackets in Carter County are $100,000+ for men (1,799 | 14.6%) and $25,000 to $29,999 for women (1,108 | 10.1%).
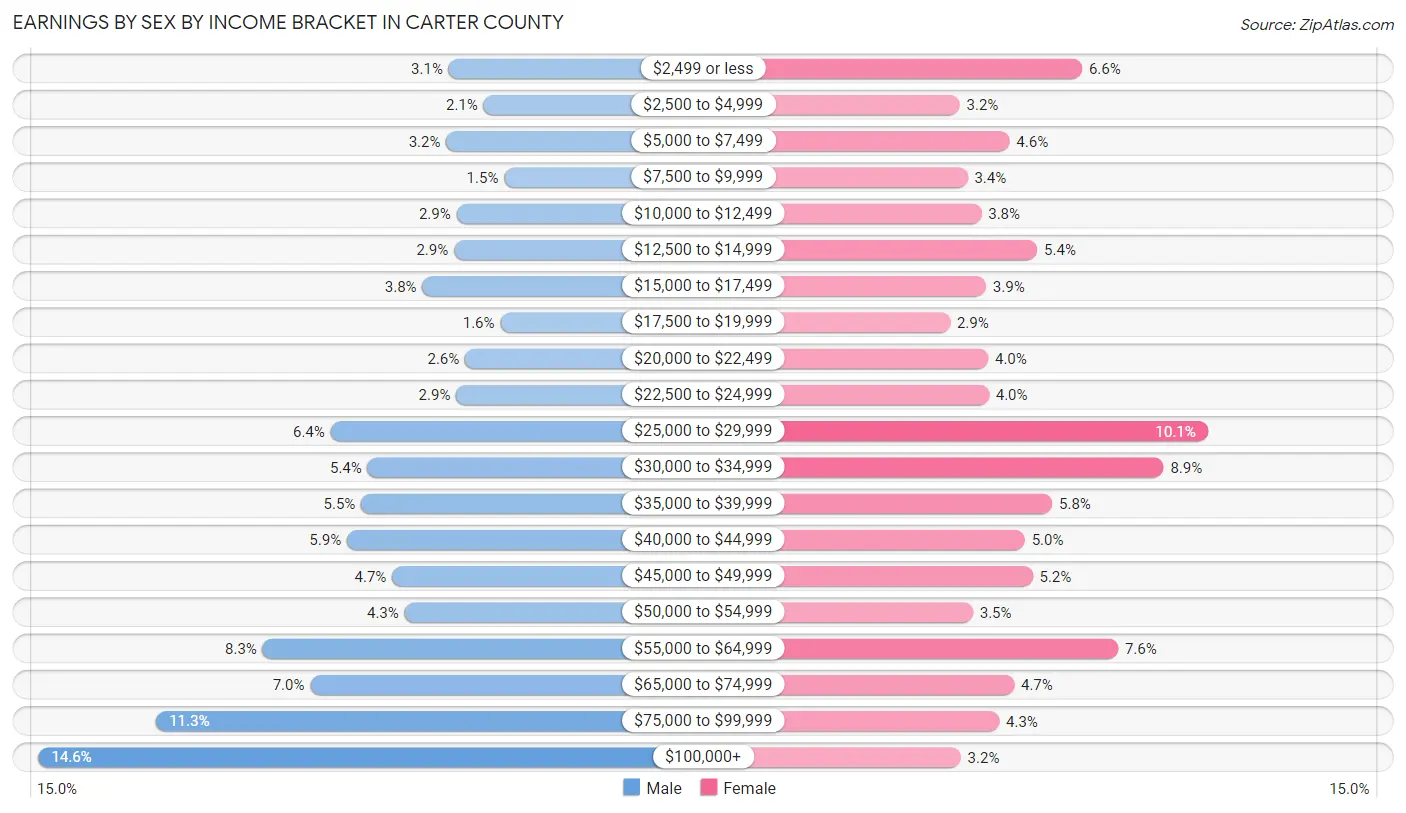
| Income | Male | Female |
| $2,499 or less | 379 (3.1%) | 722 (6.6%) |
| $2,500 to $4,999 | 259 (2.1%) | 346 (3.2%) |
| $5,000 to $7,499 | 388 (3.2%) | 499 (4.6%) |
| $7,500 to $9,999 | 187 (1.5%) | 370 (3.4%) |
| $10,000 to $12,499 | 352 (2.9%) | 413 (3.8%) |
| $12,500 to $14,999 | 361 (2.9%) | 584 (5.3%) |
| $15,000 to $17,499 | 470 (3.8%) | 427 (3.9%) |
| $17,500 to $19,999 | 201 (1.6%) | 317 (2.9%) |
| $20,000 to $22,499 | 323 (2.6%) | 434 (4.0%) |
| $22,500 to $24,999 | 354 (2.9%) | 436 (4.0%) |
| $25,000 to $29,999 | 788 (6.4%) | 1,108 (10.1%) |
| $30,000 to $34,999 | 660 (5.4%) | 972 (8.9%) |
| $35,000 to $39,999 | 682 (5.5%) | 630 (5.8%) |
| $40,000 to $44,999 | 731 (5.9%) | 546 (5.0%) |
| $45,000 to $49,999 | 575 (4.7%) | 570 (5.2%) |
| $50,000 to $54,999 | 532 (4.3%) | 387 (3.5%) |
| $55,000 to $64,999 | 1,024 (8.3%) | 832 (7.6%) |
| $65,000 to $74,999 | 859 (7.0%) | 513 (4.7%) |
| $75,000 to $99,999 | 1,392 (11.3%) | 467 (4.3%) |
| $100,000+ | 1,799 (14.6%) | 349 (3.2%) |
| Total | 12,316 (100.0%) | 10,922 (100.0%) |
Earnings by Sex by Educational Attainment in Carter County
Average earnings in Carter County are $51,746 for men and $33,367 for women, a difference of 35.5%. Men with an educational attainment of graduate degree enjoy the highest average annual earnings of $96,193, while those with less than high school education earn the least with $32,727. Women with an educational attainment of graduate degree earn the most with the average annual earnings of $55,403, while those with less than high school education have the smallest earnings of $24,643.
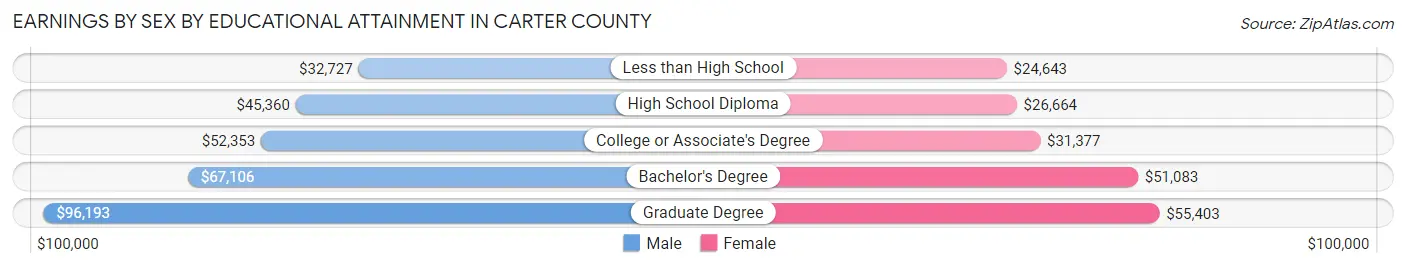
| Educational Attainment | Male Income | Female Income |
| Less than High School | $32,727 | $24,643 |
| High School Diploma | $45,360 | $26,664 |
| College or Associate's Degree | $52,353 | $31,377 |
| Bachelor's Degree | $67,106 | $51,083 |
| Graduate Degree | $96,193 | $55,403 |
| Total | $51,746 | $33,367 |
Family Income in Carter County
Family Income Brackets in Carter County
According to the Carter County family income data, there are 2,243 families falling into the $100,000 to $149,999 income range, which is the most common income bracket and makes up 18.9% of all families. Conversely, the $10,000 to $14,999 income bracket is the least frequent group with only 309 families (2.6%) belonging to this category.
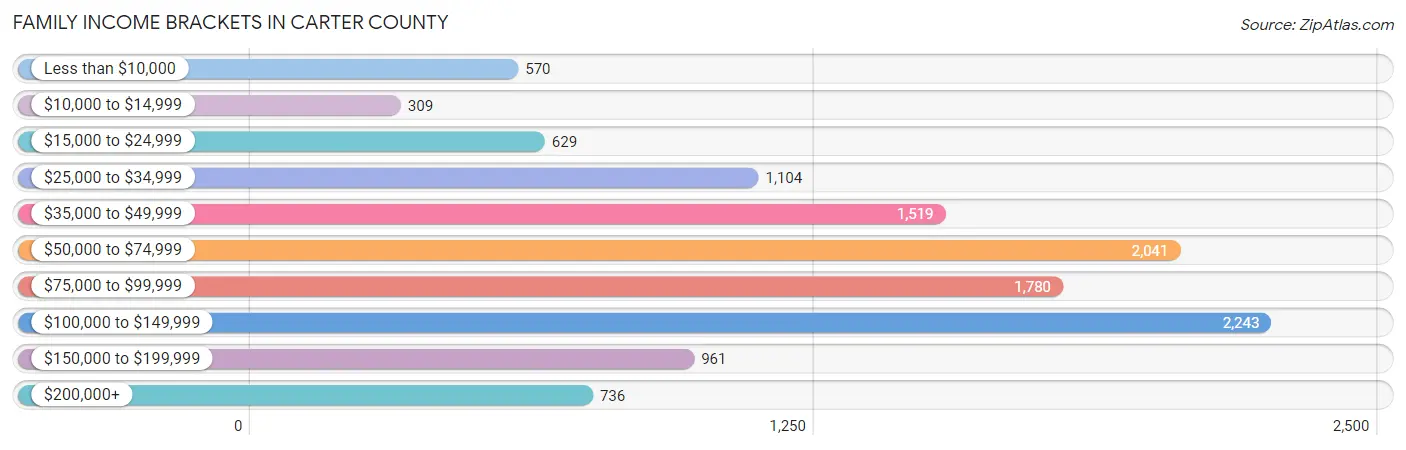
| Income Bracket | # Families | % Families |
| Less than $10,000 | 570 | 4.8% |
| $10,000 to $14,999 | 309 | 2.6% |
| $15,000 to $24,999 | 629 | 5.3% |
| $25,000 to $34,999 | 1,104 | 9.3% |
| $35,000 to $49,999 | 1,519 | 12.8% |
| $50,000 to $74,999 | 2,041 | 17.2% |
| $75,000 to $99,999 | 1,780 | 15.0% |
| $100,000 to $149,999 | 2,243 | 18.9% |
| $150,000 to $199,999 | 961 | 8.1% |
| $200,000+ | 736 | 6.2% |
Family Income by Famaliy Size in Carter County
5-person families (815 | 6.9%) account for the highest median family income in Carter County with $108,094 per family, while 2-person families (5,757 | 48.5%) have the highest median income of $31,927 per family member.
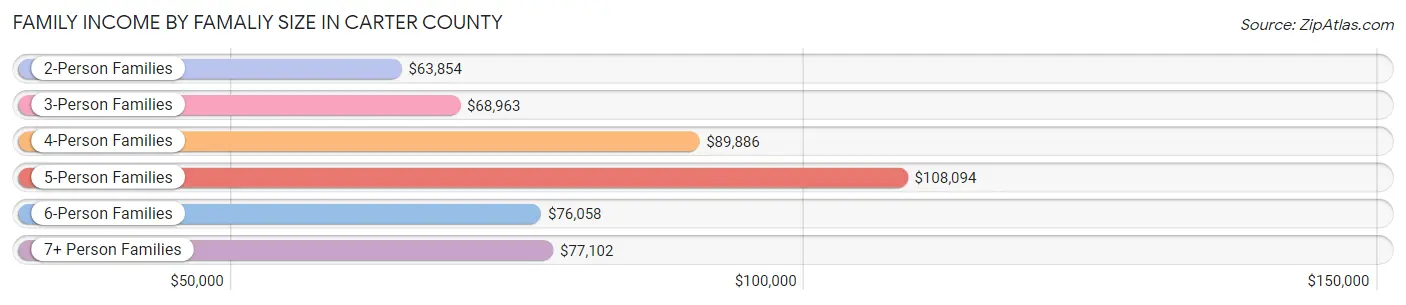
| Income Bracket | # Families | Median Income |
| 2-Person Families | 5,757 (48.5%) | $63,854 |
| 3-Person Families | 2,592 (21.8%) | $68,963 |
| 4-Person Families | 2,084 (17.6%) | $89,886 |
| 5-Person Families | 815 (6.9%) | $108,094 |
| 6-Person Families | 433 (3.6%) | $76,058 |
| 7+ Person Families | 185 (1.6%) | $77,102 |
| Total | 11,866 (100.0%) | $72,192 |
Family Income by Number of Earners in Carter County
The median family income in Carter County is $72,192, with families comprising 3+ earners (1,088) having the highest median family income of $134,485, while families with no earners (1,917) have the lowest median family income of $37,529, accounting for 9.2% and 16.2% of families, respectively.
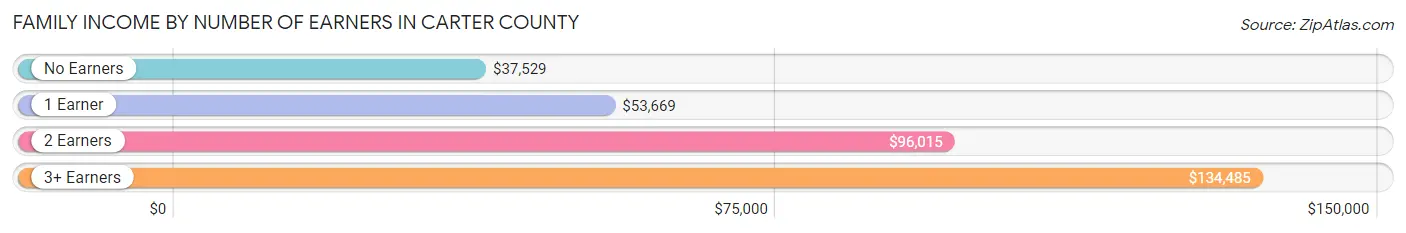
| Number of Earners | # Families | Median Income |
| No Earners | 1,917 (16.2%) | $37,529 |
| 1 Earner | 4,342 (36.6%) | $53,669 |
| 2 Earners | 4,519 (38.1%) | $96,015 |
| 3+ Earners | 1,088 (9.2%) | $134,485 |
| Total | 11,866 (100.0%) | $72,192 |
Household Income in Carter County
Household Income Brackets in Carter County
With 3,410 households falling in the category, the $50,000 to $74,999 income range is the most frequent in Carter County, accounting for 18.2% of all households. In contrast, only 731 households (3.9%) fall into the $10,000 to $14,999 income bracket, making it the least populous group.
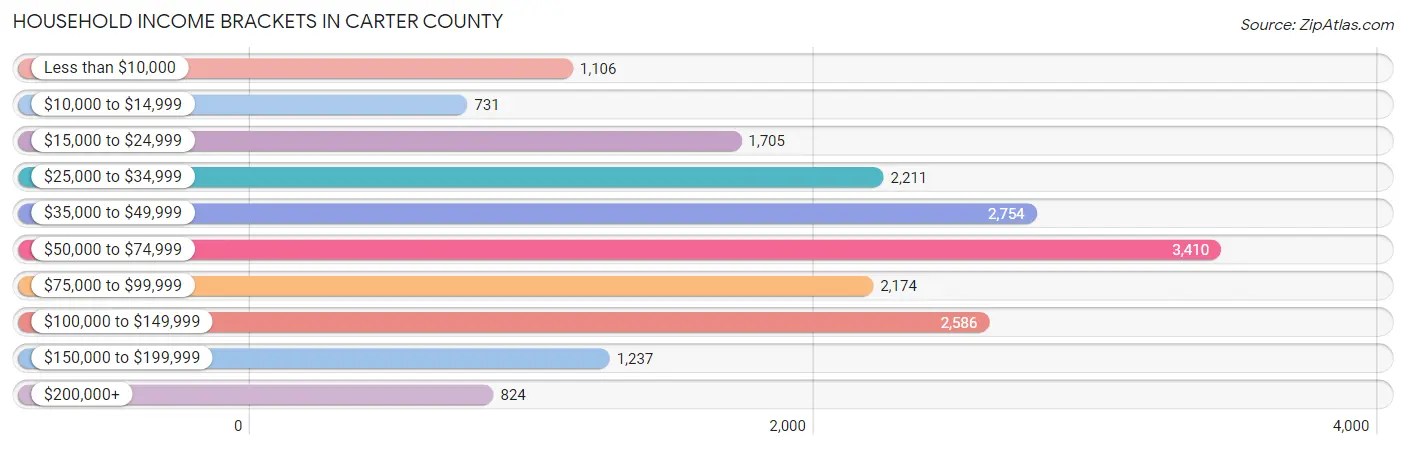
| Income Bracket | # Households | % Households |
| Less than $10,000 | 1,106 | 5.9% |
| $10,000 to $14,999 | 731 | 3.9% |
| $15,000 to $24,999 | 1,705 | 9.1% |
| $25,000 to $34,999 | 2,211 | 11.8% |
| $35,000 to $49,999 | 2,754 | 14.7% |
| $50,000 to $74,999 | 3,410 | 18.2% |
| $75,000 to $99,999 | 2,174 | 11.6% |
| $100,000 to $149,999 | 2,586 | 13.8% |
| $150,000 to $199,999 | 1,237 | 6.6% |
| $200,000+ | 824 | 4.4% |
Household Income by Householder Age in Carter County
The median household income in Carter County is $56,390, with the highest median household income of $64,692 found in the 45 to 64 years age bracket for the primary householder. A total of 6,559 households (35.0%) fall into this category. Meanwhile, the 65+ years age bracket for the primary householder has the lowest median household income of $41,235, with 5,345 households (28.5%) in this group.
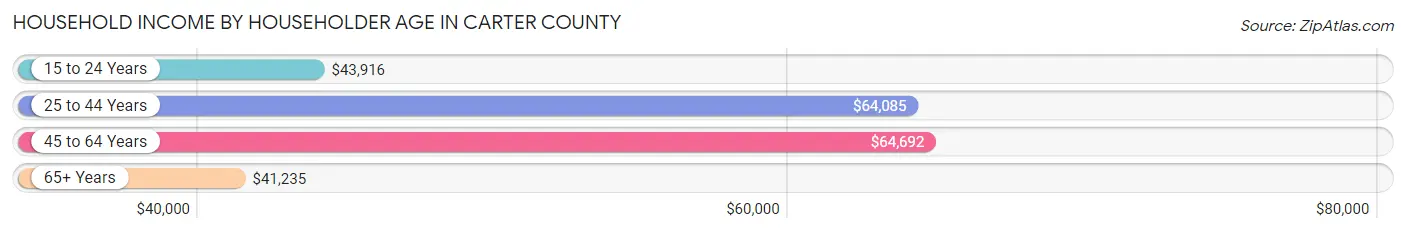
| Income Bracket | # Households | Median Income |
| 15 to 24 Years | 870 (4.6%) | $43,916 |
| 25 to 44 Years | 5,964 (31.8%) | $64,085 |
| 45 to 64 Years | 6,559 (35.0%) | $64,692 |
| 65+ Years | 5,345 (28.5%) | $41,235 |
| Total | 18,738 (100.0%) | $56,390 |
Poverty in Carter County
Income Below Poverty by Sex and Age in Carter County
With 13.7% poverty level for males and 16.9% for females among the residents of Carter County, 5 year old males and 18 to 24 year old females are the most vulnerable to poverty, with 74 males (34.3%) and 545 females (28.0%) in their respective age groups living below the poverty level.
| Age Bracket | Male | Female |
| Under 5 Years | 347 (21.4%) | 358 (24.1%) |
| 5 Years | 74 (34.3%) | 51 (21.1%) |
| 6 to 11 Years | 305 (15.2%) | 197 (9.8%) |
| 12 to 14 Years | 99 (8.6%) | 253 (23.1%) |
| 15 Years | 112 (27.5%) | 31 (7.4%) |
| 16 and 17 Years | 146 (23.3%) | 81 (13.7%) |
| 18 to 24 Years | 340 (17.1%) | 545 (28.0%) |
| 25 to 34 Years | 349 (11.6%) | 596 (19.2%) |
| 35 to 44 Years | 421 (13.9%) | 482 (16.1%) |
| 45 to 54 Years | 218 (7.9%) | 429 (15.3%) |
| 55 to 64 Years | 484 (16.6%) | 510 (16.3%) |
| 65 to 74 Years | 175 (8.1%) | 293 (11.2%) |
| 75 Years and over | 70 (6.2%) | 291 (15.4%) |
| Total | 3,140 (13.7%) | 4,117 (16.9%) |
Income Above Poverty by Sex and Age in Carter County
According to the poverty statistics in Carter County, males aged 75 years and over and females aged 15 years are the age groups that are most secure financially, with 93.8% of males and 92.6% of females in these age groups living above the poverty line.
| Age Bracket | Male | Female |
| Under 5 Years | 1,274 (78.6%) | 1,129 (75.9%) |
| 5 Years | 142 (65.7%) | 191 (78.9%) |
| 6 to 11 Years | 1,702 (84.8%) | 1,808 (90.2%) |
| 12 to 14 Years | 1,047 (91.4%) | 841 (76.9%) |
| 15 Years | 295 (72.5%) | 390 (92.6%) |
| 16 and 17 Years | 480 (76.7%) | 512 (86.3%) |
| 18 to 24 Years | 1,646 (82.9%) | 1,404 (72.0%) |
| 25 to 34 Years | 2,650 (88.4%) | 2,503 (80.8%) |
| 35 to 44 Years | 2,610 (86.1%) | 2,522 (84.0%) |
| 45 to 54 Years | 2,528 (92.1%) | 2,380 (84.7%) |
| 55 to 64 Years | 2,434 (83.4%) | 2,622 (83.7%) |
| 65 to 74 Years | 1,984 (91.9%) | 2,330 (88.8%) |
| 75 Years and over | 1,058 (93.8%) | 1,600 (84.6%) |
| Total | 19,850 (86.3%) | 20,232 (83.1%) |
Income Below Poverty Among Married-Couple Families in Carter County
The poverty statistics for married-couple families in Carter County show that 6.0% or 505 of the total 8,401 families live below the poverty line. Families with 5 or more children have the highest poverty rate of 13.0%, comprising of 9 families. On the other hand, families with 1 or 2 children have the lowest poverty rate of 5.2%, which includes 145 families.
| Children | Above Poverty | Below Poverty |
| No Children | 4,521 (94.2%) | 277 (5.8%) |
| 1 or 2 Children | 2,661 (94.8%) | 145 (5.2%) |
| 3 or 4 Children | 654 (89.8%) | 74 (10.2%) |
| 5 or more Children | 60 (87.0%) | 9 (13.0%) |
| Total | 7,896 (94.0%) | 505 (6.0%) |
Income Below Poverty Among Single-Parent Households in Carter County
According to the poverty data in Carter County, 13.8% or 132 single-father households and 33.4% or 838 single-mother households are living below the poverty line. Among single-father households, those with 5 or more children have the highest poverty rate, with 10 households (52.6%) experiencing poverty. Likewise, among single-mother households, those with 3 or 4 children have the highest poverty rate, with 159 households (53.7%) falling below the poverty line.
| Children | Single Father | Single Mother |
| No Children | 13 (4.6%) | 131 (17.4%) |
| 1 or 2 Children | 87 (15.8%) | 548 (38.2%) |
| 3 or 4 Children | 22 (20.2%) | 159 (53.7%) |
| 5 or more Children | 10 (52.6%) | 0 (0.0%) |
| Total | 132 (13.8%) | 838 (33.4%) |
Income Below Poverty Among Married-Couple vs Single-Parent Households in Carter County
The poverty data for Carter County shows that 505 of the married-couple family households (6.0%) and 970 of the single-parent households (28.0%) are living below the poverty level. Within the married-couple family households, those with 5 or more children have the highest poverty rate, with 9 households (13.0%) falling below the poverty line. Among the single-parent households, those with 3 or 4 children have the highest poverty rate, with 181 household (44.7%) living below poverty.
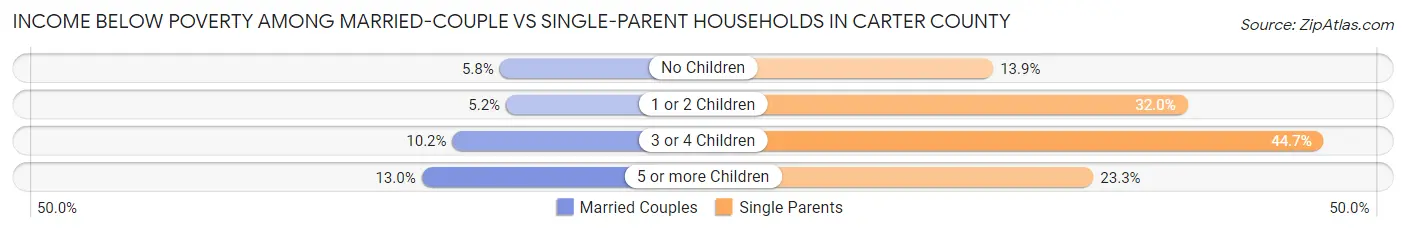
| Children | Married-Couple Families | Single-Parent Households |
| No Children | 277 (5.8%) | 144 (13.9%) |
| 1 or 2 Children | 145 (5.2%) | 635 (32.0%) |
| 3 or 4 Children | 74 (10.2%) | 181 (44.7%) |
| 5 or more Children | 9 (13.0%) | 10 (23.3%) |
| Total | 505 (6.0%) | 970 (28.0%) |
Employment Characteristics in Carter County
Employment by Class of Employer in Carter County
Among the 21,047 employed individuals in Carter County, private company employees (14,450 | 68.7%), not-for-profit organizations (1,731 | 8.2%), and self-employed (not incorporated) (1,217 | 5.8%) make up the most common classes of employment.
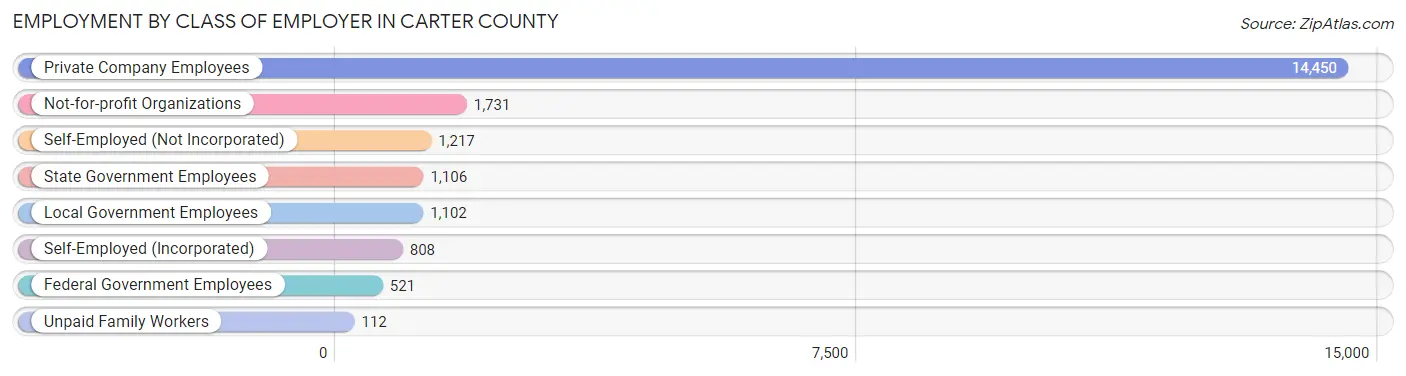
| Employer Class | # Employees | % Employees |
| Private Company Employees | 14,450 | 68.7% |
| Self-Employed (Incorporated) | 808 | 3.8% |
| Self-Employed (Not Incorporated) | 1,217 | 5.8% |
| Not-for-profit Organizations | 1,731 | 8.2% |
| Local Government Employees | 1,102 | 5.2% |
| State Government Employees | 1,106 | 5.2% |
| Federal Government Employees | 521 | 2.5% |
| Unpaid Family Workers | 112 | 0.5% |
| Total | 21,047 | 100.0% |
Employment Status by Age in Carter County
According to the labor force statistics for Carter County, out of the total population over 16 years of age (37,336), 59.7% or 22,290 individuals are in the labor force, with 4.2% or 936 of them unemployed. The age group with the highest labor force participation rate is 30 to 34 years, with 82.8% or 2,510 individuals in the labor force. Within the labor force, the 20 to 24 years age range has the highest percentage of unemployed individuals, with 10.9% or 226 of them being unemployed.
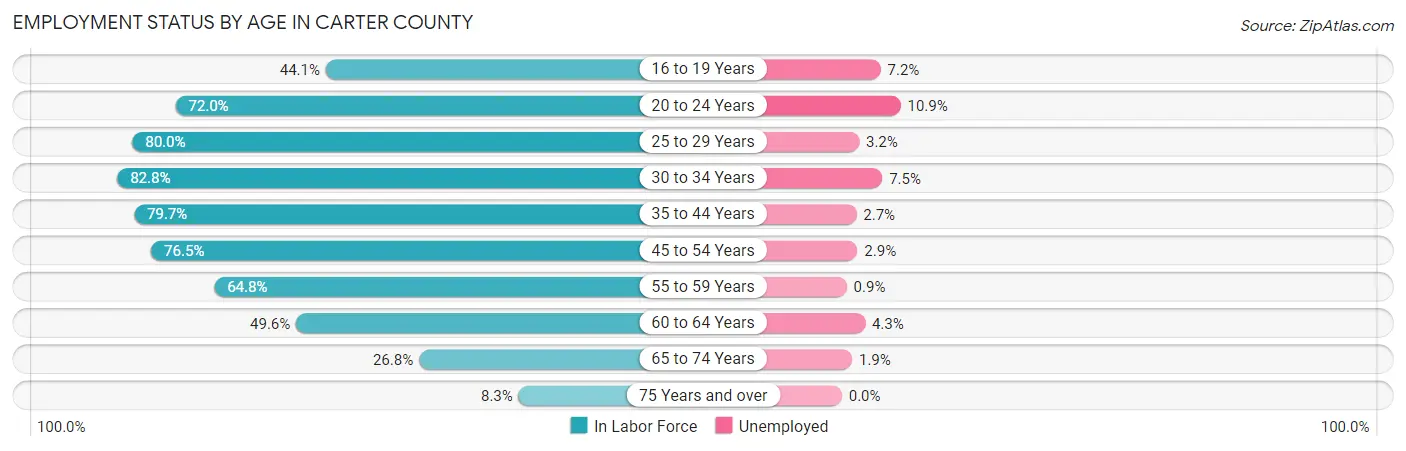
| Age Bracket | In Labor Force | Unemployed |
| 16 to 19 Years | 1,026 (44.1%) | 74 (7.2%) |
| 20 to 24 Years | 2,071 (72.0%) | 226 (10.9%) |
| 25 to 29 Years | 2,509 (80.0%) | 80 (3.2%) |
| 30 to 34 Years | 2,510 (82.8%) | 188 (7.5%) |
| 35 to 44 Years | 4,859 (79.7%) | 131 (2.7%) |
| 45 to 54 Years | 4,271 (76.5%) | 124 (2.9%) |
| 55 to 59 Years | 1,914 (64.8%) | 17 (0.9%) |
| 60 to 64 Years | 1,567 (49.6%) | 67 (4.3%) |
| 65 to 74 Years | 1,292 (26.8%) | 25 (1.9%) |
| 75 Years and over | 278 (8.3%) | 0 (0.0%) |
| Total | 22,290 (59.7%) | 936 (4.2%) |
Employment Status by Educational Attainment in Carter County
According to labor force statistics for Carter County, 73.6% of individuals (17,635) out of the total population between 25 and 64 years of age (23,960) are in the labor force, with 3.4% or 600 of them being unemployed. The group with the highest labor force participation rate are those with the educational attainment of bachelor's degree or higher, with 88.7% or 4,090 individuals in the labor force. Within the labor force, individuals with less than high school education have the highest percentage of unemployment, with 7.4% or 122 of them being unemployed.
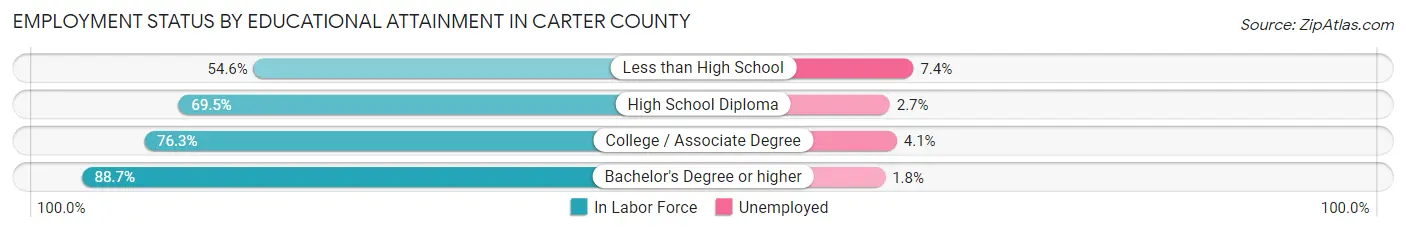
| Educational Attainment | In Labor Force | Unemployed |
| Less than High School | 1,649 (54.6%) | 223 (7.4%) |
| High School Diploma | 5,872 (69.5%) | 228 (2.7%) |
| College / Associate Degree | 6,012 (76.3%) | 323 (4.1%) |
| Bachelor's Degree or higher | 4,090 (88.7%) | 83 (1.8%) |
| Total | 17,635 (73.6%) | 815 (3.4%) |
Employment Occupations by Sex in Carter County
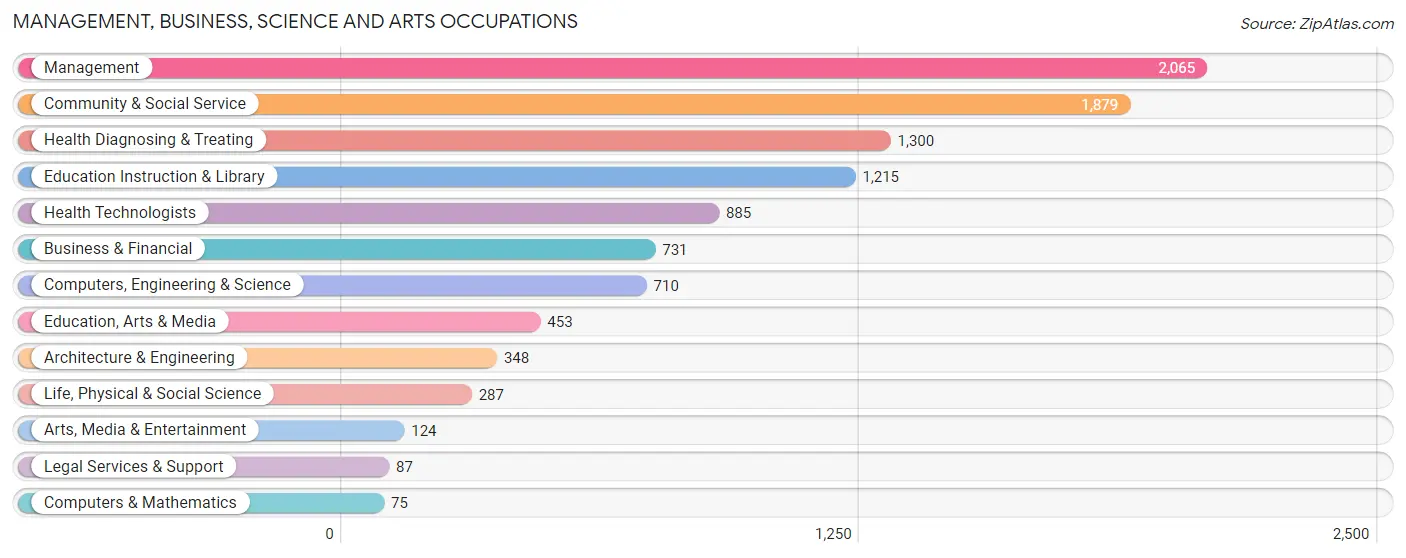
Management, Business, Science and Arts Occupations
The most common Management, Business, Science and Arts occupations in Carter County are Management (2,065 | 9.7%), Community & Social Service (1,879 | 8.8%), Health Diagnosing & Treating (1,300 | 6.1%), Education Instruction & Library (1,215 | 5.7%), and Health Technologists (885 | 4.1%).
Management, Business, Science and Arts Occupations by Sex
Within the Management, Business, Science and Arts occupations in Carter County, the most male-oriented occupations are Architecture & Engineering (92.5%), Computers, Engineering & Science (83.8%), and Computers & Mathematics (81.3%), while the most female-oriented occupations are Education Instruction & Library (81.0%), Health Diagnosing & Treating (78.5%), and Health Technologists (78.4%).
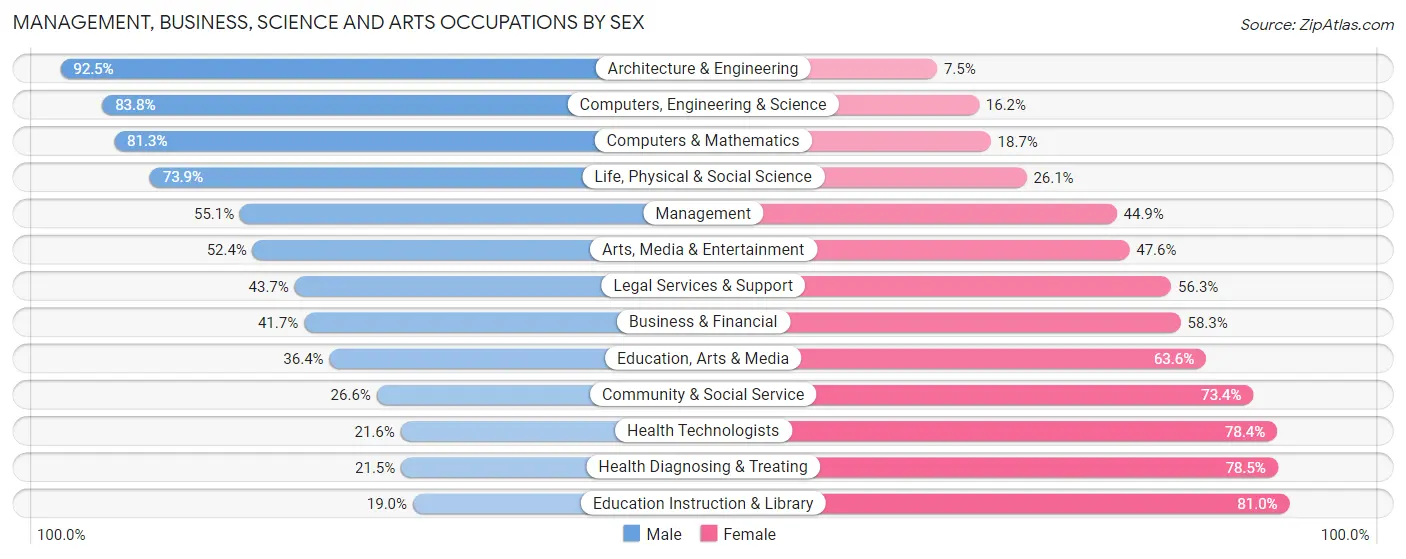
| Occupation | Male | Female |
| Management | 1,137 (55.1%) | 928 (44.9%) |
| Business & Financial | 305 (41.7%) | 426 (58.3%) |
| Computers, Engineering & Science | 595 (83.8%) | 115 (16.2%) |
| Computers & Mathematics | 61 (81.3%) | 14 (18.7%) |
| Architecture & Engineering | 322 (92.5%) | 26 (7.5%) |
| Life, Physical & Social Science | 212 (73.9%) | 75 (26.1%) |
| Community & Social Service | 499 (26.6%) | 1,380 (73.4%) |
| Education, Arts & Media | 165 (36.4%) | 288 (63.6%) |
| Legal Services & Support | 38 (43.7%) | 49 (56.3%) |
| Education Instruction & Library | 231 (19.0%) | 984 (81.0%) |
| Arts, Media & Entertainment | 65 (52.4%) | 59 (47.6%) |
| Health Diagnosing & Treating | 279 (21.5%) | 1,021 (78.5%) |
| Health Technologists | 191 (21.6%) | 694 (78.4%) |
| Total (Category) | 2,815 (42.1%) | 3,870 (57.9%) |
| Total (Overall) | 11,362 (53.2%) | 10,004 (46.8%) |
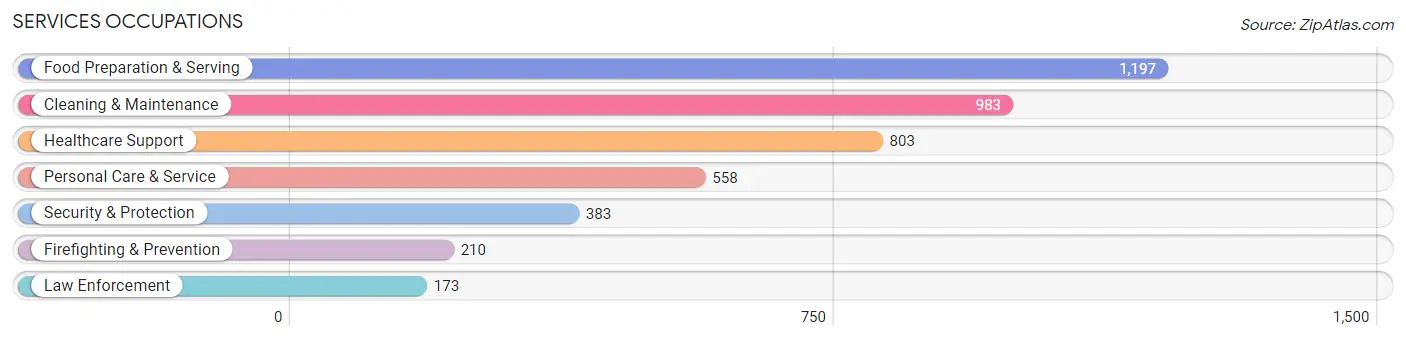
Services Occupations
The most common Services occupations in Carter County are Food Preparation & Serving (1,197 | 5.6%), Cleaning & Maintenance (983 | 4.6%), Healthcare Support (803 | 3.8%), Personal Care & Service (558 | 2.6%), and Security & Protection (383 | 1.8%).
Services Occupations by Sex
Within the Services occupations in Carter County, the most male-oriented occupations are Law Enforcement (75.7%), Security & Protection (71.0%), and Firefighting & Prevention (67.1%), while the most female-oriented occupations are Healthcare Support (92.1%), Personal Care & Service (79.6%), and Food Preparation & Serving (70.3%).
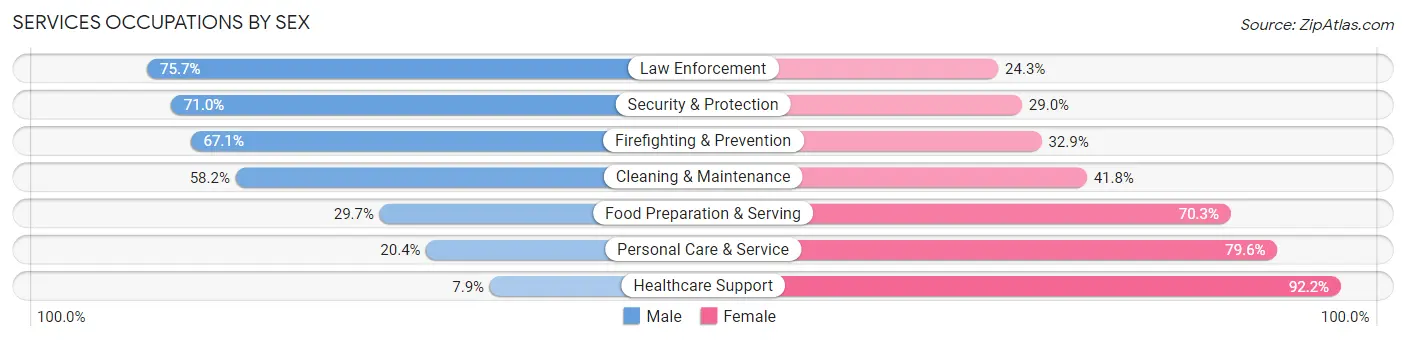
| Occupation | Male | Female |
| Healthcare Support | 63 (7.9%) | 740 (92.1%) |
| Security & Protection | 272 (71.0%) | 111 (29.0%) |
| Firefighting & Prevention | 141 (67.1%) | 69 (32.9%) |
| Law Enforcement | 131 (75.7%) | 42 (24.3%) |
| Food Preparation & Serving | 355 (29.7%) | 842 (70.3%) |
| Cleaning & Maintenance | 572 (58.2%) | 411 (41.8%) |
| Personal Care & Service | 114 (20.4%) | 444 (79.6%) |
| Total (Category) | 1,376 (35.1%) | 2,548 (64.9%) |
| Total (Overall) | 11,362 (53.2%) | 10,004 (46.8%) |
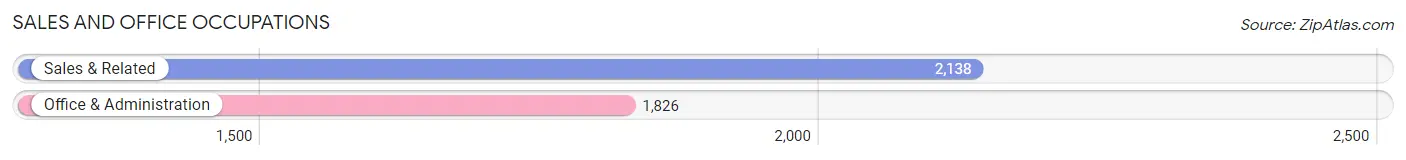
Sales and Office Occupations
The most common Sales and Office occupations in Carter County are Sales & Related (2,138 | 10.0%), and Office & Administration (1,826 | 8.6%).
Sales and Office Occupations by Sex
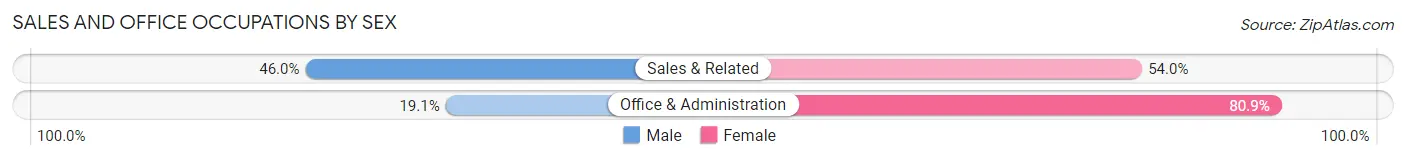
| Occupation | Male | Female |
| Sales & Related | 984 (46.0%) | 1,154 (54.0%) |
| Office & Administration | 348 (19.1%) | 1,478 (80.9%) |
| Total (Category) | 1,332 (33.6%) | 2,632 (66.4%) |
| Total (Overall) | 11,362 (53.2%) | 10,004 (46.8%) |
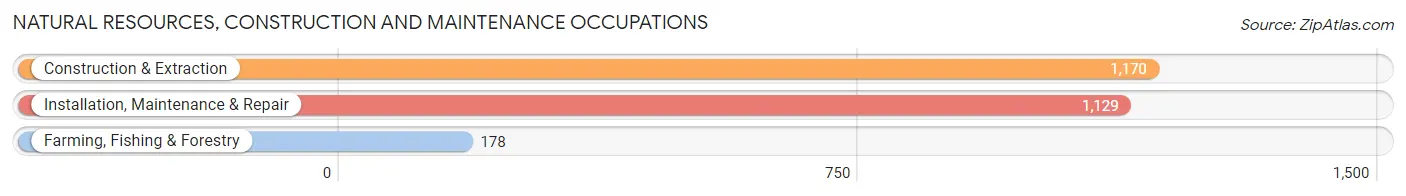
Natural Resources, Construction and Maintenance Occupations
The most common Natural Resources, Construction and Maintenance occupations in Carter County are Construction & Extraction (1,170 | 5.5%), Installation, Maintenance & Repair (1,129 | 5.3%), and Farming, Fishing & Forestry (178 | 0.8%).
Natural Resources, Construction and Maintenance Occupations by Sex
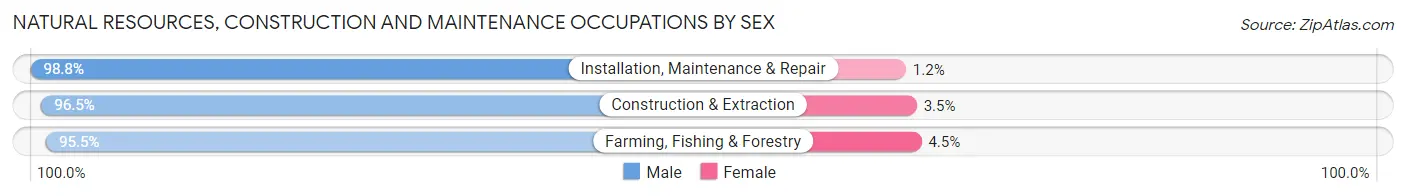
| Occupation | Male | Female |
| Farming, Fishing & Forestry | 170 (95.5%) | 8 (4.5%) |
| Construction & Extraction | 1,129 (96.5%) | 41 (3.5%) |
| Installation, Maintenance & Repair | 1,115 (98.8%) | 14 (1.2%) |
| Total (Category) | 2,414 (97.5%) | 63 (2.5%) |
| Total (Overall) | 11,362 (53.2%) | 10,004 (46.8%) |
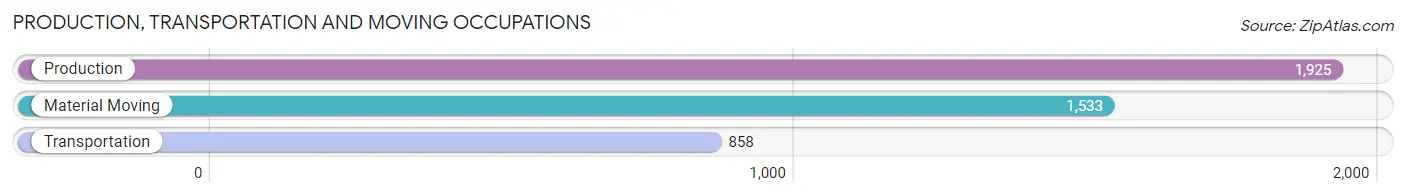
Production, Transportation and Moving Occupations
The most common Production, Transportation and Moving occupations in Carter County are Production (1,925 | 9.0%), Material Moving (1,533 | 7.2%), and Transportation (858 | 4.0%).
Production, Transportation and Moving Occupations by Sex
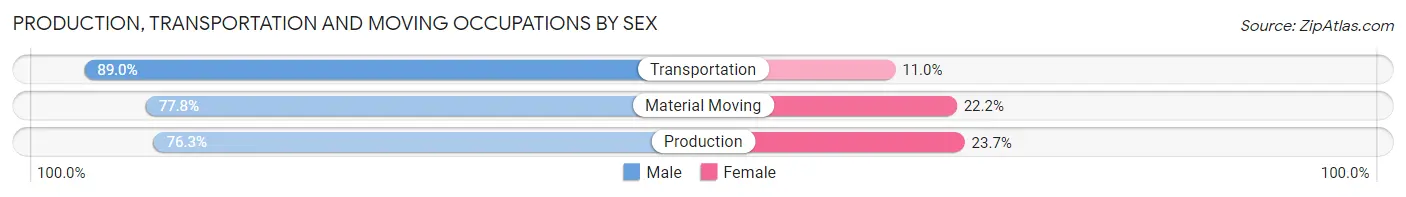
| Occupation | Male | Female |
| Production | 1,469 (76.3%) | 456 (23.7%) |
| Transportation | 764 (89.0%) | 94 (11.0%) |
| Material Moving | 1,192 (77.8%) | 341 (22.2%) |
| Total (Category) | 3,425 (79.4%) | 891 (20.6%) |
| Total (Overall) | 11,362 (53.2%) | 10,004 (46.8%) |
Employment Industries by Sex in Carter County
Employment Industries in Carter County
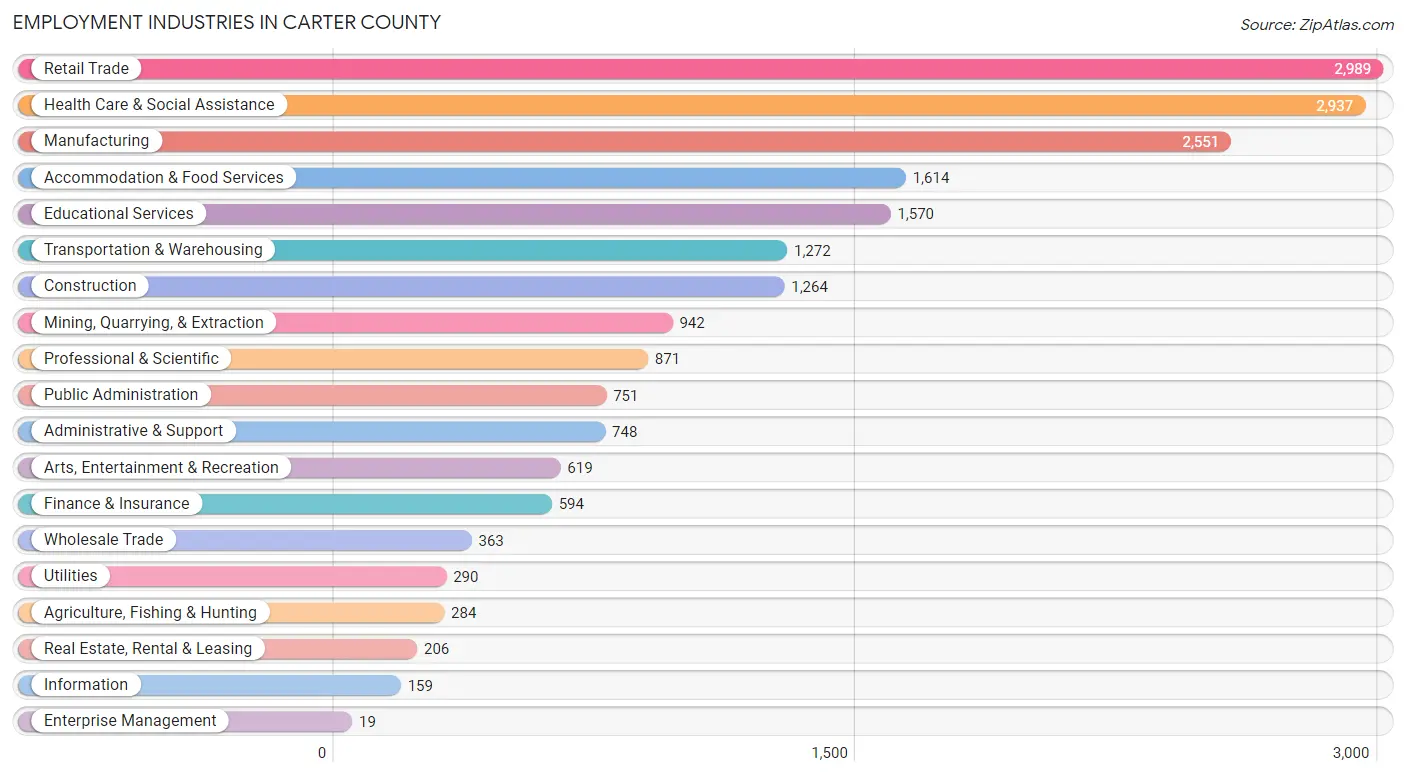
The major employment industries in Carter County include Retail Trade (2,989 | 14.0%), Health Care & Social Assistance (2,937 | 13.8%), Manufacturing (2,551 | 11.9%), Accommodation & Food Services (1,614 | 7.5%), and Educational Services (1,570 | 7.3%).
Employment Industries by Sex in Carter County
The Carter County industries that see more men than women are Enterprise Management (100.0%), Mining, Quarrying, & Extraction (92.5%), and Agriculture, Fishing & Hunting (89.4%), whereas the industries that tend to have a higher number of women are Health Care & Social Assistance (84.1%), Educational Services (72.9%), and Finance & Insurance (69.9%).
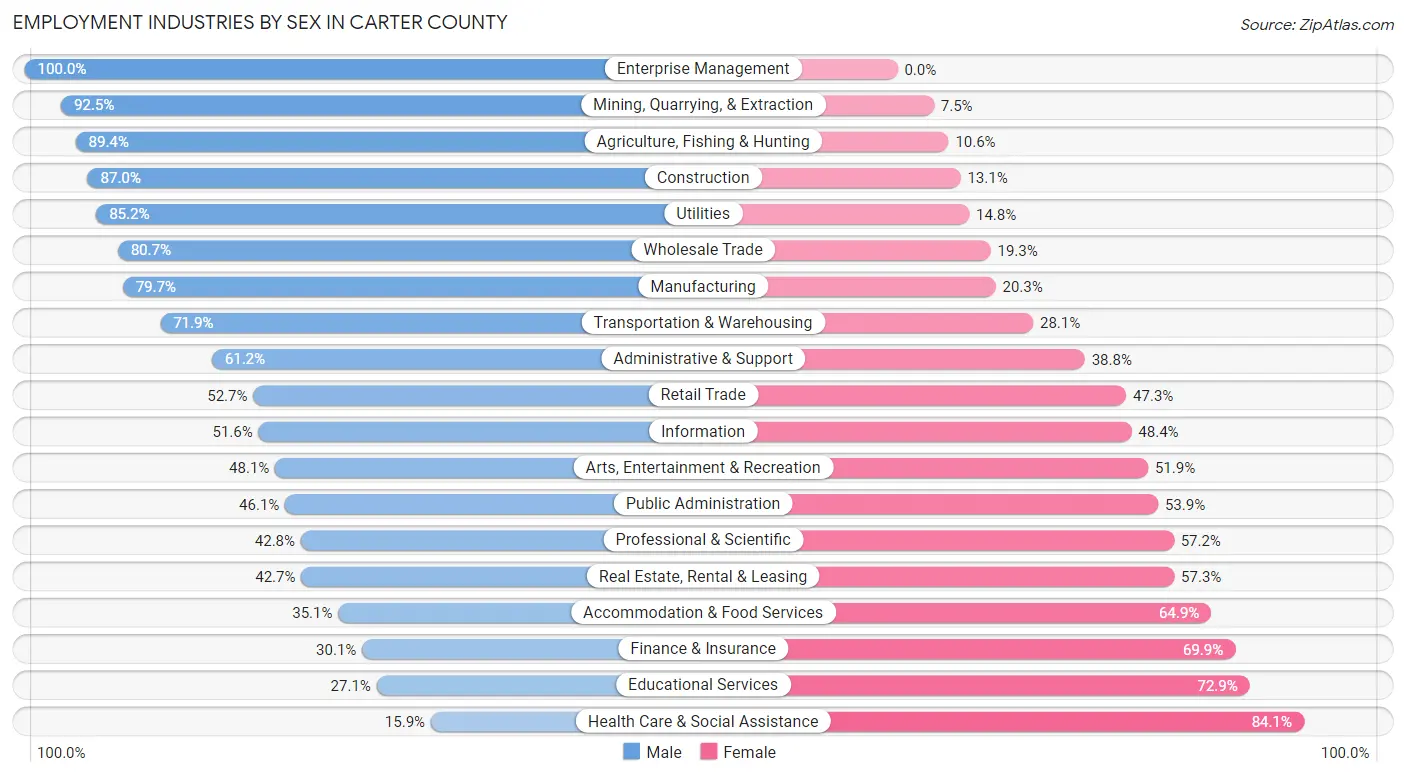
| Industry | Male | Female |
| Agriculture, Fishing & Hunting | 254 (89.4%) | 30 (10.6%) |
| Mining, Quarrying, & Extraction | 871 (92.5%) | 71 (7.5%) |
| Construction | 1,099 (87.0%) | 165 (13.1%) |
| Manufacturing | 2,033 (79.7%) | 518 (20.3%) |
| Wholesale Trade | 293 (80.7%) | 70 (19.3%) |
| Retail Trade | 1,574 (52.7%) | 1,415 (47.3%) |
| Transportation & Warehousing | 915 (71.9%) | 357 (28.1%) |
| Utilities | 247 (85.2%) | 43 (14.8%) |
| Information | 82 (51.6%) | 77 (48.4%) |
| Finance & Insurance | 179 (30.1%) | 415 (69.9%) |
| Real Estate, Rental & Leasing | 88 (42.7%) | 118 (57.3%) |
| Professional & Scientific | 373 (42.8%) | 498 (57.2%) |
| Enterprise Management | 19 (100.0%) | 0 (0.0%) |
| Administrative & Support | 458 (61.2%) | 290 (38.8%) |
| Educational Services | 426 (27.1%) | 1,144 (72.9%) |
| Health Care & Social Assistance | 467 (15.9%) | 2,470 (84.1%) |
| Arts, Entertainment & Recreation | 298 (48.1%) | 321 (51.9%) |
| Accommodation & Food Services | 566 (35.1%) | 1,048 (64.9%) |
| Public Administration | 346 (46.1%) | 405 (53.9%) |
| Total | 11,362 (53.2%) | 10,004 (46.8%) |
Education in Carter County
School Enrollment in Carter County
The most common levels of schooling among the 11,099 students in Carter County are middle school (3,015 | 27.2%), elementary school (2,756 | 24.8%), and high school (2,569 | 23.2%).
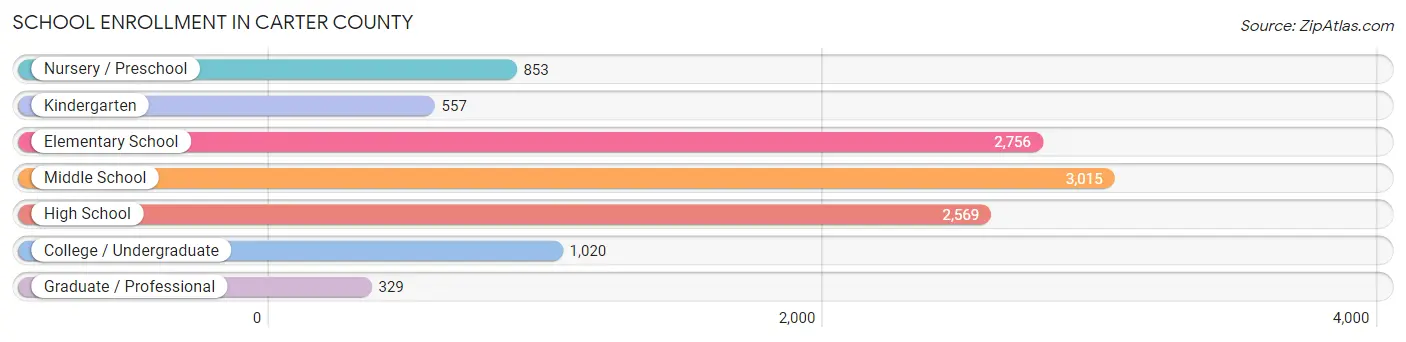
| School Level | # Students | % Students |
| Nursery / Preschool | 853 | 7.7% |
| Kindergarten | 557 | 5.0% |
| Elementary School | 2,756 | 24.8% |
| Middle School | 3,015 | 27.2% |
| High School | 2,569 | 23.2% |
| College / Undergraduate | 1,020 | 9.2% |
| Graduate / Professional | 329 | 3.0% |
| Total | 11,099 | 100.0% |
School Enrollment by Age by Funding Source in Carter County
Out of a total of 11,099 students who are enrolled in schools in Carter County, 1,254 (11.3%) attend a private institution, while the remaining 9,845 (88.7%) are enrolled in public schools. The age group of 3 to 4 year olds has the highest likelihood of being enrolled in private schools, with 220 (32.3% in the age bracket) enrolled. Conversely, the age group of 18 to 19 year olds has the lowest likelihood of being enrolled in a private school, with 632 (96.2% in the age bracket) attending a public institution.
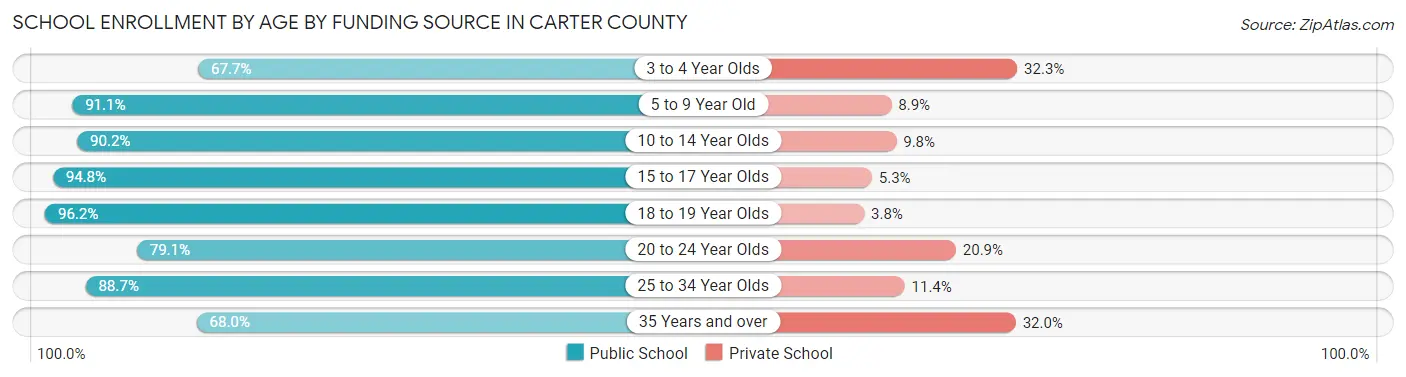
| Age Bracket | Public School | Private School |
| 3 to 4 Year Olds | 461 (67.7%) | 220 (32.3%) |
| 5 to 9 Year Old | 2,503 (91.1%) | 244 (8.9%) |
| 10 to 14 Year Olds | 3,386 (90.2%) | 368 (9.8%) |
| 15 to 17 Year Olds | 1,878 (94.8%) | 104 (5.2%) |
| 18 to 19 Year Olds | 632 (96.2%) | 25 (3.8%) |
| 20 to 24 Year Olds | 420 (79.1%) | 111 (20.9%) |
| 25 to 34 Year Olds | 250 (88.6%) | 32 (11.4%) |
| 35 Years and over | 316 (68.0%) | 149 (32.0%) |
| Total | 9,845 (88.7%) | 1,254 (11.3%) |
Educational Attainment by Field of Study in Carter County
Business (1,202 | 17.4%), education (1,198 | 17.3%), bio, nature & agricultural (874 | 12.6%), science & technology (792 | 11.4%), and arts & humanities (511 | 7.4%) are the most common fields of study among 6,925 individuals in Carter County who have obtained a bachelor's degree or higher.
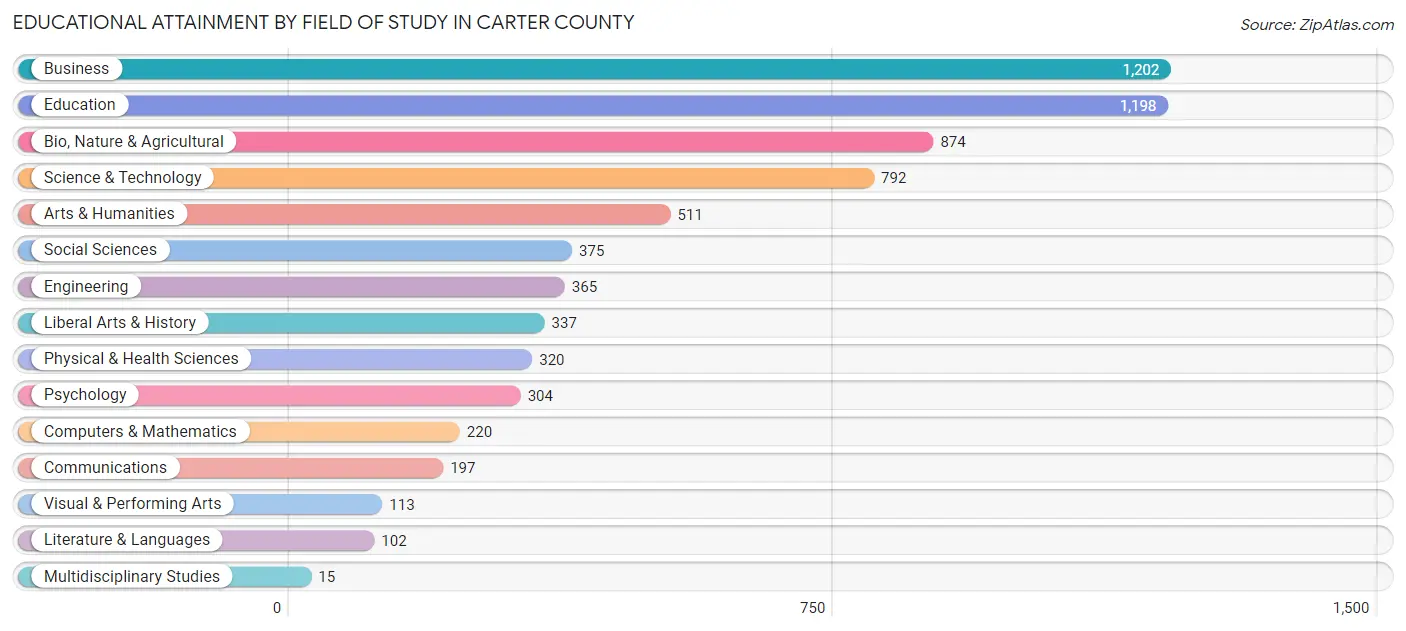
| Field of Study | # Graduates | % Graduates |
| Computers & Mathematics | 220 | 3.2% |
| Bio, Nature & Agricultural | 874 | 12.6% |
| Physical & Health Sciences | 320 | 4.6% |
| Psychology | 304 | 4.4% |
| Social Sciences | 375 | 5.4% |
| Engineering | 365 | 5.3% |
| Multidisciplinary Studies | 15 | 0.2% |
| Science & Technology | 792 | 11.4% |
| Business | 1,202 | 17.4% |
| Education | 1,198 | 17.3% |
| Literature & Languages | 102 | 1.5% |
| Liberal Arts & History | 337 | 4.9% |
| Visual & Performing Arts | 113 | 1.6% |
| Communications | 197 | 2.8% |
| Arts & Humanities | 511 | 7.4% |
| Total | 6,925 | 100.0% |
Transportation & Commute in Carter County
Vehicle Availability by Sex in Carter County
The most prevalent vehicle ownership categories in Carter County are males with 2 vehicles (4,796, accounting for 42.8%) and females with 2 vehicles (3,906, making up 49.1%).
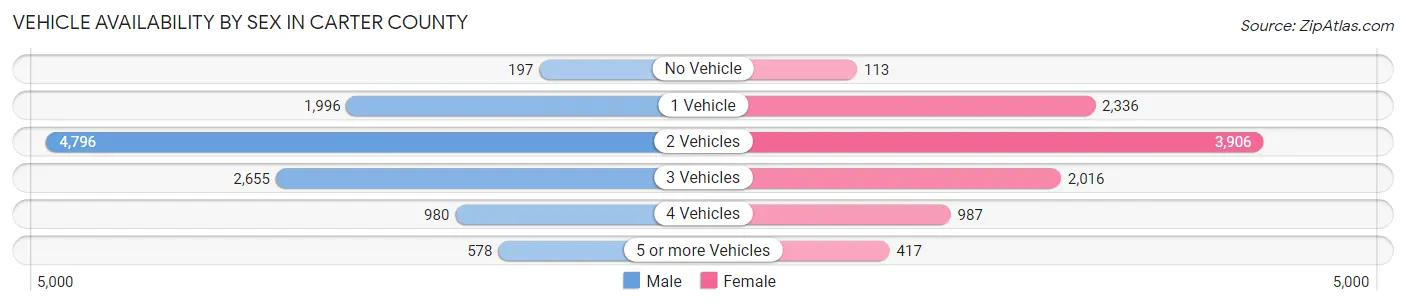
| Vehicles Available | Male | Female |
| No Vehicle | 197 (1.8%) | 113 (1.2%) |
| 1 Vehicle | 1,996 (17.8%) | 2,336 (23.9%) |
| 2 Vehicles | 4,796 (42.8%) | 3,906 (40.0%) |
| 3 Vehicles | 2,655 (23.7%) | 2,016 (20.6%) |
| 4 Vehicles | 980 (8.7%) | 987 (10.1%) |
| 5 or more Vehicles | 578 (5.2%) | 417 (4.3%) |
| Total | 11,202 (100.0%) | 9,775 (100.0%) |
Commute Time in Carter County
The most frequently occuring commute durations in Carter County are 5 to 9 minutes (4,234 commuters, 20.8%), 10 to 14 minutes (4,037 commuters, 19.9%), and 15 to 19 minutes (3,342 commuters, 16.5%).
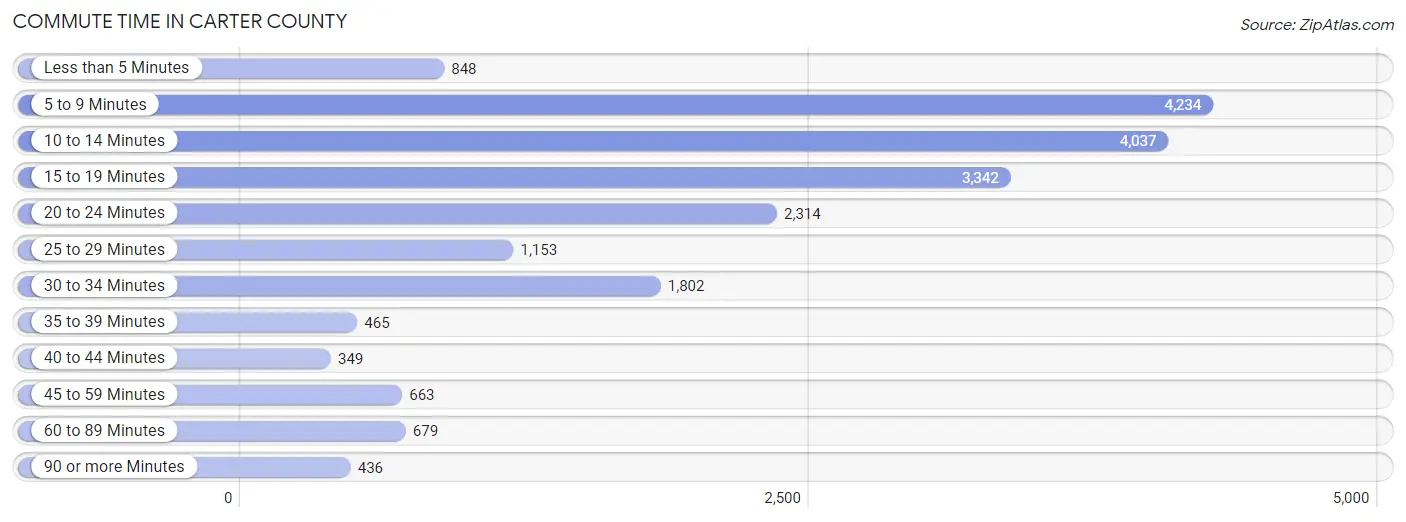
| Commute Time | # Commuters | % Commuters |
| Less than 5 Minutes | 848 | 4.2% |
| 5 to 9 Minutes | 4,234 | 20.8% |
| 10 to 14 Minutes | 4,037 | 19.9% |
| 15 to 19 Minutes | 3,342 | 16.5% |
| 20 to 24 Minutes | 2,314 | 11.4% |
| 25 to 29 Minutes | 1,153 | 5.7% |
| 30 to 34 Minutes | 1,802 | 8.9% |
| 35 to 39 Minutes | 465 | 2.3% |
| 40 to 44 Minutes | 349 | 1.7% |
| 45 to 59 Minutes | 663 | 3.3% |
| 60 to 89 Minutes | 679 | 3.3% |
| 90 or more Minutes | 436 | 2.1% |
Commute Time by Sex in Carter County
The most common commute times in Carter County are 10 to 14 minutes (2,033 commuters, 18.7%) for males and 5 to 9 minutes (2,274 commuters, 24.1%) for females.
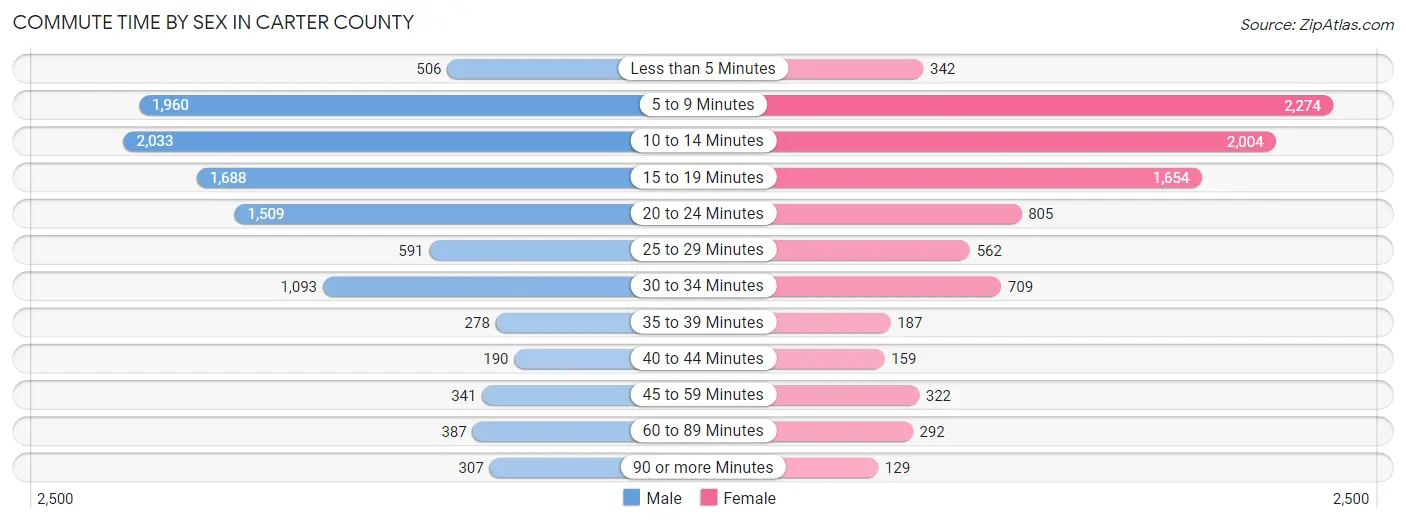
| Commute Time | Male | Female |
| Less than 5 Minutes | 506 (4.6%) | 342 (3.6%) |
| 5 to 9 Minutes | 1,960 (18.0%) | 2,274 (24.1%) |
| 10 to 14 Minutes | 2,033 (18.7%) | 2,004 (21.2%) |
| 15 to 19 Minutes | 1,688 (15.5%) | 1,654 (17.5%) |
| 20 to 24 Minutes | 1,509 (13.9%) | 805 (8.5%) |
| 25 to 29 Minutes | 591 (5.4%) | 562 (5.9%) |
| 30 to 34 Minutes | 1,093 (10.0%) | 709 (7.5%) |
| 35 to 39 Minutes | 278 (2.5%) | 187 (2.0%) |
| 40 to 44 Minutes | 190 (1.8%) | 159 (1.7%) |
| 45 to 59 Minutes | 341 (3.1%) | 322 (3.4%) |
| 60 to 89 Minutes | 387 (3.6%) | 292 (3.1%) |
| 90 or more Minutes | 307 (2.8%) | 129 (1.4%) |
Time of Departure to Work by Sex in Carter County
The most frequent times of departure to work in Carter County are 6:00 AM to 6:29 AM (1,445, 13.3%) for males and 7:30 AM to 7:59 AM (1,834, 19.4%) for females.
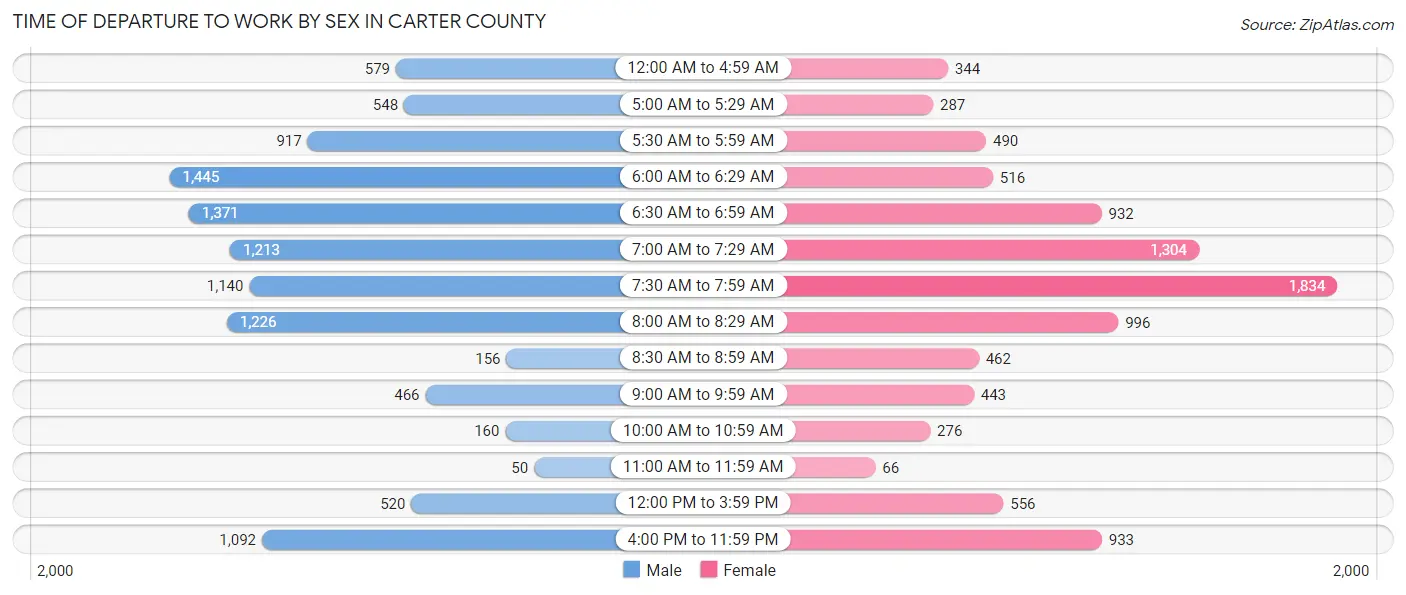
| Time of Departure | Male | Female |
| 12:00 AM to 4:59 AM | 579 (5.3%) | 344 (3.6%) |
| 5:00 AM to 5:29 AM | 548 (5.0%) | 287 (3.0%) |
| 5:30 AM to 5:59 AM | 917 (8.4%) | 490 (5.2%) |
| 6:00 AM to 6:29 AM | 1,445 (13.3%) | 516 (5.5%) |
| 6:30 AM to 6:59 AM | 1,371 (12.6%) | 932 (9.9%) |
| 7:00 AM to 7:29 AM | 1,213 (11.2%) | 1,304 (13.8%) |
| 7:30 AM to 7:59 AM | 1,140 (10.5%) | 1,834 (19.4%) |
| 8:00 AM to 8:29 AM | 1,226 (11.3%) | 996 (10.5%) |
| 8:30 AM to 8:59 AM | 156 (1.4%) | 462 (4.9%) |
| 9:00 AM to 9:59 AM | 466 (4.3%) | 443 (4.7%) |
| 10:00 AM to 10:59 AM | 160 (1.5%) | 276 (2.9%) |
| 11:00 AM to 11:59 AM | 50 (0.5%) | 66 (0.7%) |
| 12:00 PM to 3:59 PM | 520 (4.8%) | 556 (5.9%) |
| 4:00 PM to 11:59 PM | 1,092 (10.0%) | 933 (9.9%) |
| Total | 10,883 (100.0%) | 9,439 (100.0%) |
Housing Occupancy in Carter County
Occupancy by Ownership in Carter County
Of the total 18,738 dwellings in Carter County, owner-occupied units account for 12,627 (67.4%), while renter-occupied units make up 6,111 (32.6%).
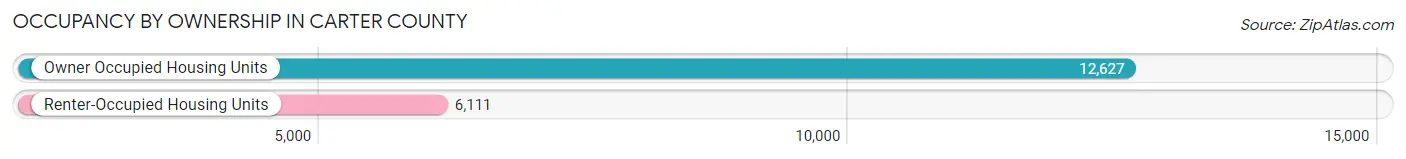
| Occupancy | # Housing Units | % Housing Units |
| Owner Occupied Housing Units | 12,627 | 67.4% |
| Renter-Occupied Housing Units | 6,111 | 32.6% |
| Total Occupied Housing Units | 18,738 | 100.0% |
Occupancy by Household Size in Carter County
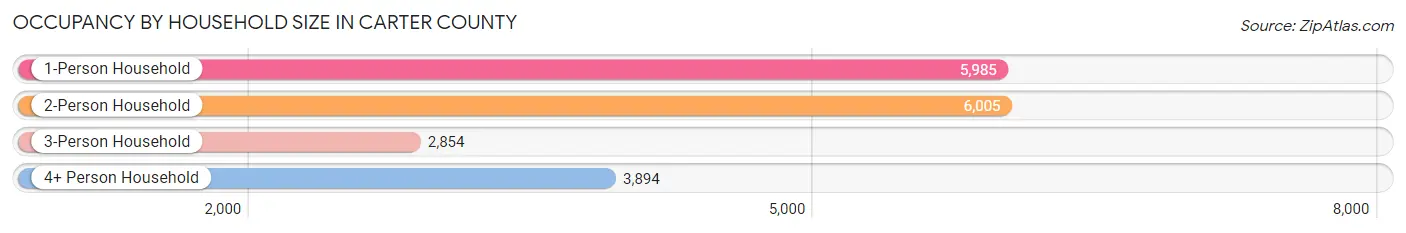
| Household Size | # Housing Units | % Housing Units |
| 1-Person Household | 5,985 | 31.9% |
| 2-Person Household | 6,005 | 32.1% |
| 3-Person Household | 2,854 | 15.2% |
| 4+ Person Household | 3,894 | 20.8% |
| Total Housing Units | 18,738 | 100.0% |
Occupancy by Ownership by Household Size in Carter County
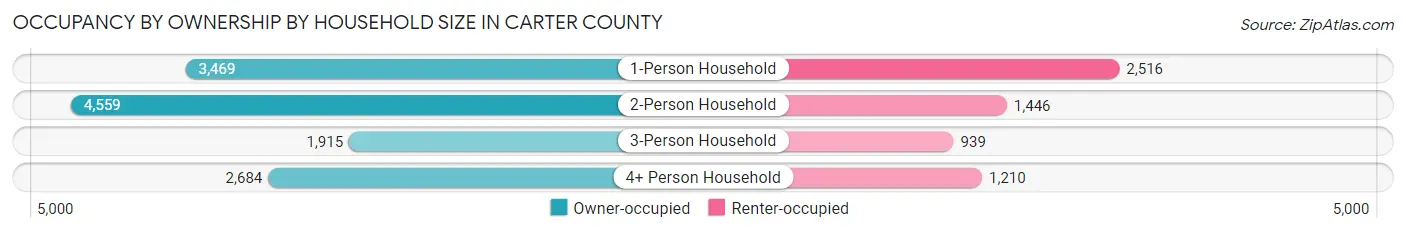
| Household Size | Owner-occupied | Renter-occupied |
| 1-Person Household | 3,469 (58.0%) | 2,516 (42.0%) |
| 2-Person Household | 4,559 (75.9%) | 1,446 (24.1%) |
| 3-Person Household | 1,915 (67.1%) | 939 (32.9%) |
| 4+ Person Household | 2,684 (68.9%) | 1,210 (31.1%) |
| Total Housing Units | 12,627 (67.4%) | 6,111 (32.6%) |
Occupancy by Educational Attainment in Carter County
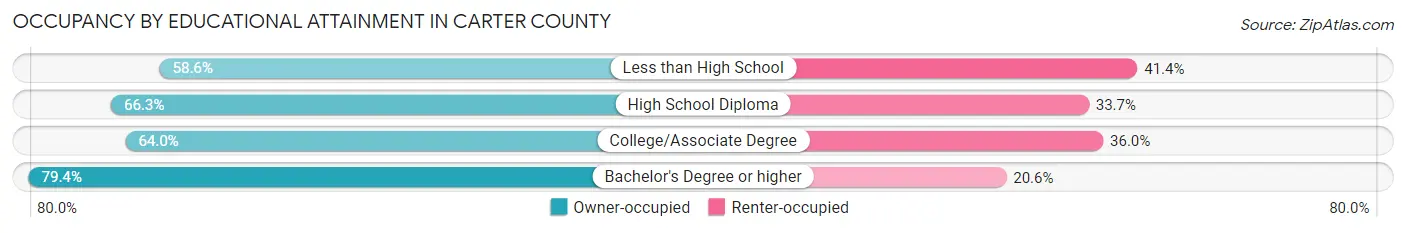
| Household Size | Owner-occupied | Renter-occupied |
| Less than High School | 1,263 (58.6%) | 893 (41.4%) |
| High School Diploma | 4,268 (66.3%) | 2,171 (33.7%) |
| College/Associate Degree | 3,973 (64.0%) | 2,235 (36.0%) |
| Bachelor's Degree or higher | 3,123 (79.4%) | 812 (20.6%) |
Occupancy by Age of Householder in Carter County
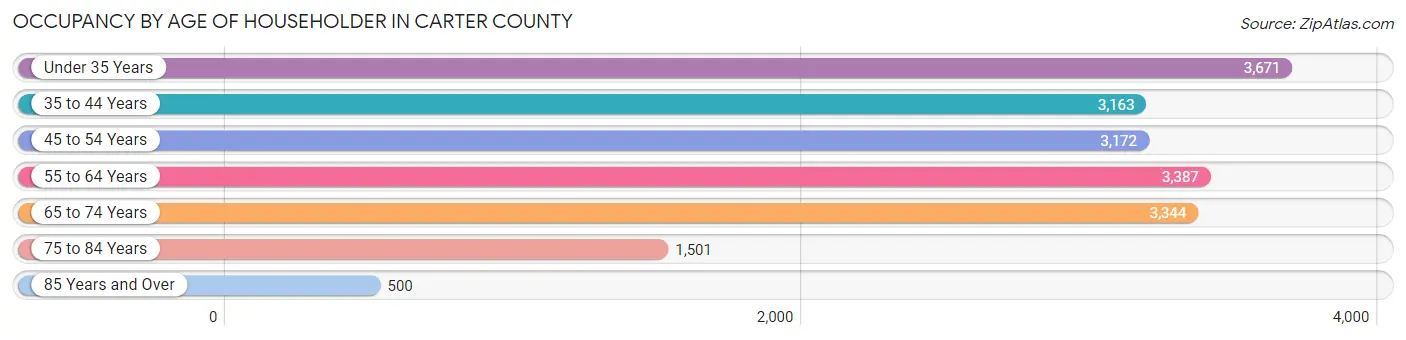
| Age Bracket | # Households | % Households |
| Under 35 Years | 3,671 | 19.6% |
| 35 to 44 Years | 3,163 | 16.9% |
| 45 to 54 Years | 3,172 | 16.9% |
| 55 to 64 Years | 3,387 | 18.1% |
| 65 to 74 Years | 3,344 | 17.8% |
| 75 to 84 Years | 1,501 | 8.0% |
| 85 Years and Over | 500 | 2.7% |
| Total | 18,738 | 100.0% |
Housing Finances in Carter County
Median Income by Occupancy in Carter County
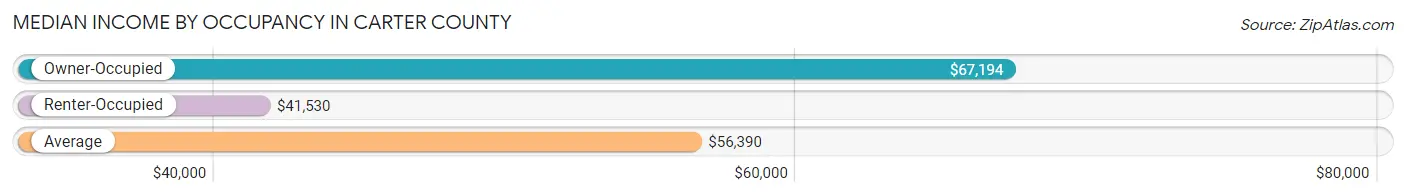
| Occupancy Type | # Households | Median Income |
| Owner-Occupied | 12,627 (67.4%) | $67,194 |
| Renter-Occupied | 6,111 (32.6%) | $41,530 |
| Average | 18,738 (100.0%) | $56,390 |
Occupancy by Householder Income Bracket in Carter County
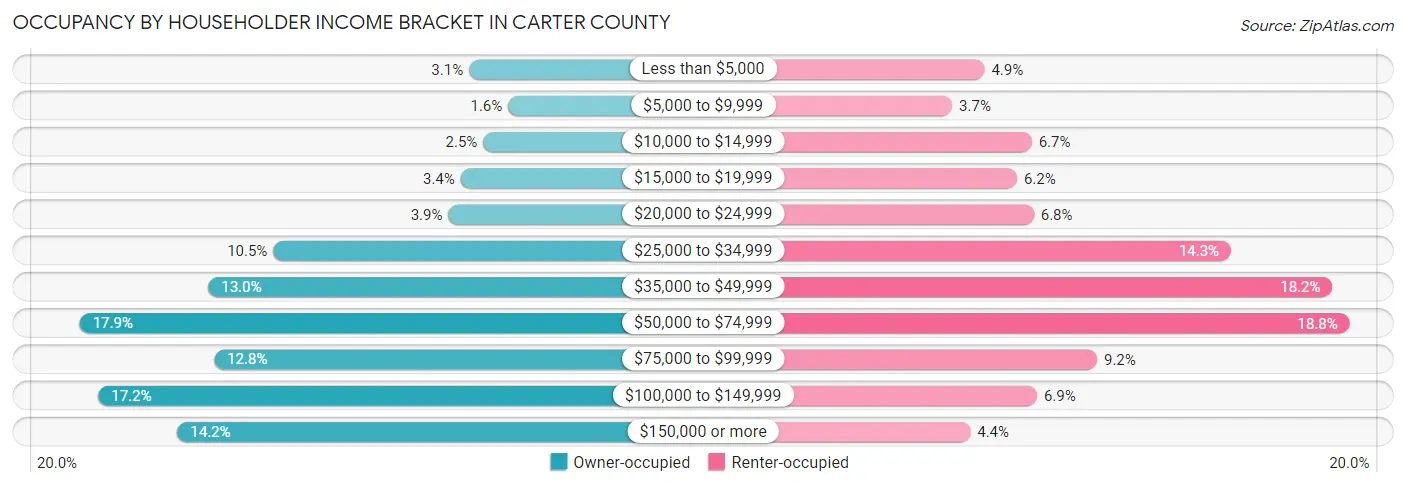
| Income Bracket | Owner-occupied | Renter-occupied |
| Less than $5,000 | 388 (3.1%) | 300 (4.9%) |
| $5,000 to $9,999 | 199 (1.6%) | 225 (3.7%) |
| $10,000 to $14,999 | 319 (2.5%) | 410 (6.7%) |
| $15,000 to $19,999 | 428 (3.4%) | 376 (6.1%) |
| $20,000 to $24,999 | 487 (3.9%) | 415 (6.8%) |
| $25,000 to $34,999 | 1,330 (10.5%) | 874 (14.3%) |
| $35,000 to $49,999 | 1,641 (13.0%) | 1,110 (18.2%) |
| $50,000 to $74,999 | 2,260 (17.9%) | 1,150 (18.8%) |
| $75,000 to $99,999 | 1,614 (12.8%) | 562 (9.2%) |
| $100,000 to $149,999 | 2,170 (17.2%) | 422 (6.9%) |
| $150,000 or more | 1,791 (14.2%) | 267 (4.4%) |
| Total | 12,627 (100.0%) | 6,111 (100.0%) |
Monthly Housing Cost Tiers in Carter County
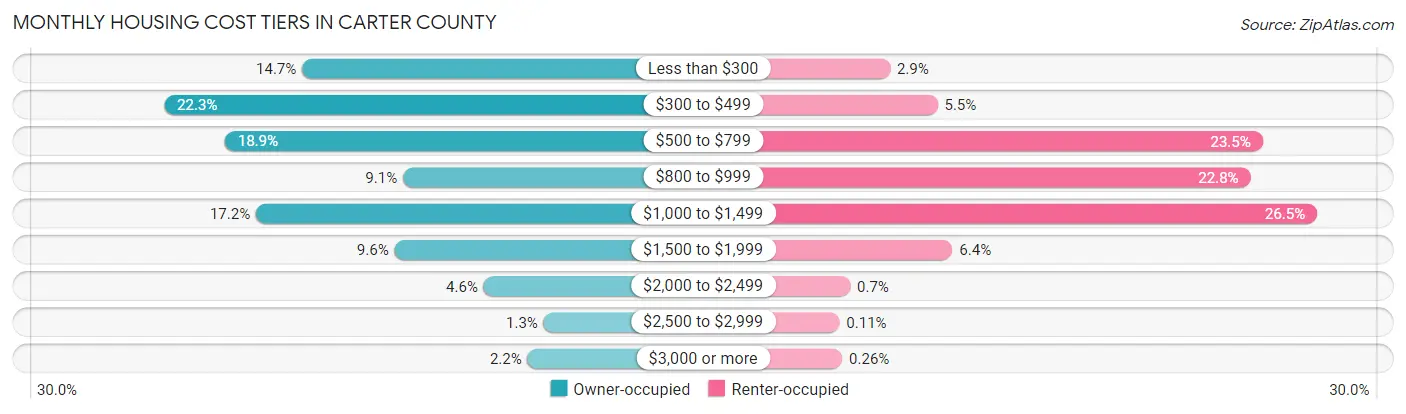
| Monthly Cost | Owner-occupied | Renter-occupied |
| Less than $300 | 1,853 (14.7%) | 177 (2.9%) |
| $300 to $499 | 2,816 (22.3%) | 338 (5.5%) |
| $500 to $799 | 2,392 (18.9%) | 1,435 (23.5%) |
| $800 to $999 | 1,149 (9.1%) | 1,394 (22.8%) |
| $1,000 to $1,499 | 2,175 (17.2%) | 1,619 (26.5%) |
| $1,500 to $1,999 | 1,208 (9.6%) | 388 (6.4%) |
| $2,000 to $2,499 | 586 (4.6%) | 43 (0.7%) |
| $2,500 to $2,999 | 168 (1.3%) | 7 (0.1%) |
| $3,000 or more | 280 (2.2%) | 16 (0.3%) |
| Total | 12,627 (100.0%) | 6,111 (100.0%) |
Physical Housing Characteristics in Carter County
Housing Structures in Carter County
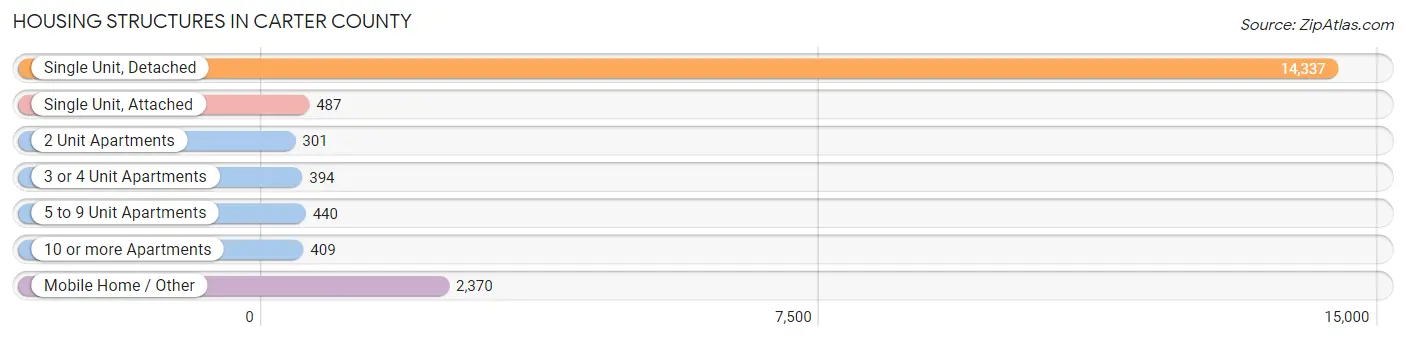
| Structure Type | # Housing Units | % Housing Units |
| Single Unit, Detached | 14,337 | 76.5% |
| Single Unit, Attached | 487 | 2.6% |
| 2 Unit Apartments | 301 | 1.6% |
| 3 or 4 Unit Apartments | 394 | 2.1% |
| 5 to 9 Unit Apartments | 440 | 2.4% |
| 10 or more Apartments | 409 | 2.2% |
| Mobile Home / Other | 2,370 | 12.7% |
| Total | 18,738 | 100.0% |
Housing Structures by Occupancy in Carter County
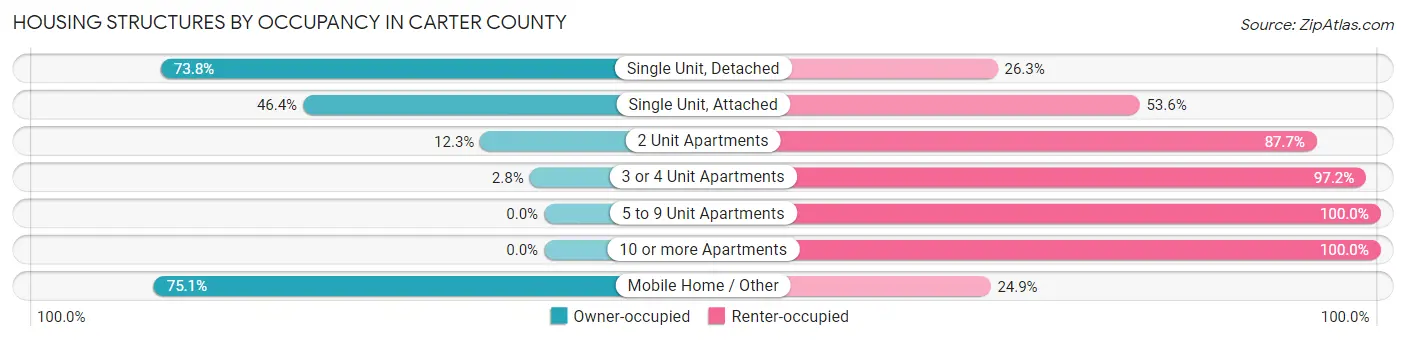
| Structure Type | Owner-occupied | Renter-occupied |
| Single Unit, Detached | 10,573 (73.8%) | 3,764 (26.3%) |
| Single Unit, Attached | 226 (46.4%) | 261 (53.6%) |
| 2 Unit Apartments | 37 (12.3%) | 264 (87.7%) |
| 3 or 4 Unit Apartments | 11 (2.8%) | 383 (97.2%) |
| 5 to 9 Unit Apartments | 0 (0.0%) | 440 (100.0%) |
| 10 or more Apartments | 0 (0.0%) | 409 (100.0%) |
| Mobile Home / Other | 1,780 (75.1%) | 590 (24.9%) |
| Total | 12,627 (67.4%) | 6,111 (32.6%) |
Housing Structures by Number of Rooms in Carter County
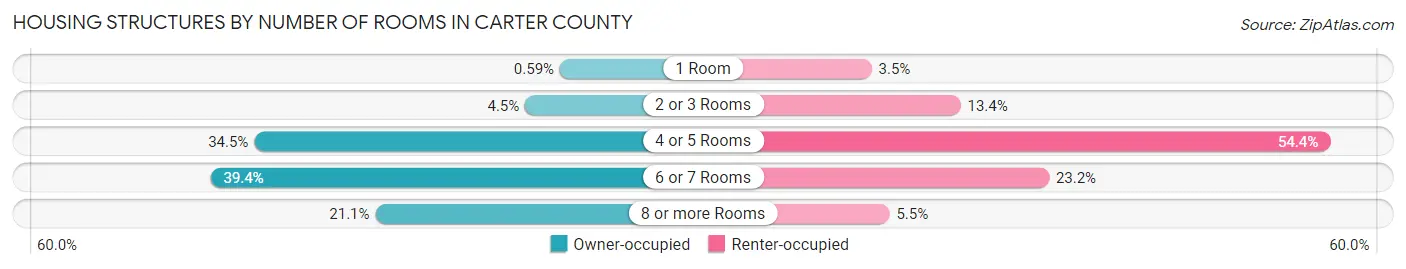
| Number of Rooms | Owner-occupied | Renter-occupied |
| 1 Room | 74 (0.6%) | 215 (3.5%) |
| 2 or 3 Rooms | 562 (4.4%) | 818 (13.4%) |
| 4 or 5 Rooms | 4,359 (34.5%) | 3,324 (54.4%) |
| 6 or 7 Rooms | 4,971 (39.4%) | 1,418 (23.2%) |
| 8 or more Rooms | 2,661 (21.1%) | 336 (5.5%) |
| Total | 12,627 (100.0%) | 6,111 (100.0%) |
Housing Structure by Heating Type in Carter County
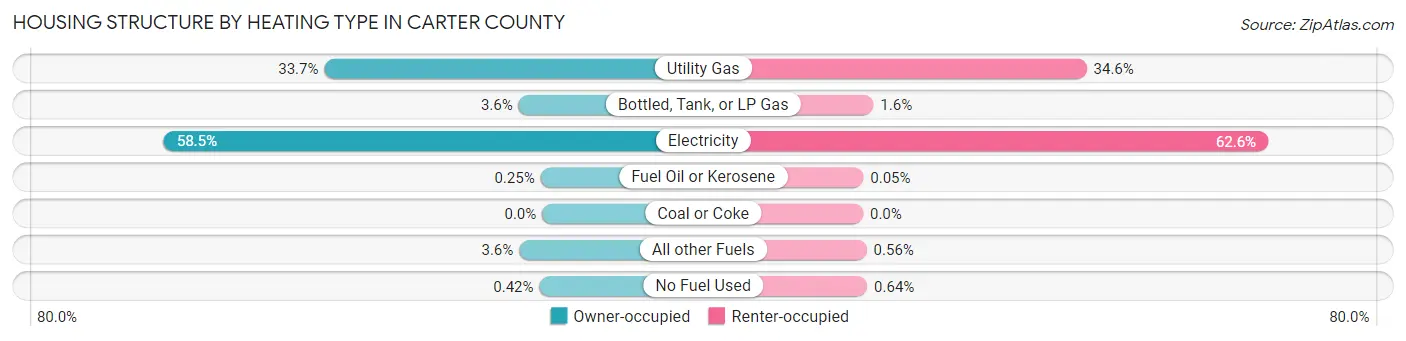
| Heating Type | Owner-occupied | Renter-occupied |
| Utility Gas | 4,251 (33.7%) | 2,112 (34.6%) |
| Bottled, Tank, or LP Gas | 460 (3.6%) | 98 (1.6%) |
| Electricity | 7,383 (58.5%) | 3,825 (62.6%) |
| Fuel Oil or Kerosene | 32 (0.3%) | 3 (0.1%) |
| Coal or Coke | 0 (0.0%) | 0 (0.0%) |
| All other Fuels | 448 (3.5%) | 34 (0.6%) |
| No Fuel Used | 53 (0.4%) | 39 (0.6%) |
| Total | 12,627 (100.0%) | 6,111 (100.0%) |
Household Vehicle Usage in Carter County
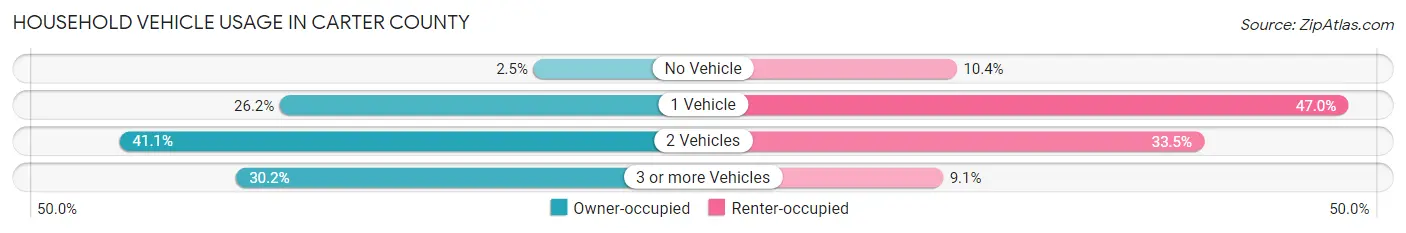
| Vehicles per Household | Owner-occupied | Renter-occupied |
| No Vehicle | 312 (2.5%) | 636 (10.4%) |
| 1 Vehicle | 3,302 (26.2%) | 2,870 (47.0%) |
| 2 Vehicles | 5,194 (41.1%) | 2,047 (33.5%) |
| 3 or more Vehicles | 3,819 (30.2%) | 558 (9.1%) |
| Total | 12,627 (100.0%) | 6,111 (100.0%) |
Real Estate & Mortgages in Carter County
Real Estate and Mortgage Overview in Carter County
| Characteristic | Without Mortgage | With Mortgage |
| Housing Units | 6,741 | 5,886 |
| Median Property Value | $106,000 | $177,800 |
| Median Household Income | $47,545 | $1,109 |
| Monthly Housing Costs | $410 | $270 |
| Real Estate Taxes | $735 | $339 |
Property Value by Mortgage Status in Carter County
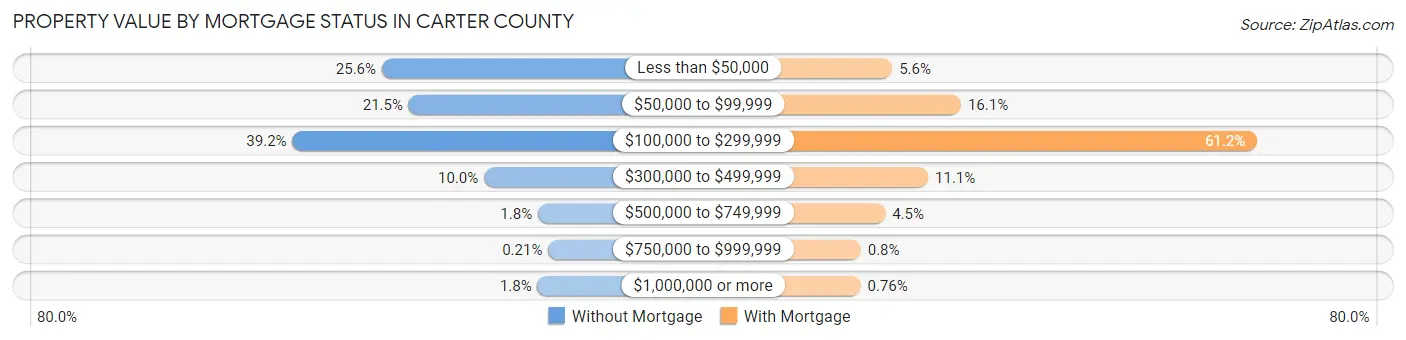
| Property Value | Without Mortgage | With Mortgage |
| Less than $50,000 | 1,723 (25.6%) | 329 (5.6%) |
| $50,000 to $99,999 | 1,446 (21.4%) | 946 (16.1%) |
| $100,000 to $299,999 | 2,642 (39.2%) | 3,602 (61.2%) |
| $300,000 to $499,999 | 673 (10.0%) | 651 (11.1%) |
| $500,000 to $749,999 | 119 (1.8%) | 266 (4.5%) |
| $750,000 to $999,999 | 14 (0.2%) | 47 (0.8%) |
| $1,000,000 or more | 124 (1.8%) | 45 (0.8%) |
| Total | 6,741 (100.0%) | 5,886 (100.0%) |
Household Income by Mortgage Status in Carter County
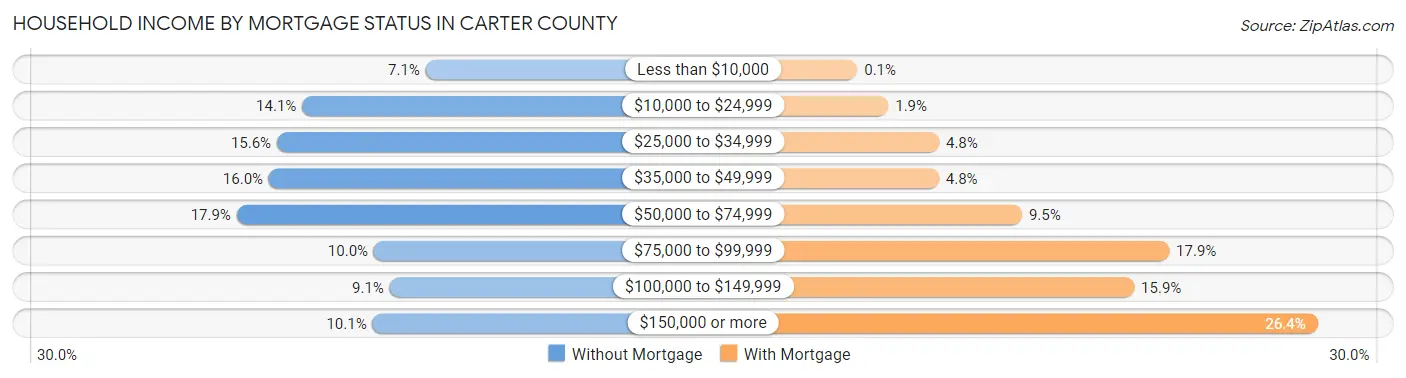
| Household Income | Without Mortgage | With Mortgage |
| Less than $10,000 | 477 (7.1%) | 6 (0.1%) |
| $10,000 to $24,999 | 953 (14.1%) | 110 (1.9%) |
| $25,000 to $34,999 | 1,050 (15.6%) | 281 (4.8%) |
| $35,000 to $49,999 | 1,081 (16.0%) | 280 (4.8%) |
| $50,000 to $74,999 | 1,205 (17.9%) | 560 (9.5%) |
| $75,000 to $99,999 | 677 (10.0%) | 1,055 (17.9%) |
| $100,000 to $149,999 | 616 (9.1%) | 937 (15.9%) |
| $150,000 or more | 682 (10.1%) | 1,554 (26.4%) |
| Total | 6,741 (100.0%) | 5,886 (100.0%) |
Property Value to Household Income Ratio in Carter County
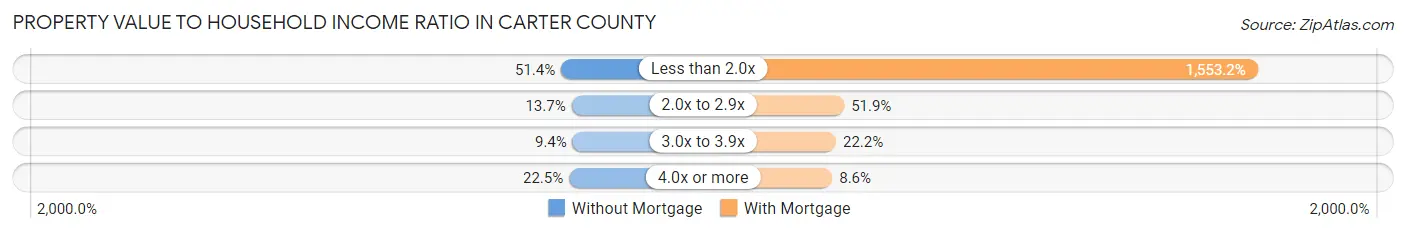
| Value-to-Income Ratio | Without Mortgage | With Mortgage |
| Less than 2.0x | 3,466 (51.4%) | 91,422 (1,553.2%) |
| 2.0x to 2.9x | 922 (13.7%) | 3,055 (51.9%) |
| 3.0x to 3.9x | 633 (9.4%) | 1,304 (22.2%) |
| 4.0x or more | 1,519 (22.5%) | 508 (8.6%) |
| Total | 6,741 (100.0%) | 5,886 (100.0%) |
Real Estate Taxes by Mortgage Status in Carter County
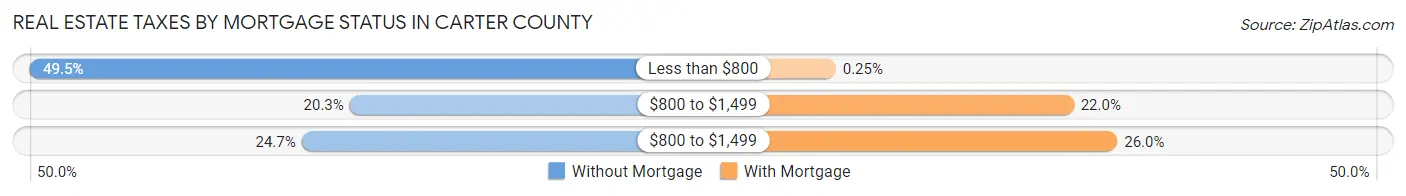
| Property Taxes | Without Mortgage | With Mortgage |
| Less than $800 | 3,336 (49.5%) | 15 (0.3%) |
| $800 to $1,499 | 1,370 (20.3%) | 1,294 (22.0%) |
| $800 to $1,499 | 1,666 (24.7%) | 1,528 (26.0%) |
| Total | 6,741 (100.0%) | 5,886 (100.0%) |
Health & Disability in Carter County
Health Insurance Coverage by Age in Carter County
| Age Bracket | With Coverage | Without Coverage |
| Under 6 Years | 3,344 (91.0%) | 329 (9.0%) |
| 6 to 18 Years | 8,163 (90.4%) | 868 (9.6%) |
| 19 to 25 Years | 2,781 (70.0%) | 1,194 (30.0%) |
| 26 to 34 Years | 3,661 (67.3%) | 1,778 (32.7%) |
| 35 to 44 Years | 4,711 (78.1%) | 1,324 (21.9%) |
| 45 to 54 Years | 4,553 (82.0%) | 1,002 (18.0%) |
| 55 to 64 Years | 5,152 (85.2%) | 898 (14.8%) |
| 65 to 74 Years | 4,764 (99.6%) | 18 (0.4%) |
| 75 Years and older | 3,011 (99.7%) | 8 (0.3%) |
| Total | 40,140 (84.4%) | 7,419 (15.6%) |
Health Insurance Coverage by Citizenship Status in Carter County
| Citizenship Status | With Coverage | Without Coverage |
| Native Born | 3,344 (91.0%) | 329 (9.0%) |
| Foreign Born, Citizen | 8,163 (90.4%) | 868 (9.6%) |
| Foreign Born, not a Citizen | 2,781 (70.0%) | 1,194 (30.0%) |
Health Insurance Coverage by Household Income in Carter County
| Household Income | With Coverage | Without Coverage |
| Under $25,000 | 4,657 (76.2%) | 1,451 (23.8%) |
| $25,000 to $49,999 | 8,108 (77.9%) | 2,300 (22.1%) |
| $50,000 to $74,999 | 7,284 (83.1%) | 1,478 (16.9%) |
| $75,000 to $99,999 | 5,757 (87.7%) | 810 (12.3%) |
| $100,000 and over | 14,095 (91.3%) | 1,344 (8.7%) |
Public vs Private Health Insurance Coverage by Age in Carter County
| Age Bracket | Public Insurance | Private Insurance |
| Under 6 | 2,055 (55.9%) | 1,486 (40.5%) |
| 6 to 18 Years | 3,499 (38.7%) | 5,215 (57.8%) |
| 19 to 25 Years | 779 (19.6%) | 2,095 (52.7%) |
| 25 to 34 Years | 761 (14.0%) | 2,989 (54.9%) |
| 35 to 44 Years | 843 (14.0%) | 4,067 (67.4%) |
| 45 to 54 Years | 990 (17.8%) | 3,806 (68.5%) |
| 55 to 64 Years | 1,782 (29.4%) | 3,810 (63.0%) |
| 65 to 74 Years | 4,674 (97.7%) | 2,247 (47.0%) |
| 75 Years and over | 2,997 (99.3%) | 1,713 (56.7%) |
| Total | 18,380 (38.7%) | 27,428 (57.7%) |
Disability Status by Sex by Age in Carter County
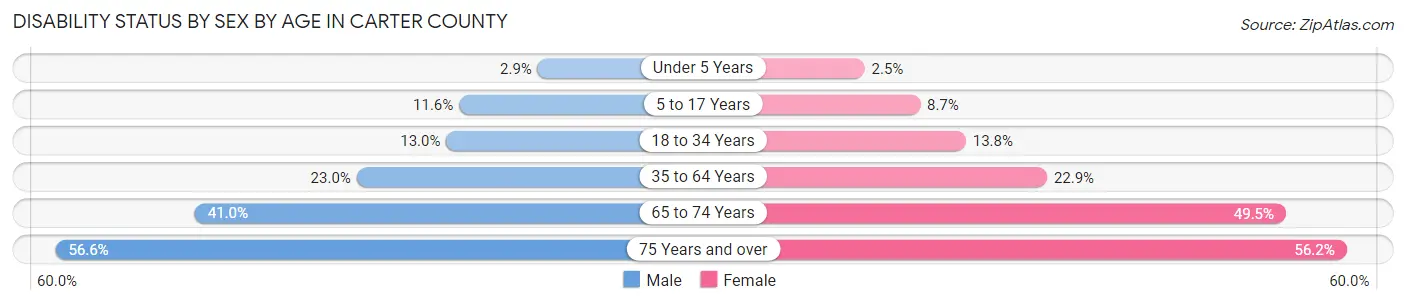
| Age Bracket | Male | Female |
| Under 5 Years | 48 (2.9%) | 39 (2.5%) |
| 5 to 17 Years | 521 (11.6%) | 382 (8.7%) |
| 18 to 34 Years | 650 (13.0%) | 697 (13.8%) |
| 35 to 64 Years | 2,002 (23.0%) | 2,044 (22.9%) |
| 65 to 74 Years | 886 (41.0%) | 1,297 (49.4%) |
| 75 Years and over | 638 (56.6%) | 1,063 (56.2%) |
Disability Class by Sex by Age in Carter County
Disability Class: Hearing Difficulty
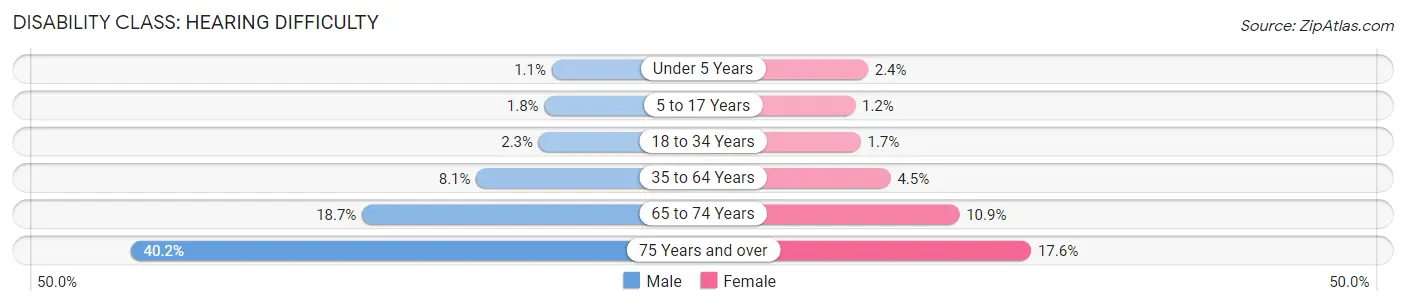
| Age Bracket | Male | Female |
| Under 5 Years | 18 (1.1%) | 37 (2.4%) |
| 5 to 17 Years | 79 (1.8%) | 54 (1.2%) |
| 18 to 34 Years | 113 (2.3%) | 88 (1.7%) |
| 35 to 64 Years | 702 (8.1%) | 404 (4.5%) |
| 65 to 74 Years | 403 (18.7%) | 286 (10.9%) |
| 75 Years and over | 453 (40.2%) | 332 (17.6%) |
Disability Class: Vision Difficulty
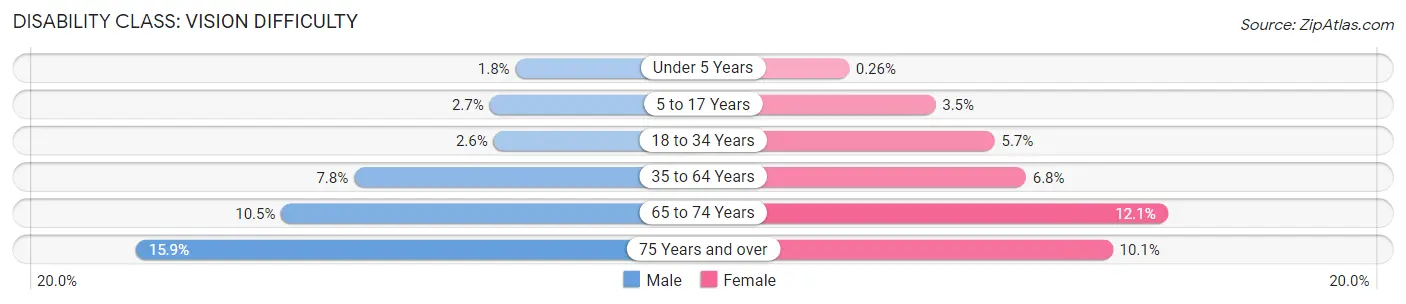
| Age Bracket | Male | Female |
| Under 5 Years | 30 (1.8%) | 4 (0.3%) |
| 5 to 17 Years | 123 (2.7%) | 152 (3.5%) |
| 18 to 34 Years | 129 (2.6%) | 286 (5.7%) |
| 35 to 64 Years | 676 (7.8%) | 611 (6.8%) |
| 65 to 74 Years | 226 (10.5%) | 317 (12.1%) |
| 75 Years and over | 179 (15.9%) | 190 (10.1%) |
Disability Class: Cognitive Difficulty
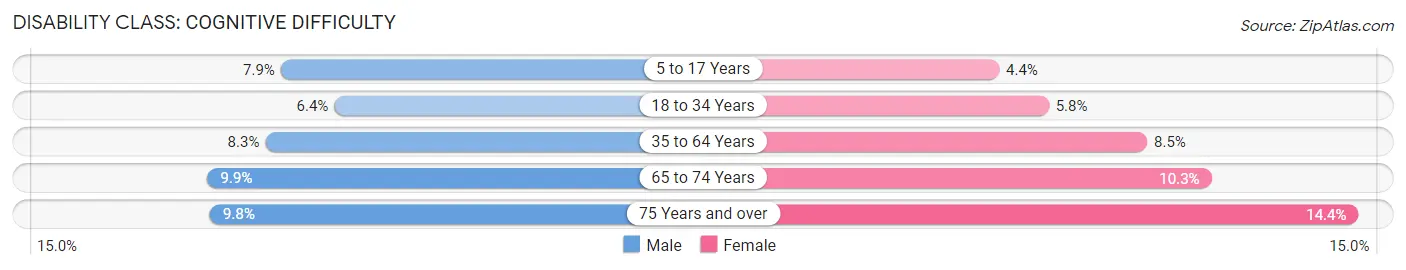
| Age Bracket | Male | Female |
| 5 to 17 Years | 353 (7.9%) | 192 (4.4%) |
| 18 to 34 Years | 318 (6.4%) | 291 (5.8%) |
| 35 to 64 Years | 722 (8.3%) | 760 (8.5%) |
| 65 to 74 Years | 214 (9.9%) | 270 (10.3%) |
| 75 Years and over | 111 (9.8%) | 272 (14.4%) |
Disability Class: Ambulatory Difficulty
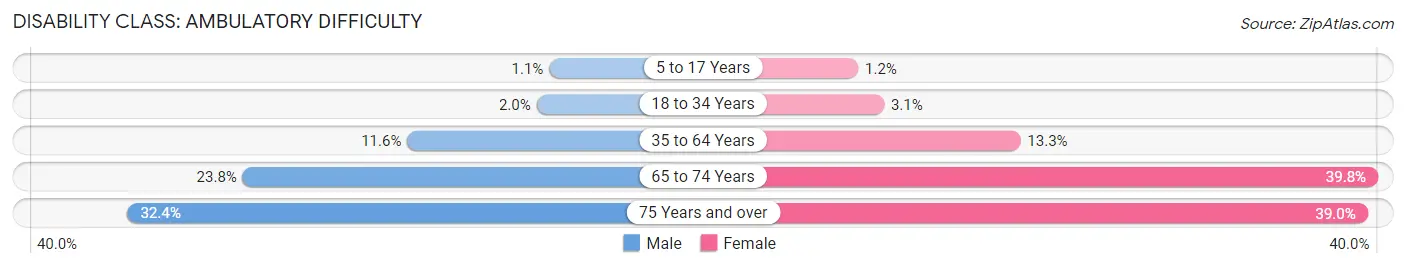
| Age Bracket | Male | Female |
| 5 to 17 Years | 47 (1.1%) | 53 (1.2%) |
| 18 to 34 Years | 99 (2.0%) | 158 (3.1%) |
| 35 to 64 Years | 1,008 (11.6%) | 1,186 (13.3%) |
| 65 to 74 Years | 514 (23.8%) | 1,044 (39.8%) |
| 75 Years and over | 365 (32.4%) | 738 (39.0%) |
Disability Class: Self-Care Difficulty
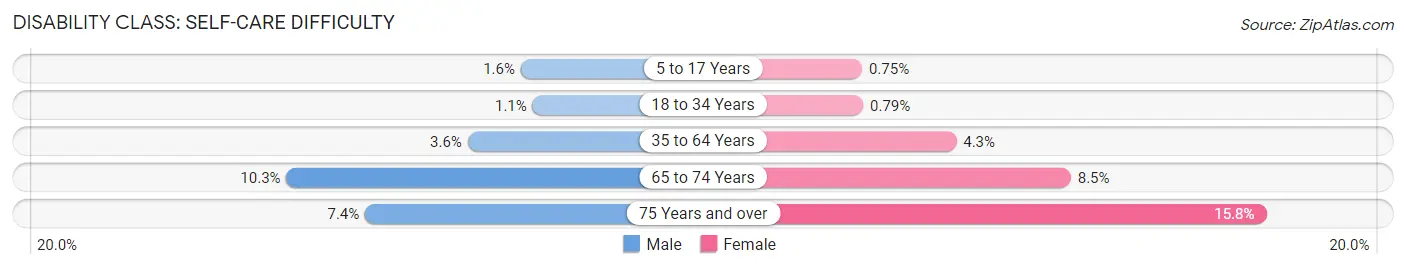
| Age Bracket | Male | Female |
| 5 to 17 Years | 71 (1.6%) | 33 (0.7%) |
| 18 to 34 Years | 57 (1.1%) | 40 (0.8%) |
| 35 to 64 Years | 309 (3.5%) | 380 (4.3%) |
| 65 to 74 Years | 222 (10.3%) | 223 (8.5%) |
| 75 Years and over | 83 (7.4%) | 298 (15.8%) |
Technology Access in Carter County
Computing Device Access in Carter County
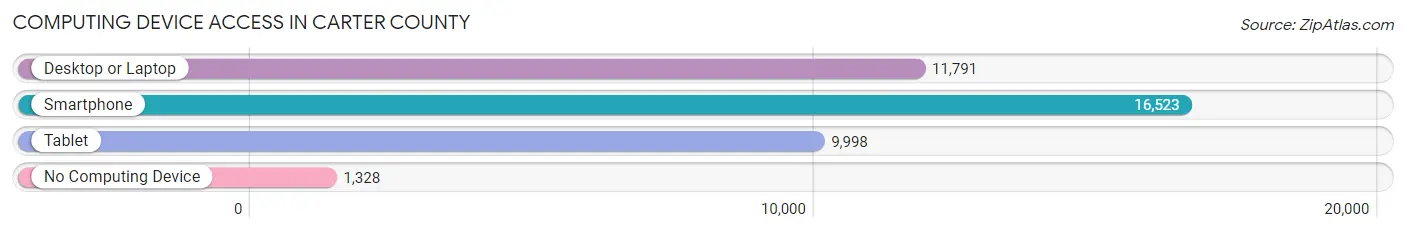
| Device Type | # Households | % Households |
| Desktop or Laptop | 11,791 | 62.9% |
| Smartphone | 16,523 | 88.2% |
| Tablet | 9,998 | 53.4% |
| No Computing Device | 1,328 | 7.1% |
| Total | 18,738 | 100.0% |
Internet Access in Carter County
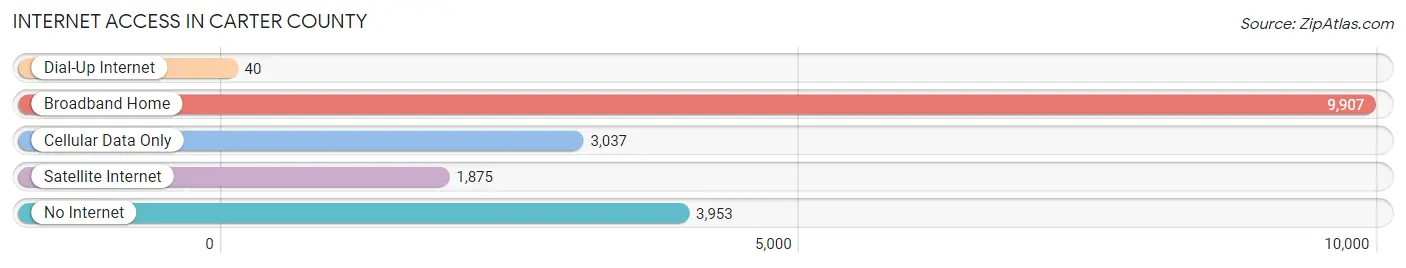
| Internet Type | # Households | % Households |
| Dial-Up Internet | 40 | 0.2% |
| Broadband Home | 9,907 | 52.9% |
| Cellular Data Only | 3,037 | 16.2% |
| Satellite Internet | 1,875 | 10.0% |
| No Internet | 3,953 | 21.1% |
| Total | 18,738 | 100.0% |
Carter County Summary
County History
Carter County is located in the south-central region of Oklahoma and is part of the Arbuckle Mountains. It was established in 1907 and named after Charles N. Carter, a prominent Chickasaw leader. The county was originally part of the Chickasaw Nation, and the area was home to many Native American tribes, including the Choctaw, Chickasaw, and Caddo.
The first settlers in the area were ranchers and farmers, who began arriving in the late 1800s. The first town in the county was Ardmore, which was founded in 1887. The town quickly grew and became the county seat in 1907.
In the early 1900s, the county experienced a population boom due to the discovery of oil and natural gas. This led to the development of many new towns and cities, including Healdton, Wilson, and Gene Autry.
The county also experienced a period of economic growth during the Great Depression, when the Works Progress Administration (WPA) built many public buildings, including schools, libraries, and courthouses.
Geography
Carter County is located in the south-central region of Oklahoma and is part of the Arbuckle Mountains. It is bordered by Love County to the north, Johnston County to the east, Marshall County to the south, and Jefferson County to the west.
The county covers an area of 845 square miles and is home to numerous lakes, rivers, and creeks, including Lake Murray, Lake Texoma, and the Washita River. The county also contains several state parks, including Lake Murray State Park and Lake Texoma State Park.
The county has a humid subtropical climate, with hot summers and mild winters. The average annual temperature is around 64°F, and the average annual precipitation is around 40 inches.
Economy
Carter County has a diverse economy, with a mix of agriculture, manufacturing, and services. The county is home to several large employers, including the Ardmore Air Force Base, the Ardmore Army Ammunition Plant, and the Ardmore Refinery.
Agriculture is an important part of the county’s economy, with cattle, poultry, and dairy products being the main products. Other important crops include cotton, wheat, and hay.
Manufacturing is also an important part of the county’s economy, with products such as furniture, clothing, and food products being produced.
The county also has a thriving tourism industry, with numerous attractions, including Lake Murray State Park, Lake Texoma State Park, and the Chickasaw National Recreation Area.
Demographics
As of the 2010 census, Carter County had a population of 47,557. The population is spread out, with the largest cities being Ardmore (24,283), Healdton (2,845), and Wilson (2,717).
The racial makeup of the county is 79.2% White, 15.2% African American, 1.2% Native American, 0.7% Asian, 0.1% Pacific Islander, 1.3% from other races, and 2.3% from two or more races.
The median household income in the county is $41,945, and the median family income is $50,945. The per capita income is $21,845.
Conclusion
Carter County is a diverse and vibrant county located in the south-central region of Oklahoma. It has a rich history, with a mix of Native American, ranching, and oil and gas industries. The county has a diverse economy, with agriculture, manufacturing, and services being the main industries. The county also has a thriving tourism industry, with numerous attractions. The population of the county is spread out, with the largest cities being Ardmore, Healdton, and Wilson. The median household income in the county is $41,945, and the median family income is $50,945.
Common Questions
What is the Total Population of Carter County?
Total Population of Carter County is 48,202.
What is the Total Male Population of Carter County?
Total Male Population of Carter County is 23,556.
What is the Total Female Population of Carter County?
Total Female Population of Carter County is 24,646.
What is the Ratio of Males per 100 Females in Carter County?
There are 95.58 Males per 100 Females in Carter County.
What is the Ratio of Females per 100 Males in Carter County?
There are 104.63 Females per 100 Males in Carter County.
What is the Median Population Age in Carter County?
Median Population Age in Carter County is 38.4 Years.
What is the Average Family Size in Carter County
Average Family Size in Carter County is 3.2 People.
What is the Average Household Size in Carter County
Average Household Size in Carter County is 2.5 People.
What is Per Capita Income in Carter County?
Per Capita income in Carter County is $31,036.
What is the Median Family Income in Carter County?
Median Family Income in Carter County is $72,192.
What is the Median Household income in Carter County?
Median Household Income in Carter County is $56,390.
What is Income or Wage Gap in Carter County?
Income or Wage Gap in Carter County is 35.6%.
Women in Carter County earn 64.4 cents for every dollar earned by a man.
What is Family Income Deficit in Carter County?
Family Income Deficit in Carter County is $10,821.
Families that are below poverty line in Carter County earn $10,821 less on average than the poverty threshold level.
What is Inequality or Gini Index in Carter County?
Inequality or Gini Index in Carter County is 0.46.
How Large is the Labor Force in Carter County?
There are 22,290 People in the Labor Forcein in Carter County.
What is the Percentage of People in the Labor Force in Carter County?
59.7% of People are in the Labor Force in Carter County.
What is the Unemployment Rate in Carter County?
Unemployment Rate in Carter County is 4.2%.