Canadian County, OK
Canadian County Map
Canadian County Overview
156,681
TOTAL POPULATION
78,044
MALE POPULATION
78,637
FEMALE POPULATION
99.25
MALES / 100 FEMALES
100.76
FEMALES / 100 MALES
36.2
MEDIAN AGE
3.2
AVG FAMILY SIZE
2.7
AVG HOUSEHOLD SIZE
$36,884
PER CAPITA INCOME
$93,729
AVG FAMILY INCOME
$82,364
AVG HOUSEHOLD INCOME
34.3%
WAGE / INCOME GAP [ % ]
65.7¢/ $1
WAGE / INCOME GAP [ $ ]
$10,777
FAMILY INCOME DEFICIT
0.38
INEQUALITY / GINI INDEX
82,943
LABOR FORCE [ PEOPLE ]
68.6%
PERCENT IN LABOR FORCE
4.1%
UNEMPLOYMENT RATE
Canadian County Area Codes
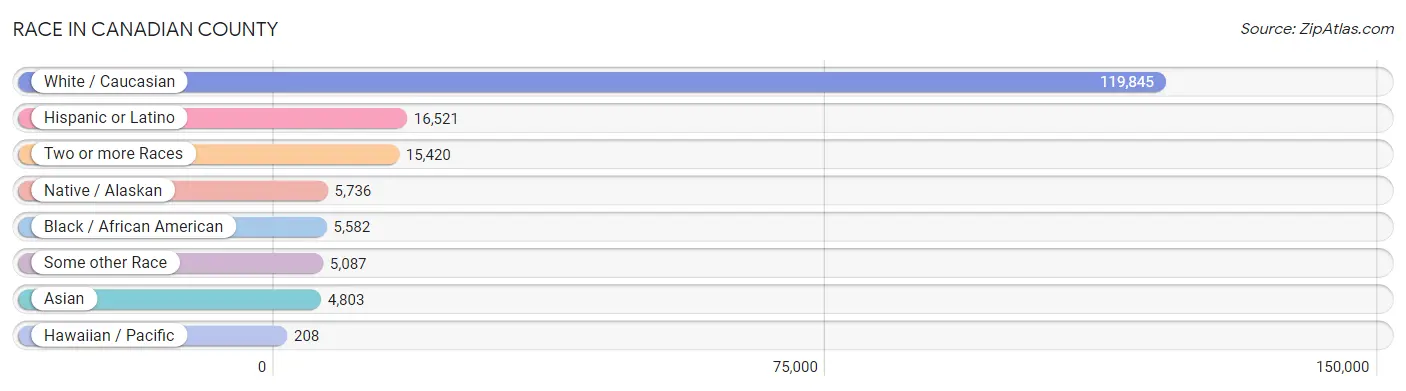
Race in Canadian County
The most populous races in Canadian County are White / Caucasian (119,845 | 76.5%), Hispanic or Latino (16,521 | 10.5%), and Two or more Races (15,420 | 9.8%).
| Race | # Population | % Population |
| Asian | 4,803 | 3.1% |
| Black / African American | 5,582 | 3.6% |
| Hawaiian / Pacific | 208 | 0.1% |
| Hispanic or Latino | 16,521 | 10.5% |
| Native / Alaskan | 5,736 | 3.7% |
| White / Caucasian | 119,845 | 76.5% |
| Two or more Races | 15,420 | 9.8% |
| Some other Race | 5,087 | 3.3% |
| Total | 156,681 | 100.0% |
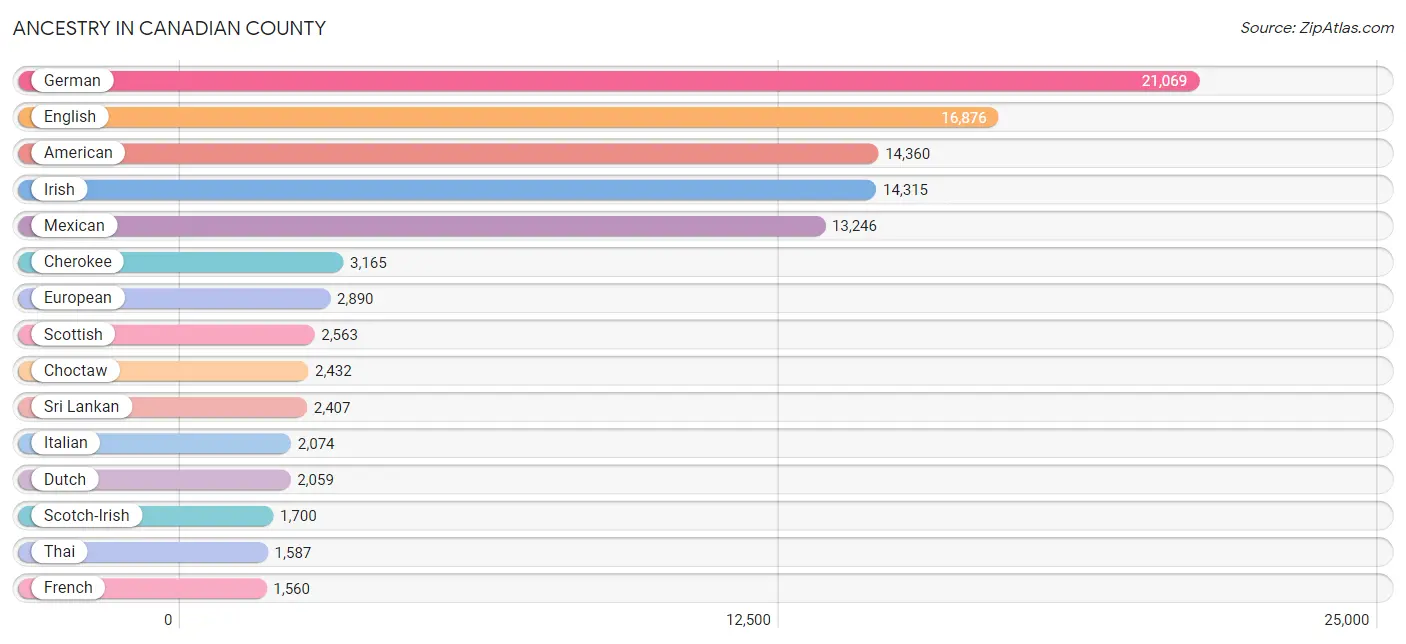
Ancestry in Canadian County
The most populous ancestries reported in Canadian County are German (21,069 | 13.5%), English (16,876 | 10.8%), American (14,360 | 9.2%), Irish (14,315 | 9.1%), and Mexican (13,246 | 8.5%), together accounting for 51.0% of all Canadian County residents.
| Ancestry | # Population | % Population |
| African | 507 | 0.3% |
| Albanian | 40 | 0.0% |
| American | 14,360 | 9.2% |
| Apache | 286 | 0.2% |
| Arab | 300 | 0.2% |
| Arapaho | 52 | 0.0% |
| Argentinean | 100 | 0.1% |
| Armenian | 22 | 0.0% |
| Australian | 58 | 0.0% |
| Austrian | 112 | 0.1% |
| Belgian | 23 | 0.0% |
| Bhutanese | 133 | 0.1% |
| Blackfeet | 62 | 0.0% |
| Bolivian | 19 | 0.0% |
| Brazilian | 104 | 0.1% |
| British | 1,234 | 0.8% |
| Bulgarian | 8 | 0.0% |
| Burmese | 361 | 0.2% |
| Cajun | 17 | 0.0% |
| Canadian | 271 | 0.2% |
| Cape Verdean | 37 | 0.0% |
| Carpatho Rusyn | 24 | 0.0% |
| Celtic | 3 | 0.0% |
| Central American | 956 | 0.6% |
| Central American Indian | 28 | 0.0% |
| Cherokee | 3,165 | 2.0% |
| Cheyenne | 199 | 0.1% |
| Chickasaw | 1,082 | 0.7% |
| Chippewa | 20 | 0.0% |
| Choctaw | 2,432 | 1.5% |
| Colombian | 127 | 0.1% |
| Comanche | 362 | 0.2% |
| Costa Rican | 30 | 0.0% |
| Creek | 525 | 0.3% |
| Croatian | 36 | 0.0% |
| Cuban | 176 | 0.1% |
| Czech | 1,060 | 0.7% |
| Czechoslovakian | 101 | 0.1% |
| Danish | 414 | 0.3% |
| Delaware | 80 | 0.1% |
| Dutch | 2,059 | 1.3% |
| Dutch West Indian | 132 | 0.1% |
| Eastern European | 151 | 0.1% |
| Ecuadorian | 11 | 0.0% |
| English | 16,876 | 10.8% |
| European | 2,890 | 1.8% |
| Filipino | 23 | 0.0% |
| Finnish | 73 | 0.1% |
| French | 1,560 | 1.0% |
| French Canadian | 206 | 0.1% |
| German | 21,069 | 13.5% |
| German Russian | 18 | 0.0% |
| Ghanaian | 25 | 0.0% |
| Greek | 171 | 0.1% |
| Guamanian / Chamorro | 87 | 0.1% |
| Guatemalan | 533 | 0.3% |
| Honduran | 229 | 0.2% |
| Hungarian | 105 | 0.1% |
| Indian (Asian) | 366 | 0.2% |
| Indonesian | 60 | 0.0% |
| Inupiat | 47 | 0.0% |
| Iranian | 67 | 0.0% |
| Irish | 14,315 | 9.1% |
| Israeli | 11 | 0.0% |
| Italian | 2,074 | 1.3% |
| Jamaican | 89 | 0.1% |
| Japanese | 93 | 0.1% |
| Jordanian | 24 | 0.0% |
| Kiowa | 223 | 0.1% |
| Korean | 932 | 0.6% |
| Laotian | 106 | 0.1% |
| Lebanese | 223 | 0.1% |
| Lithuanian | 38 | 0.0% |
| Malaysian | 313 | 0.2% |
| Mexican | 13,246 | 8.5% |
| Mexican American Indian | 78 | 0.1% |
| Mongolian | 13 | 0.0% |
| Native Hawaiian | 128 | 0.1% |
| Navajo | 256 | 0.2% |
| Nicaraguan | 7 | 0.0% |
| Nigerian | 30 | 0.0% |
| Northern European | 158 | 0.1% |
| Norwegian | 1,369 | 0.9% |
| Osage | 141 | 0.1% |
| Paiute | 35 | 0.0% |
| Pakistani | 90 | 0.1% |
| Panamanian | 67 | 0.0% |
| Pennsylvania German | 21 | 0.0% |
| Peruvian | 11 | 0.0% |
| Polish | 1,255 | 0.8% |
| Portuguese | 425 | 0.3% |
| Potawatomi | 493 | 0.3% |
| Pueblo | 1 | 0.0% |
| Puerto Rican | 738 | 0.5% |
| Romanian | 70 | 0.0% |
| Russian | 288 | 0.2% |
| Salvadoran | 90 | 0.1% |
| Samoan | 11 | 0.0% |
| Scandinavian | 804 | 0.5% |
| Scotch-Irish | 1,700 | 1.1% |
| Scottish | 2,563 | 1.6% |
| Seminole | 346 | 0.2% |
| Serbian | 66 | 0.0% |
| Shoshone | 27 | 0.0% |
| Sioux | 65 | 0.0% |
| Slavic | 4 | 0.0% |
| Slovak | 27 | 0.0% |
| South American | 291 | 0.2% |
| Spaniard | 334 | 0.2% |
| Spanish | 187 | 0.1% |
| Sri Lankan | 2,407 | 1.5% |
| Subsaharan African | 656 | 0.4% |
| Swedish | 1,028 | 0.7% |
| Swiss | 448 | 0.3% |
| Syrian | 49 | 0.0% |
| Thai | 1,587 | 1.0% |
| Trinidadian and Tobagonian | 19 | 0.0% |
| Turkish | 18 | 0.0% |
| Ugandan | 36 | 0.0% |
| Ukrainian | 239 | 0.2% |
| Venezuelan | 23 | 0.0% |
| Welsh | 934 | 0.6% |
| Yugoslavian | 8 | 0.0% |
| Zimbabwean | 21 | 0.0% | View All 124 Rows |
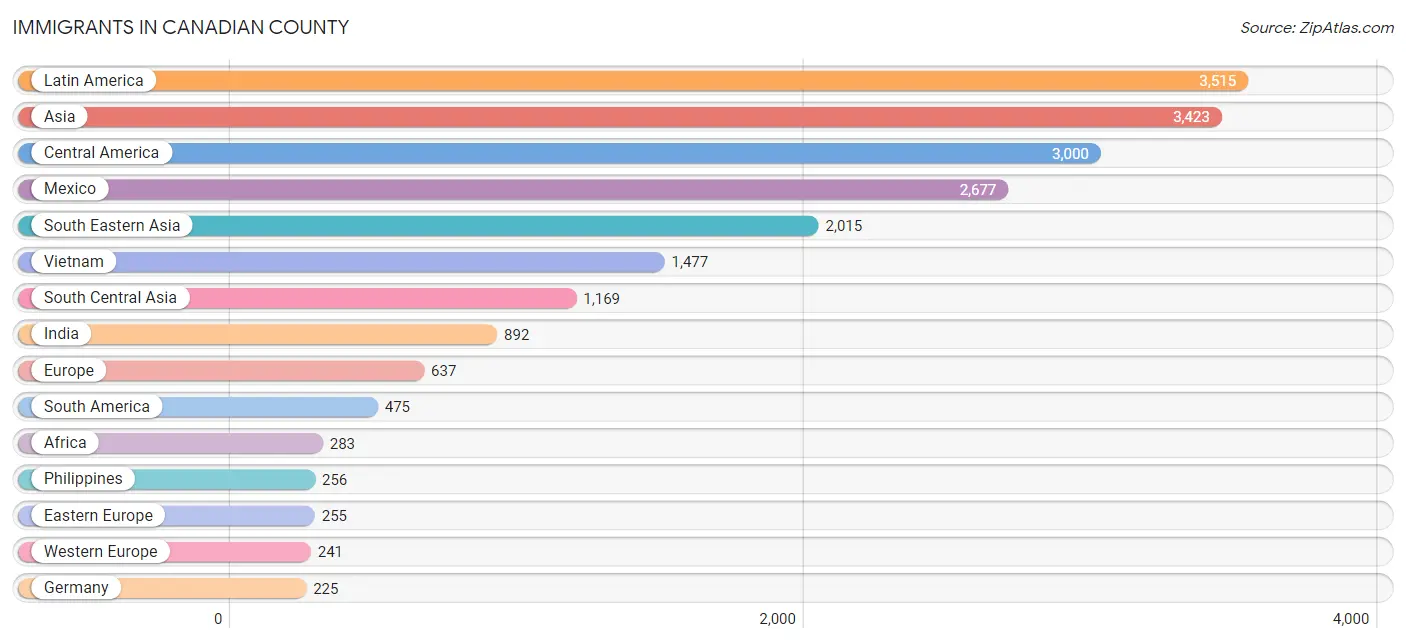
Immigrants in Canadian County
The most numerous immigrant groups reported in Canadian County came from Latin America (3,515 | 2.2%), Asia (3,423 | 2.2%), Central America (3,000 | 1.9%), Mexico (2,677 | 1.7%), and South Eastern Asia (2,015 | 1.3%), together accounting for 9.3% of all Canadian County residents.
| Immigration Origin | # Population | % Population |
| Africa | 283 | 0.2% |
| Argentina | 43 | 0.0% |
| Asia | 3,423 | 2.2% |
| Australia | 33 | 0.0% |
| Bahamas | 23 | 0.0% |
| Bangladesh | 196 | 0.1% |
| Brazil | 196 | 0.1% |
| Cameroon | 56 | 0.0% |
| Canada | 187 | 0.1% |
| Caribbean | 40 | 0.0% |
| Central America | 3,000 | 1.9% |
| China | 100 | 0.1% |
| Colombia | 76 | 0.1% |
| Costa Rica | 30 | 0.0% |
| Cuba | 17 | 0.0% |
| Eastern Africa | 154 | 0.1% |
| Eastern Asia | 183 | 0.1% |
| Eastern Europe | 255 | 0.2% |
| Ecuador | 11 | 0.0% |
| Egypt | 16 | 0.0% |
| El Salvador | 15 | 0.0% |
| England | 31 | 0.0% |
| Europe | 637 | 0.4% |
| Germany | 225 | 0.1% |
| Ghana | 15 | 0.0% |
| Guatemala | 185 | 0.1% |
| Guyana | 41 | 0.0% |
| Hong Kong | 7 | 0.0% |
| Hungary | 19 | 0.0% |
| India | 892 | 0.6% |
| Indonesia | 68 | 0.0% |
| Iran | 52 | 0.0% |
| Iraq | 16 | 0.0% |
| Japan | 35 | 0.0% |
| Jordan | 9 | 0.0% |
| Kenya | 40 | 0.0% |
| Korea | 48 | 0.0% |
| Kuwait | 13 | 0.0% |
| Laos | 108 | 0.1% |
| Latin America | 3,515 | 2.2% |
| Malaysia | 13 | 0.0% |
| Mexico | 2,677 | 1.7% |
| Middle Africa | 56 | 0.0% |
| Morocco | 22 | 0.0% |
| Nicaragua | 7 | 0.0% |
| Nigeria | 20 | 0.0% |
| Northern Africa | 38 | 0.0% |
| Northern Europe | 105 | 0.1% |
| Norway | 18 | 0.0% |
| Oceania | 44 | 0.0% |
| Pakistan | 29 | 0.0% |
| Panama | 23 | 0.0% |
| Peru | 85 | 0.1% |
| Philippines | 256 | 0.2% |
| Poland | 41 | 0.0% |
| Russia | 84 | 0.1% |
| Saudi Arabia | 18 | 0.0% |
| Serbia | 66 | 0.0% |
| Singapore | 10 | 0.0% |
| South America | 475 | 0.3% |
| South Central Asia | 1,169 | 0.7% |
| South Eastern Asia | 2,015 | 1.3% |
| Southern Europe | 36 | 0.0% |
| Spain | 36 | 0.0% |
| Switzerland | 16 | 0.0% |
| Taiwan | 12 | 0.0% |
| Thailand | 23 | 0.0% |
| Uganda | 36 | 0.0% |
| Ukraine | 45 | 0.0% |
| Venezuela | 23 | 0.0% |
| Vietnam | 1,477 | 0.9% |
| Western Africa | 35 | 0.0% |
| Western Asia | 56 | 0.0% |
| Western Europe | 241 | 0.2% |
| Zimbabwe | 78 | 0.1% | View All 75 Rows |
Sex and Age in Canadian County
Sex and Age in Canadian County
The most populous age groups in Canadian County are 35 to 39 Years (6,458 | 8.3%) for men and 5 to 9 Years (6,053 | 7.7%) for women.
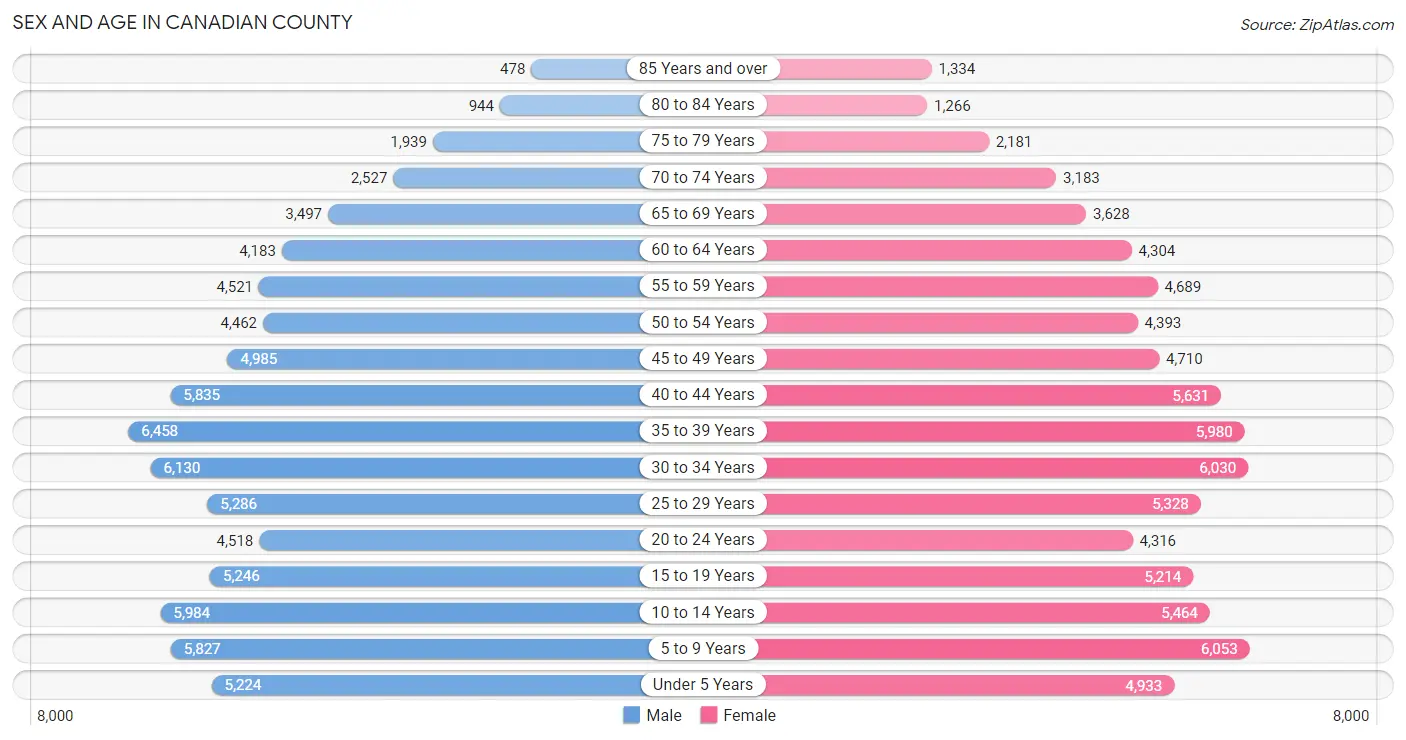
| Age Bracket | Male | Female |
| Under 5 Years | 5,224 (6.7%) | 4,933 (6.3%) |
| 5 to 9 Years | 5,827 (7.5%) | 6,053 (7.7%) |
| 10 to 14 Years | 5,984 (7.7%) | 5,464 (7.0%) |
| 15 to 19 Years | 5,246 (6.7%) | 5,214 (6.6%) |
| 20 to 24 Years | 4,518 (5.8%) | 4,316 (5.5%) |
| 25 to 29 Years | 5,286 (6.8%) | 5,328 (6.8%) |
| 30 to 34 Years | 6,130 (7.9%) | 6,030 (7.7%) |
| 35 to 39 Years | 6,458 (8.3%) | 5,980 (7.6%) |
| 40 to 44 Years | 5,835 (7.5%) | 5,631 (7.2%) |
| 45 to 49 Years | 4,985 (6.4%) | 4,710 (6.0%) |
| 50 to 54 Years | 4,462 (5.7%) | 4,393 (5.6%) |
| 55 to 59 Years | 4,521 (5.8%) | 4,689 (6.0%) |
| 60 to 64 Years | 4,183 (5.4%) | 4,304 (5.5%) |
| 65 to 69 Years | 3,497 (4.5%) | 3,628 (4.6%) |
| 70 to 74 Years | 2,527 (3.2%) | 3,183 (4.1%) |
| 75 to 79 Years | 1,939 (2.5%) | 2,181 (2.8%) |
| 80 to 84 Years | 944 (1.2%) | 1,266 (1.6%) |
| 85 Years and over | 478 (0.6%) | 1,334 (1.7%) |
| Total | 78,044 (100.0%) | 78,637 (100.0%) |
Families and Households in Canadian County
Median Family Size in Canadian County
The median family size in Canadian County is 3.19 persons per family, with married-couple families (32,892 | 79.6%) accounting for the largest median family size of 3.25 persons per family. On the other hand, single male/father families (2,585 | 6.3%) represent the smallest median family size with 2.63 persons per family.
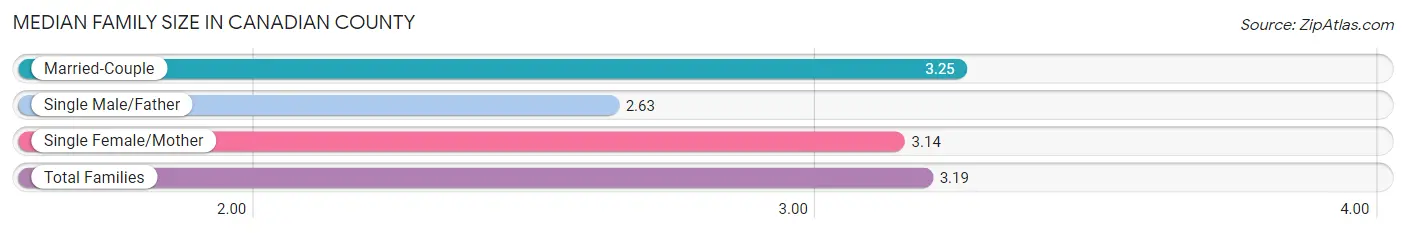
| Family Type | # Families | Family Size |
| Married-Couple | 32,892 (79.6%) | 3.25 |
| Single Male/Father | 2,585 (6.3%) | 2.63 |
| Single Female/Mother | 5,846 (14.1%) | 3.14 |
| Total Families | 41,323 (100.0%) | 3.19 |
Median Household Size in Canadian County
The median household size in Canadian County is 2.74 persons per household, with single female/mother households (5,846 | 10.4%) accounting for the largest median household size of 3.42 persons per household. non-family households (14,977 | 26.6%) represent the smallest median household size with 1.26 persons per household.
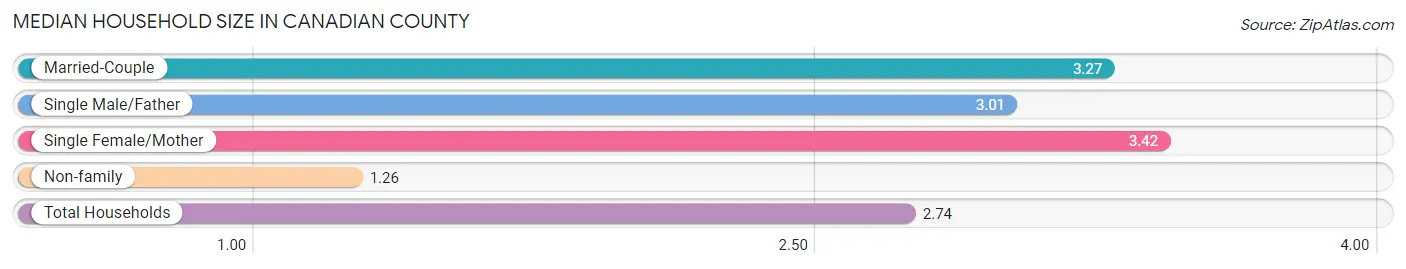
| Household Type | # Households | Household Size |
| Married-Couple | 32,892 (58.4%) | 3.27 |
| Single Male/Father | 2,585 (4.6%) | 3.01 |
| Single Female/Mother | 5,846 (10.4%) | 3.42 |
| Non-family | 14,977 (26.6%) | 1.26 |
| Total Households | 56,300 (100.0%) | 2.74 |
Household Size by Marriage Status in Canadian County
Out of a total of 56,300 households in Canadian County, 41,323 (73.4%) are family households, while 14,977 (26.6%) are nonfamily households. The most numerous type of family households are 2-person households, comprising 17,403, and the most common type of nonfamily households are 1-person households, comprising 12,289.
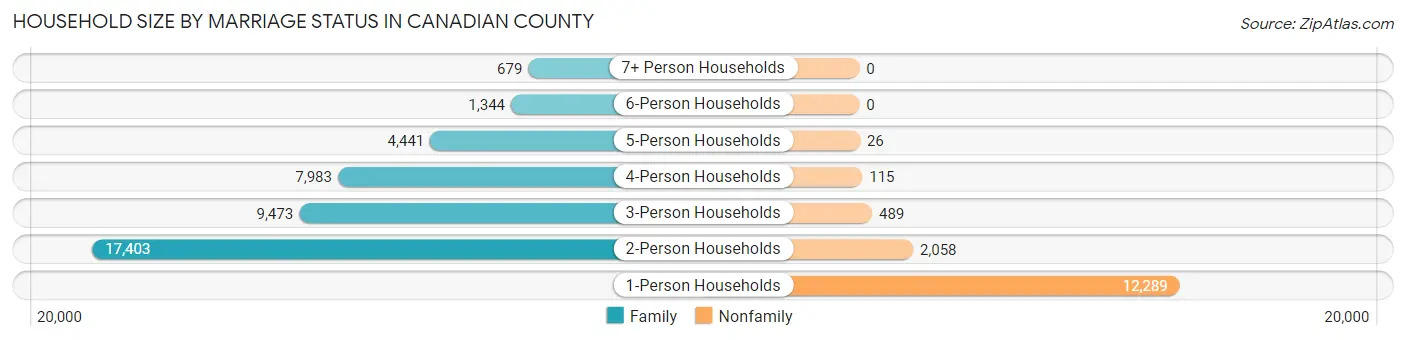
| Household Size | Family Households | Nonfamily Households |
| 1-Person Households | - | 12,289 (21.8%) |
| 2-Person Households | 17,403 (30.9%) | 2,058 (3.7%) |
| 3-Person Households | 9,473 (16.8%) | 489 (0.9%) |
| 4-Person Households | 7,983 (14.2%) | 115 (0.2%) |
| 5-Person Households | 4,441 (7.9%) | 26 (0.1%) |
| 6-Person Households | 1,344 (2.4%) | 0 (0.0%) |
| 7+ Person Households | 679 (1.2%) | 0 (0.0%) |
| Total | 41,323 (73.4%) | 14,977 (26.6%) |
Female Fertility in Canadian County
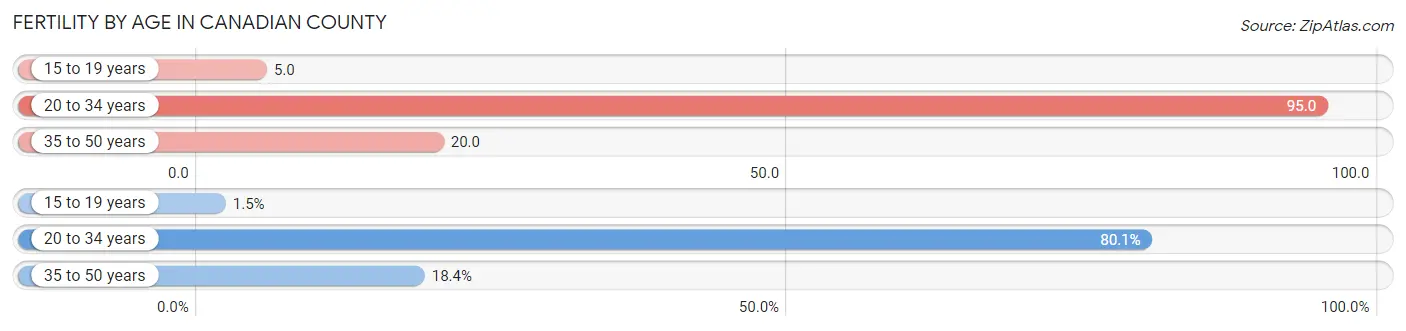
Fertility by Age in Canadian County
Average fertility rate in Canadian County is 48.0 births per 1,000 women. Women in the age bracket of 20 to 34 years have the highest fertility rate with 95.0 births per 1,000 women. Women in the age bracket of 20 to 34 years acount for 80.1% of all women with births.
| Age Bracket | Women with Births | Births / 1,000 Women |
| 15 to 19 years | 28 (1.5%) | 5.0 |
| 20 to 34 years | 1,490 (80.1%) | 95.0 |
| 35 to 50 years | 342 (18.4%) | 20.0 |
| Total | 1,860 (100.0%) | 48.0 |
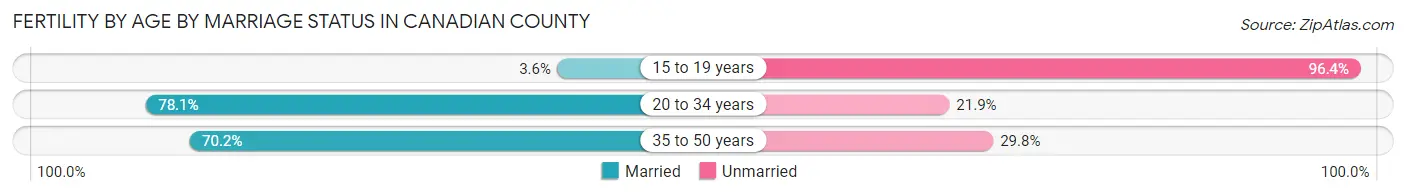
Fertility by Age by Marriage Status in Canadian County
75.5% of women with births (1,860) in Canadian County are married. The highest percentage of unmarried women with births falls into 15 to 19 years age bracket with 96.4% of them unmarried at the time of birth, while the lowest percentage of unmarried women with births belong to 20 to 34 years age bracket with 21.9% of them unmarried.
| Age Bracket | Married | Unmarried |
| 15 to 19 years | 1 (3.6%) | 27 (96.4%) |
| 20 to 34 years | 1,164 (78.1%) | 326 (21.9%) |
| 35 to 50 years | 240 (70.2%) | 102 (29.8%) |
| Total | 1,404 (75.5%) | 456 (24.5%) |
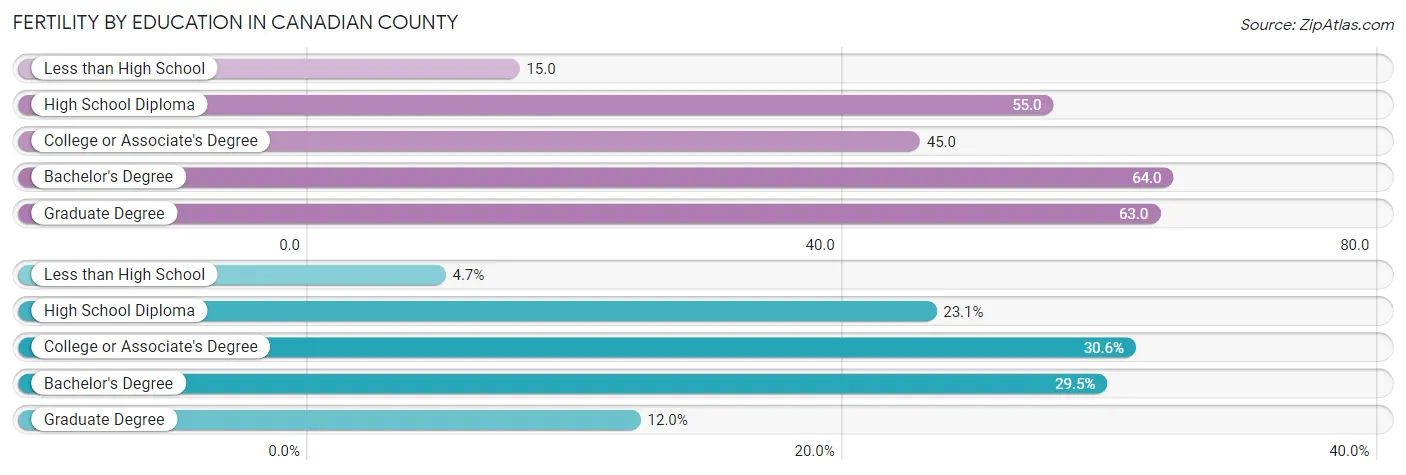
Fertility by Education in Canadian County
Average fertility rate in Canadian County is 48.0 births per 1,000 women. Women with the education attainment of bachelor's degree have the highest fertility rate of 64.0 births per 1,000 women, while women with the education attainment of less than high school have the lowest fertility at 15.0 births per 1,000 women. Women with the education attainment of college or associate's degree represent 30.6% of all women with births.
| Educational Attainment | Women with Births | Births / 1,000 Women |
| Less than High School | 88 (4.7%) | 15.0 |
| High School Diploma | 430 (23.1%) | 55.0 |
| College or Associate's Degree | 569 (30.6%) | 45.0 |
| Bachelor's Degree | 549 (29.5%) | 64.0 |
| Graduate Degree | 224 (12.0%) | 63.0 |
| Total | 1,860 (100.0%) | 48.0 |
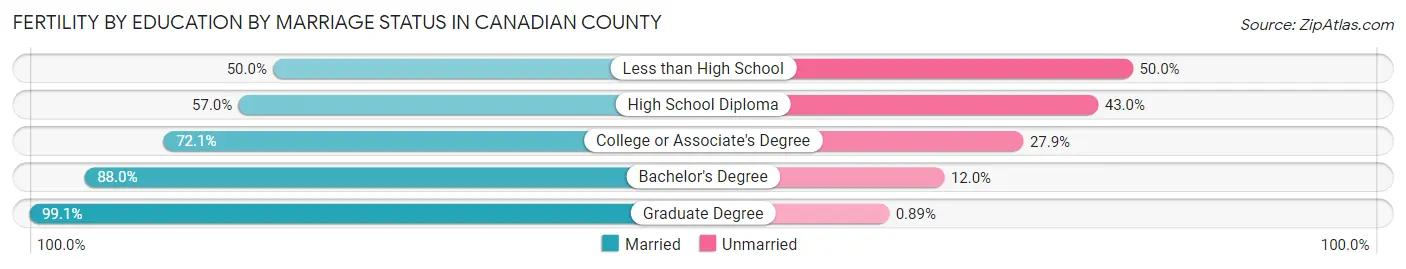
Fertility by Education by Marriage Status in Canadian County
24.5% of women with births in Canadian County are unmarried. Women with the educational attainment of graduate degree are most likely to be married with 99.1% of them married at childbirth, while women with the educational attainment of less than high school are least likely to be married with 50.0% of them unmarried at childbirth.
| Educational Attainment | Married | Unmarried |
| Less than High School | 44 (50.0%) | 44 (50.0%) |
| High School Diploma | 245 (57.0%) | 185 (43.0%) |
| College or Associate's Degree | 410 (72.1%) | 159 (27.9%) |
| Bachelor's Degree | 483 (88.0%) | 66 (12.0%) |
| Graduate Degree | 222 (99.1%) | 2 (0.9%) |
| Total | 1,404 (75.5%) | 456 (24.5%) |
Income in Canadian County
Income Overview in Canadian County
Per Capita Income in Canadian County is $36,884, while median incomes of families and households are $93,729 and $82,364 respectively.
| Characteristic | Number | Measure |
| Per Capita Income | 156,681 | $36,884 |
| Median Family Income | 41,323 | $93,729 |
| Mean Family Income | 41,323 | $110,650 |
| Median Household Income | 56,300 | $82,364 |
| Mean Household Income | 56,300 | $98,921 |
| Income Deficit | 41,323 | $10,777 |
| Wage / Income Gap (%) | 156,681 | 34.30% |
| Wage / Income Gap ($) | 156,681 | 65.70¢ per $1 |
| Gini / Inequality Index | 156,681 | 0.38 |
Earnings by Sex in Canadian County
Average Earnings in Canadian County are $44,274, $55,730 for men and $36,614 for women, a difference of 34.3%.
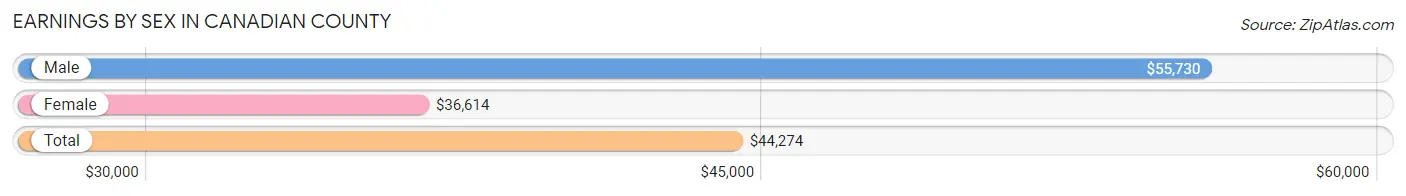
| Sex | Number | Average Earnings |
| Male | 45,342 (52.8%) | $55,730 |
| Female | 40,563 (47.2%) | $36,614 |
| Total | 85,905 (100.0%) | $44,274 |
Earnings by Sex by Income Bracket in Canadian County
The most common earnings brackets in Canadian County are $100,000+ for men (8,158 | 18.0%) and $35,000 to $39,999 for women (3,059 | 7.5%).
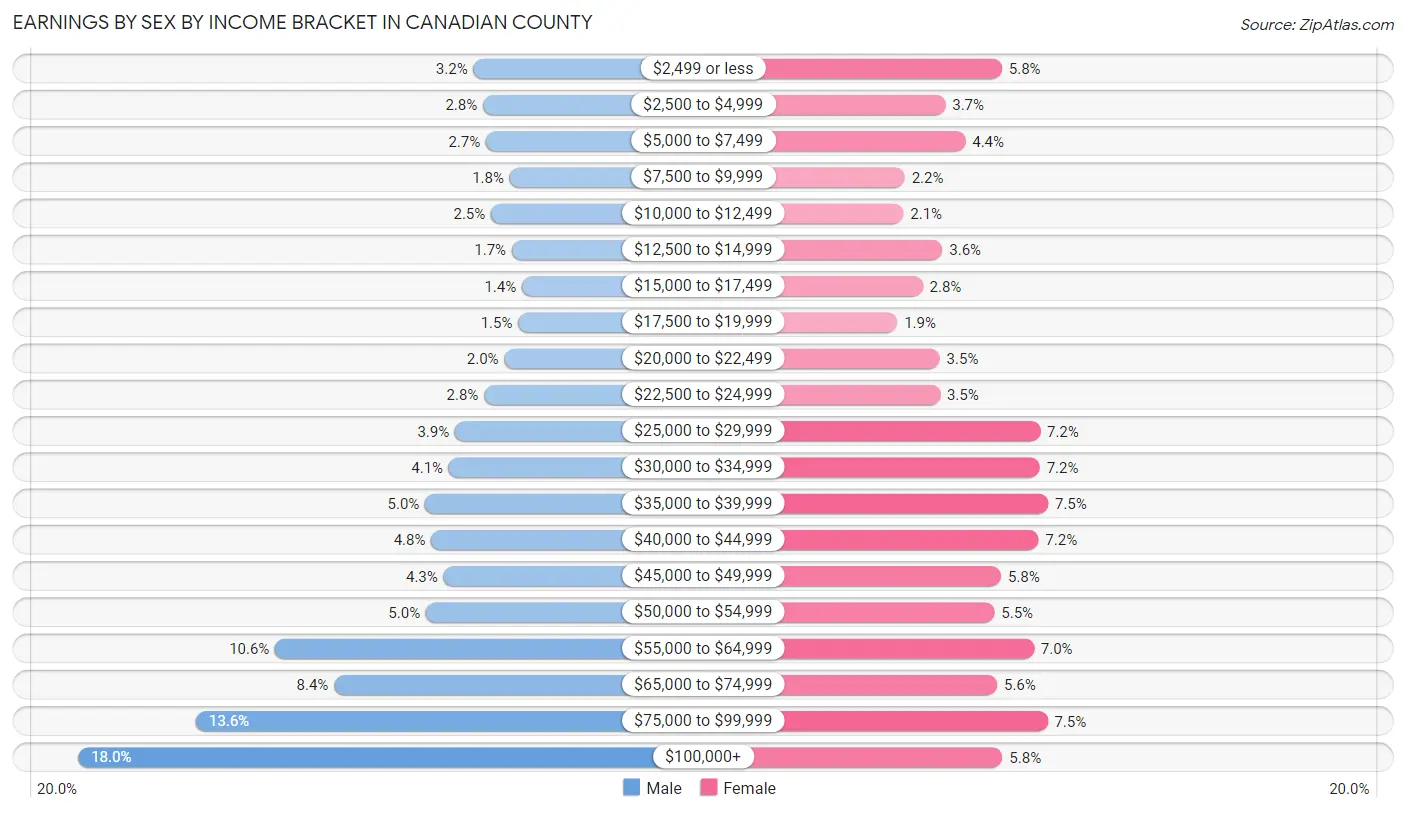
| Income | Male | Female |
| $2,499 or less | 1,442 (3.2%) | 2,356 (5.8%) |
| $2,500 to $4,999 | 1,279 (2.8%) | 1,497 (3.7%) |
| $5,000 to $7,499 | 1,229 (2.7%) | 1,802 (4.4%) |
| $7,500 to $9,999 | 826 (1.8%) | 879 (2.2%) |
| $10,000 to $12,499 | 1,141 (2.5%) | 861 (2.1%) |
| $12,500 to $14,999 | 788 (1.7%) | 1,451 (3.6%) |
| $15,000 to $17,499 | 616 (1.4%) | 1,153 (2.8%) |
| $17,500 to $19,999 | 679 (1.5%) | 767 (1.9%) |
| $20,000 to $22,499 | 918 (2.0%) | 1,411 (3.5%) |
| $22,500 to $24,999 | 1,259 (2.8%) | 1,417 (3.5%) |
| $25,000 to $29,999 | 1,753 (3.9%) | 2,935 (7.2%) |
| $30,000 to $34,999 | 1,859 (4.1%) | 2,933 (7.2%) |
| $35,000 to $39,999 | 2,263 (5.0%) | 3,059 (7.5%) |
| $40,000 to $44,999 | 2,158 (4.8%) | 2,914 (7.2%) |
| $45,000 to $49,999 | 1,948 (4.3%) | 2,346 (5.8%) |
| $50,000 to $54,999 | 2,248 (5.0%) | 2,242 (5.5%) |
| $55,000 to $64,999 | 4,813 (10.6%) | 2,843 (7.0%) |
| $65,000 to $74,999 | 3,808 (8.4%) | 2,282 (5.6%) |
| $75,000 to $99,999 | 6,157 (13.6%) | 3,049 (7.5%) |
| $100,000+ | 8,158 (18.0%) | 2,366 (5.8%) |
| Total | 45,342 (100.0%) | 40,563 (100.0%) |
Earnings by Sex by Educational Attainment in Canadian County
Average earnings in Canadian County are $61,168 for men and $40,099 for women, a difference of 34.4%. Men with an educational attainment of graduate degree enjoy the highest average annual earnings of $81,636, while those with less than high school education earn the least with $35,000. Women with an educational attainment of graduate degree earn the most with the average annual earnings of $58,750, while those with less than high school education have the smallest earnings of $19,703.
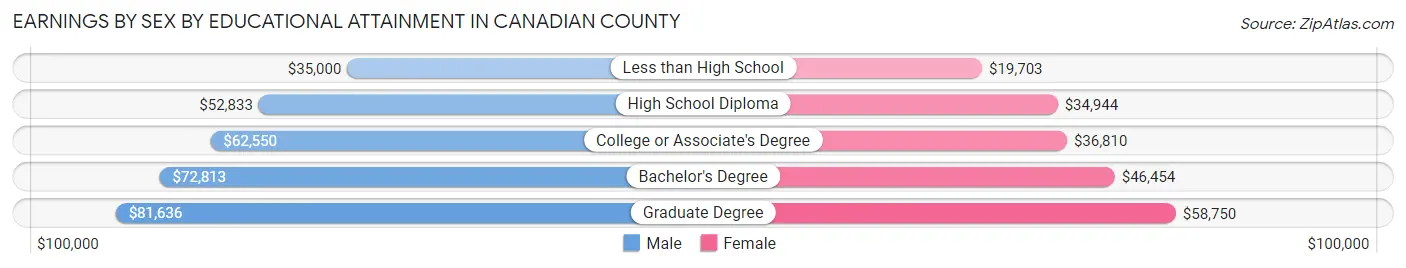
| Educational Attainment | Male Income | Female Income |
| Less than High School | $35,000 | $19,703 |
| High School Diploma | $52,833 | $34,944 |
| College or Associate's Degree | $62,550 | $36,810 |
| Bachelor's Degree | $72,813 | $46,454 |
| Graduate Degree | $81,636 | $58,750 |
| Total | $61,168 | $40,099 |
Family Income in Canadian County
Family Income Brackets in Canadian County
According to the Canadian County family income data, there are 10,579 families falling into the $100,000 to $149,999 income range, which is the most common income bracket and makes up 25.6% of all families. Conversely, the $10,000 to $14,999 income bracket is the least frequent group with only 248 families (0.6%) belonging to this category.
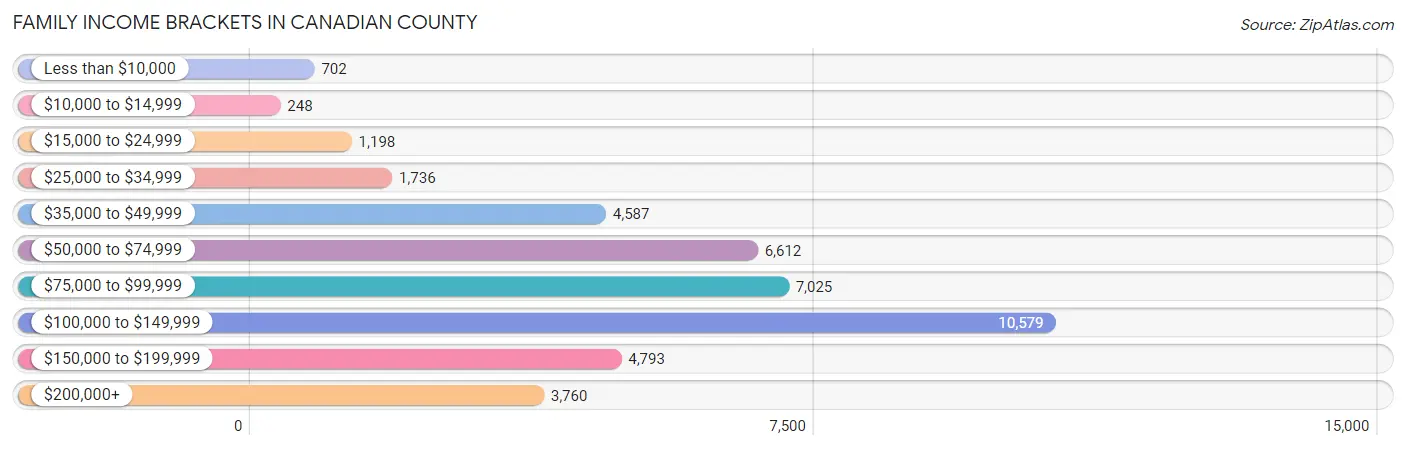
| Income Bracket | # Families | % Families |
| Less than $10,000 | 702 | 1.7% |
| $10,000 to $14,999 | 248 | 0.6% |
| $15,000 to $24,999 | 1,198 | 2.9% |
| $25,000 to $34,999 | 1,736 | 4.2% |
| $35,000 to $49,999 | 4,587 | 11.1% |
| $50,000 to $74,999 | 6,612 | 16.0% |
| $75,000 to $99,999 | 7,025 | 17.0% |
| $100,000 to $149,999 | 10,579 | 25.6% |
| $150,000 to $199,999 | 4,793 | 11.6% |
| $200,000+ | 3,760 | 9.1% |
Family Income by Famaliy Size in Canadian County
7+ person families (514 | 1.2%) account for the highest median family income in Canadian County with $106,333 per family, while 2-person families (18,646 | 45.1%) have the highest median income of $43,930 per family member.
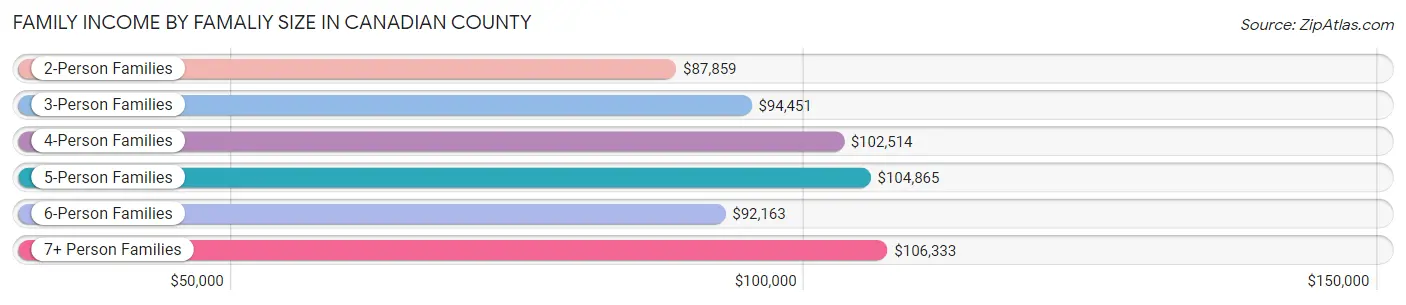
| Income Bracket | # Families | Median Income |
| 2-Person Families | 18,646 (45.1%) | $87,859 |
| 3-Person Families | 9,212 (22.3%) | $94,451 |
| 4-Person Families | 7,661 (18.5%) | $102,514 |
| 5-Person Families | 3,941 (9.5%) | $104,865 |
| 6-Person Families | 1,349 (3.3%) | $92,163 |
| 7+ Person Families | 514 (1.2%) | $106,333 |
| Total | 41,323 (100.0%) | $93,729 |
Family Income by Number of Earners in Canadian County
The median family income in Canadian County is $93,729, with families comprising 3+ earners (4,092) having the highest median family income of $135,360, while families with no earners (4,758) have the lowest median family income of $57,933, accounting for 9.9% and 11.5% of families, respectively.
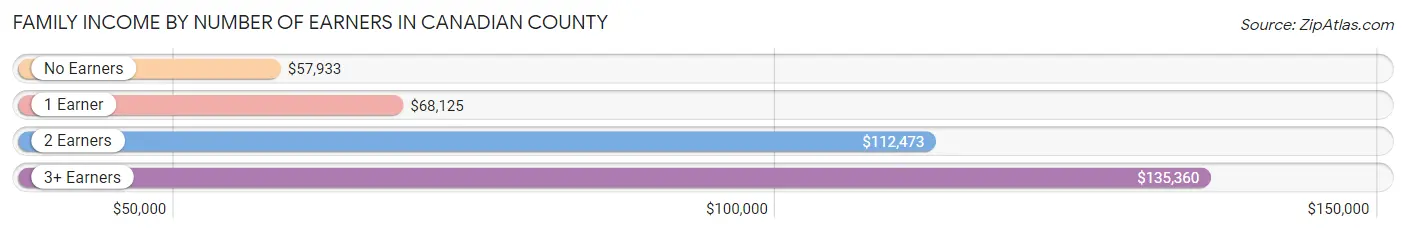
| Number of Earners | # Families | Median Income |
| No Earners | 4,758 (11.5%) | $57,933 |
| 1 Earner | 12,402 (30.0%) | $68,125 |
| 2 Earners | 20,071 (48.6%) | $112,473 |
| 3+ Earners | 4,092 (9.9%) | $135,360 |
| Total | 41,323 (100.0%) | $93,729 |
Household Income in Canadian County
Household Income Brackets in Canadian County
With 12,724 households falling in the category, the $100,000 to $149,999 income range is the most frequent in Canadian County, accounting for 22.6% of all households. In contrast, only 1,013 households (1.8%) fall into the $10,000 to $14,999 income bracket, making it the least populous group.
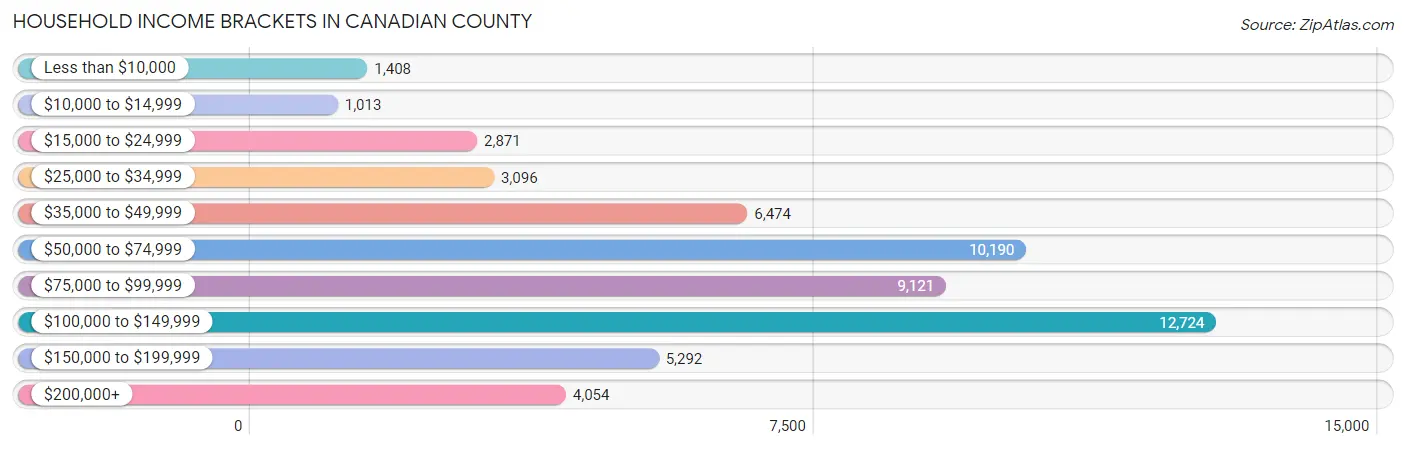
| Income Bracket | # Households | % Households |
| Less than $10,000 | 1,408 | 2.5% |
| $10,000 to $14,999 | 1,013 | 1.8% |
| $15,000 to $24,999 | 2,871 | 5.1% |
| $25,000 to $34,999 | 3,096 | 5.5% |
| $35,000 to $49,999 | 6,474 | 11.5% |
| $50,000 to $74,999 | 10,190 | 18.1% |
| $75,000 to $99,999 | 9,121 | 16.2% |
| $100,000 to $149,999 | 12,724 | 22.6% |
| $150,000 to $199,999 | 5,292 | 9.4% |
| $200,000+ | 4,054 | 7.2% |
Household Income by Householder Age in Canadian County
The median household income in Canadian County is $82,364, with the highest median household income of $94,244 found in the 45 to 64 years age bracket for the primary householder. A total of 19,869 households (35.3%) fall into this category. Meanwhile, the 15 to 24 years age bracket for the primary householder has the lowest median household income of $56,530, with 1,892 households (3.4%) in this group.
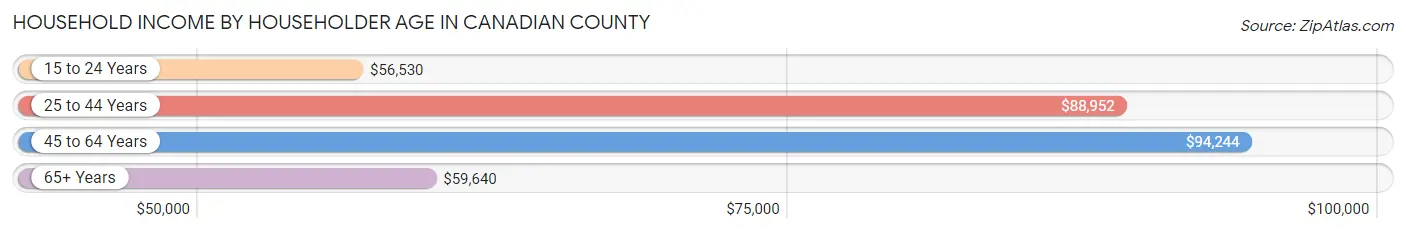
| Income Bracket | # Households | Median Income |
| 15 to 24 Years | 1,892 (3.4%) | $56,530 |
| 25 to 44 Years | 21,544 (38.3%) | $88,952 |
| 45 to 64 Years | 19,869 (35.3%) | $94,244 |
| 65+ Years | 12,995 (23.1%) | $59,640 |
| Total | 56,300 (100.0%) | $82,364 |
Poverty in Canadian County
Income Below Poverty by Sex and Age in Canadian County
With 7.4% poverty level for males and 8.6% for females among the residents of Canadian County, 6 to 11 year old males and 18 to 24 year old females are the most vulnerable to poverty, with 850 males (12.0%) and 847 females (14.2%) in their respective age groups living below the poverty level.
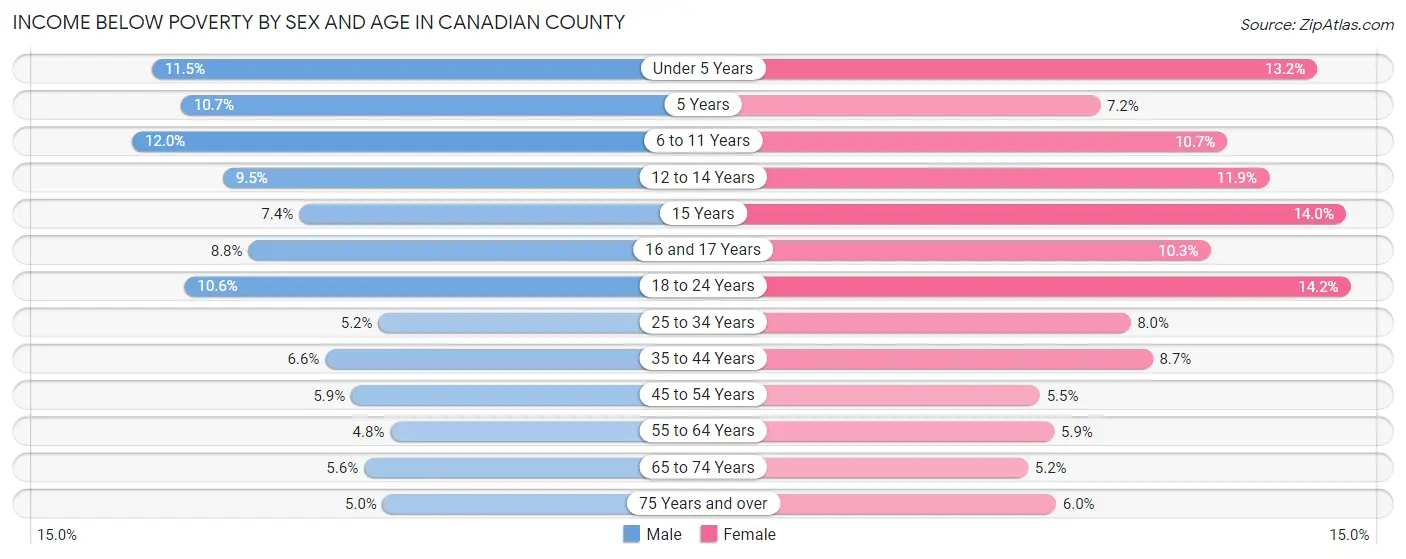
| Age Bracket | Male | Female |
| Under 5 Years | 574 (11.5%) | 624 (13.2%) |
| 5 Years | 138 (10.6%) | 85 (7.2%) |
| 6 to 11 Years | 850 (12.0%) | 750 (10.7%) |
| 12 to 14 Years | 308 (9.5%) | 378 (11.9%) |
| 15 Years | 76 (7.4%) | 175 (14.0%) |
| 16 and 17 Years | 213 (8.8%) | 223 (10.3%) |
| 18 to 24 Years | 642 (10.5%) | 847 (14.2%) |
| 25 to 34 Years | 566 (5.1%) | 911 (8.0%) |
| 35 to 44 Years | 778 (6.6%) | 1,003 (8.6%) |
| 45 to 54 Years | 544 (5.9%) | 501 (5.5%) |
| 55 to 64 Years | 412 (4.8%) | 530 (5.9%) |
| 65 to 74 Years | 334 (5.6%) | 344 (5.2%) |
| 75 Years and over | 166 (5.0%) | 278 (6.0%) |
| Total | 5,601 (7.4%) | 6,649 (8.6%) |
Income Above Poverty by Sex and Age in Canadian County
According to the poverty statistics in Canadian County, males aged 55 to 64 years and females aged 65 to 74 years are the age groups that are most secure financially, with 95.2% of males and 94.8% of females in these age groups living above the poverty line.
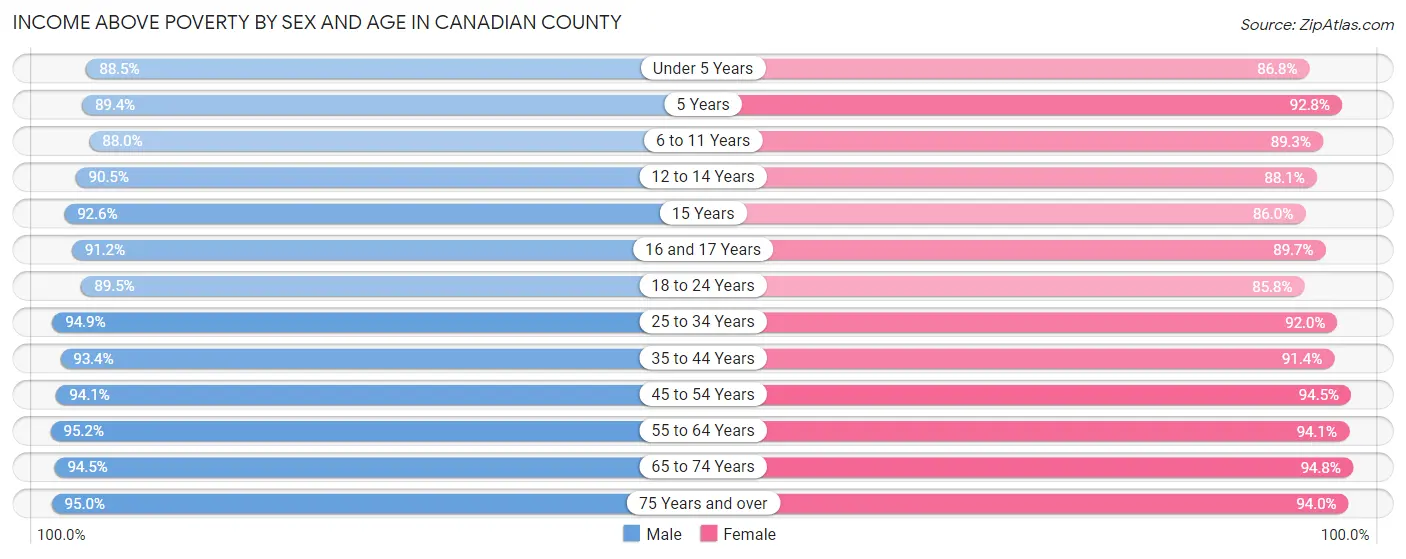
| Age Bracket | Male | Female |
| Under 5 Years | 4,436 (88.5%) | 4,093 (86.8%) |
| 5 Years | 1,158 (89.3%) | 1,097 (92.8%) |
| 6 to 11 Years | 6,226 (88.0%) | 6,237 (89.3%) |
| 12 to 14 Years | 2,942 (90.5%) | 2,801 (88.1%) |
| 15 Years | 957 (92.6%) | 1,072 (86.0%) |
| 16 and 17 Years | 2,216 (91.2%) | 1,951 (89.7%) |
| 18 to 24 Years | 5,441 (89.4%) | 5,135 (85.8%) |
| 25 to 34 Years | 10,430 (94.9%) | 10,437 (92.0%) |
| 35 to 44 Years | 10,962 (93.4%) | 10,593 (91.3%) |
| 45 to 54 Years | 8,659 (94.1%) | 8,588 (94.5%) |
| 55 to 64 Years | 8,127 (95.2%) | 8,445 (94.1%) |
| 65 to 74 Years | 5,681 (94.5%) | 6,302 (94.8%) |
| 75 Years and over | 3,137 (95.0%) | 4,386 (94.0%) |
| Total | 70,372 (92.6%) | 71,137 (91.4%) |
Income Below Poverty Among Married-Couple Families in Canadian County
The poverty statistics for married-couple families in Canadian County show that 2.5% or 825 of the total 32,892 families live below the poverty line. Families with 3 or 4 children have the highest poverty rate of 8.5%, comprising of 273 families. On the other hand, families with no children have the lowest poverty rate of 1.4%, which includes 247 families.
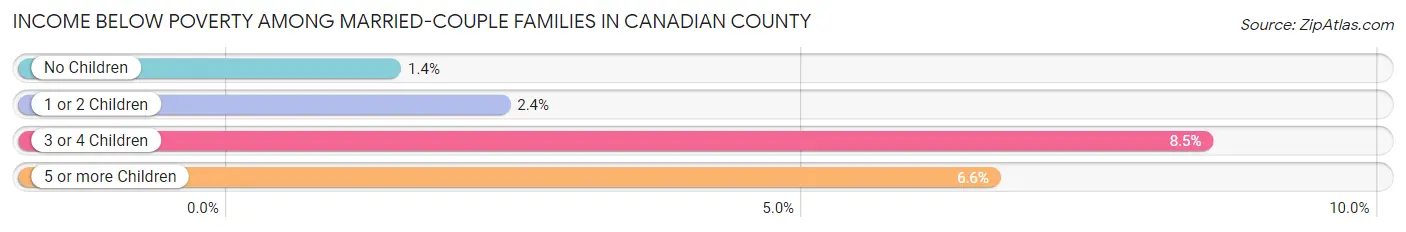
| Children | Above Poverty | Below Poverty |
| No Children | 17,116 (98.6%) | 247 (1.4%) |
| 1 or 2 Children | 11,726 (97.6%) | 285 (2.4%) |
| 3 or 4 Children | 2,944 (91.5%) | 273 (8.5%) |
| 5 or more Children | 281 (93.4%) | 20 (6.6%) |
| Total | 32,067 (97.5%) | 825 (2.5%) |
Income Below Poverty Among Single-Parent Households in Canadian County
According to the poverty data in Canadian County, 11.0% or 283 single-father households and 17.6% or 1,032 single-mother households are living below the poverty line. Among single-father households, those with 5 or more children have the highest poverty rate, with 61 households (100.0%) experiencing poverty. Likewise, among single-mother households, those with 5 or more children have the highest poverty rate, with 106 households (91.4%) falling below the poverty line.
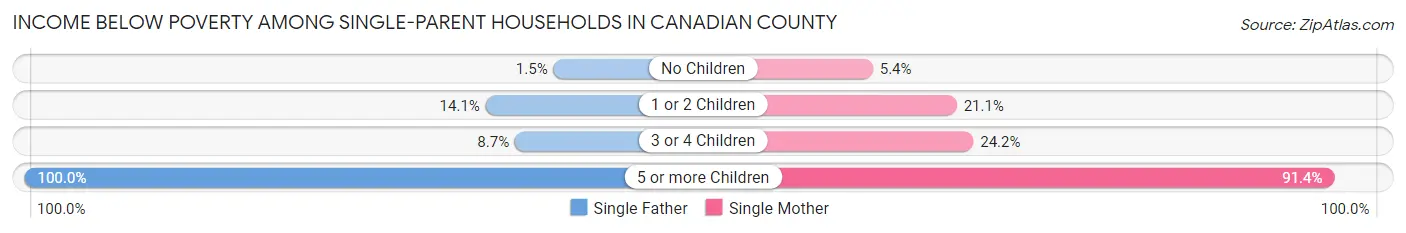
| Children | Single Father | Single Mother |
| No Children | 15 (1.5%) | 105 (5.4%) |
| 1 or 2 Children | 196 (14.1%) | 644 (21.0%) |
| 3 or 4 Children | 11 (8.7%) | 177 (24.1%) |
| 5 or more Children | 61 (100.0%) | 106 (91.4%) |
| Total | 283 (11.0%) | 1,032 (17.6%) |
Income Below Poverty Among Married-Couple vs Single-Parent Households in Canadian County
The poverty data for Canadian County shows that 825 of the married-couple family households (2.5%) and 1,315 of the single-parent households (15.6%) are living below the poverty level. Within the married-couple family households, those with 3 or 4 children have the highest poverty rate, with 273 households (8.5%) falling below the poverty line. Among the single-parent households, those with 5 or more children have the highest poverty rate, with 167 household (94.4%) living below poverty.
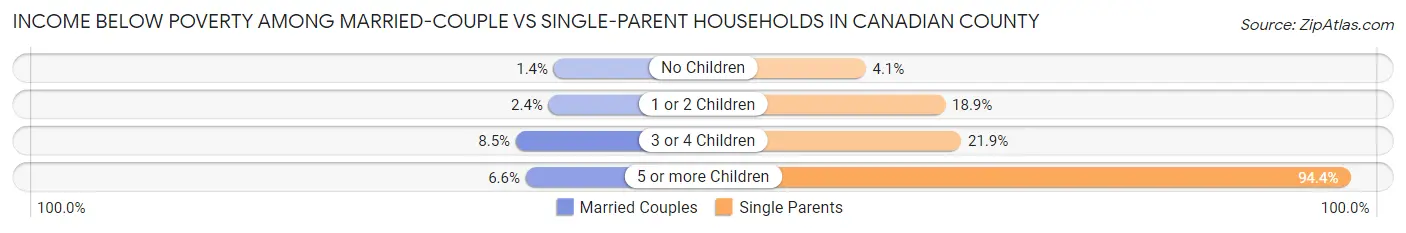
| Children | Married-Couple Families | Single-Parent Households |
| No Children | 247 (1.4%) | 120 (4.1%) |
| 1 or 2 Children | 285 (2.4%) | 840 (18.9%) |
| 3 or 4 Children | 273 (8.5%) | 188 (21.9%) |
| 5 or more Children | 20 (6.6%) | 167 (94.4%) |
| Total | 825 (2.5%) | 1,315 (15.6%) |
Employment Characteristics in Canadian County
Employment by Class of Employer in Canadian County
Among the 78,324 employed individuals in Canadian County, private company employees (51,358 | 65.6%), not-for-profit organizations (5,678 | 7.2%), and local government employees (5,485 | 7.0%) make up the most common classes of employment.
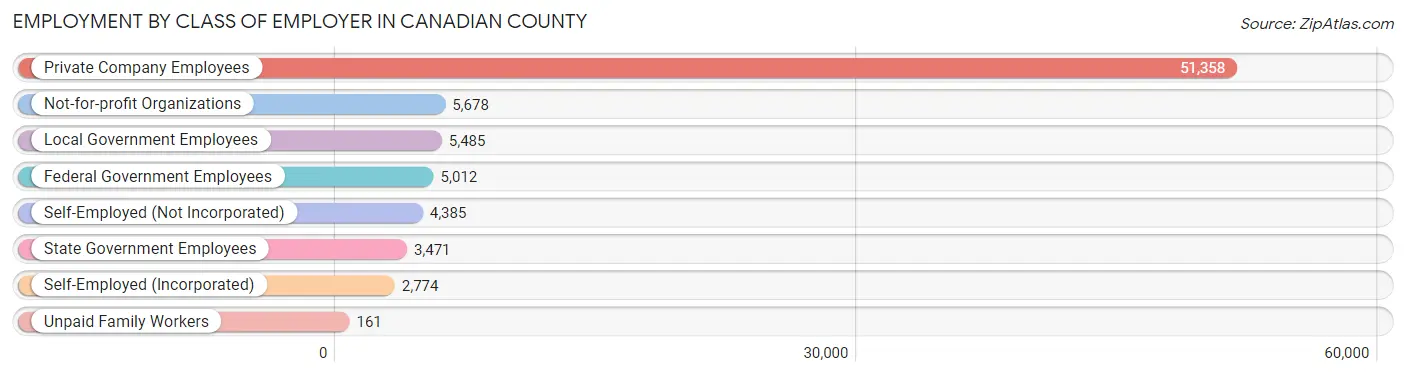
| Employer Class | # Employees | % Employees |
| Private Company Employees | 51,358 | 65.6% |
| Self-Employed (Incorporated) | 2,774 | 3.5% |
| Self-Employed (Not Incorporated) | 4,385 | 5.6% |
| Not-for-profit Organizations | 5,678 | 7.2% |
| Local Government Employees | 5,485 | 7.0% |
| State Government Employees | 3,471 | 4.4% |
| Federal Government Employees | 5,012 | 6.4% |
| Unpaid Family Workers | 161 | 0.2% |
| Total | 78,324 | 100.0% |
Employment Status by Age in Canadian County
According to the labor force statistics for Canadian County, out of the total population over 16 years of age (120,908), 68.6% or 82,943 individuals are in the labor force, with 4.1% or 3,401 of them unemployed. The age group with the highest labor force participation rate is 30 to 34 years, with 85.7% or 10,421 individuals in the labor force. Within the labor force, the 16 to 19 years age range has the highest percentage of unemployed individuals, with 15.1% or 576 of them being unemployed.
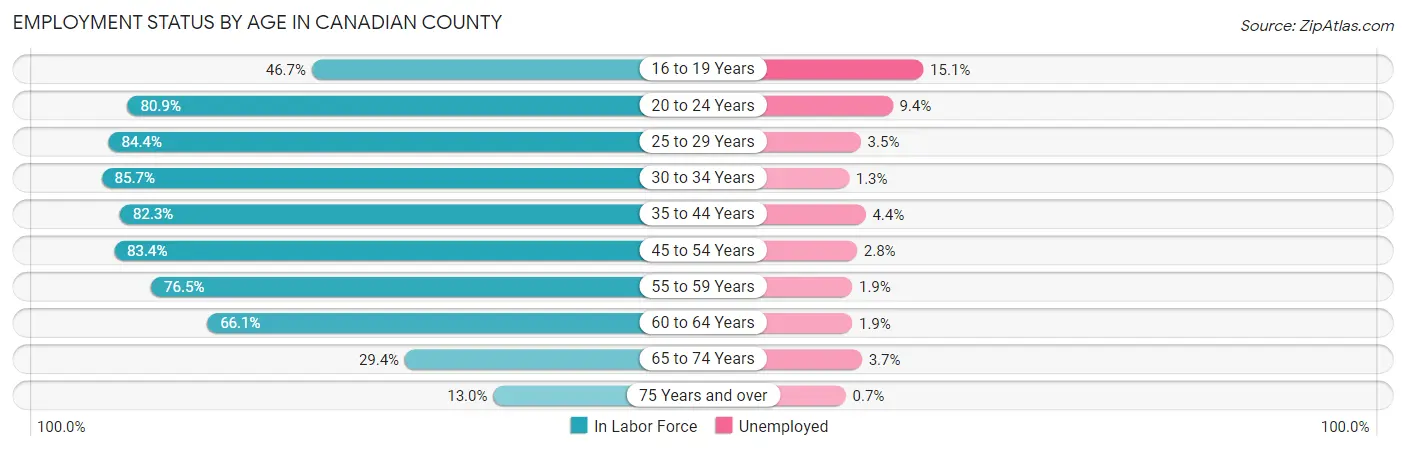
| Age Bracket | In Labor Force | Unemployed |
| 16 to 19 Years | 3,816 (46.7%) | 576 (15.1%) |
| 20 to 24 Years | 7,147 (80.9%) | 672 (9.4%) |
| 25 to 29 Years | 8,958 (84.4%) | 314 (3.5%) |
| 30 to 34 Years | 10,421 (85.7%) | 135 (1.3%) |
| 35 to 44 Years | 19,673 (82.3%) | 866 (4.4%) |
| 45 to 54 Years | 15,471 (83.4%) | 433 (2.8%) |
| 55 to 59 Years | 7,046 (76.5%) | 134 (1.9%) |
| 60 to 64 Years | 5,610 (66.1%) | 107 (1.9%) |
| 65 to 74 Years | 3,773 (29.4%) | 140 (3.7%) |
| 75 Years and over | 1,058 (13.0%) | 7 (0.7%) |
| Total | 82,943 (68.6%) | 3,401 (4.1%) |
Employment Status by Educational Attainment in Canadian County
According to labor force statistics for Canadian County, 81.0% of individuals (67,169) out of the total population between 25 and 64 years of age (82,925) are in the labor force, with 3.0% or 2,015 of them being unemployed. The group with the highest labor force participation rate are those with the educational attainment of bachelor's degree or higher, with 88.7% or 24,507 individuals in the labor force. Within the labor force, individuals with less than high school education have the highest percentage of unemployment, with 5.8% or 257 of them being unemployed.
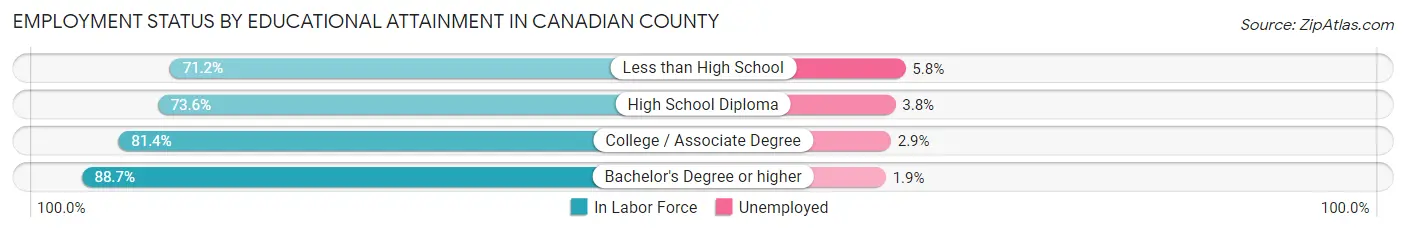
| Educational Attainment | In Labor Force | Unemployed |
| Less than High School | 4,436 (71.2%) | 361 (5.8%) |
| High School Diploma | 16,125 (73.6%) | 833 (3.8%) |
| College / Associate Degree | 22,106 (81.4%) | 788 (2.9%) |
| Bachelor's Degree or higher | 24,507 (88.7%) | 525 (1.9%) |
| Total | 67,169 (81.0%) | 2,488 (3.0%) |
Employment Occupations by Sex in Canadian County
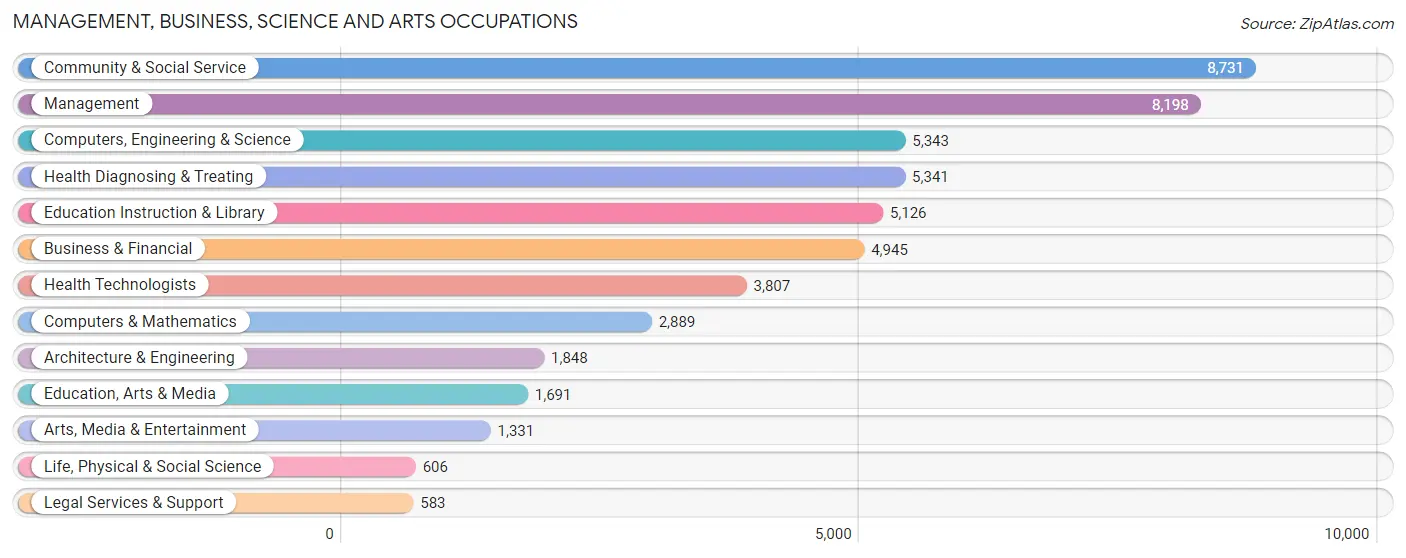
Management, Business, Science and Arts Occupations
The most common Management, Business, Science and Arts occupations in Canadian County are Community & Social Service (8,731 | 11.0%), Management (8,198 | 10.4%), Computers, Engineering & Science (5,343 | 6.8%), Health Diagnosing & Treating (5,341 | 6.8%), and Education Instruction & Library (5,126 | 6.5%).
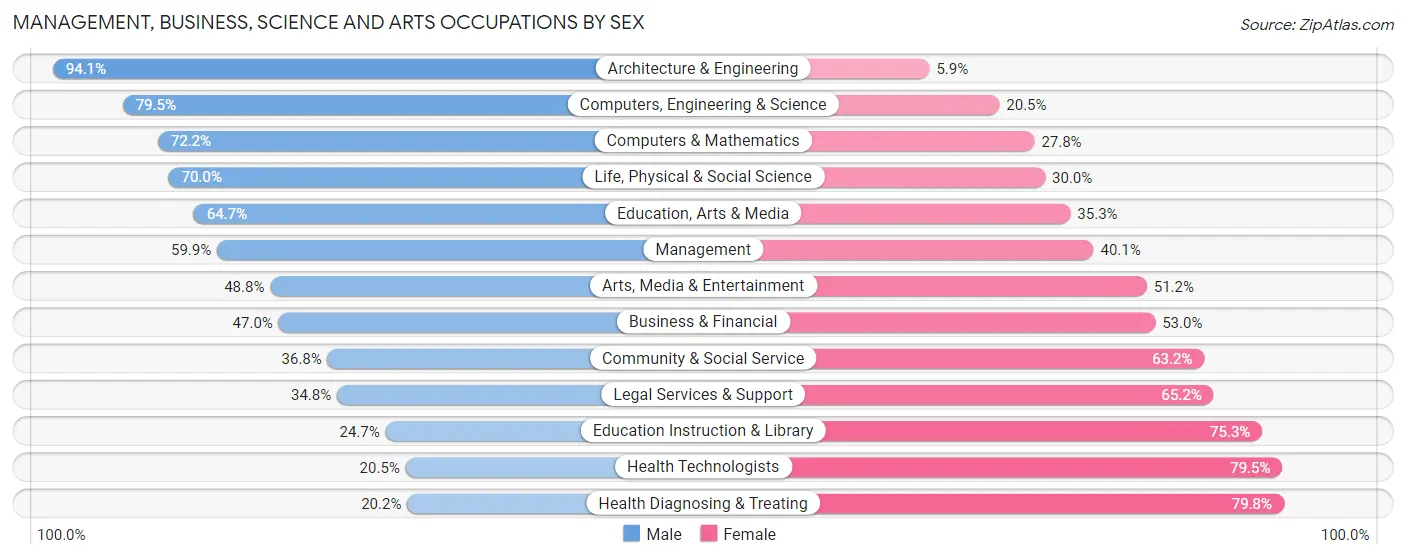
Management, Business, Science and Arts Occupations by Sex
Within the Management, Business, Science and Arts occupations in Canadian County, the most male-oriented occupations are Architecture & Engineering (94.1%), Computers, Engineering & Science (79.5%), and Computers & Mathematics (72.2%), while the most female-oriented occupations are Health Diagnosing & Treating (79.8%), Health Technologists (79.5%), and Education Instruction & Library (75.3%).
| Occupation | Male | Female |
| Management | 4,907 (59.9%) | 3,291 (40.1%) |
| Business & Financial | 2,324 (47.0%) | 2,621 (53.0%) |
| Computers, Engineering & Science | 4,249 (79.5%) | 1,094 (20.5%) |
| Computers & Mathematics | 2,086 (72.2%) | 803 (27.8%) |
| Architecture & Engineering | 1,739 (94.1%) | 109 (5.9%) |
| Life, Physical & Social Science | 424 (70.0%) | 182 (30.0%) |
| Community & Social Service | 3,212 (36.8%) | 5,519 (63.2%) |
| Education, Arts & Media | 1,094 (64.7%) | 597 (35.3%) |
| Legal Services & Support | 203 (34.8%) | 380 (65.2%) |
| Education Instruction & Library | 1,266 (24.7%) | 3,860 (75.3%) |
| Arts, Media & Entertainment | 649 (48.8%) | 682 (51.2%) |
| Health Diagnosing & Treating | 1,078 (20.2%) | 4,263 (79.8%) |
| Health Technologists | 781 (20.5%) | 3,026 (79.5%) |
| Total (Category) | 15,770 (48.4%) | 16,788 (51.6%) |
| Total (Overall) | 41,721 (52.7%) | 37,391 (47.3%) |
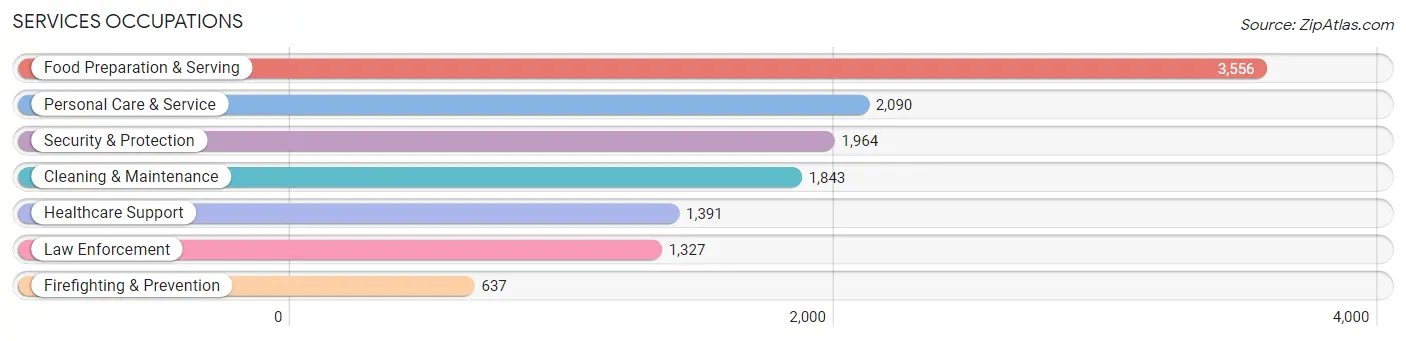
Services Occupations
The most common Services occupations in Canadian County are Food Preparation & Serving (3,556 | 4.5%), Personal Care & Service (2,090 | 2.6%), Security & Protection (1,964 | 2.5%), Cleaning & Maintenance (1,843 | 2.3%), and Healthcare Support (1,391 | 1.8%).
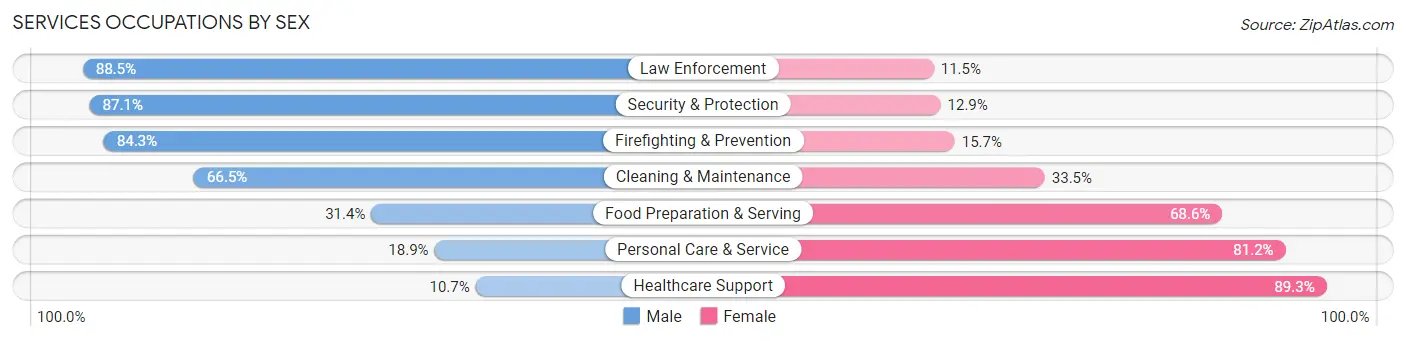
Services Occupations by Sex
Within the Services occupations in Canadian County, the most male-oriented occupations are Law Enforcement (88.5%), Security & Protection (87.1%), and Firefighting & Prevention (84.3%), while the most female-oriented occupations are Healthcare Support (89.3%), Personal Care & Service (81.1%), and Food Preparation & Serving (68.6%).
| Occupation | Male | Female |
| Healthcare Support | 149 (10.7%) | 1,242 (89.3%) |
| Security & Protection | 1,711 (87.1%) | 253 (12.9%) |
| Firefighting & Prevention | 537 (84.3%) | 100 (15.7%) |
| Law Enforcement | 1,174 (88.5%) | 153 (11.5%) |
| Food Preparation & Serving | 1,115 (31.4%) | 2,441 (68.6%) |
| Cleaning & Maintenance | 1,225 (66.5%) | 618 (33.5%) |
| Personal Care & Service | 394 (18.9%) | 1,696 (81.1%) |
| Total (Category) | 4,594 (42.4%) | 6,250 (57.6%) |
| Total (Overall) | 41,721 (52.7%) | 37,391 (47.3%) |
Sales and Office Occupations
The most common Sales and Office occupations in Canadian County are Office & Administration (11,315 | 14.3%), and Sales & Related (7,626 | 9.6%).

Sales and Office Occupations by Sex

| Occupation | Male | Female |
| Sales & Related | 4,256 (55.8%) | 3,370 (44.2%) |
| Office & Administration | 2,314 (20.4%) | 9,001 (79.5%) |
| Total (Category) | 6,570 (34.7%) | 12,371 (65.3%) |
| Total (Overall) | 41,721 (52.7%) | 37,391 (47.3%) |
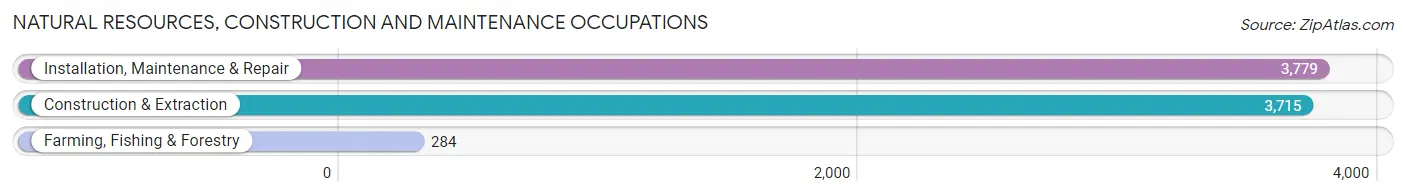
Natural Resources, Construction and Maintenance Occupations
The most common Natural Resources, Construction and Maintenance occupations in Canadian County are Installation, Maintenance & Repair (3,779 | 4.8%), Construction & Extraction (3,715 | 4.7%), and Farming, Fishing & Forestry (284 | 0.4%).
Natural Resources, Construction and Maintenance Occupations by Sex
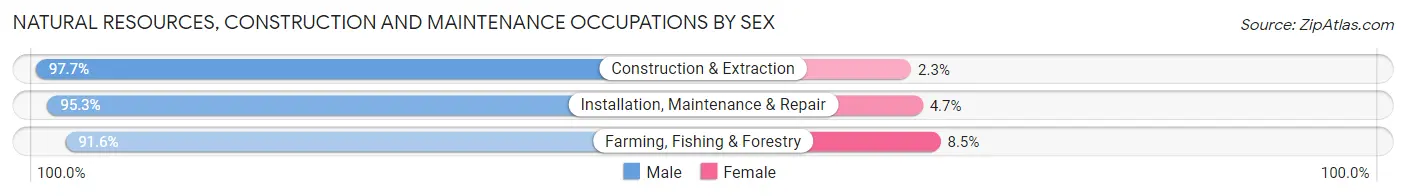
| Occupation | Male | Female |
| Farming, Fishing & Forestry | 260 (91.5%) | 24 (8.5%) |
| Construction & Extraction | 3,628 (97.7%) | 87 (2.3%) |
| Installation, Maintenance & Repair | 3,600 (95.3%) | 179 (4.7%) |
| Total (Category) | 7,488 (96.3%) | 290 (3.7%) |
| Total (Overall) | 41,721 (52.7%) | 37,391 (47.3%) |
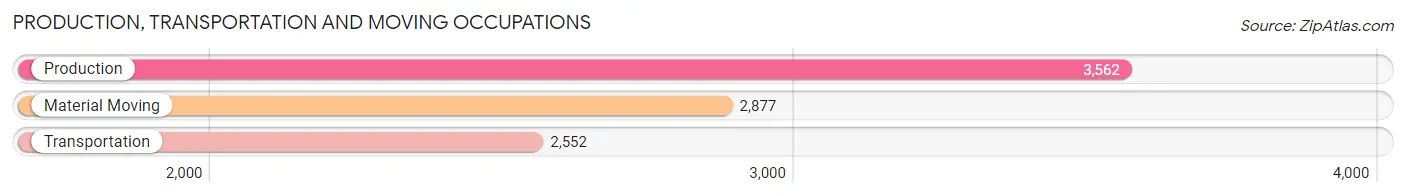
Production, Transportation and Moving Occupations
The most common Production, Transportation and Moving occupations in Canadian County are Production (3,562 | 4.5%), Material Moving (2,877 | 3.6%), and Transportation (2,552 | 3.2%).
Production, Transportation and Moving Occupations by Sex
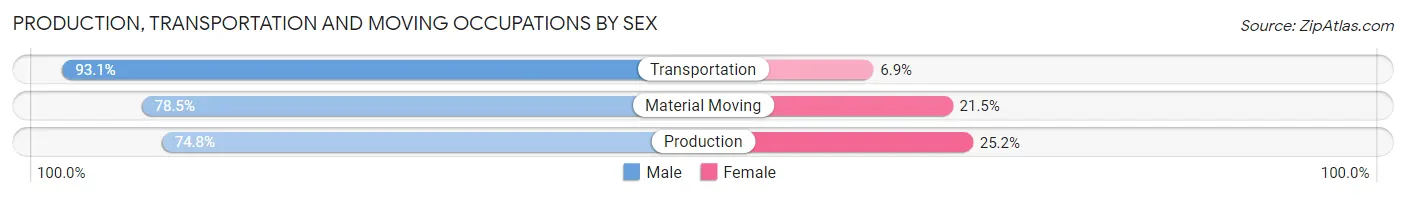
| Occupation | Male | Female |
| Production | 2,665 (74.8%) | 897 (25.2%) |
| Transportation | 2,375 (93.1%) | 177 (6.9%) |
| Material Moving | 2,259 (78.5%) | 618 (21.5%) |
| Total (Category) | 7,299 (81.2%) | 1,692 (18.8%) |
| Total (Overall) | 41,721 (52.7%) | 37,391 (47.3%) |
Employment Industries by Sex in Canadian County
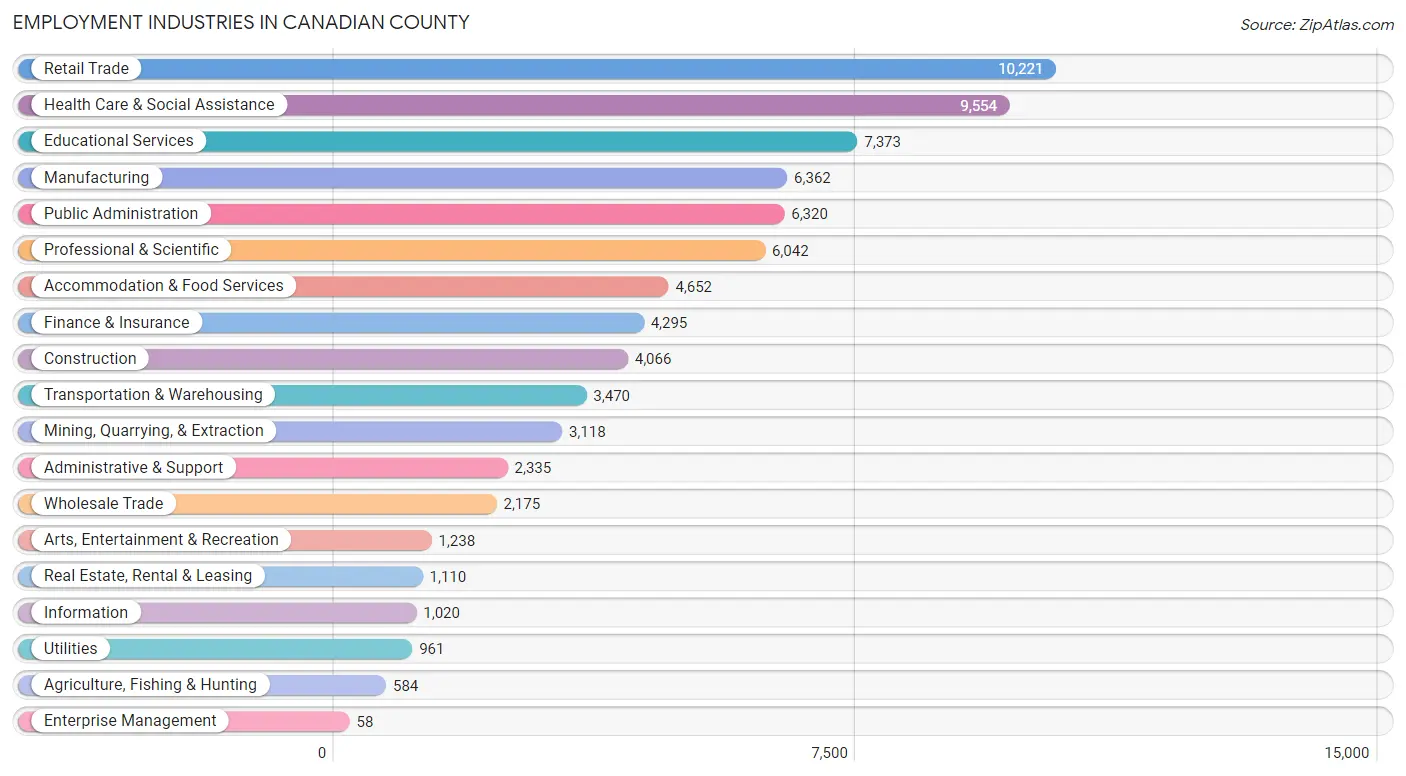
Employment Industries in Canadian County
The major employment industries in Canadian County include Retail Trade (10,221 | 12.9%), Health Care & Social Assistance (9,554 | 12.1%), Educational Services (7,373 | 9.3%), Manufacturing (6,362 | 8.0%), and Public Administration (6,320 | 8.0%).
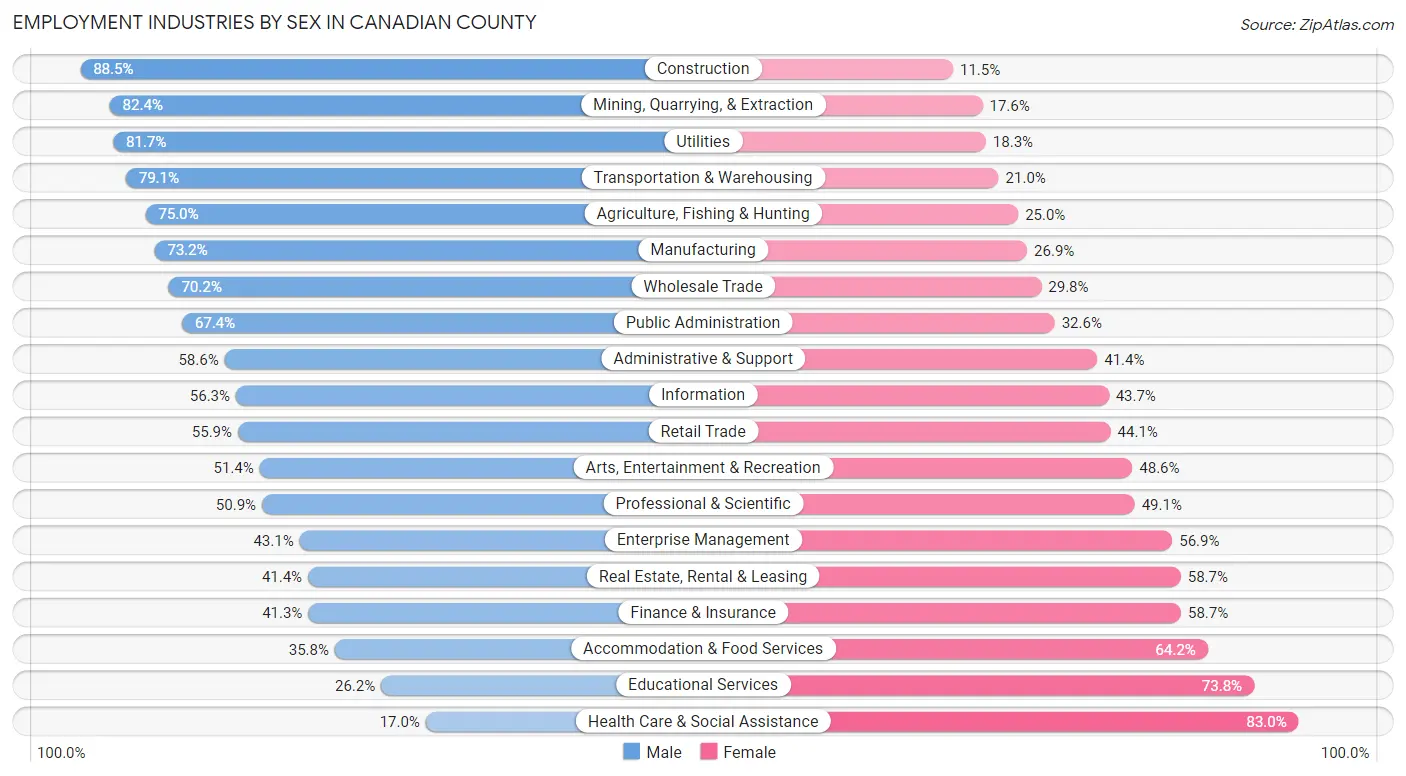
Employment Industries by Sex in Canadian County
The Canadian County industries that see more men than women are Construction (88.5%), Mining, Quarrying, & Extraction (82.4%), and Utilities (81.7%), whereas the industries that tend to have a higher number of women are Health Care & Social Assistance (83.0%), Educational Services (73.8%), and Accommodation & Food Services (64.2%).
| Industry | Male | Female |
| Agriculture, Fishing & Hunting | 438 (75.0%) | 146 (25.0%) |
| Mining, Quarrying, & Extraction | 2,569 (82.4%) | 549 (17.6%) |
| Construction | 3,598 (88.5%) | 468 (11.5%) |
| Manufacturing | 4,654 (73.2%) | 1,708 (26.9%) |
| Wholesale Trade | 1,527 (70.2%) | 648 (29.8%) |
| Retail Trade | 5,709 (55.9%) | 4,512 (44.1%) |
| Transportation & Warehousing | 2,743 (79.0%) | 727 (20.9%) |
| Utilities | 785 (81.7%) | 176 (18.3%) |
| Information | 574 (56.3%) | 446 (43.7%) |
| Finance & Insurance | 1,774 (41.3%) | 2,521 (58.7%) |
| Real Estate, Rental & Leasing | 459 (41.3%) | 651 (58.7%) |
| Professional & Scientific | 3,074 (50.9%) | 2,968 (49.1%) |
| Enterprise Management | 25 (43.1%) | 33 (56.9%) |
| Administrative & Support | 1,369 (58.6%) | 966 (41.4%) |
| Educational Services | 1,933 (26.2%) | 5,440 (73.8%) |
| Health Care & Social Assistance | 1,622 (17.0%) | 7,932 (83.0%) |
| Arts, Entertainment & Recreation | 636 (51.4%) | 602 (48.6%) |
| Accommodation & Food Services | 1,665 (35.8%) | 2,987 (64.2%) |
| Public Administration | 4,262 (67.4%) | 2,058 (32.6%) |
| Total | 41,721 (52.7%) | 37,391 (47.3%) |
Education in Canadian County
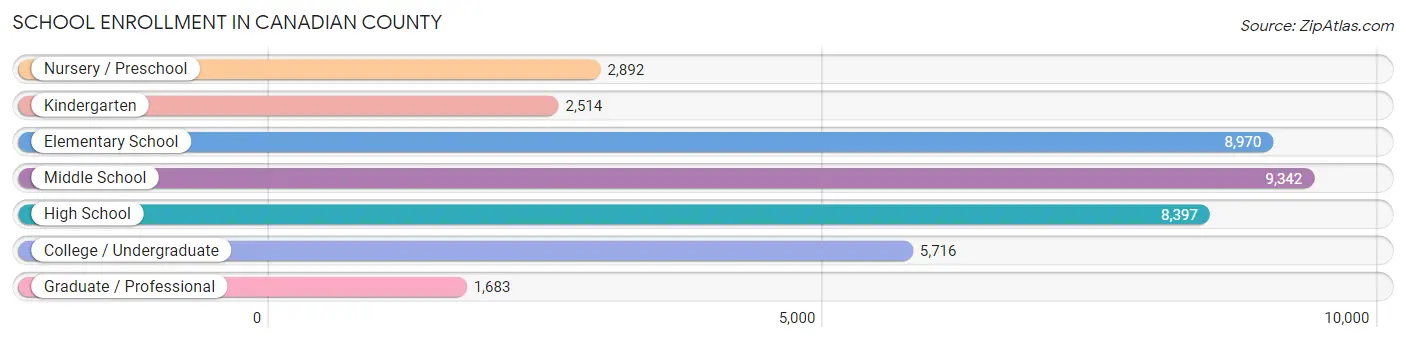
School Enrollment in Canadian County
The most common levels of schooling among the 39,514 students in Canadian County are middle school (9,342 | 23.6%), elementary school (8,970 | 22.7%), and high school (8,397 | 21.2%).
| School Level | # Students | % Students |
| Nursery / Preschool | 2,892 | 7.3% |
| Kindergarten | 2,514 | 6.4% |
| Elementary School | 8,970 | 22.7% |
| Middle School | 9,342 | 23.6% |
| High School | 8,397 | 21.2% |
| College / Undergraduate | 5,716 | 14.5% |
| Graduate / Professional | 1,683 | 4.3% |
| Total | 39,514 | 100.0% |
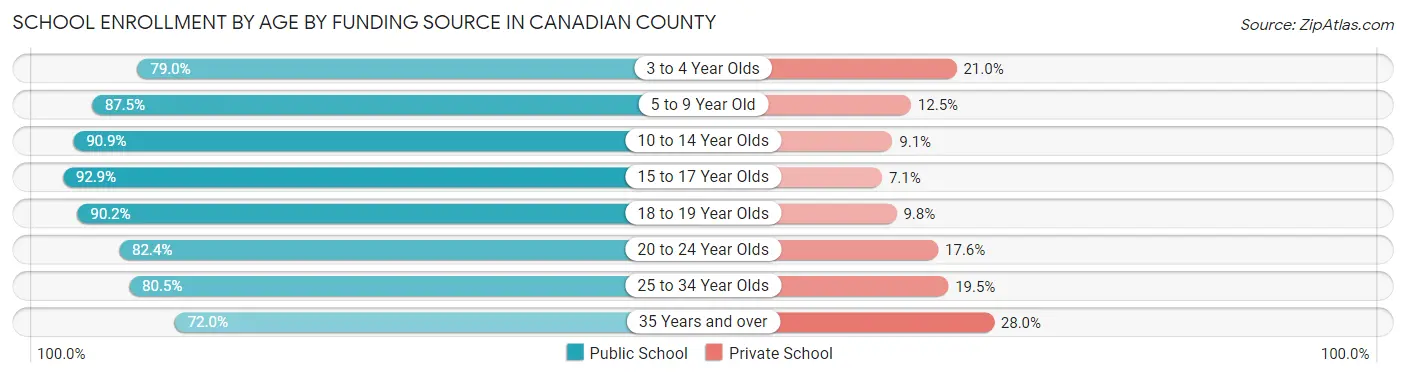
School Enrollment by Age by Funding Source in Canadian County
Out of a total of 39,514 students who are enrolled in schools in Canadian County, 4,900 (12.4%) attend a private institution, while the remaining 34,614 (87.6%) are enrolled in public schools. The age group of 35 years and over has the highest likelihood of being enrolled in private schools, with 548 (28.0% in the age bracket) enrolled. Conversely, the age group of 15 to 17 year olds has the lowest likelihood of being enrolled in a private school, with 6,120 (92.9% in the age bracket) attending a public institution.
| Age Bracket | Public School | Private School |
| 3 to 4 Year Olds | 1,609 (79.0%) | 428 (21.0%) |
| 5 to 9 Year Old | 9,681 (87.5%) | 1,386 (12.5%) |
| 10 to 14 Year Olds | 10,221 (90.9%) | 1,018 (9.1%) |
| 15 to 17 Year Olds | 6,120 (92.9%) | 470 (7.1%) |
| 18 to 19 Year Olds | 1,889 (90.2%) | 206 (9.8%) |
| 20 to 24 Year Olds | 1,898 (82.4%) | 405 (17.6%) |
| 25 to 34 Year Olds | 1,791 (80.5%) | 433 (19.5%) |
| 35 Years and over | 1,411 (72.0%) | 548 (28.0%) |
| Total | 34,614 (87.6%) | 4,900 (12.4%) |
Educational Attainment by Field of Study in Canadian County
Business (8,923 | 25.3%), education (5,473 | 15.5%), science & technology (3,949 | 11.2%), arts & humanities (2,810 | 8.0%), and bio, nature & agricultural (2,537 | 7.2%) are the most common fields of study among 35,264 individuals in Canadian County who have obtained a bachelor's degree or higher.
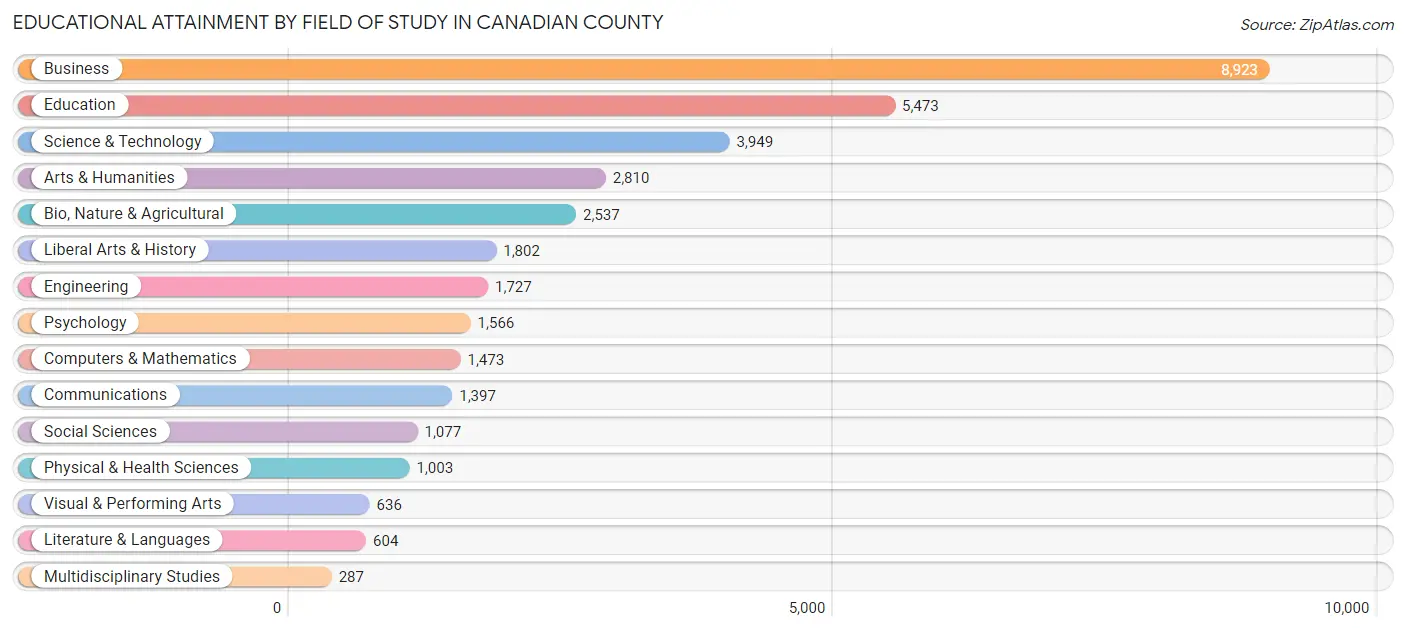
| Field of Study | # Graduates | % Graduates |
| Computers & Mathematics | 1,473 | 4.2% |
| Bio, Nature & Agricultural | 2,537 | 7.2% |
| Physical & Health Sciences | 1,003 | 2.8% |
| Psychology | 1,566 | 4.4% |
| Social Sciences | 1,077 | 3.0% |
| Engineering | 1,727 | 4.9% |
| Multidisciplinary Studies | 287 | 0.8% |
| Science & Technology | 3,949 | 11.2% |
| Business | 8,923 | 25.3% |
| Education | 5,473 | 15.5% |
| Literature & Languages | 604 | 1.7% |
| Liberal Arts & History | 1,802 | 5.1% |
| Visual & Performing Arts | 636 | 1.8% |
| Communications | 1,397 | 4.0% |
| Arts & Humanities | 2,810 | 8.0% |
| Total | 35,264 | 100.0% |
Transportation & Commute in Canadian County
Vehicle Availability by Sex in Canadian County
The most prevalent vehicle ownership categories in Canadian County are males with 2 vehicles (20,110, accounting for 48.5%) and females with 2 vehicles (17,339, making up 54.8%).
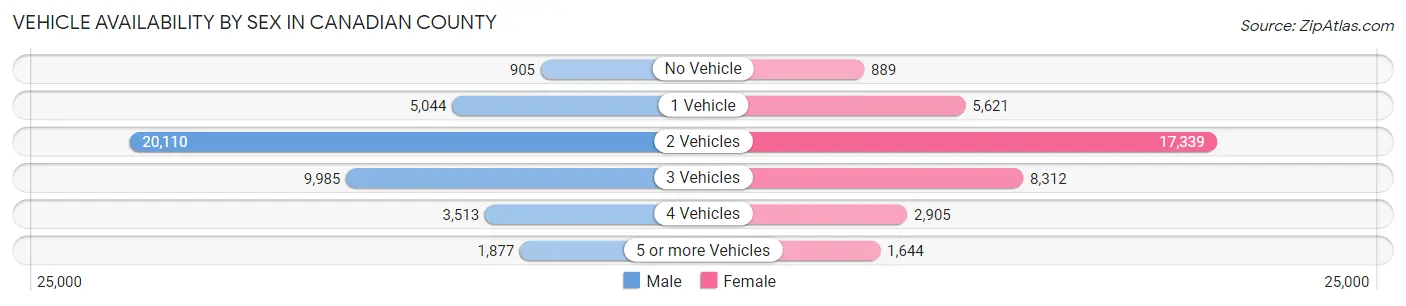
| Vehicles Available | Male | Female |
| No Vehicle | 905 (2.2%) | 889 (2.4%) |
| 1 Vehicle | 5,044 (12.2%) | 5,621 (15.3%) |
| 2 Vehicles | 20,110 (48.5%) | 17,339 (47.2%) |
| 3 Vehicles | 9,985 (24.1%) | 8,312 (22.6%) |
| 4 Vehicles | 3,513 (8.5%) | 2,905 (7.9%) |
| 5 or more Vehicles | 1,877 (4.5%) | 1,644 (4.5%) |
| Total | 41,434 (100.0%) | 36,710 (100.0%) |
Commute Time in Canadian County
The most frequently occuring commute durations in Canadian County are 30 to 34 minutes (13,989 commuters, 19.5%), 20 to 24 minutes (12,801 commuters, 17.9%), and 15 to 19 minutes (10,867 commuters, 15.2%).
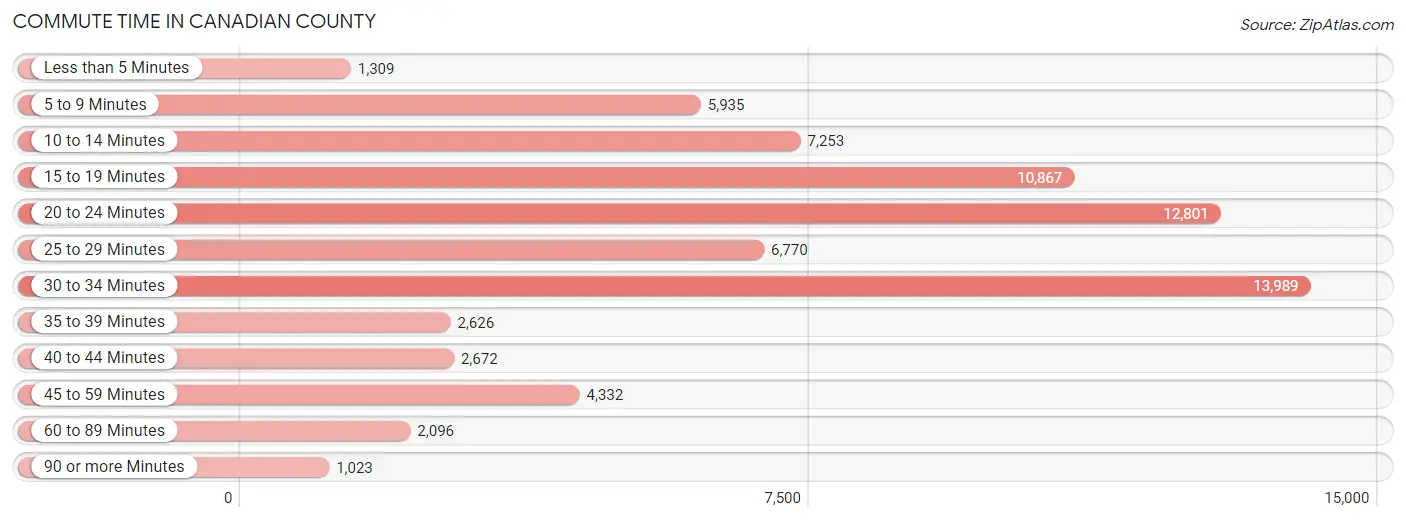
| Commute Time | # Commuters | % Commuters |
| Less than 5 Minutes | 1,309 | 1.8% |
| 5 to 9 Minutes | 5,935 | 8.3% |
| 10 to 14 Minutes | 7,253 | 10.1% |
| 15 to 19 Minutes | 10,867 | 15.2% |
| 20 to 24 Minutes | 12,801 | 17.9% |
| 25 to 29 Minutes | 6,770 | 9.5% |
| 30 to 34 Minutes | 13,989 | 19.5% |
| 35 to 39 Minutes | 2,626 | 3.7% |
| 40 to 44 Minutes | 2,672 | 3.7% |
| 45 to 59 Minutes | 4,332 | 6.0% |
| 60 to 89 Minutes | 2,096 | 2.9% |
| 90 or more Minutes | 1,023 | 1.4% |
Commute Time by Sex in Canadian County
The most common commute times in Canadian County are 30 to 34 minutes (7,397 commuters, 19.0%) for males and 30 to 34 minutes (6,592 commuters, 20.2%) for females.
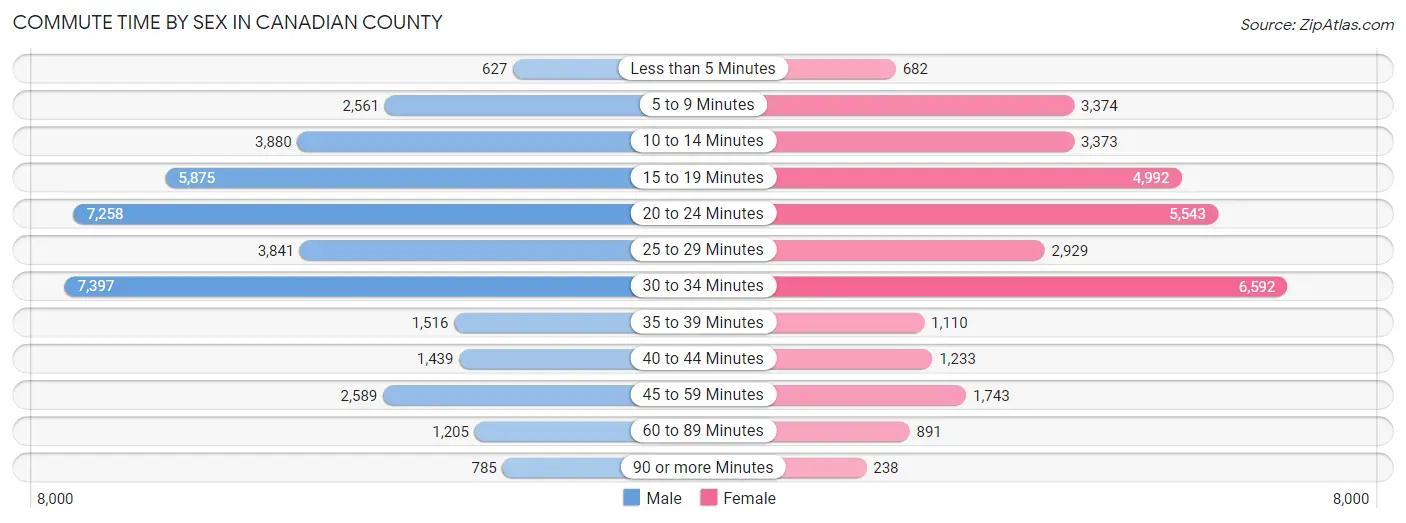
| Commute Time | Male | Female |
| Less than 5 Minutes | 627 (1.6%) | 682 (2.1%) |
| 5 to 9 Minutes | 2,561 (6.6%) | 3,374 (10.3%) |
| 10 to 14 Minutes | 3,880 (10.0%) | 3,373 (10.3%) |
| 15 to 19 Minutes | 5,875 (15.1%) | 4,992 (15.3%) |
| 20 to 24 Minutes | 7,258 (18.6%) | 5,543 (17.0%) |
| 25 to 29 Minutes | 3,841 (9.9%) | 2,929 (9.0%) |
| 30 to 34 Minutes | 7,397 (19.0%) | 6,592 (20.2%) |
| 35 to 39 Minutes | 1,516 (3.9%) | 1,110 (3.4%) |
| 40 to 44 Minutes | 1,439 (3.7%) | 1,233 (3.8%) |
| 45 to 59 Minutes | 2,589 (6.6%) | 1,743 (5.3%) |
| 60 to 89 Minutes | 1,205 (3.1%) | 891 (2.7%) |
| 90 or more Minutes | 785 (2.0%) | 238 (0.7%) |
Time of Departure to Work by Sex in Canadian County
The most frequent times of departure to work in Canadian County are 7:00 AM to 7:29 AM (6,995, 17.9%) for males and 7:00 AM to 7:29 AM (6,367, 19.5%) for females.
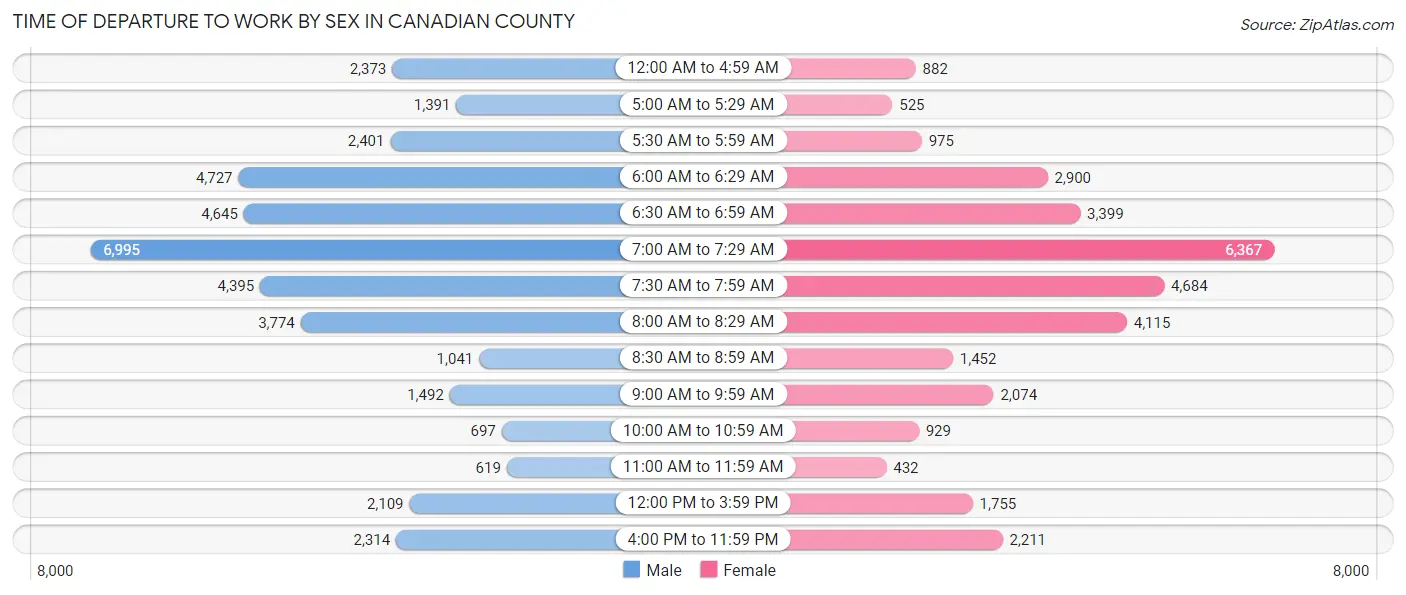
| Time of Departure | Male | Female |
| 12:00 AM to 4:59 AM | 2,373 (6.1%) | 882 (2.7%) |
| 5:00 AM to 5:29 AM | 1,391 (3.6%) | 525 (1.6%) |
| 5:30 AM to 5:59 AM | 2,401 (6.2%) | 975 (3.0%) |
| 6:00 AM to 6:29 AM | 4,727 (12.1%) | 2,900 (8.9%) |
| 6:30 AM to 6:59 AM | 4,645 (11.9%) | 3,399 (10.4%) |
| 7:00 AM to 7:29 AM | 6,995 (17.9%) | 6,367 (19.5%) |
| 7:30 AM to 7:59 AM | 4,395 (11.3%) | 4,684 (14.3%) |
| 8:00 AM to 8:29 AM | 3,774 (9.7%) | 4,115 (12.6%) |
| 8:30 AM to 8:59 AM | 1,041 (2.7%) | 1,452 (4.4%) |
| 9:00 AM to 9:59 AM | 1,492 (3.8%) | 2,074 (6.3%) |
| 10:00 AM to 10:59 AM | 697 (1.8%) | 929 (2.8%) |
| 11:00 AM to 11:59 AM | 619 (1.6%) | 432 (1.3%) |
| 12:00 PM to 3:59 PM | 2,109 (5.4%) | 1,755 (5.4%) |
| 4:00 PM to 11:59 PM | 2,314 (5.9%) | 2,211 (6.8%) |
| Total | 38,973 (100.0%) | 32,700 (100.0%) |
Housing Occupancy in Canadian County
Occupancy by Ownership in Canadian County
Of the total 56,300 dwellings in Canadian County, owner-occupied units account for 42,525 (75.5%), while renter-occupied units make up 13,775 (24.5%).
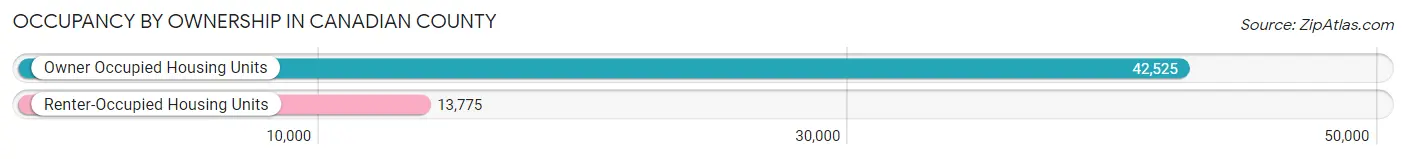
| Occupancy | # Housing Units | % Housing Units |
| Owner Occupied Housing Units | 42,525 | 75.5% |
| Renter-Occupied Housing Units | 13,775 | 24.5% |
| Total Occupied Housing Units | 56,300 | 100.0% |
Occupancy by Household Size in Canadian County
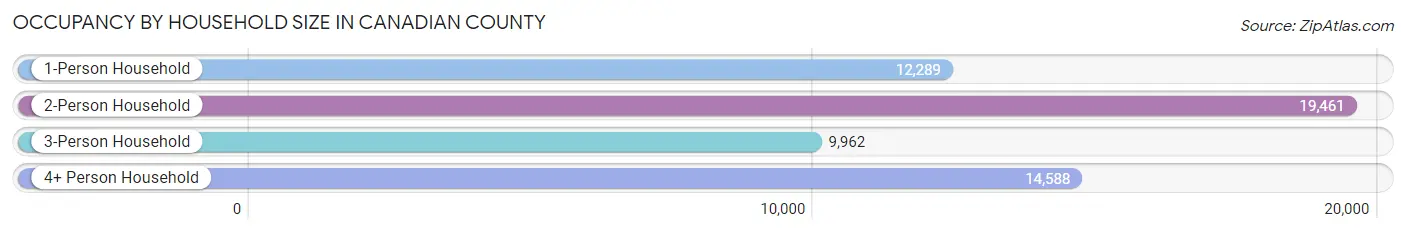
| Household Size | # Housing Units | % Housing Units |
| 1-Person Household | 12,289 | 21.8% |
| 2-Person Household | 19,461 | 34.6% |
| 3-Person Household | 9,962 | 17.7% |
| 4+ Person Household | 14,588 | 25.9% |
| Total Housing Units | 56,300 | 100.0% |
Occupancy by Ownership by Household Size in Canadian County
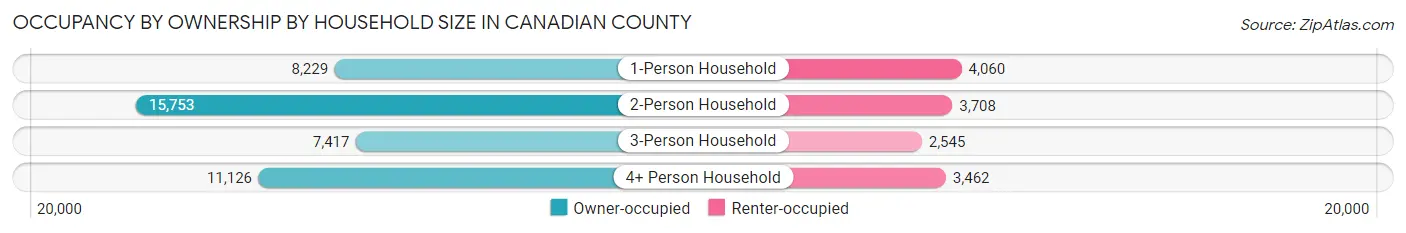
| Household Size | Owner-occupied | Renter-occupied |
| 1-Person Household | 8,229 (67.0%) | 4,060 (33.0%) |
| 2-Person Household | 15,753 (80.9%) | 3,708 (19.1%) |
| 3-Person Household | 7,417 (74.5%) | 2,545 (25.6%) |
| 4+ Person Household | 11,126 (76.3%) | 3,462 (23.7%) |
| Total Housing Units | 42,525 (75.5%) | 13,775 (24.5%) |
Occupancy by Educational Attainment in Canadian County
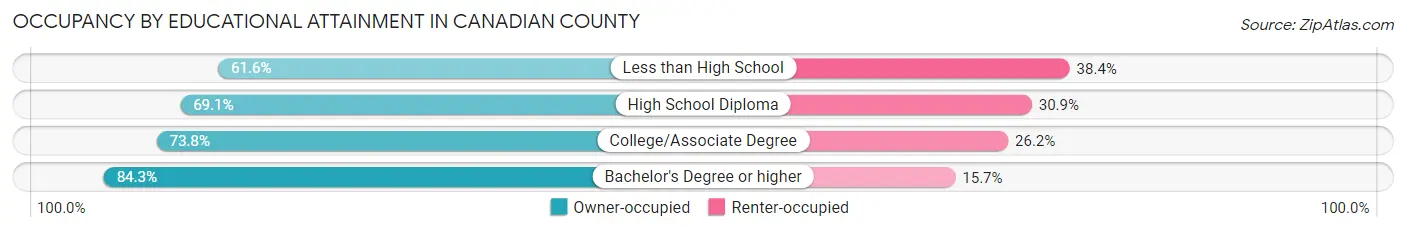
| Household Size | Owner-occupied | Renter-occupied |
| Less than High School | 2,352 (61.6%) | 1,464 (38.4%) |
| High School Diploma | 9,478 (69.1%) | 4,231 (30.9%) |
| College/Associate Degree | 14,058 (73.8%) | 4,981 (26.2%) |
| Bachelor's Degree or higher | 16,637 (84.3%) | 3,099 (15.7%) |
Occupancy by Age of Householder in Canadian County
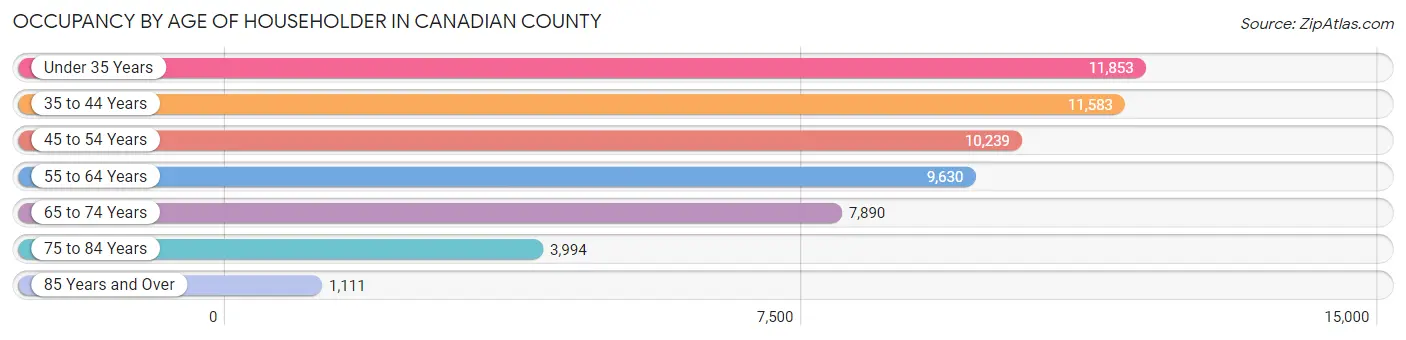
| Age Bracket | # Households | % Households |
| Under 35 Years | 11,853 | 21.0% |
| 35 to 44 Years | 11,583 | 20.6% |
| 45 to 54 Years | 10,239 | 18.2% |
| 55 to 64 Years | 9,630 | 17.1% |
| 65 to 74 Years | 7,890 | 14.0% |
| 75 to 84 Years | 3,994 | 7.1% |
| 85 Years and Over | 1,111 | 2.0% |
| Total | 56,300 | 100.0% |
Housing Finances in Canadian County
Median Income by Occupancy in Canadian County
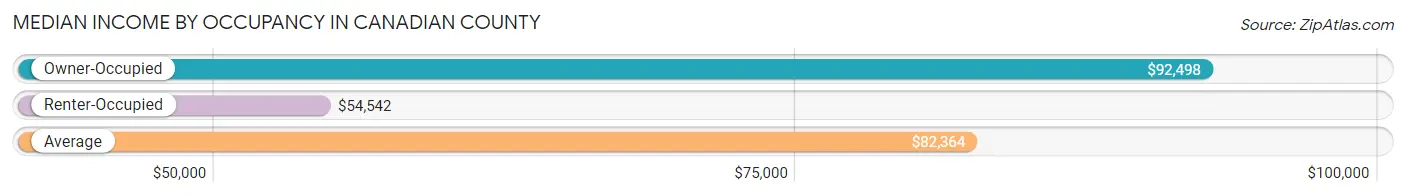
| Occupancy Type | # Households | Median Income |
| Owner-Occupied | 42,525 (75.5%) | $92,498 |
| Renter-Occupied | 13,775 (24.5%) | $54,542 |
| Average | 56,300 (100.0%) | $82,364 |
Occupancy by Householder Income Bracket in Canadian County
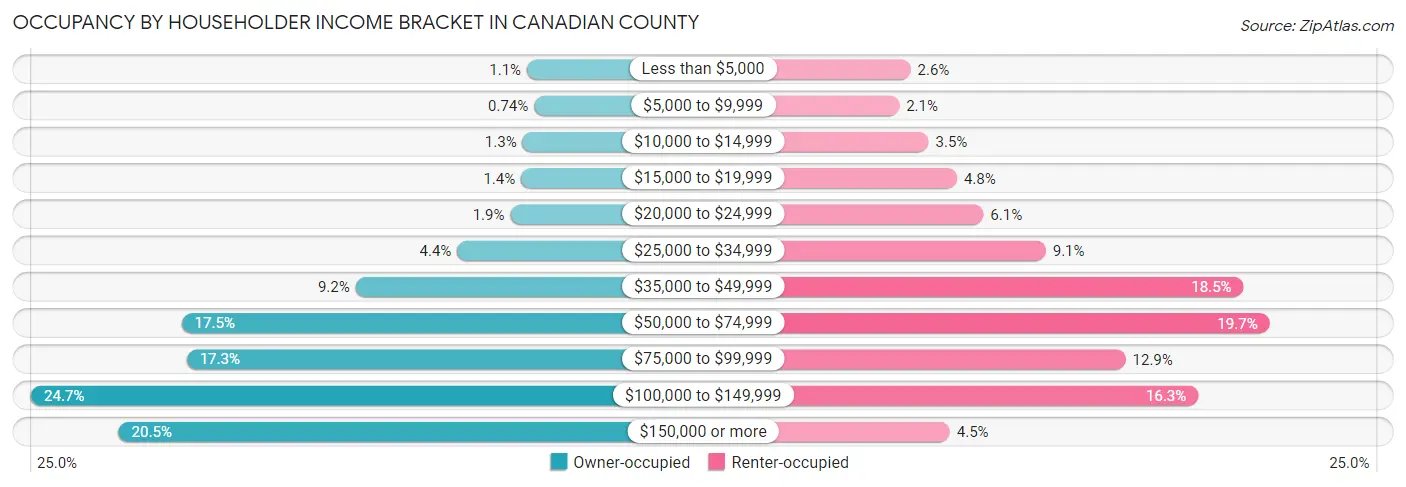
| Income Bracket | Owner-occupied | Renter-occupied |
| Less than $5,000 | 459 (1.1%) | 361 (2.6%) |
| $5,000 to $9,999 | 313 (0.7%) | 287 (2.1%) |
| $10,000 to $14,999 | 550 (1.3%) | 479 (3.5%) |
| $15,000 to $19,999 | 579 (1.4%) | 666 (4.8%) |
| $20,000 to $24,999 | 797 (1.9%) | 839 (6.1%) |
| $25,000 to $34,999 | 1,869 (4.4%) | 1,248 (9.1%) |
| $35,000 to $49,999 | 3,930 (9.2%) | 2,544 (18.5%) |
| $50,000 to $74,999 | 7,452 (17.5%) | 2,715 (19.7%) |
| $75,000 to $99,999 | 7,348 (17.3%) | 1,771 (12.9%) |
| $100,000 to $149,999 | 10,500 (24.7%) | 2,247 (16.3%) |
| $150,000 or more | 8,728 (20.5%) | 618 (4.5%) |
| Total | 42,525 (100.0%) | 13,775 (100.0%) |
Monthly Housing Cost Tiers in Canadian County
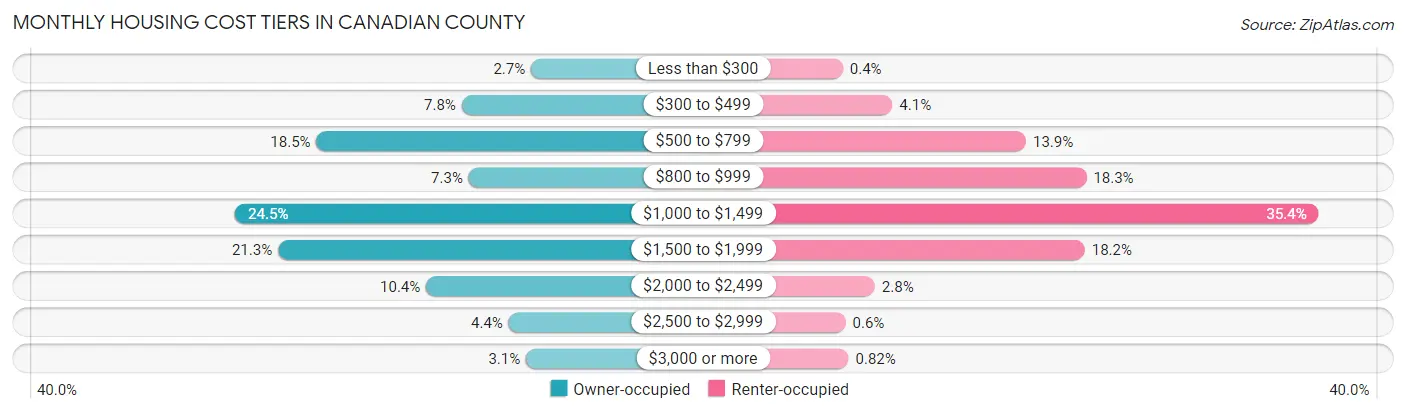
| Monthly Cost | Owner-occupied | Renter-occupied |
| Less than $300 | 1,147 (2.7%) | 55 (0.4%) |
| $300 to $499 | 3,323 (7.8%) | 558 (4.1%) |
| $500 to $799 | 7,870 (18.5%) | 1,913 (13.9%) |
| $800 to $999 | 3,102 (7.3%) | 2,526 (18.3%) |
| $1,000 to $1,499 | 10,416 (24.5%) | 4,880 (35.4%) |
| $1,500 to $1,999 | 9,076 (21.3%) | 2,510 (18.2%) |
| $2,000 to $2,499 | 4,435 (10.4%) | 380 (2.8%) |
| $2,500 to $2,999 | 1,851 (4.3%) | 82 (0.6%) |
| $3,000 or more | 1,305 (3.1%) | 113 (0.8%) |
| Total | 42,525 (100.0%) | 13,775 (100.0%) |
Physical Housing Characteristics in Canadian County
Housing Structures in Canadian County
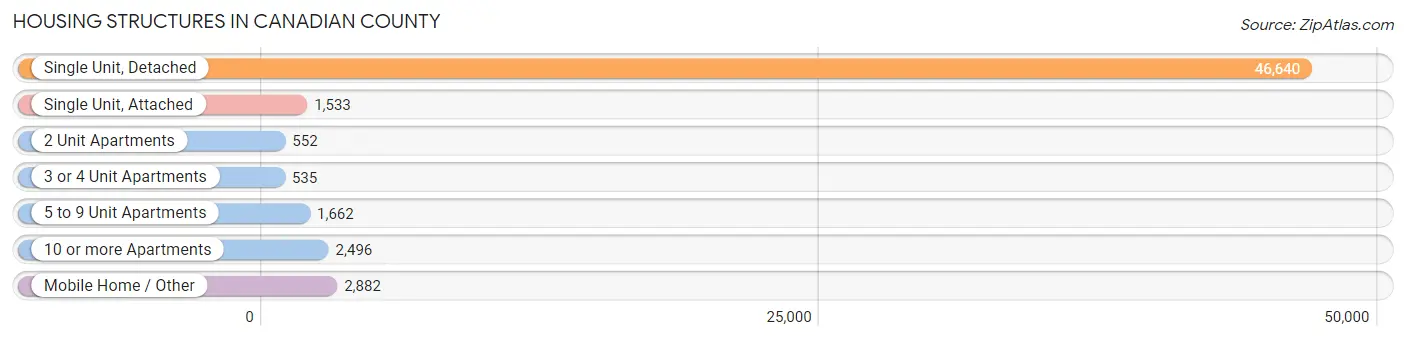
| Structure Type | # Housing Units | % Housing Units |
| Single Unit, Detached | 46,640 | 82.8% |
| Single Unit, Attached | 1,533 | 2.7% |
| 2 Unit Apartments | 552 | 1.0% |
| 3 or 4 Unit Apartments | 535 | 0.9% |
| 5 to 9 Unit Apartments | 1,662 | 2.9% |
| 10 or more Apartments | 2,496 | 4.4% |
| Mobile Home / Other | 2,882 | 5.1% |
| Total | 56,300 | 100.0% |
Housing Structures by Occupancy in Canadian County
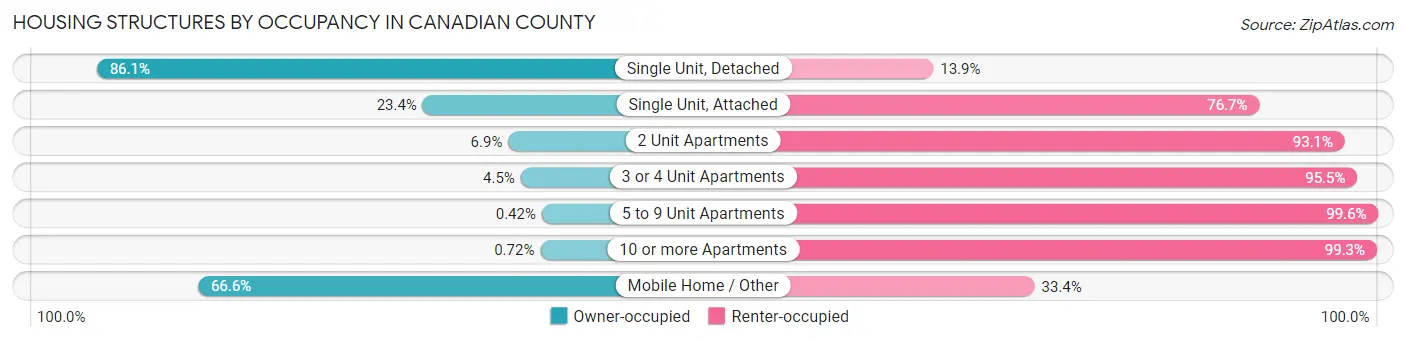
| Structure Type | Owner-occupied | Renter-occupied |
| Single Unit, Detached | 40,160 (86.1%) | 6,480 (13.9%) |
| Single Unit, Attached | 358 (23.4%) | 1,175 (76.6%) |
| 2 Unit Apartments | 38 (6.9%) | 514 (93.1%) |
| 3 or 4 Unit Apartments | 24 (4.5%) | 511 (95.5%) |
| 5 to 9 Unit Apartments | 7 (0.4%) | 1,655 (99.6%) |
| 10 or more Apartments | 18 (0.7%) | 2,478 (99.3%) |
| Mobile Home / Other | 1,920 (66.6%) | 962 (33.4%) |
| Total | 42,525 (75.5%) | 13,775 (24.5%) |
Housing Structures by Number of Rooms in Canadian County
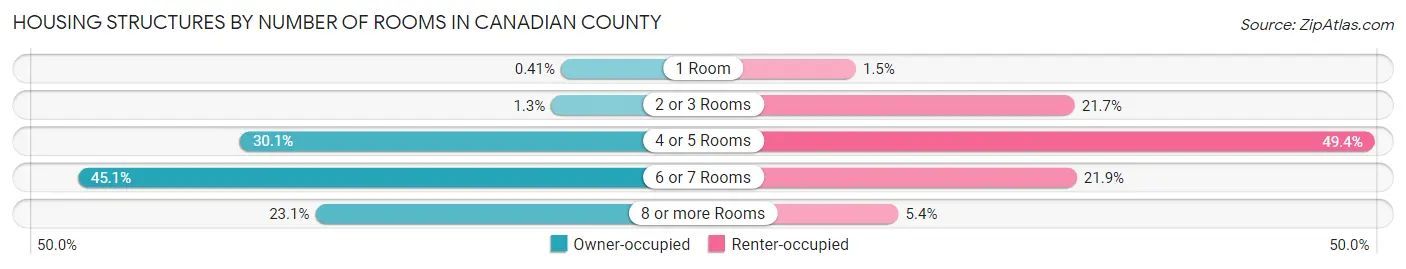
| Number of Rooms | Owner-occupied | Renter-occupied |
| 1 Room | 175 (0.4%) | 205 (1.5%) |
| 2 or 3 Rooms | 556 (1.3%) | 2,992 (21.7%) |
| 4 or 5 Rooms | 12,793 (30.1%) | 6,811 (49.4%) |
| 6 or 7 Rooms | 19,170 (45.1%) | 3,019 (21.9%) |
| 8 or more Rooms | 9,831 (23.1%) | 748 (5.4%) |
| Total | 42,525 (100.0%) | 13,775 (100.0%) |
Housing Structure by Heating Type in Canadian County
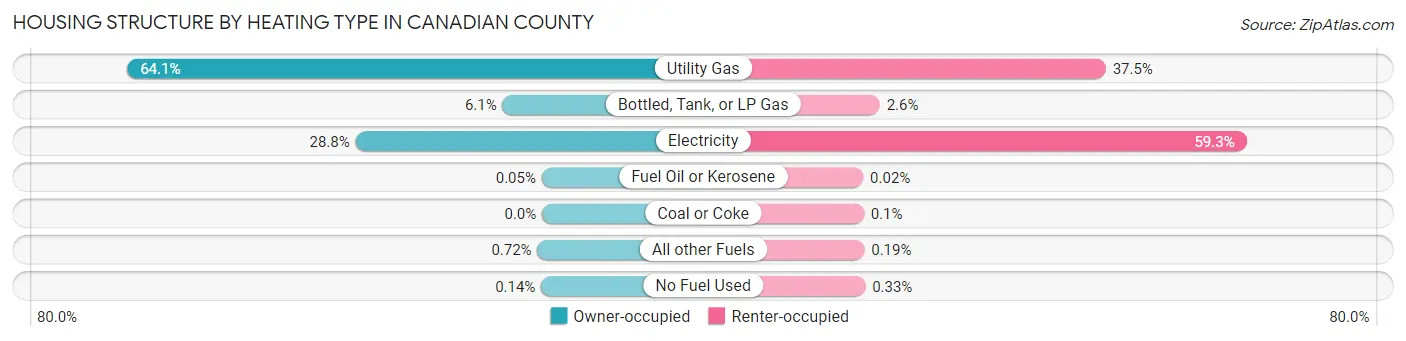
| Heating Type | Owner-occupied | Renter-occupied |
| Utility Gas | 27,273 (64.1%) | 5,167 (37.5%) |
| Bottled, Tank, or LP Gas | 2,597 (6.1%) | 355 (2.6%) |
| Electricity | 12,265 (28.8%) | 8,165 (59.3%) |
| Fuel Oil or Kerosene | 23 (0.1%) | 3 (0.0%) |
| Coal or Coke | 0 (0.0%) | 14 (0.1%) |
| All other Fuels | 307 (0.7%) | 26 (0.2%) |
| No Fuel Used | 60 (0.1%) | 45 (0.3%) |
| Total | 42,525 (100.0%) | 13,775 (100.0%) |
Household Vehicle Usage in Canadian County
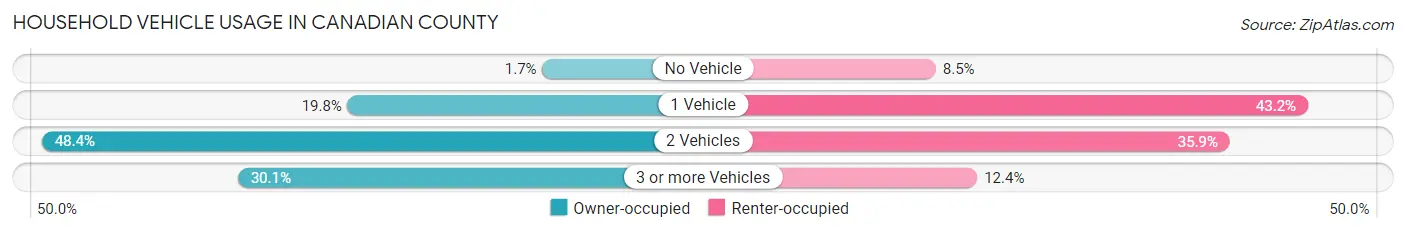
| Vehicles per Household | Owner-occupied | Renter-occupied |
| No Vehicle | 708 (1.7%) | 1,170 (8.5%) |
| 1 Vehicle | 8,435 (19.8%) | 5,954 (43.2%) |
| 2 Vehicles | 20,582 (48.4%) | 4,950 (35.9%) |
| 3 or more Vehicles | 12,800 (30.1%) | 1,701 (12.3%) |
| Total | 42,525 (100.0%) | 13,775 (100.0%) |
Real Estate & Mortgages in Canadian County
Real Estate and Mortgage Overview in Canadian County
| Characteristic | Without Mortgage | With Mortgage |
| Housing Units | 14,209 | 28,316 |
| Median Property Value | $195,300 | $219,700 |
| Median Household Income | $70,049 | $6,430 |
| Monthly Housing Costs | $591 | $1,303 |
| Real Estate Taxes | $1,879 | $1,220 |
Property Value by Mortgage Status in Canadian County
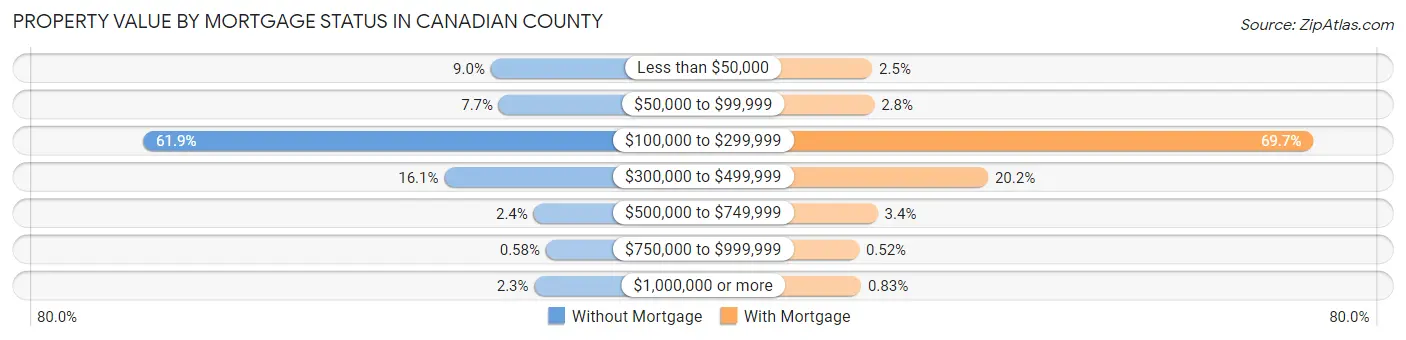
| Property Value | Without Mortgage | With Mortgage |
| Less than $50,000 | 1,274 (9.0%) | 717 (2.5%) |
| $50,000 to $99,999 | 1,099 (7.7%) | 803 (2.8%) |
| $100,000 to $299,999 | 8,799 (61.9%) | 19,748 (69.7%) |
| $300,000 to $499,999 | 2,280 (16.1%) | 5,713 (20.2%) |
| $500,000 to $749,999 | 346 (2.4%) | 953 (3.4%) |
| $750,000 to $999,999 | 82 (0.6%) | 147 (0.5%) |
| $1,000,000 or more | 329 (2.3%) | 235 (0.8%) |
| Total | 14,209 (100.0%) | 28,316 (100.0%) |
Household Income by Mortgage Status in Canadian County
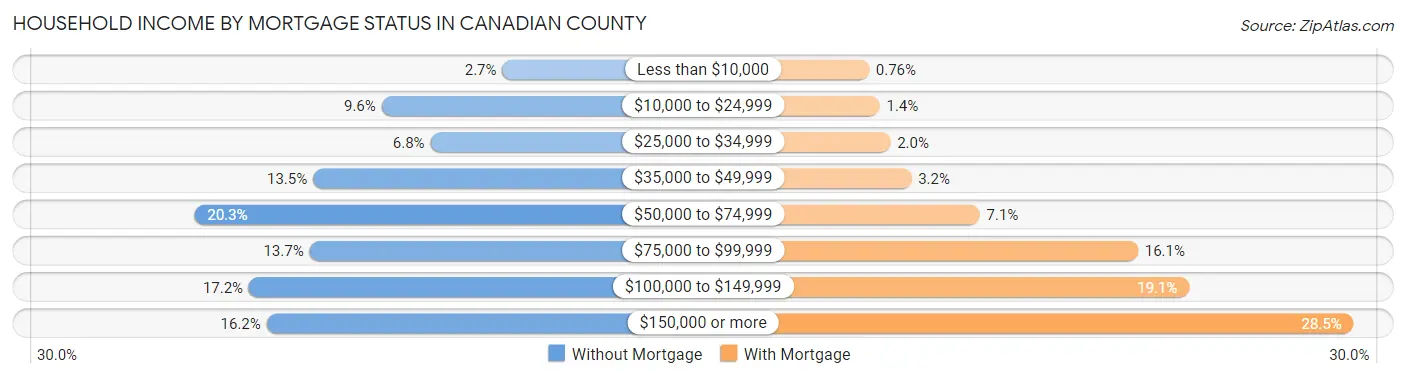
| Household Income | Without Mortgage | With Mortgage |
| Less than $10,000 | 384 (2.7%) | 216 (0.8%) |
| $10,000 to $24,999 | 1,364 (9.6%) | 388 (1.4%) |
| $25,000 to $34,999 | 968 (6.8%) | 562 (2.0%) |
| $35,000 to $49,999 | 1,921 (13.5%) | 901 (3.2%) |
| $50,000 to $74,999 | 2,884 (20.3%) | 2,009 (7.1%) |
| $75,000 to $99,999 | 1,949 (13.7%) | 4,568 (16.1%) |
| $100,000 to $149,999 | 2,441 (17.2%) | 5,399 (19.1%) |
| $150,000 or more | 2,298 (16.2%) | 8,059 (28.5%) |
| Total | 14,209 (100.0%) | 28,316 (100.0%) |
Property Value to Household Income Ratio in Canadian County
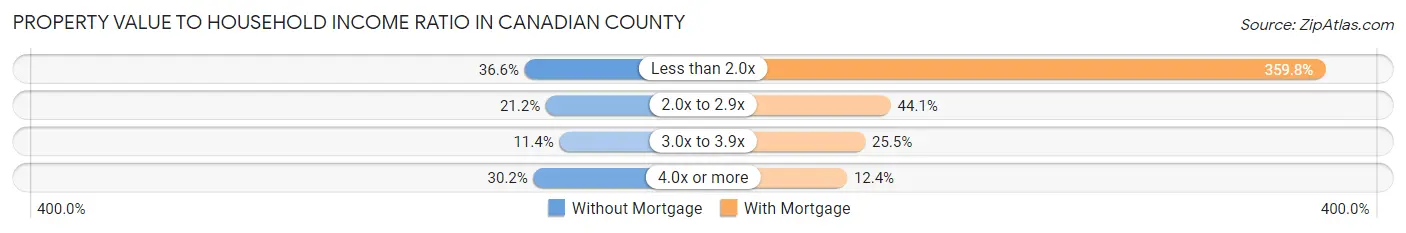
| Value-to-Income Ratio | Without Mortgage | With Mortgage |
| Less than 2.0x | 5,196 (36.6%) | 101,872 (359.8%) |
| 2.0x to 2.9x | 3,016 (21.2%) | 12,497 (44.1%) |
| 3.0x to 3.9x | 1,626 (11.4%) | 7,224 (25.5%) |
| 4.0x or more | 4,296 (30.2%) | 3,504 (12.4%) |
| Total | 14,209 (100.0%) | 28,316 (100.0%) |
Real Estate Taxes by Mortgage Status in Canadian County

| Property Taxes | Without Mortgage | With Mortgage |
| Less than $800 | 2,468 (17.4%) | 80 (0.3%) |
| $800 to $1,499 | 3,021 (21.3%) | 2,051 (7.2%) |
| $800 to $1,499 | 7,926 (55.8%) | 4,568 (16.1%) |
| Total | 14,209 (100.0%) | 28,316 (100.0%) |
Health & Disability in Canadian County
Health Insurance Coverage by Age in Canadian County
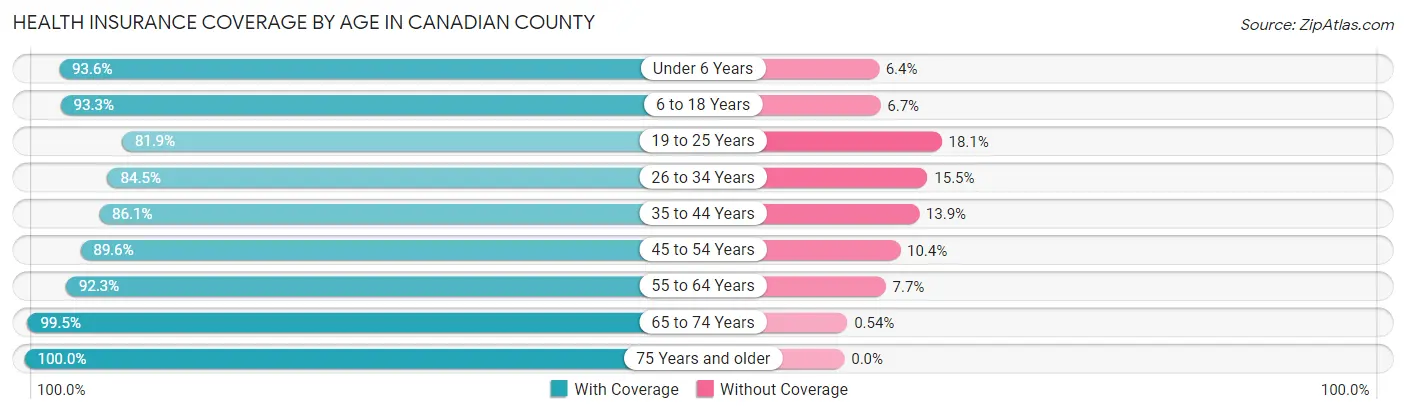
| Age Bracket | With Coverage | Without Coverage |
| Under 6 Years | 11,824 (93.6%) | 811 (6.4%) |
| 6 to 18 Years | 27,549 (93.3%) | 1,984 (6.7%) |
| 19 to 25 Years | 10,196 (81.9%) | 2,260 (18.1%) |
| 26 to 34 Years | 16,951 (84.5%) | 3,107 (15.5%) |
| 35 to 44 Years | 19,922 (86.1%) | 3,218 (13.9%) |
| 45 to 54 Years | 16,392 (89.6%) | 1,900 (10.4%) |
| 55 to 64 Years | 16,166 (92.3%) | 1,348 (7.7%) |
| 65 to 74 Years | 12,593 (99.5%) | 68 (0.5%) |
| 75 Years and older | 7,967 (100.0%) | 0 (0.0%) |
| Total | 139,560 (90.5%) | 14,696 (9.5%) |
Health Insurance Coverage by Citizenship Status in Canadian County

| Citizenship Status | With Coverage | Without Coverage |
| Native Born | 11,824 (93.6%) | 811 (6.4%) |
| Foreign Born, Citizen | 27,549 (93.3%) | 1,984 (6.7%) |
| Foreign Born, not a Citizen | 10,196 (81.9%) | 2,260 (18.1%) |
Health Insurance Coverage by Household Income in Canadian County
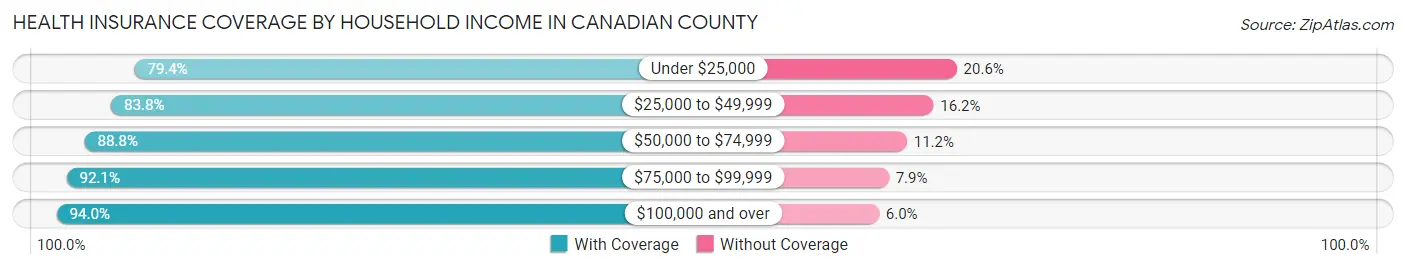
| Household Income | With Coverage | Without Coverage |
| Under $25,000 | 7,450 (79.4%) | 1,930 (20.6%) |
| $25,000 to $49,999 | 18,435 (83.8%) | 3,570 (16.2%) |
| $50,000 to $74,999 | 22,336 (88.8%) | 2,829 (11.2%) |
| $75,000 to $99,999 | 23,883 (92.1%) | 2,037 (7.9%) |
| $100,000 and over | 67,049 (94.0%) | 4,289 (6.0%) |
Public vs Private Health Insurance Coverage by Age in Canadian County
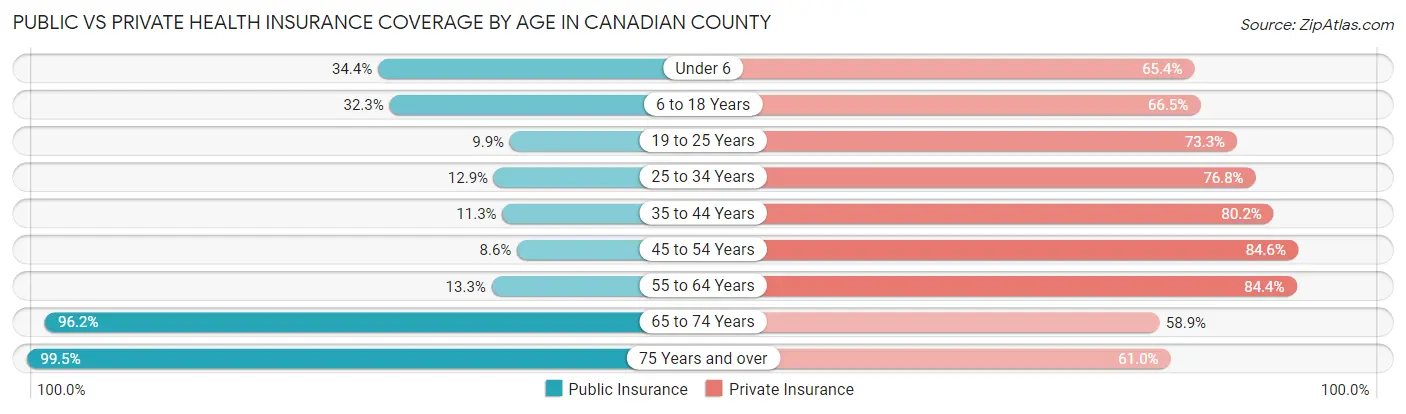
| Age Bracket | Public Insurance | Private Insurance |
| Under 6 | 4,346 (34.4%) | 8,264 (65.4%) |
| 6 to 18 Years | 9,527 (32.3%) | 19,640 (66.5%) |
| 19 to 25 Years | 1,234 (9.9%) | 9,135 (73.3%) |
| 25 to 34 Years | 2,585 (12.9%) | 15,399 (76.8%) |
| 35 to 44 Years | 2,618 (11.3%) | 18,547 (80.1%) |
| 45 to 54 Years | 1,568 (8.6%) | 15,481 (84.6%) |
| 55 to 64 Years | 2,331 (13.3%) | 14,776 (84.4%) |
| 65 to 74 Years | 12,178 (96.2%) | 7,452 (58.9%) |
| 75 Years and over | 7,926 (99.5%) | 4,859 (61.0%) |
| Total | 44,313 (28.7%) | 113,553 (73.6%) |
Disability Status by Sex by Age in Canadian County
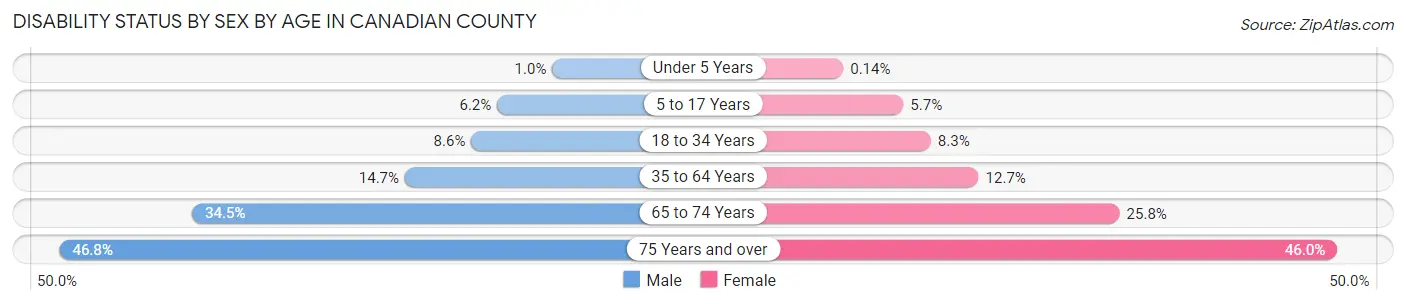
| Age Bracket | Male | Female |
| Under 5 Years | 54 (1.0%) | 7 (0.1%) |
| 5 to 17 Years | 938 (6.1%) | 855 (5.7%) |
| 18 to 34 Years | 1,453 (8.6%) | 1,434 (8.3%) |
| 35 to 64 Years | 4,315 (14.7%) | 3,762 (12.7%) |
| 65 to 74 Years | 2,072 (34.4%) | 1,714 (25.8%) |
| 75 Years and over | 1,544 (46.8%) | 2,144 (46.0%) |
Disability Class by Sex by Age in Canadian County
Disability Class: Hearing Difficulty
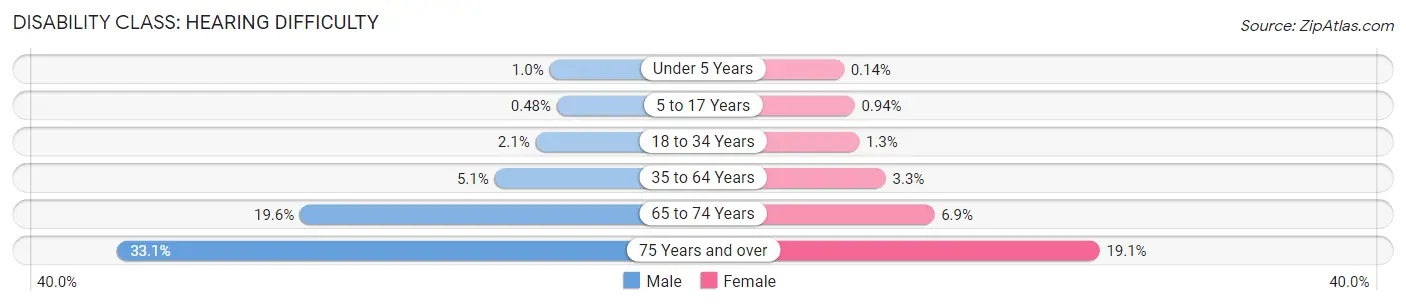
| Age Bracket | Male | Female |
| Under 5 Years | 54 (1.0%) | 7 (0.1%) |
| 5 to 17 Years | 73 (0.5%) | 140 (0.9%) |
| 18 to 34 Years | 352 (2.1%) | 222 (1.3%) |
| 35 to 64 Years | 1,500 (5.1%) | 962 (3.3%) |
| 65 to 74 Years | 1,176 (19.6%) | 456 (6.9%) |
| 75 Years and over | 1,094 (33.1%) | 892 (19.1%) |
Disability Class: Vision Difficulty
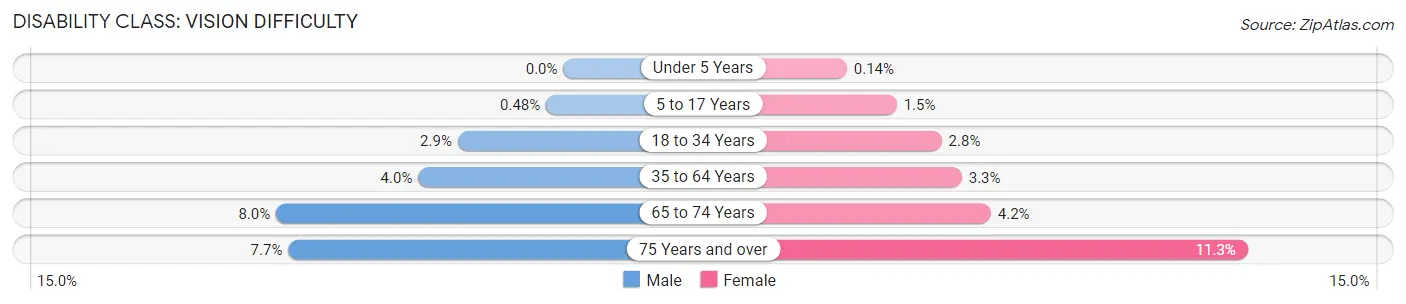
| Age Bracket | Male | Female |
| Under 5 Years | 0 (0.0%) | 7 (0.1%) |
| 5 to 17 Years | 73 (0.5%) | 229 (1.5%) |
| 18 to 34 Years | 500 (2.9%) | 482 (2.8%) |
| 35 to 64 Years | 1,184 (4.0%) | 989 (3.3%) |
| 65 to 74 Years | 481 (8.0%) | 276 (4.2%) |
| 75 Years and over | 253 (7.7%) | 527 (11.3%) |
Disability Class: Cognitive Difficulty
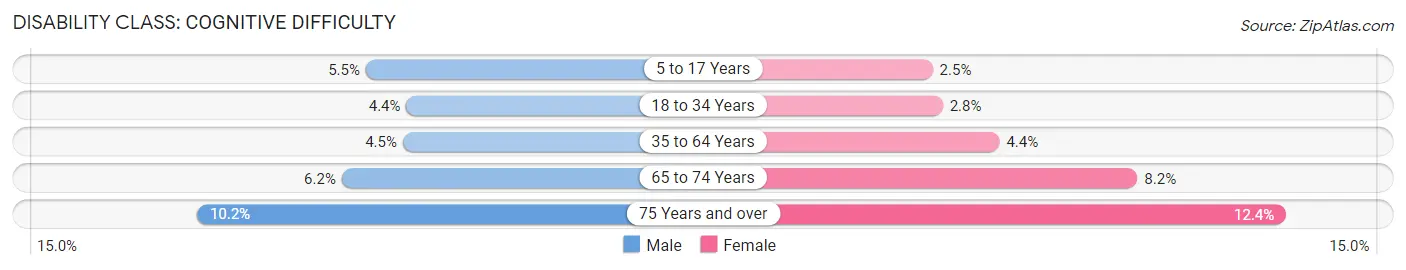
| Age Bracket | Male | Female |
| 5 to 17 Years | 839 (5.5%) | 378 (2.5%) |
| 18 to 34 Years | 742 (4.4%) | 487 (2.8%) |
| 35 to 64 Years | 1,311 (4.5%) | 1,299 (4.4%) |
| 65 to 74 Years | 371 (6.2%) | 547 (8.2%) |
| 75 Years and over | 337 (10.2%) | 577 (12.4%) |
Disability Class: Ambulatory Difficulty
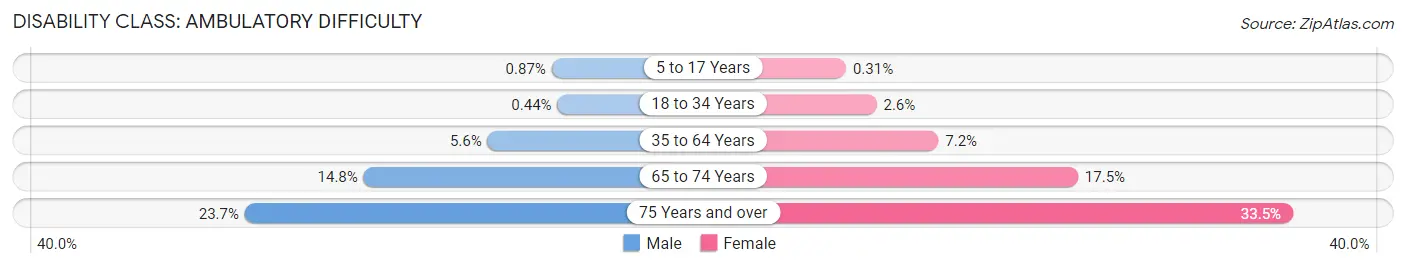
| Age Bracket | Male | Female |
| 5 to 17 Years | 133 (0.9%) | 47 (0.3%) |
| 18 to 34 Years | 74 (0.4%) | 448 (2.6%) |
| 35 to 64 Years | 1,652 (5.6%) | 2,122 (7.2%) |
| 65 to 74 Years | 892 (14.8%) | 1,165 (17.5%) |
| 75 Years and over | 781 (23.6%) | 1,562 (33.5%) |
Disability Class: Self-Care Difficulty
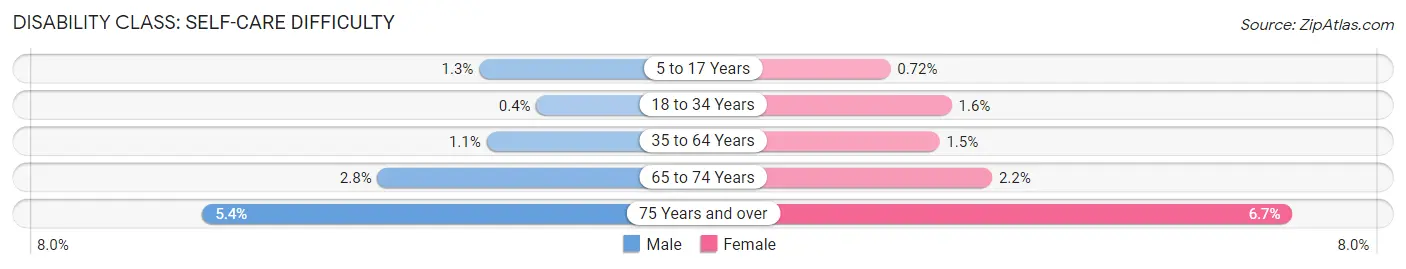
| Age Bracket | Male | Female |
| 5 to 17 Years | 191 (1.3%) | 107 (0.7%) |
| 18 to 34 Years | 68 (0.4%) | 283 (1.6%) |
| 35 to 64 Years | 335 (1.1%) | 429 (1.5%) |
| 65 to 74 Years | 166 (2.8%) | 148 (2.2%) |
| 75 Years and over | 177 (5.4%) | 312 (6.7%) |
Technology Access in Canadian County
Computing Device Access in Canadian County
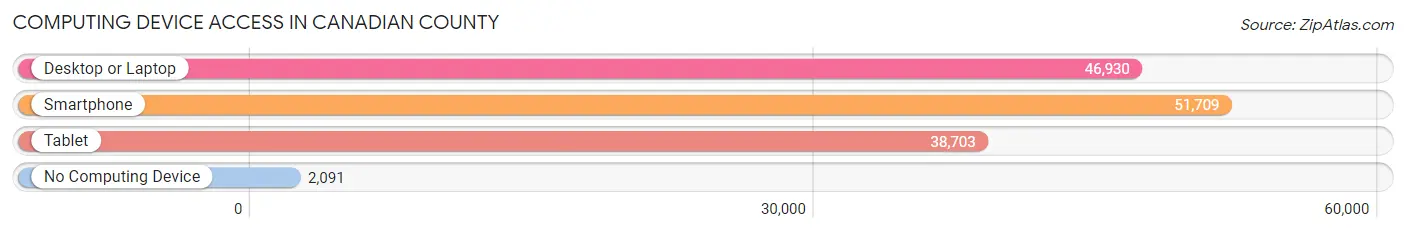
| Device Type | # Households | % Households |
| Desktop or Laptop | 46,930 | 83.4% |
| Smartphone | 51,709 | 91.8% |
| Tablet | 38,703 | 68.7% |
| No Computing Device | 2,091 | 3.7% |
| Total | 56,300 | 100.0% |
Internet Access in Canadian County
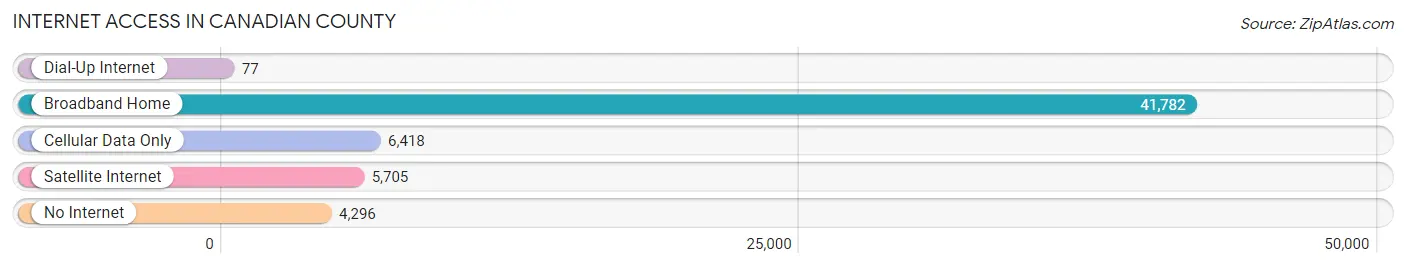
| Internet Type | # Households | % Households |
| Dial-Up Internet | 77 | 0.1% |
| Broadband Home | 41,782 | 74.2% |
| Cellular Data Only | 6,418 | 11.4% |
| Satellite Internet | 5,705 | 10.1% |
| No Internet | 4,296 | 7.6% |
| Total | 56,300 | 100.0% |
Canadian County Summary
Canadian County is located in the central part of Oklahoma and is part of the Oklahoma City Metropolitan Statistical Area. The county was created in 1889 and named after the Canadian River, which runs through the county. As of the 2010 census, the population was 115,541, making it the third-most populous county in Oklahoma.
Geography
Canadian County is located in the central part of Oklahoma and is bordered by Kingfisher County to the north, Blaine County to the east, Caddo County to the south, and Grady County to the west. The county covers an area of 1,097 square miles and is located in the Red Bed Plains region of the state. The Canadian River runs through the county and is the main water source. The county is also home to several small lakes, including Lake El Reno, Lake Overholser, and Lake Draper.
The terrain of Canadian County is mostly flat, with some rolling hills in the northern part of the county. The county is mostly covered in prairie grasses and is home to a variety of wildlife, including deer, coyotes, and wild turkeys.
Demographics
As of the 2010 census, the population of Canadian County was 115,541, making it the third-most populous county in Oklahoma. The population density was 105.3 people per square mile. The racial makeup of the county was 81.2% White, 5.3% Black or African American, 5.2% Native American, 1.2% Asian, 0.1% Pacific Islander, 4.2% from other races, and 2.9% from two or more races. Hispanic or Latino of any race were 8.7% of the population.
The median income for a household in the county was $45,945 and the median income for a family was $54,945. The per capita income for the county was $22,945. About 8.7% of families and 11.2% of the population were below the poverty line, including 15.2% of those under age 18 and 8.2% of those age 65 or over.
Economy
The economy of Canadian County is largely based on agriculture and oil and gas production. The county is home to several large farms, which produce a variety of crops, including wheat, corn, soybeans, and cotton. The county is also home to several oil and gas production companies, which are responsible for much of the county's economic activity.
In addition to agriculture and oil and gas production, Canadian County is home to several manufacturing companies, including aircraft parts manufacturers, automotive parts manufacturers, and food processing companies. The county is also home to several retail stores, restaurants, and other businesses.
The unemployment rate in Canadian County was 4.2% in 2019, which is lower than the national average of 3.7%.
History
Canadian County was created in 1889 and named after the Canadian River, which runs through the county. The county was originally part of the Unassigned Lands, which were opened to settlement in 1889. The county was quickly settled by homesteaders, who established farms and ranches in the area.
Oil and gas production began in the county in the early 1900s, and the county quickly became an important center for oil and gas production in the state. The county also became an important agricultural center, with several large farms producing a variety of crops.
In the 1950s, the county began to experience rapid population growth as people moved to the area for jobs in the oil and gas industry and in the agricultural sector. The population of the county continued to grow throughout the 20th century, and by the 2010 census, the population had reached 115,541.
Common Questions
What is the Total Population of Canadian County?
Total Population of Canadian County is 156,681.
What is the Total Male Population of Canadian County?
Total Male Population of Canadian County is 78,044.
What is the Total Female Population of Canadian County?
Total Female Population of Canadian County is 78,637.
What is the Ratio of Males per 100 Females in Canadian County?
There are 99.25 Males per 100 Females in Canadian County.
What is the Ratio of Females per 100 Males in Canadian County?
There are 100.76 Females per 100 Males in Canadian County.
What is the Median Population Age in Canadian County?
Median Population Age in Canadian County is 36.2 Years.
What is the Average Family Size in Canadian County
Average Family Size in Canadian County is 3.2 People.
What is the Average Household Size in Canadian County
Average Household Size in Canadian County is 2.7 People.
What is Per Capita Income in Canadian County?
Per Capita income in Canadian County is $36,884.
What is the Median Family Income in Canadian County?
Median Family Income in Canadian County is $93,729.
What is the Median Household income in Canadian County?
Median Household Income in Canadian County is $82,364.
What is Income or Wage Gap in Canadian County?
Income or Wage Gap in Canadian County is 34.3%.
Women in Canadian County earn 65.7 cents for every dollar earned by a man.
What is Family Income Deficit in Canadian County?
Family Income Deficit in Canadian County is $10,777.
Families that are below poverty line in Canadian County earn $10,777 less on average than the poverty threshold level.
What is Inequality or Gini Index in Canadian County?
Inequality or Gini Index in Canadian County is 0.38.
How Large is the Labor Force in Canadian County?
There are 82,943 People in the Labor Forcein in Canadian County.
What is the Percentage of People in the Labor Force in Canadian County?
68.6% of People are in the Labor Force in Canadian County.
What is the Unemployment Rate in Canadian County?
Unemployment Rate in Canadian County is 4.1%.