Beckham County, OK
Beckham County Map

Beckham County Overview
22,295
TOTAL POPULATION
12,565
MALE POPULATION
9,730
FEMALE POPULATION
129.14
MALES / 100 FEMALES
77.44
FEMALES / 100 MALES
36.3
MEDIAN AGE
2.9
AVG FAMILY SIZE
2.4
AVG HOUSEHOLD SIZE
$26,231
PER CAPITA INCOME
$75,024
AVG FAMILY INCOME
$51,499
AVG HOUSEHOLD INCOME
39.2%
WAGE / INCOME GAP [ % ]
60.8¢/ $1
WAGE / INCOME GAP [ $ ]
$14,275
FAMILY INCOME DEFICIT
0.46
INEQUALITY / GINI INDEX
9,119
LABOR FORCE [ PEOPLE ]
51.5%
PERCENT IN LABOR FORCE
6.2%
UNEMPLOYMENT RATE
Beckham County Area Codes
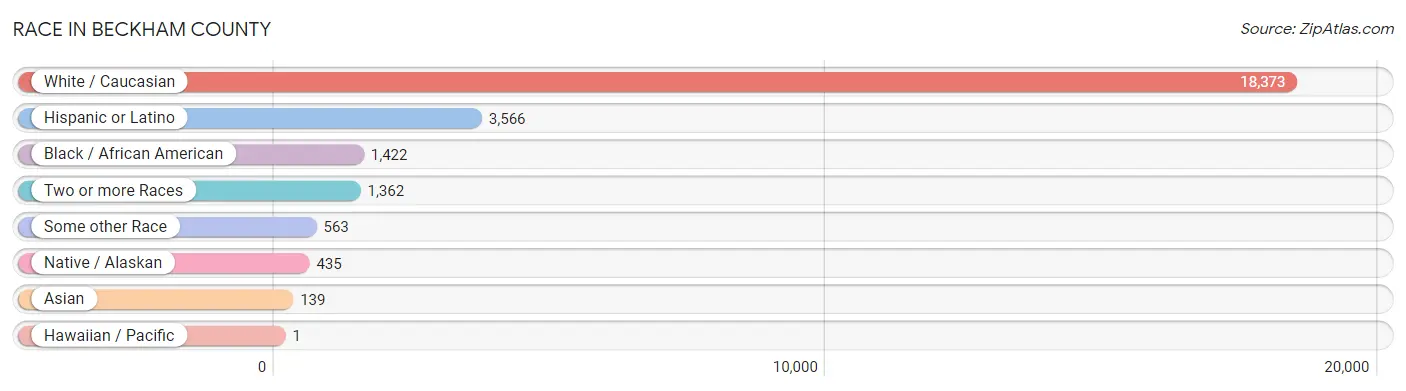
Race in Beckham County
The most populous races in Beckham County are White / Caucasian (18,373 | 82.4%), Hispanic or Latino (3,566 | 16.0%), and Black / African American (1,422 | 6.4%).
| Race | # Population | % Population |
| Asian | 139 | 0.6% |
| Black / African American | 1,422 | 6.4% |
| Hawaiian / Pacific | 1 | 0.0% |
| Hispanic or Latino | 3,566 | 16.0% |
| Native / Alaskan | 435 | 1.9% |
| White / Caucasian | 18,373 | 82.4% |
| Two or more Races | 1,362 | 6.1% |
| Some other Race | 563 | 2.5% |
| Total | 22,295 | 100.0% |
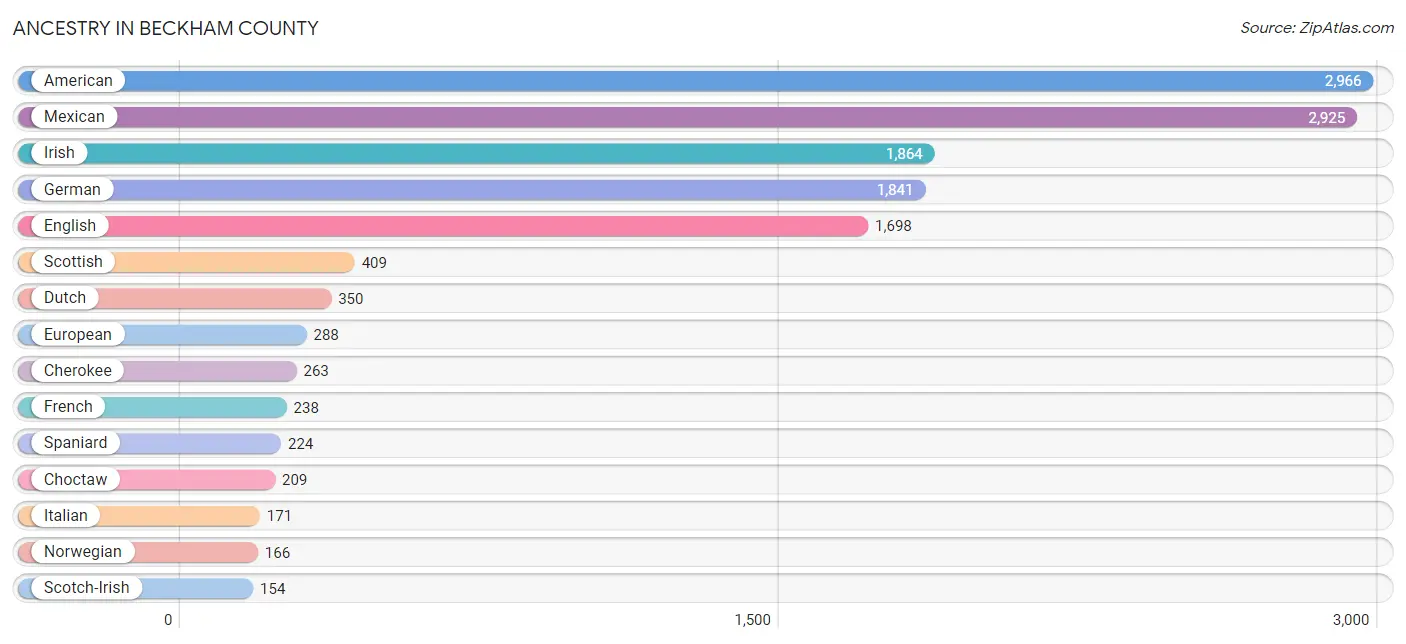
Ancestry in Beckham County
The most populous ancestries reported in Beckham County are American (2,966 | 13.3%), Mexican (2,925 | 13.1%), Irish (1,864 | 8.4%), German (1,841 | 8.3%), and English (1,698 | 7.6%), together accounting for 50.7% of all Beckham County residents.
| Ancestry | # Population | % Population |
| African | 12 | 0.1% |
| American | 2,966 | 13.3% |
| Apache | 63 | 0.3% |
| Arab | 10 | 0.0% |
| Arapaho | 9 | 0.0% |
| Bhutanese | 6 | 0.0% |
| Blackfeet | 17 | 0.1% |
| British | 15 | 0.1% |
| Burmese | 11 | 0.1% |
| Cajun | 13 | 0.1% |
| Canadian | 3 | 0.0% |
| Central American | 93 | 0.4% |
| Cherokee | 263 | 1.2% |
| Cheyenne | 37 | 0.2% |
| Chickasaw | 40 | 0.2% |
| Choctaw | 209 | 0.9% |
| Comanche | 13 | 0.1% |
| Cree | 8 | 0.0% |
| Creek | 112 | 0.5% |
| Croatian | 11 | 0.1% |
| Cuban | 54 | 0.2% |
| Czech | 39 | 0.2% |
| Czechoslovakian | 15 | 0.1% |
| Danish | 66 | 0.3% |
| Dutch | 350 | 1.6% |
| Dutch West Indian | 36 | 0.2% |
| Eastern European | 15 | 0.1% |
| English | 1,698 | 7.6% |
| European | 288 | 1.3% |
| Finnish | 6 | 0.0% |
| French | 238 | 1.1% |
| French Canadian | 123 | 0.5% |
| German | 1,841 | 8.3% |
| Guatemalan | 2 | 0.0% |
| Haitian | 19 | 0.1% |
| Honduran | 80 | 0.4% |
| Indian (Asian) | 67 | 0.3% |
| Irish | 1,864 | 8.4% |
| Italian | 171 | 0.8% |
| Jamaican | 15 | 0.1% |
| Kiowa | 55 | 0.3% |
| Korean | 67 | 0.3% |
| Laotian | 20 | 0.1% |
| Lebanese | 9 | 0.0% |
| Mexican | 2,925 | 13.1% |
| Mexican American Indian | 3 | 0.0% |
| Native Hawaiian | 4 | 0.0% |
| Nigerian | 9 | 0.0% |
| Northern European | 59 | 0.3% |
| Norwegian | 166 | 0.7% |
| Osage | 20 | 0.1% |
| Ottawa | 3 | 0.0% |
| Panamanian | 11 | 0.1% |
| Pennsylvania German | 10 | 0.0% |
| Polish | 19 | 0.1% |
| Portuguese | 65 | 0.3% |
| Potawatomi | 21 | 0.1% |
| Puerto Rican | 60 | 0.3% |
| Romanian | 12 | 0.1% |
| Russian | 4 | 0.0% |
| Scandinavian | 46 | 0.2% |
| Scotch-Irish | 154 | 0.7% |
| Scottish | 409 | 1.8% |
| Seminole | 46 | 0.2% |
| Sioux | 1 | 0.0% |
| South American | 17 | 0.1% |
| Spaniard | 224 | 1.0% |
| Spanish | 11 | 0.1% |
| Subsaharan African | 30 | 0.1% |
| Swedish | 77 | 0.4% |
| Venezuelan | 17 | 0.1% |
| Welsh | 72 | 0.3% | View All 72 Rows |
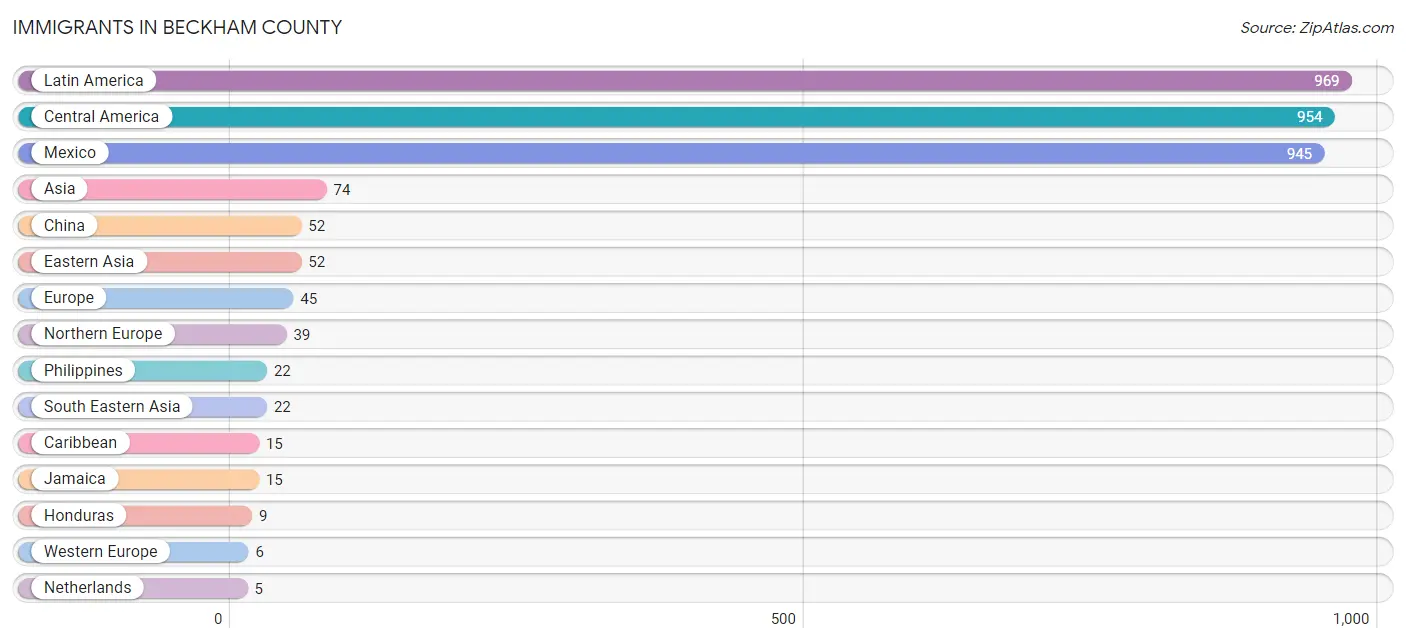
Immigrants in Beckham County
The most numerous immigrant groups reported in Beckham County came from Latin America (969 | 4.3%), Central America (954 | 4.3%), Mexico (945 | 4.2%), Asia (74 | 0.3%), and China (52 | 0.2%), together accounting for 13.4% of all Beckham County residents.
| Immigration Origin | # Population | % Population |
| Asia | 74 | 0.3% |
| Caribbean | 15 | 0.1% |
| Central America | 954 | 4.3% |
| China | 52 | 0.2% |
| Eastern Asia | 52 | 0.2% |
| Europe | 45 | 0.2% |
| France | 1 | 0.0% |
| Honduras | 9 | 0.0% |
| Jamaica | 15 | 0.1% |
| Latin America | 969 | 4.3% |
| Mexico | 945 | 4.2% |
| Netherlands | 5 | 0.0% |
| Northern Europe | 39 | 0.2% |
| Philippines | 22 | 0.1% |
| South Eastern Asia | 22 | 0.1% |
| Western Europe | 6 | 0.0% | View All 16 Rows |
Sex and Age in Beckham County
Sex and Age in Beckham County
The most populous age groups in Beckham County are 35 to 39 Years (1,416 | 11.3%) for men and Under 5 Years (799 | 8.2%) for women.

| Age Bracket | Male | Female |
| Under 5 Years | 620 (4.9%) | 799 (8.2%) |
| 5 to 9 Years | 804 (6.4%) | 753 (7.7%) |
| 10 to 14 Years | 754 (6.0%) | 774 (8.0%) |
| 15 to 19 Years | 606 (4.8%) | 526 (5.4%) |
| 20 to 24 Years | 926 (7.4%) | 436 (4.5%) |
| 25 to 29 Years | 1,164 (9.3%) | 653 (6.7%) |
| 30 to 34 Years | 1,166 (9.3%) | 608 (6.2%) |
| 35 to 39 Years | 1,416 (11.3%) | 589 (6.0%) |
| 40 to 44 Years | 826 (6.6%) | 555 (5.7%) |
| 45 to 49 Years | 671 (5.3%) | 514 (5.3%) |
| 50 to 54 Years | 698 (5.6%) | 569 (5.9%) |
| 55 to 59 Years | 702 (5.6%) | 595 (6.1%) |
| 60 to 64 Years | 795 (6.3%) | 702 (7.2%) |
| 65 to 69 Years | 523 (4.2%) | 543 (5.6%) |
| 70 to 74 Years | 318 (2.5%) | 387 (4.0%) |
| 75 to 79 Years | 280 (2.2%) | 329 (3.4%) |
| 80 to 84 Years | 123 (1.0%) | 221 (2.3%) |
| 85 Years and over | 173 (1.4%) | 177 (1.8%) |
| Total | 12,565 (100.0%) | 9,730 (100.0%) |
Families and Households in Beckham County
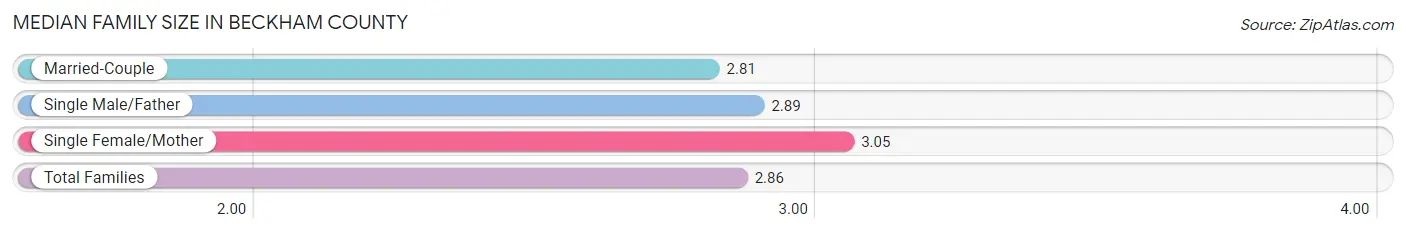
Median Family Size in Beckham County
The median family size in Beckham County is 2.86 persons per family, with single female/mother families (833 | 16.6%) accounting for the largest median family size of 3.05 persons per family. On the other hand, married-couple families (3,660 | 72.7%) represent the smallest median family size with 2.81 persons per family.
| Family Type | # Families | Family Size |
| Married-Couple | 3,660 (72.7%) | 2.81 |
| Single Male/Father | 541 (10.7%) | 2.89 |
| Single Female/Mother | 833 (16.6%) | 3.05 |
| Total Families | 5,034 (100.0%) | 2.86 |
Median Household Size in Beckham County
The median household size in Beckham County is 2.36 persons per household, with single female/mother households (833 | 10.4%) accounting for the largest median household size of 3.67 persons per household. non-family households (2,979 | 37.2%) represent the smallest median household size with 1.19 persons per household.
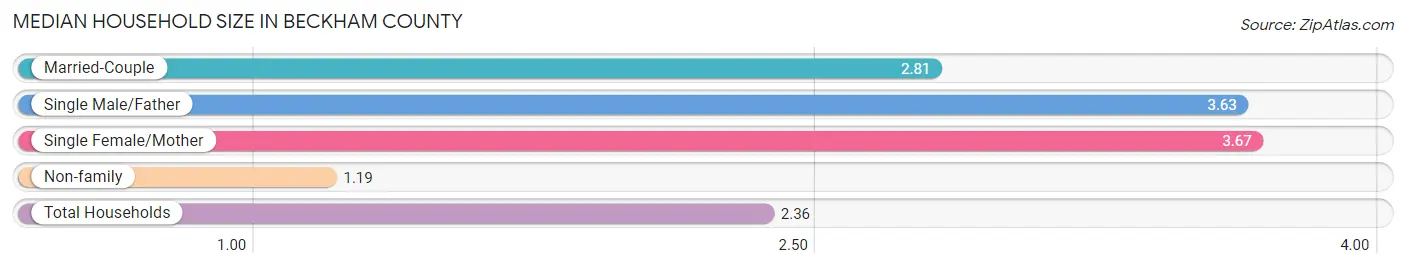
| Household Type | # Households | Household Size |
| Married-Couple | 3,660 (45.7%) | 2.81 |
| Single Male/Father | 541 (6.8%) | 3.63 |
| Single Female/Mother | 833 (10.4%) | 3.67 |
| Non-family | 2,979 (37.2%) | 1.19 |
| Total Households | 8,013 (100.0%) | 2.36 |
Household Size by Marriage Status in Beckham County
Out of a total of 8,013 households in Beckham County, 5,034 (62.8%) are family households, while 2,979 (37.2%) are nonfamily households. The most numerous type of family households are 2-person households, comprising 2,594, and the most common type of nonfamily households are 1-person households, comprising 2,426.

| Household Size | Family Households | Nonfamily Households |
| 1-Person Households | - | 2,426 (30.3%) |
| 2-Person Households | 2,594 (32.4%) | 528 (6.6%) |
| 3-Person Households | 1,173 (14.6%) | 25 (0.3%) |
| 4-Person Households | 640 (8.0%) | 0 (0.0%) |
| 5-Person Households | 325 (4.1%) | 0 (0.0%) |
| 6-Person Households | 206 (2.6%) | 0 (0.0%) |
| 7+ Person Households | 96 (1.2%) | 0 (0.0%) |
| Total | 5,034 (62.8%) | 2,979 (37.2%) |
Female Fertility in Beckham County
Fertility by Age in Beckham County
Average fertility rate in Beckham County is 120.0 births per 1,000 women. Women in the age bracket of 20 to 34 years have the highest fertility rate with 166.0 births per 1,000 women. Women in the age bracket of 20 to 34 years acount for 60.1% of all women with births.
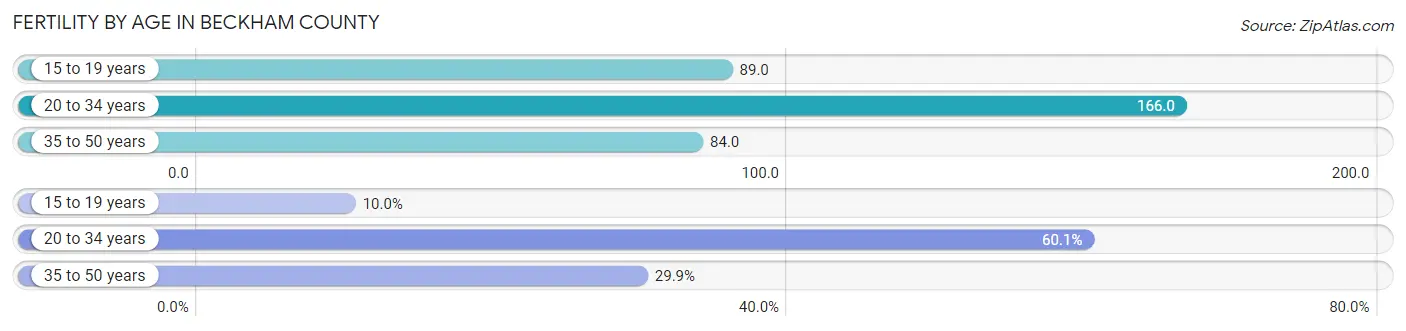
| Age Bracket | Women with Births | Births / 1,000 Women |
| 15 to 19 years | 47 (10.0%) | 89.0 |
| 20 to 34 years | 282 (60.1%) | 166.0 |
| 35 to 50 years | 140 (29.8%) | 84.0 |
| Total | 469 (100.0%) | 120.0 |
Fertility by Age by Marriage Status in Beckham County
58.6% of women with births (469) in Beckham County are married. The highest percentage of unmarried women with births falls into 35 to 50 years age bracket with 53.6% of them unmarried at the time of birth, while the lowest percentage of unmarried women with births belong to 15 to 19 years age bracket with 0.0% of them unmarried.
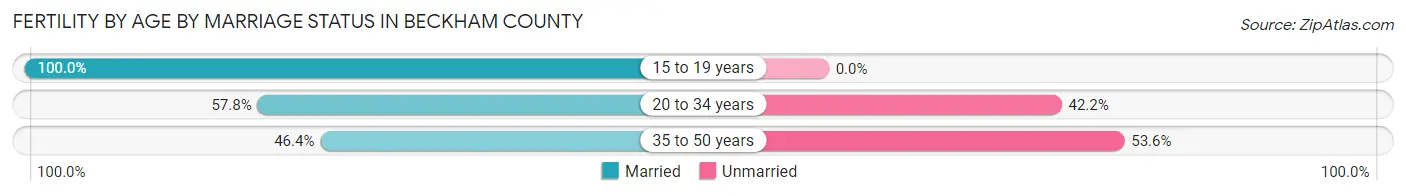
| Age Bracket | Married | Unmarried |
| 15 to 19 years | 47 (100.0%) | 0 (0.0%) |
| 20 to 34 years | 163 (57.8%) | 119 (42.2%) |
| 35 to 50 years | 65 (46.4%) | 75 (53.6%) |
| Total | 275 (58.6%) | 194 (41.4%) |
Fertility by Education in Beckham County
Average fertility rate in Beckham County is 120.0 births per 1,000 women. Women with the education attainment of graduate degree have the highest fertility rate of 419.0 births per 1,000 women, while women with the education attainment of less than high school have the lowest fertility at 5.0 births per 1,000 women. Women with the education attainment of college or associate's degree represent 39.0% of all women with births.
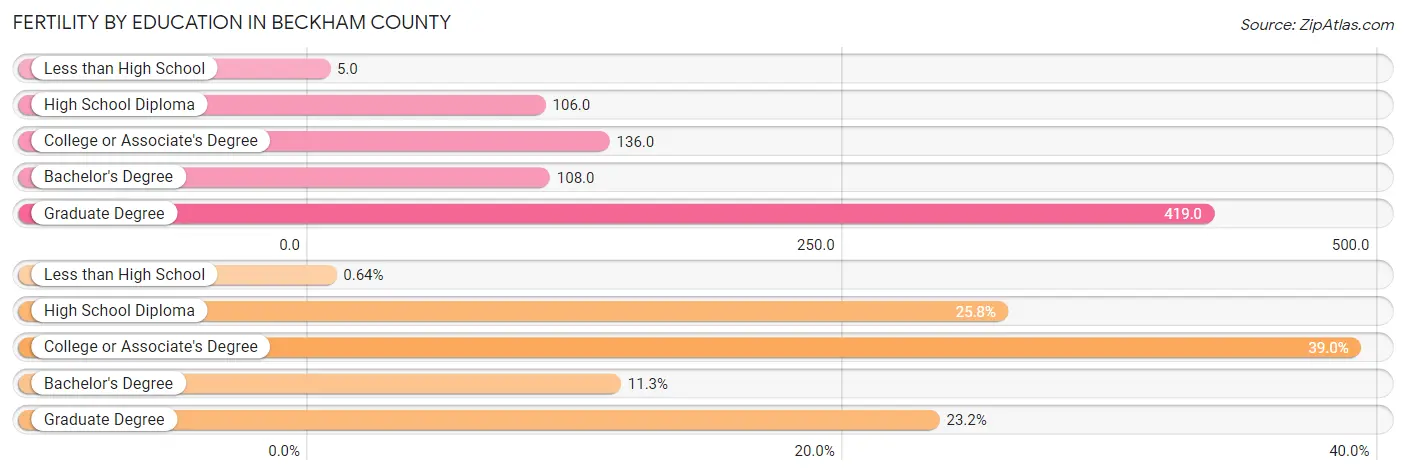
| Educational Attainment | Women with Births | Births / 1,000 Women |
| Less than High School | 3 (0.6%) | 5.0 |
| High School Diploma | 121 (25.8%) | 106.0 |
| College or Associate's Degree | 183 (39.0%) | 136.0 |
| Bachelor's Degree | 53 (11.3%) | 108.0 |
| Graduate Degree | 109 (23.2%) | 419.0 |
| Total | 469 (100.0%) | 120.0 |
Fertility by Education by Marriage Status in Beckham County
41.4% of women with births in Beckham County are unmarried. Women with the educational attainment of less than high school are most likely to be married with 100.0% of them married at childbirth, while women with the educational attainment of college or associate's degree are least likely to be married with 87.4% of them unmarried at childbirth.

| Educational Attainment | Married | Unmarried |
| Less than High School | 3 (100.0%) | 0 (0.0%) |
| High School Diploma | 87 (71.9%) | 34 (28.1%) |
| College or Associate's Degree | 23 (12.6%) | 160 (87.4%) |
| Bachelor's Degree | 53 (100.0%) | 0 (0.0%) |
| Graduate Degree | 109 (100.0%) | 0 (0.0%) |
| Total | 275 (58.6%) | 194 (41.4%) |
Income in Beckham County
Income Overview in Beckham County
Per Capita Income in Beckham County is $26,231, while median incomes of families and households are $75,024 and $51,499 respectively.
| Characteristic | Number | Measure |
| Per Capita Income | 22,295 | $26,231 |
| Median Family Income | 5,034 | $75,024 |
| Mean Family Income | 5,034 | $88,350 |
| Median Household Income | 8,013 | $51,499 |
| Mean Household Income | 8,013 | $72,386 |
| Income Deficit | 5,034 | $14,275 |
| Wage / Income Gap (%) | 22,295 | 39.17% |
| Wage / Income Gap ($) | 22,295 | 60.83¢ per $1 |
| Gini / Inequality Index | 22,295 | 0.46 |
Earnings by Sex in Beckham County
Average Earnings in Beckham County are $34,051, $45,802 for men and $27,860 for women, a difference of 39.2%.
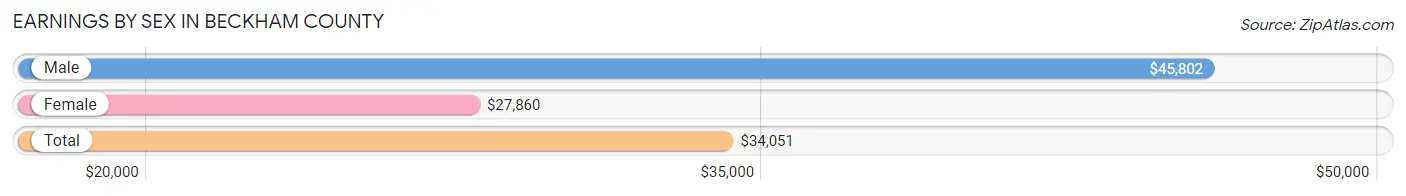
| Sex | Number | Average Earnings |
| Male | 5,398 (54.6%) | $45,802 |
| Female | 4,493 (45.4%) | $27,860 |
| Total | 9,891 (100.0%) | $34,051 |
Earnings by Sex by Income Bracket in Beckham County
The most common earnings brackets in Beckham County are $100,000+ for men (701 | 13.0%) and $30,000 to $34,999 for women (485 | 10.8%).
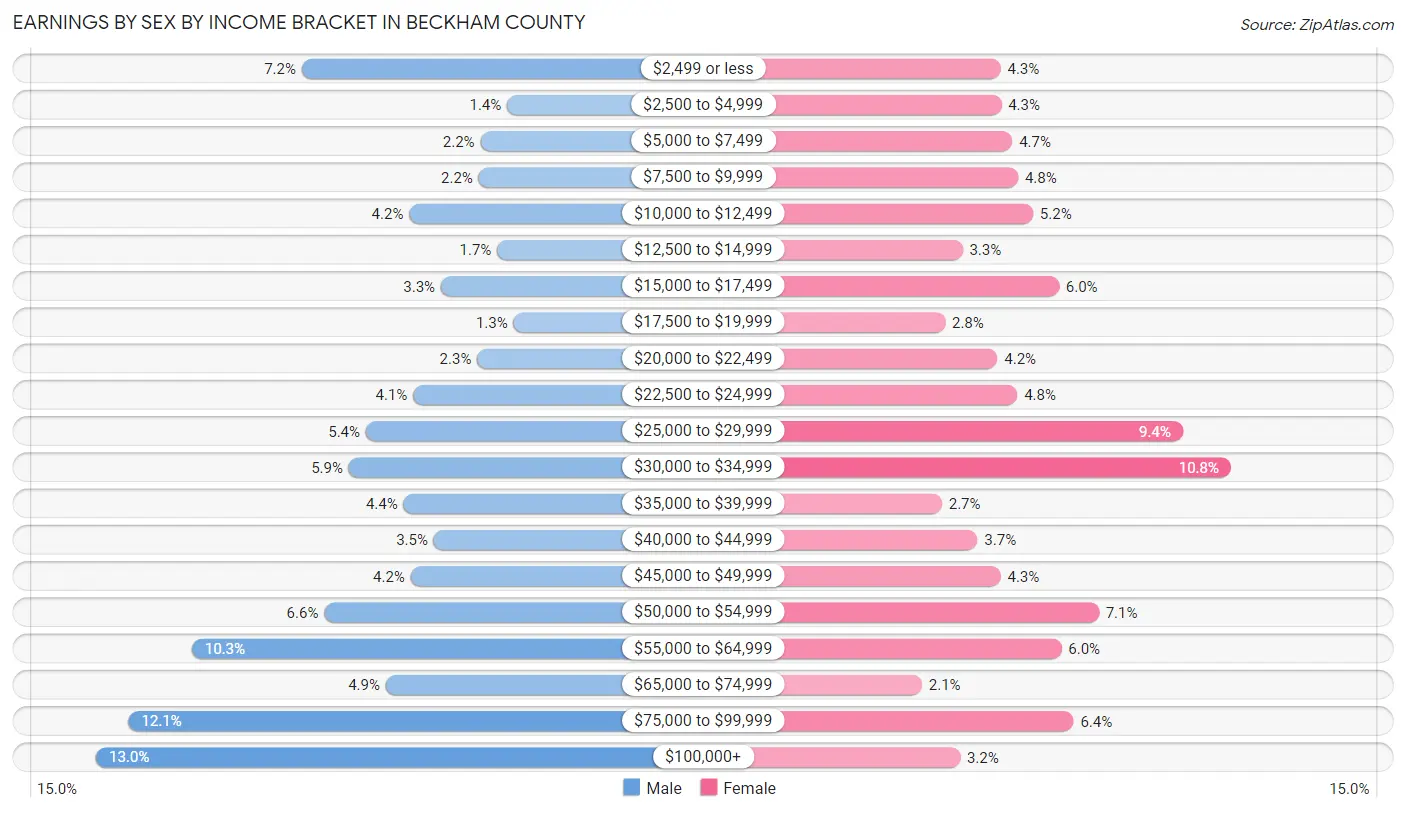
| Income | Male | Female |
| $2,499 or less | 389 (7.2%) | 194 (4.3%) |
| $2,500 to $4,999 | 78 (1.4%) | 195 (4.3%) |
| $5,000 to $7,499 | 118 (2.2%) | 209 (4.6%) |
| $7,500 to $9,999 | 121 (2.2%) | 216 (4.8%) |
| $10,000 to $12,499 | 226 (4.2%) | 235 (5.2%) |
| $12,500 to $14,999 | 93 (1.7%) | 146 (3.3%) |
| $15,000 to $17,499 | 178 (3.3%) | 268 (6.0%) |
| $17,500 to $19,999 | 68 (1.3%) | 124 (2.8%) |
| $20,000 to $22,499 | 123 (2.3%) | 190 (4.2%) |
| $22,500 to $24,999 | 220 (4.1%) | 215 (4.8%) |
| $25,000 to $29,999 | 292 (5.4%) | 424 (9.4%) |
| $30,000 to $34,999 | 318 (5.9%) | 485 (10.8%) |
| $35,000 to $39,999 | 235 (4.3%) | 120 (2.7%) |
| $40,000 to $44,999 | 189 (3.5%) | 165 (3.7%) |
| $45,000 to $49,999 | 224 (4.2%) | 194 (4.3%) |
| $50,000 to $54,999 | 355 (6.6%) | 318 (7.1%) |
| $55,000 to $64,999 | 556 (10.3%) | 271 (6.0%) |
| $65,000 to $74,999 | 262 (4.9%) | 95 (2.1%) |
| $75,000 to $99,999 | 652 (12.1%) | 286 (6.4%) |
| $100,000+ | 701 (13.0%) | 143 (3.2%) |
| Total | 5,398 (100.0%) | 4,493 (100.0%) |
Earnings by Sex by Educational Attainment in Beckham County
Average earnings in Beckham County are $51,744 for men and $31,096 for women, a difference of 39.9%. Men with an educational attainment of graduate degree enjoy the highest average annual earnings of $117,279, while those with college or associate's degree education earn the least with $45,290. Women with an educational attainment of graduate degree earn the most with the average annual earnings of $55,160, while those with high school diploma education have the smallest earnings of $25,347.
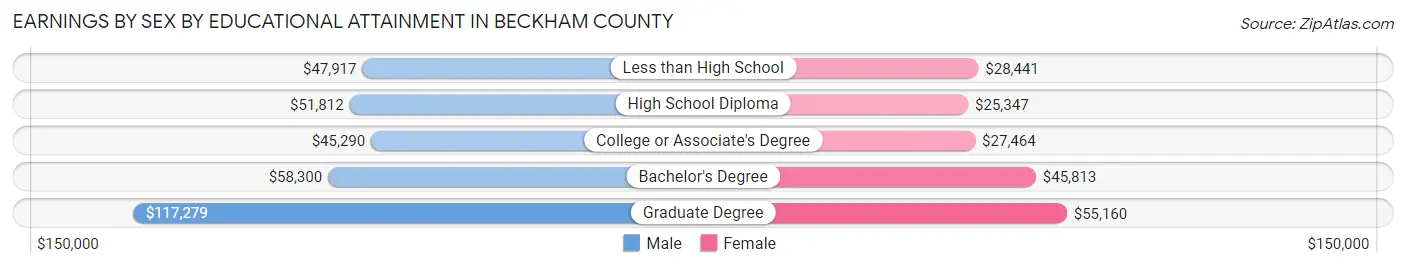
| Educational Attainment | Male Income | Female Income |
| Less than High School | $47,917 | $28,441 |
| High School Diploma | $51,812 | $25,347 |
| College or Associate's Degree | $45,290 | $27,464 |
| Bachelor's Degree | $58,300 | $45,813 |
| Graduate Degree | $117,279 | $55,160 |
| Total | $51,744 | $31,096 |
Family Income in Beckham County
Family Income Brackets in Beckham County
According to the Beckham County family income data, there are 961 families falling into the $100,000 to $149,999 income range, which is the most common income bracket and makes up 19.1% of all families. Conversely, the $10,000 to $14,999 income bracket is the least frequent group with only 141 families (2.8%) belonging to this category.

| Income Bracket | # Families | % Families |
| Less than $10,000 | 257 | 5.1% |
| $10,000 to $14,999 | 141 | 2.8% |
| $15,000 to $24,999 | 312 | 6.2% |
| $25,000 to $34,999 | 478 | 9.5% |
| $35,000 to $49,999 | 735 | 14.6% |
| $50,000 to $74,999 | 594 | 11.8% |
| $75,000 to $99,999 | 841 | 16.7% |
| $100,000 to $149,999 | 961 | 19.1% |
| $150,000 to $199,999 | 448 | 8.9% |
| $200,000+ | 272 | 5.4% |
Family Income by Famaliy Size in Beckham County
4-person families (621 | 12.3%) account for the highest median family income in Beckham County with $91,250 per family, while 3-person families (1,176 | 23.4%) have the highest median income of $27,121 per family member.
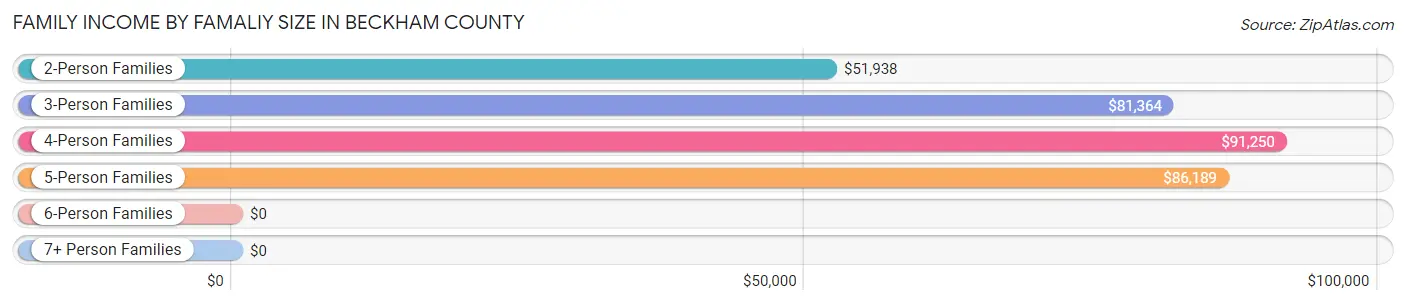
| Income Bracket | # Families | Median Income |
| 2-Person Families | 2,720 (54.0%) | $51,938 |
| 3-Person Families | 1,176 (23.4%) | $81,364 |
| 4-Person Families | 621 (12.3%) | $91,250 |
| 5-Person Families | 250 (5.0%) | $86,189 |
| 6-Person Families | 225 (4.5%) | $0 |
| 7+ Person Families | 42 (0.8%) | $0 |
| Total | 5,034 (100.0%) | $75,024 |
Family Income by Number of Earners in Beckham County
The median family income in Beckham County is $75,024, with families comprising 2 earners (2,084) having the highest median family income of $105,288, while families with no earners (783) have the lowest median family income of $32,607, accounting for 41.4% and 15.5% of families, respectively.
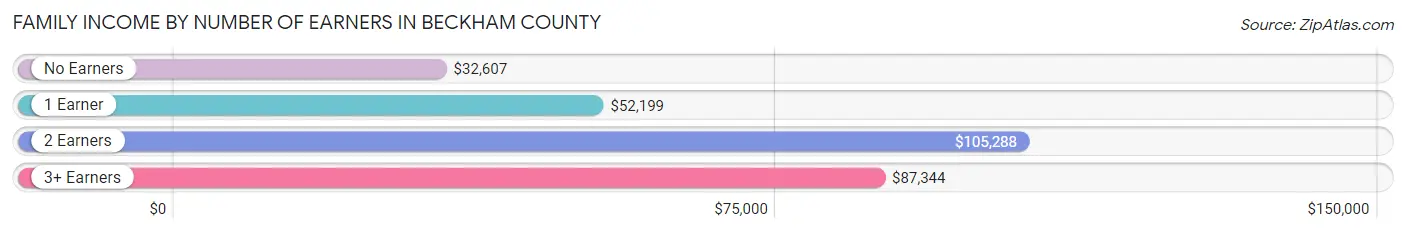
| Number of Earners | # Families | Median Income |
| No Earners | 783 (15.5%) | $32,607 |
| 1 Earner | 1,931 (38.4%) | $52,199 |
| 2 Earners | 2,084 (41.4%) | $105,288 |
| 3+ Earners | 236 (4.7%) | $87,344 |
| Total | 5,034 (100.0%) | $75,024 |
Household Income in Beckham County
Household Income Brackets in Beckham County
With 1,146 households falling in the category, the $50,000 to $74,999 income range is the most frequent in Beckham County, accounting for 14.3% of all households. In contrast, only 288 households (3.6%) fall into the $200,000+ income bracket, making it the least populous group.
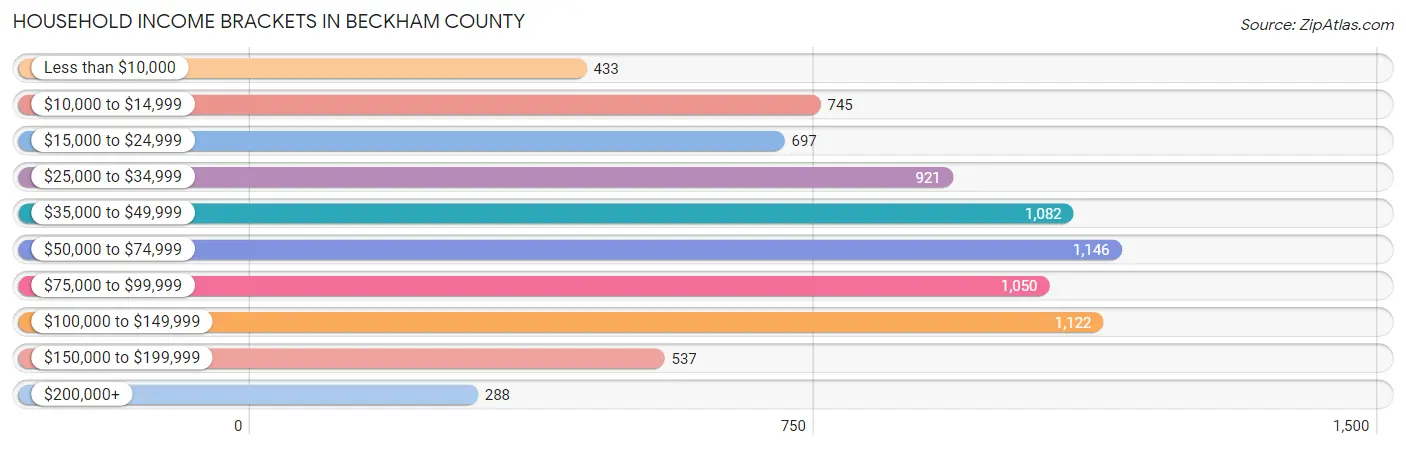
| Income Bracket | # Households | % Households |
| Less than $10,000 | 433 | 5.4% |
| $10,000 to $14,999 | 745 | 9.3% |
| $15,000 to $24,999 | 697 | 8.7% |
| $25,000 to $34,999 | 921 | 11.5% |
| $35,000 to $49,999 | 1,082 | 13.5% |
| $50,000 to $74,999 | 1,146 | 14.3% |
| $75,000 to $99,999 | 1,050 | 13.1% |
| $100,000 to $149,999 | 1,122 | 14.0% |
| $150,000 to $199,999 | 537 | 6.7% |
| $200,000+ | 288 | 3.6% |
Household Income by Householder Age in Beckham County
The median household income in Beckham County is $51,499, with the highest median household income of $70,523 found in the 45 to 64 years age bracket for the primary householder. A total of 2,381 households (29.7%) fall into this category. Meanwhile, the 15 to 24 years age bracket for the primary householder has the lowest median household income of $32,125, with 662 households (8.3%) in this group.
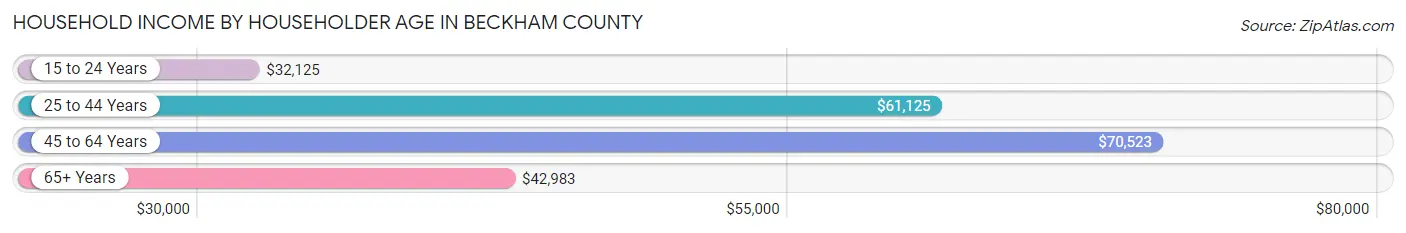
| Income Bracket | # Households | Median Income |
| 15 to 24 Years | 662 (8.3%) | $32,125 |
| 25 to 44 Years | 2,927 (36.5%) | $61,125 |
| 45 to 64 Years | 2,381 (29.7%) | $70,523 |
| 65+ Years | 2,043 (25.5%) | $42,983 |
| Total | 8,013 (100.0%) | $51,499 |
Poverty in Beckham County
Income Below Poverty by Sex and Age in Beckham County
With 21.2% poverty level for males and 22.6% for females among the residents of Beckham County, 18 to 24 year old males and 15 year old females are the most vulnerable to poverty, with 481 males (50.9%) and 31 females (58.5%) in their respective age groups living below the poverty level.
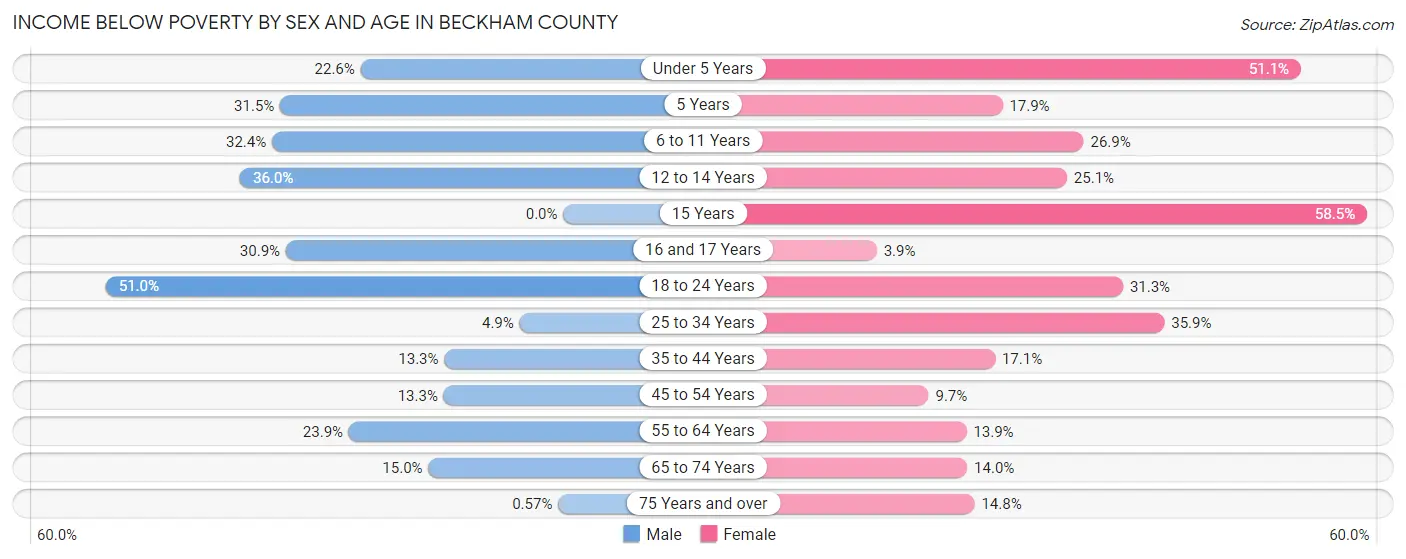
| Age Bracket | Male | Female |
| Under 5 Years | 140 (22.6%) | 406 (51.1%) |
| 5 Years | 94 (31.5%) | 39 (17.9%) |
| 6 to 11 Years | 230 (32.4%) | 214 (26.9%) |
| 12 to 14 Years | 198 (36.0%) | 86 (25.1%) |
| 15 Years | 0 (0.0%) | 31 (58.5%) |
| 16 and 17 Years | 106 (30.9%) | 11 (3.9%) |
| 18 to 24 Years | 481 (50.9%) | 196 (31.3%) |
| 25 to 34 Years | 61 (4.9%) | 453 (35.9%) |
| 35 to 44 Years | 185 (13.3%) | 194 (17.1%) |
| 45 to 54 Years | 106 (13.3%) | 103 (9.7%) |
| 55 to 64 Years | 251 (23.9%) | 180 (13.9%) |
| 65 to 74 Years | 116 (15.0%) | 128 (14.0%) |
| 75 Years and over | 3 (0.6%) | 98 (14.8%) |
| Total | 1,971 (21.2%) | 2,139 (22.6%) |
Income Above Poverty by Sex and Age in Beckham County
According to the poverty statistics in Beckham County, males aged 15 years and females aged 16 and 17 years are the age groups that are most secure financially, with 100.0% of males and 96.1% of females in these age groups living above the poverty line.
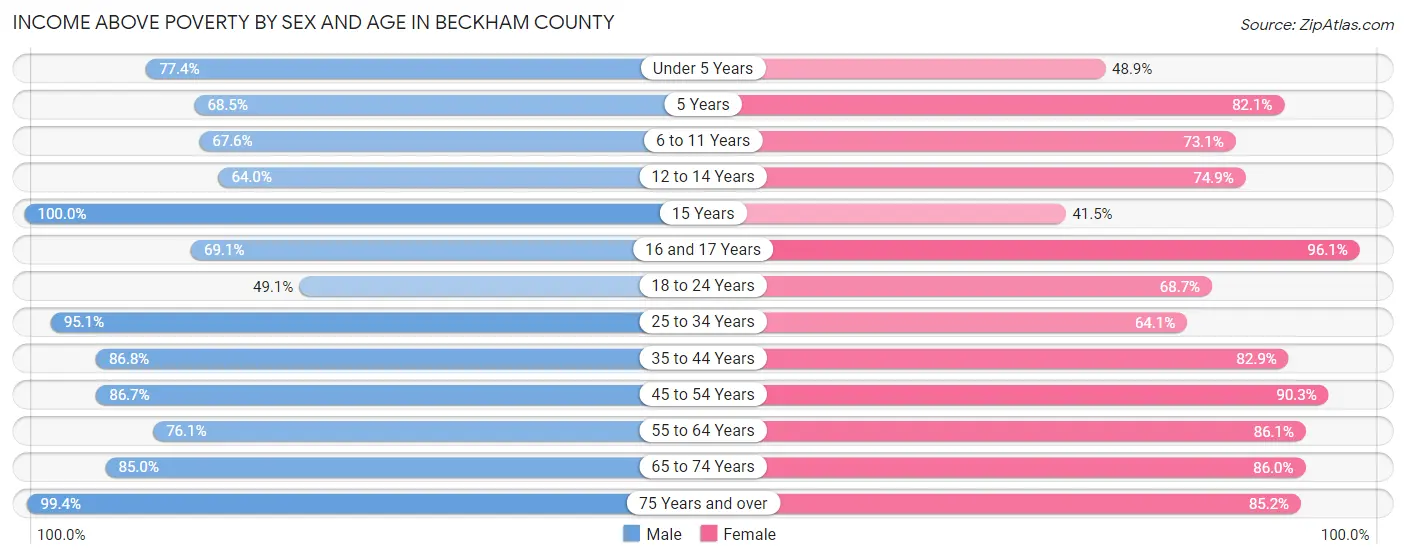
| Age Bracket | Male | Female |
| Under 5 Years | 480 (77.4%) | 388 (48.9%) |
| 5 Years | 204 (68.5%) | 179 (82.1%) |
| 6 to 11 Years | 479 (67.6%) | 581 (73.1%) |
| 12 to 14 Years | 352 (64.0%) | 257 (74.9%) |
| 15 Years | 30 (100.0%) | 22 (41.5%) |
| 16 and 17 Years | 237 (69.1%) | 272 (96.1%) |
| 18 to 24 Years | 463 (49.0%) | 430 (68.7%) |
| 25 to 34 Years | 1,192 (95.1%) | 808 (64.1%) |
| 35 to 44 Years | 1,211 (86.8%) | 943 (82.9%) |
| 45 to 54 Years | 690 (86.7%) | 963 (90.3%) |
| 55 to 64 Years | 800 (76.1%) | 1,117 (86.1%) |
| 65 to 74 Years | 656 (85.0%) | 789 (86.0%) |
| 75 Years and over | 519 (99.4%) | 565 (85.2%) |
| Total | 7,313 (78.8%) | 7,314 (77.4%) |
Income Below Poverty Among Married-Couple Families in Beckham County
The poverty statistics for married-couple families in Beckham County show that 5.1% or 185 of the total 3,660 families live below the poverty line. Families with 5 or more children have the highest poverty rate of 100.0%, comprising of 15 families. On the other hand, families with no children have the lowest poverty rate of 2.6%, which includes 57 families.
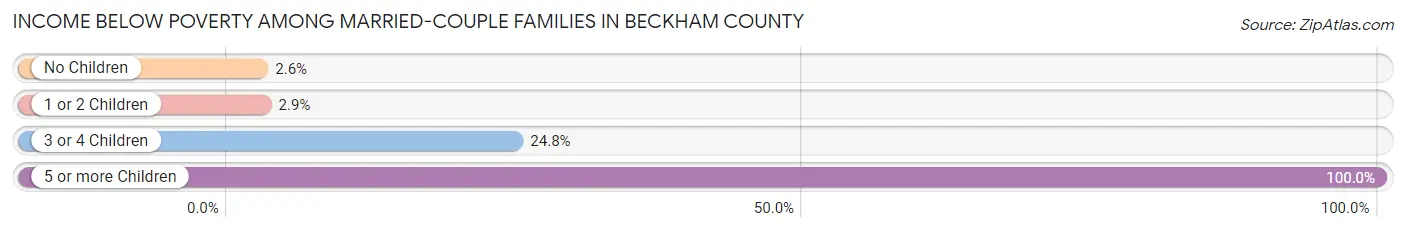
| Children | Above Poverty | Below Poverty |
| No Children | 2,105 (97.4%) | 57 (2.6%) |
| 1 or 2 Children | 1,131 (97.1%) | 34 (2.9%) |
| 3 or 4 Children | 239 (75.2%) | 79 (24.8%) |
| 5 or more Children | 0 (0.0%) | 15 (100.0%) |
| Total | 3,475 (95.0%) | 185 (5.1%) |
Income Below Poverty Among Single-Parent Households in Beckham County
According to the poverty data in Beckham County, 3.7% or 20 single-father households and 54.9% or 457 single-mother households are living below the poverty line. Among single-father households, those with 3 or 4 children have the highest poverty rate, with 4 households (19.1%) experiencing poverty. Likewise, among single-mother households, those with 3 or 4 children have the highest poverty rate, with 130 households (100.0%) falling below the poverty line.
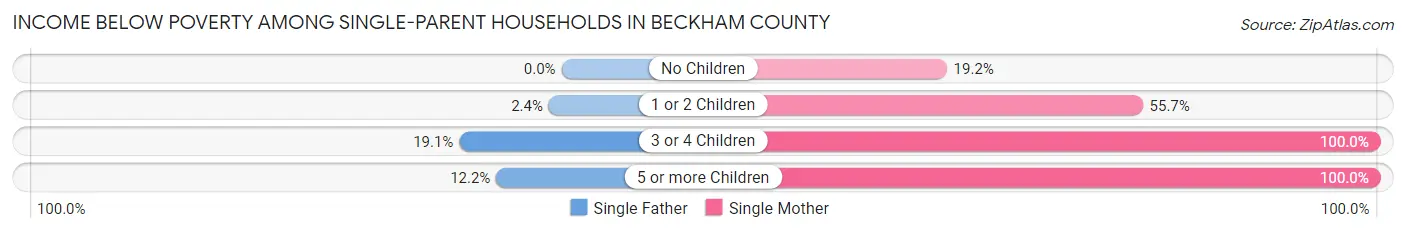
| Children | Single Father | Single Mother |
| No Children | 0 (0.0%) | 42 (19.2%) |
| 1 or 2 Children | 7 (2.4%) | 250 (55.7%) |
| 3 or 4 Children | 4 (19.1%) | 130 (100.0%) |
| 5 or more Children | 9 (12.2%) | 35 (100.0%) |
| Total | 20 (3.7%) | 457 (54.9%) |
Income Below Poverty Among Married-Couple vs Single-Parent Households in Beckham County
The poverty data for Beckham County shows that 185 of the married-couple family households (5.1%) and 477 of the single-parent households (34.7%) are living below the poverty level. Within the married-couple family households, those with 5 or more children have the highest poverty rate, with 15 households (100.0%) falling below the poverty line. Among the single-parent households, those with 3 or 4 children have the highest poverty rate, with 134 household (88.7%) living below poverty.
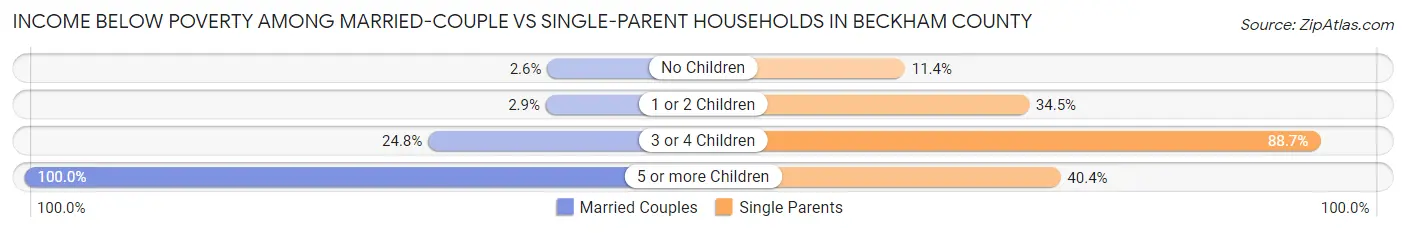
| Children | Married-Couple Families | Single-Parent Households |
| No Children | 57 (2.6%) | 42 (11.4%) |
| 1 or 2 Children | 34 (2.9%) | 257 (34.5%) |
| 3 or 4 Children | 79 (24.8%) | 134 (88.7%) |
| 5 or more Children | 15 (100.0%) | 44 (40.4%) |
| Total | 185 (5.1%) | 477 (34.7%) |
Employment Characteristics in Beckham County
Employment by Class of Employer in Beckham County
Among the 8,281 employed individuals in Beckham County, private company employees (5,154 | 62.2%), state government employees (919 | 11.1%), and self-employed (not incorporated) (813 | 9.8%) make up the most common classes of employment.
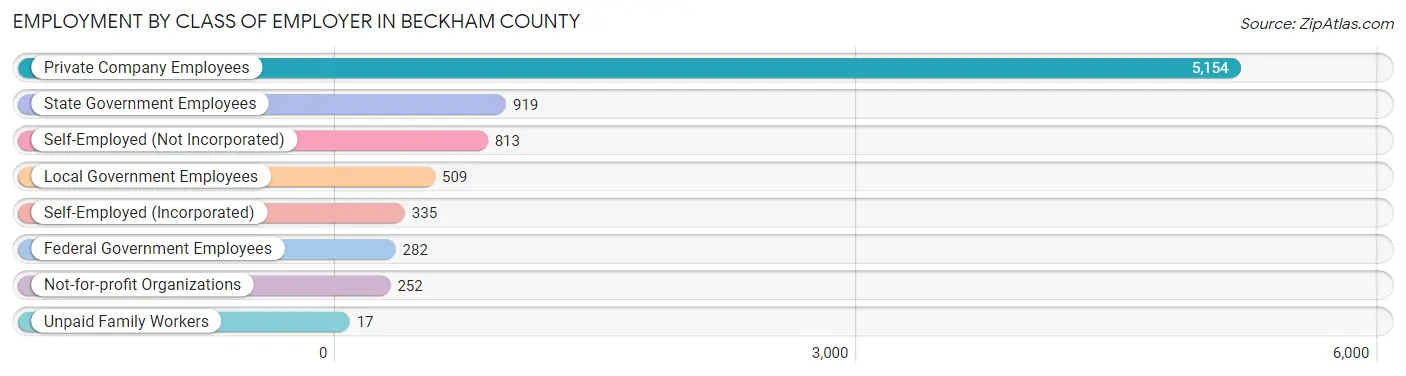
| Employer Class | # Employees | % Employees |
| Private Company Employees | 5,154 | 62.2% |
| Self-Employed (Incorporated) | 335 | 4.1% |
| Self-Employed (Not Incorporated) | 813 | 9.8% |
| Not-for-profit Organizations | 252 | 3.0% |
| Local Government Employees | 509 | 6.1% |
| State Government Employees | 919 | 11.1% |
| Federal Government Employees | 282 | 3.4% |
| Unpaid Family Workers | 17 | 0.2% |
| Total | 8,281 | 100.0% |
Employment Status by Age in Beckham County
According to the labor force statistics for Beckham County, out of the total population over 16 years of age (17,707), 51.5% or 9,119 individuals are in the labor force, with 6.2% or 565 of them unemployed. The age group with the highest labor force participation rate is 20 to 24 years, with 64.4% or 877 individuals in the labor force. Within the labor force, the 20 to 24 years age range has the highest percentage of unemployed individuals, with 16.4% or 144 of them being unemployed.
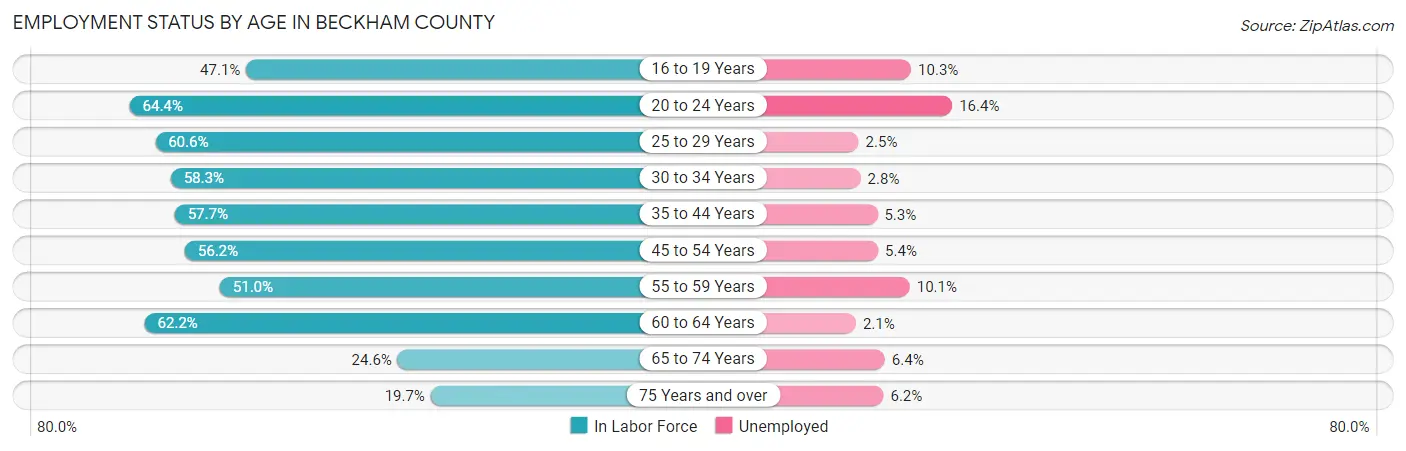
| Age Bracket | In Labor Force | Unemployed |
| 16 to 19 Years | 494 (47.1%) | 51 (10.3%) |
| 20 to 24 Years | 877 (64.4%) | 144 (16.4%) |
| 25 to 29 Years | 1,101 (60.6%) | 28 (2.5%) |
| 30 to 34 Years | 1,034 (58.3%) | 29 (2.8%) |
| 35 to 44 Years | 1,954 (57.7%) | 104 (5.3%) |
| 45 to 54 Years | 1,378 (56.2%) | 74 (5.4%) |
| 55 to 59 Years | 661 (51.0%) | 67 (10.1%) |
| 60 to 64 Years | 931 (62.2%) | 20 (2.1%) |
| 65 to 74 Years | 436 (24.6%) | 28 (6.4%) |
| 75 Years and over | 257 (19.7%) | 16 (6.2%) |
| Total | 9,119 (51.5%) | 565 (6.2%) |
Employment Status by Educational Attainment in Beckham County
According to labor force statistics for Beckham County, 57.8% of individuals (7,065) out of the total population between 25 and 64 years of age (12,223) are in the labor force, with 4.6% or 325 of them being unemployed. The group with the highest labor force participation rate are those with the educational attainment of bachelor's degree or higher, with 85.3% or 1,581 individuals in the labor force. Within the labor force, individuals with less than high school education have the highest percentage of unemployment, with 19.1% or 98 of them being unemployed.
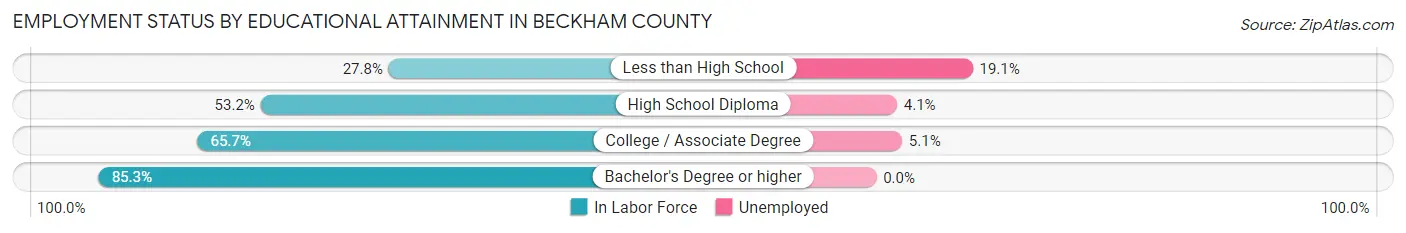
| Educational Attainment | In Labor Force | Unemployed |
| Less than High School | 513 (27.8%) | 353 (19.1%) |
| High School Diploma | 2,685 (53.2%) | 207 (4.1%) |
| College / Associate Degree | 2,284 (65.7%) | 177 (5.1%) |
| Bachelor's Degree or higher | 1,581 (85.3%) | 0 (0.0%) |
| Total | 7,065 (57.8%) | 562 (4.6%) |
Employment Occupations by Sex in Beckham County
Management, Business, Science and Arts Occupations
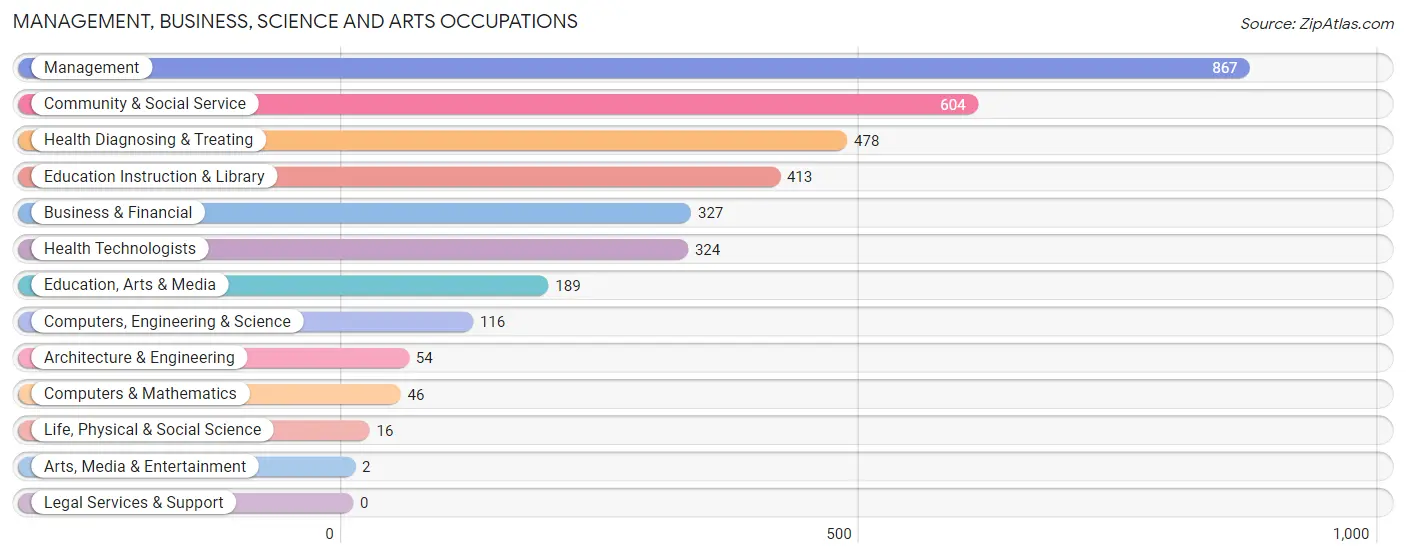
The most common Management, Business, Science and Arts occupations in Beckham County are Management (867 | 10.1%), Community & Social Service (604 | 7.0%), Health Diagnosing & Treating (478 | 5.6%), Education Instruction & Library (413 | 4.8%), and Business & Financial (327 | 3.8%).
Management, Business, Science and Arts Occupations by Sex
Within the Management, Business, Science and Arts occupations in Beckham County, the most male-oriented occupations are Computers, Engineering & Science (100.0%), Computers & Mathematics (100.0%), and Architecture & Engineering (100.0%), while the most female-oriented occupations are Arts, Media & Entertainment (100.0%), Education, Arts & Media (91.0%), and Community & Social Service (77.1%).
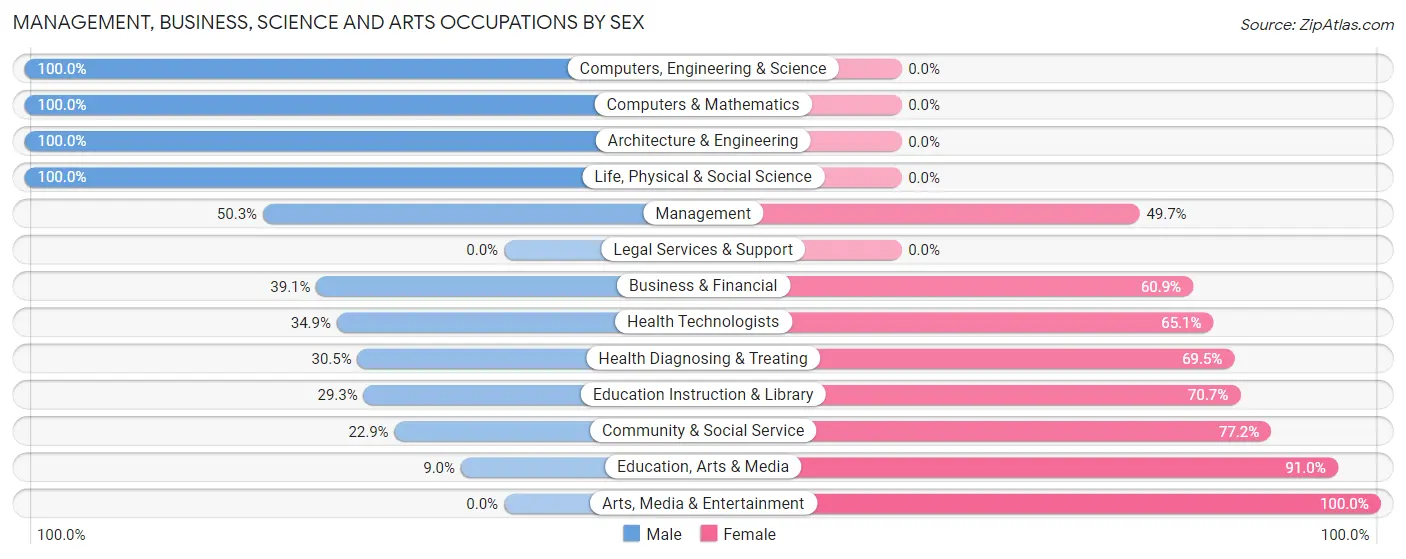
| Occupation | Male | Female |
| Management | 436 (50.3%) | 431 (49.7%) |
| Business & Financial | 128 (39.1%) | 199 (60.9%) |
| Computers, Engineering & Science | 116 (100.0%) | 0 (0.0%) |
| Computers & Mathematics | 46 (100.0%) | 0 (0.0%) |
| Architecture & Engineering | 54 (100.0%) | 0 (0.0%) |
| Life, Physical & Social Science | 16 (100.0%) | 0 (0.0%) |
| Community & Social Service | 138 (22.9%) | 466 (77.1%) |
| Education, Arts & Media | 17 (9.0%) | 172 (91.0%) |
| Legal Services & Support | 0 (0.0%) | 0 (0.0%) |
| Education Instruction & Library | 121 (29.3%) | 292 (70.7%) |
| Arts, Media & Entertainment | 0 (0.0%) | 2 (100.0%) |
| Health Diagnosing & Treating | 146 (30.5%) | 332 (69.5%) |
| Health Technologists | 113 (34.9%) | 211 (65.1%) |
| Total (Category) | 964 (40.3%) | 1,428 (59.7%) |
| Total (Overall) | 4,602 (53.7%) | 3,963 (46.3%) |
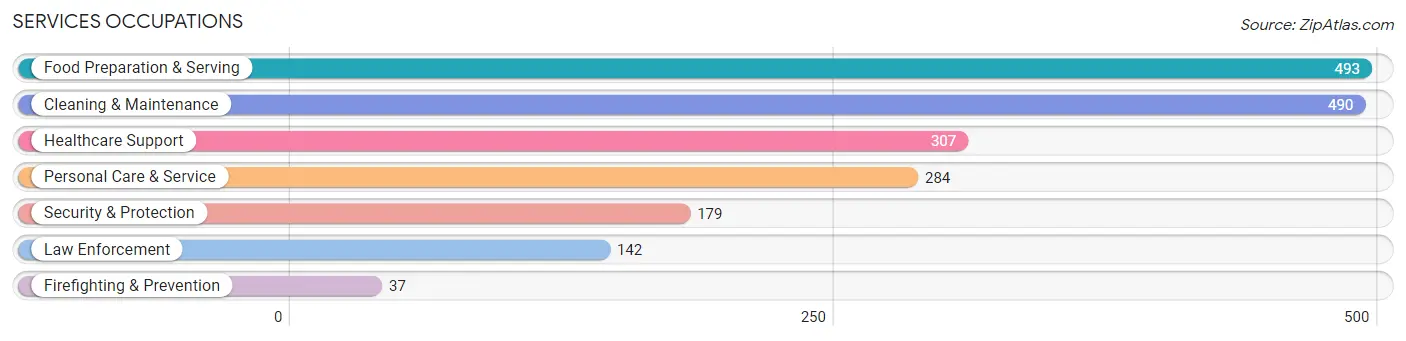
Services Occupations
The most common Services occupations in Beckham County are Food Preparation & Serving (493 | 5.8%), Cleaning & Maintenance (490 | 5.7%), Healthcare Support (307 | 3.6%), Personal Care & Service (284 | 3.3%), and Security & Protection (179 | 2.1%).
Services Occupations by Sex
Within the Services occupations in Beckham County, the most male-oriented occupations are Law Enforcement (85.2%), Security & Protection (83.2%), and Firefighting & Prevention (75.7%), while the most female-oriented occupations are Healthcare Support (95.4%), Personal Care & Service (94.4%), and Food Preparation & Serving (83.0%).

| Occupation | Male | Female |
| Healthcare Support | 14 (4.6%) | 293 (95.4%) |
| Security & Protection | 149 (83.2%) | 30 (16.8%) |
| Firefighting & Prevention | 28 (75.7%) | 9 (24.3%) |
| Law Enforcement | 121 (85.2%) | 21 (14.8%) |
| Food Preparation & Serving | 84 (17.0%) | 409 (83.0%) |
| Cleaning & Maintenance | 287 (58.6%) | 203 (41.4%) |
| Personal Care & Service | 16 (5.6%) | 268 (94.4%) |
| Total (Category) | 550 (31.4%) | 1,203 (68.6%) |
| Total (Overall) | 4,602 (53.7%) | 3,963 (46.3%) |
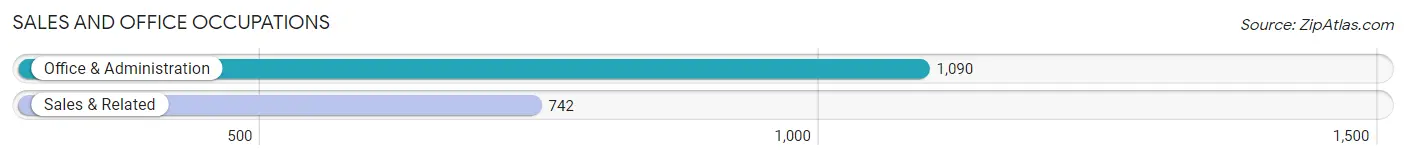
Sales and Office Occupations
The most common Sales and Office occupations in Beckham County are Office & Administration (1,090 | 12.7%), and Sales & Related (742 | 8.7%).
Sales and Office Occupations by Sex
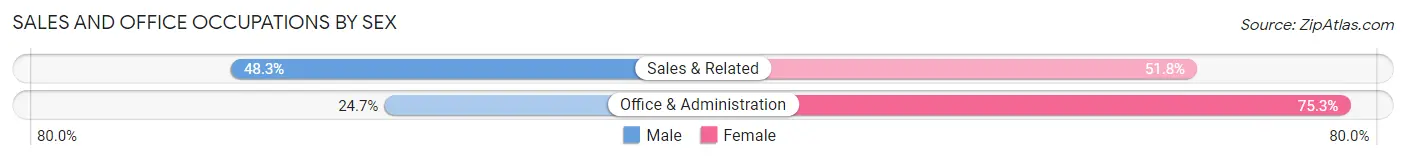
| Occupation | Male | Female |
| Sales & Related | 358 (48.2%) | 384 (51.7%) |
| Office & Administration | 269 (24.7%) | 821 (75.3%) |
| Total (Category) | 627 (34.2%) | 1,205 (65.8%) |
| Total (Overall) | 4,602 (53.7%) | 3,963 (46.3%) |
Natural Resources, Construction and Maintenance Occupations
The most common Natural Resources, Construction and Maintenance occupations in Beckham County are Construction & Extraction (1,286 | 15.0%), Installation, Maintenance & Repair (359 | 4.2%), and Farming, Fishing & Forestry (135 | 1.6%).
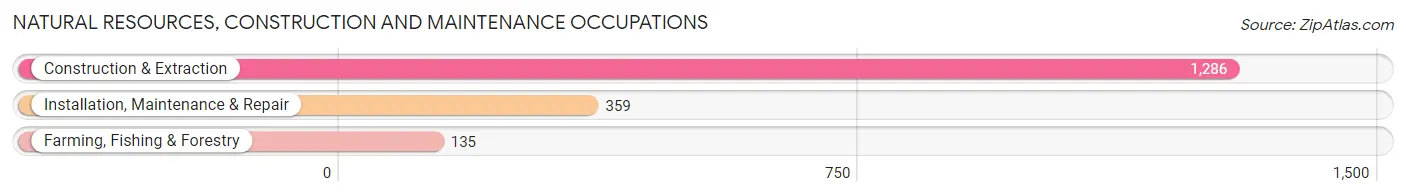
Natural Resources, Construction and Maintenance Occupations by Sex
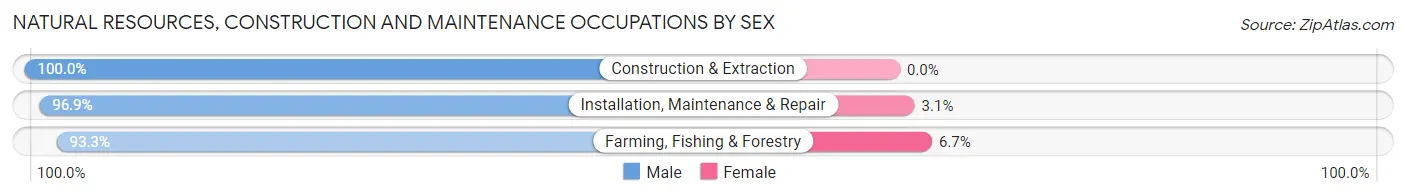
| Occupation | Male | Female |
| Farming, Fishing & Forestry | 126 (93.3%) | 9 (6.7%) |
| Construction & Extraction | 1,286 (100.0%) | 0 (0.0%) |
| Installation, Maintenance & Repair | 348 (96.9%) | 11 (3.1%) |
| Total (Category) | 1,760 (98.9%) | 20 (1.1%) |
| Total (Overall) | 4,602 (53.7%) | 3,963 (46.3%) |
Production, Transportation and Moving Occupations
The most common Production, Transportation and Moving occupations in Beckham County are Transportation (381 | 4.4%), Production (219 | 2.6%), and Material Moving (208 | 2.4%).
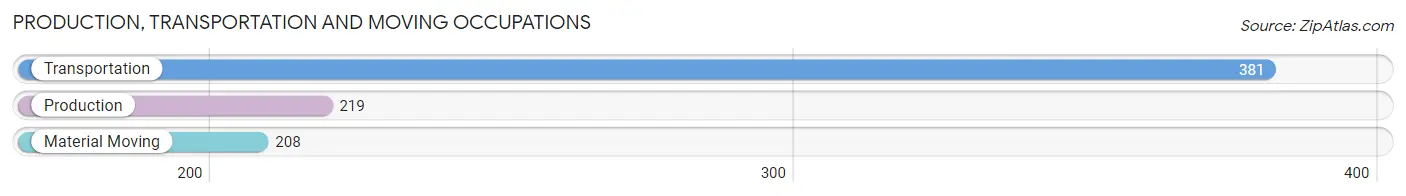
Production, Transportation and Moving Occupations by Sex
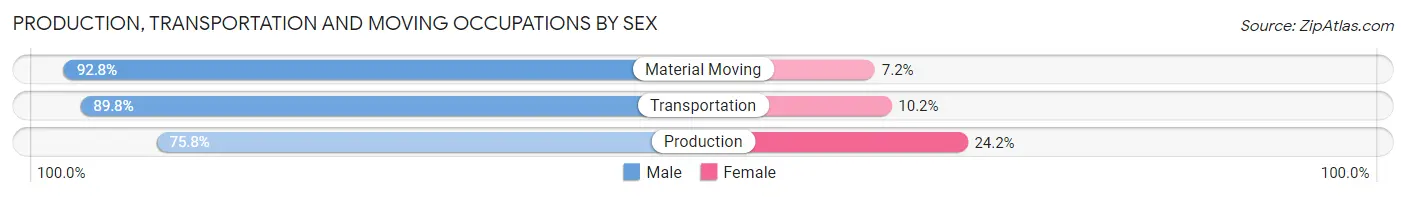
| Occupation | Male | Female |
| Production | 166 (75.8%) | 53 (24.2%) |
| Transportation | 342 (89.8%) | 39 (10.2%) |
| Material Moving | 193 (92.8%) | 15 (7.2%) |
| Total (Category) | 701 (86.8%) | 107 (13.2%) |
| Total (Overall) | 4,602 (53.7%) | 3,963 (46.3%) |
Employment Industries by Sex in Beckham County
Employment Industries in Beckham County
The major employment industries in Beckham County include Mining, Quarrying, & Extraction (1,047 | 12.2%), Health Care & Social Assistance (1,005 | 11.7%), Construction (793 | 9.3%), Educational Services (755 | 8.8%), and Retail Trade (750 | 8.8%).
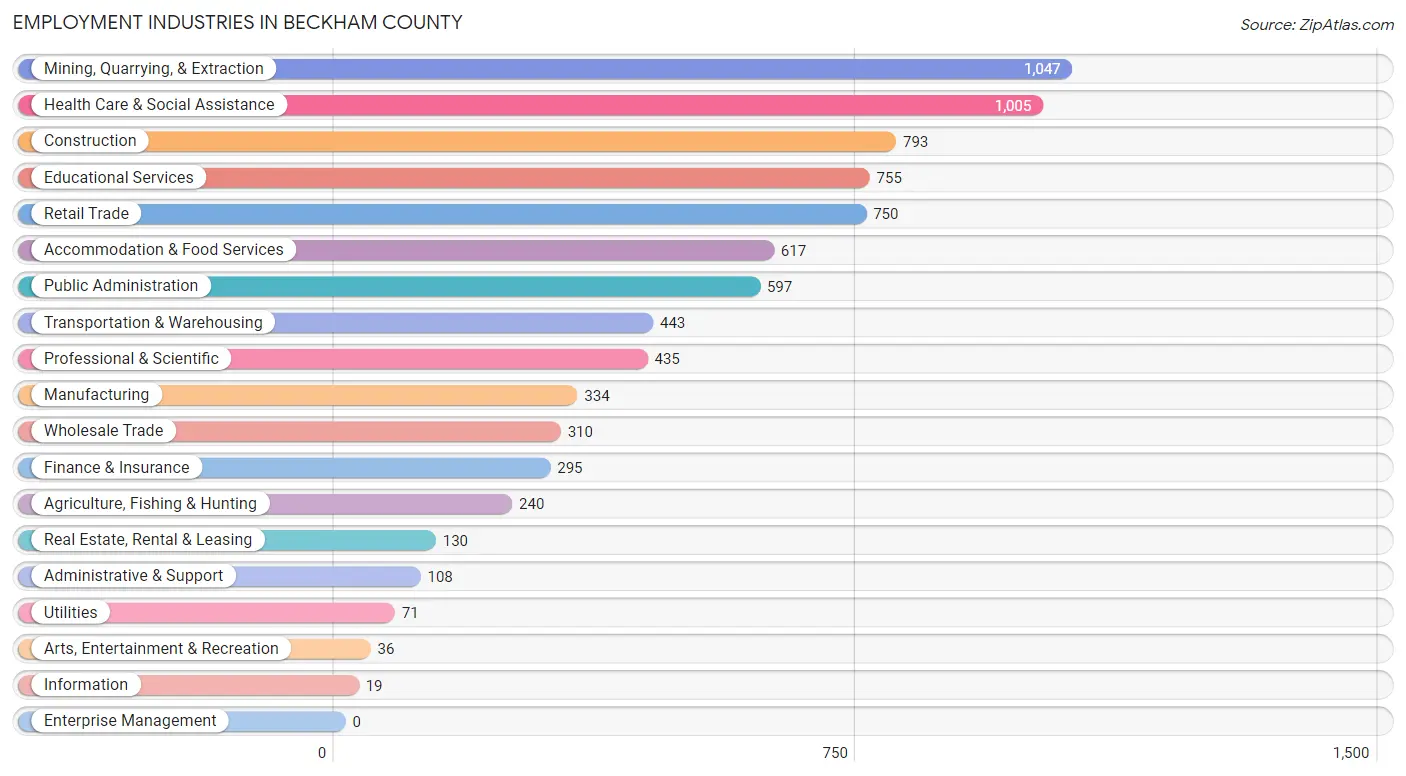
Employment Industries by Sex in Beckham County
The Beckham County industries that see more men than women are Information (100.0%), Construction (97.4%), and Mining, Quarrying, & Extraction (94.4%), whereas the industries that tend to have a higher number of women are Health Care & Social Assistance (80.7%), Accommodation & Food Services (80.5%), and Educational Services (77.5%).
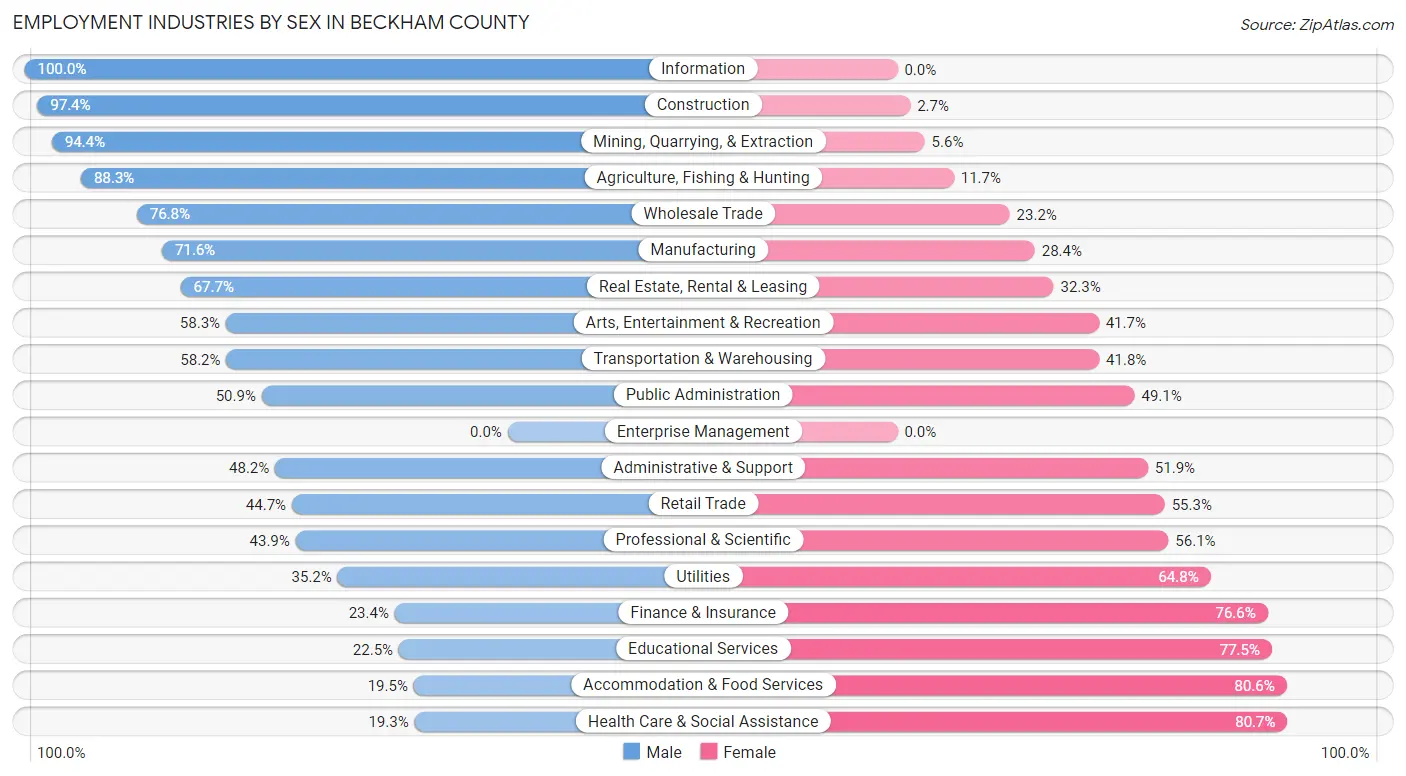
| Industry | Male | Female |
| Agriculture, Fishing & Hunting | 212 (88.3%) | 28 (11.7%) |
| Mining, Quarrying, & Extraction | 988 (94.4%) | 59 (5.6%) |
| Construction | 772 (97.4%) | 21 (2.6%) |
| Manufacturing | 239 (71.6%) | 95 (28.4%) |
| Wholesale Trade | 238 (76.8%) | 72 (23.2%) |
| Retail Trade | 335 (44.7%) | 415 (55.3%) |
| Transportation & Warehousing | 258 (58.2%) | 185 (41.8%) |
| Utilities | 25 (35.2%) | 46 (64.8%) |
| Information | 19 (100.0%) | 0 (0.0%) |
| Finance & Insurance | 69 (23.4%) | 226 (76.6%) |
| Real Estate, Rental & Leasing | 88 (67.7%) | 42 (32.3%) |
| Professional & Scientific | 191 (43.9%) | 244 (56.1%) |
| Enterprise Management | 0 (0.0%) | 0 (0.0%) |
| Administrative & Support | 52 (48.1%) | 56 (51.8%) |
| Educational Services | 170 (22.5%) | 585 (77.5%) |
| Health Care & Social Assistance | 194 (19.3%) | 811 (80.7%) |
| Arts, Entertainment & Recreation | 21 (58.3%) | 15 (41.7%) |
| Accommodation & Food Services | 120 (19.5%) | 497 (80.5%) |
| Public Administration | 304 (50.9%) | 293 (49.1%) |
| Total | 4,602 (53.7%) | 3,963 (46.3%) |
Education in Beckham County
School Enrollment in Beckham County
The most common levels of schooling among the 4,937 students in Beckham County are middle school (1,330 | 26.9%), high school (1,008 | 20.4%), and elementary school (976 | 19.8%).
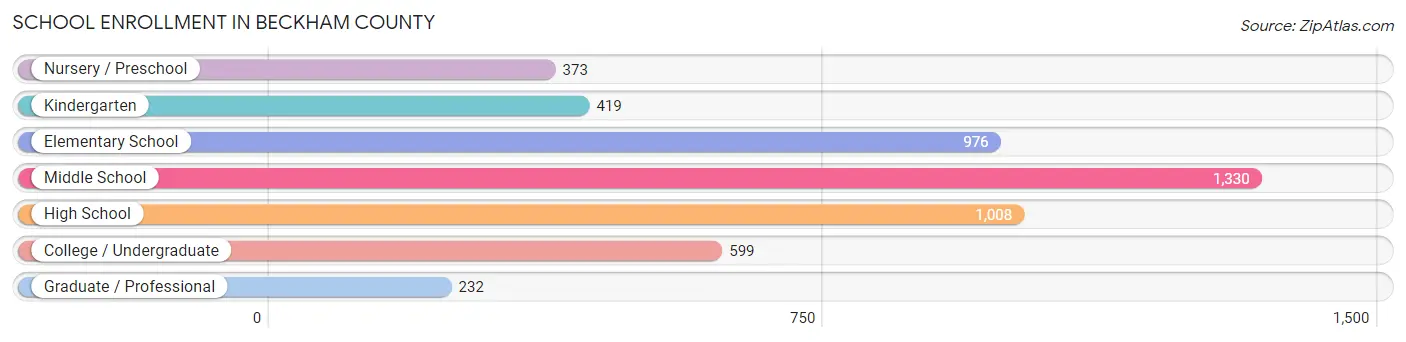
| School Level | # Students | % Students |
| Nursery / Preschool | 373 | 7.6% |
| Kindergarten | 419 | 8.5% |
| Elementary School | 976 | 19.8% |
| Middle School | 1,330 | 26.9% |
| High School | 1,008 | 20.4% |
| College / Undergraduate | 599 | 12.1% |
| Graduate / Professional | 232 | 4.7% |
| Total | 4,937 | 100.0% |
School Enrollment by Age by Funding Source in Beckham County
Out of a total of 4,937 students who are enrolled in schools in Beckham County, 439 (8.9%) attend a private institution, while the remaining 4,498 (91.1%) are enrolled in public schools. The age group of 18 to 19 year olds has the highest likelihood of being enrolled in private schools, with 84 (28.1% in the age bracket) enrolled. Conversely, the age group of 20 to 24 year olds has the lowest likelihood of being enrolled in a private school, with 184 (100.0% in the age bracket) attending a public institution.
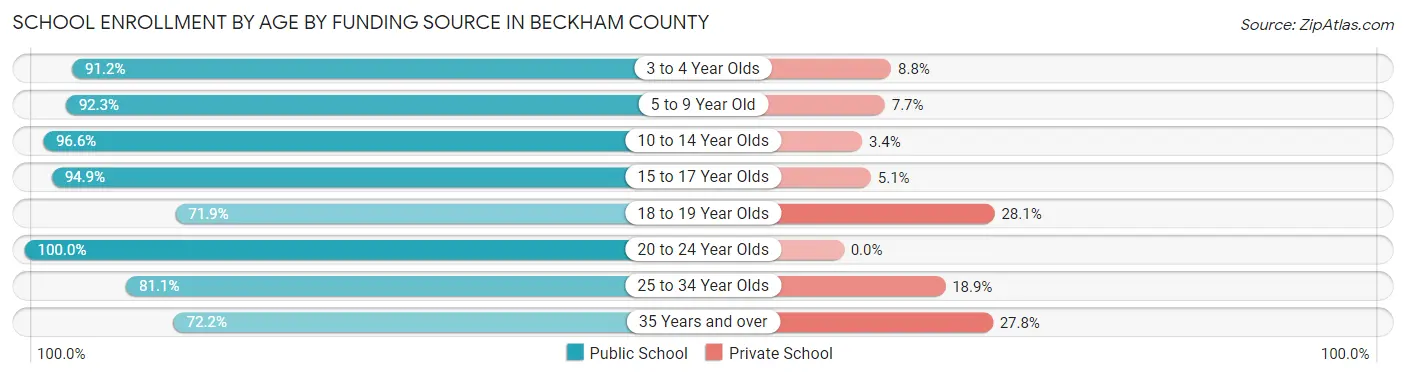
| Age Bracket | Public School | Private School |
| 3 to 4 Year Olds | 165 (91.2%) | 16 (8.8%) |
| 5 to 9 Year Old | 1,339 (92.3%) | 111 (7.7%) |
| 10 to 14 Year Olds | 1,414 (96.6%) | 50 (3.4%) |
| 15 to 17 Year Olds | 676 (94.9%) | 36 (5.1%) |
| 18 to 19 Year Olds | 215 (71.9%) | 84 (28.1%) |
| 20 to 24 Year Olds | 184 (100.0%) | 0 (0.0%) |
| 25 to 34 Year Olds | 326 (81.1%) | 76 (18.9%) |
| 35 Years and over | 177 (72.2%) | 68 (27.8%) |
| Total | 4,498 (91.1%) | 439 (8.9%) |
Educational Attainment by Field of Study in Beckham County
Education (573 | 23.3%), business (538 | 21.8%), science & technology (382 | 15.5%), arts & humanities (209 | 8.5%), and bio, nature & agricultural (193 | 7.8%) are the most common fields of study among 2,462 individuals in Beckham County who have obtained a bachelor's degree or higher.
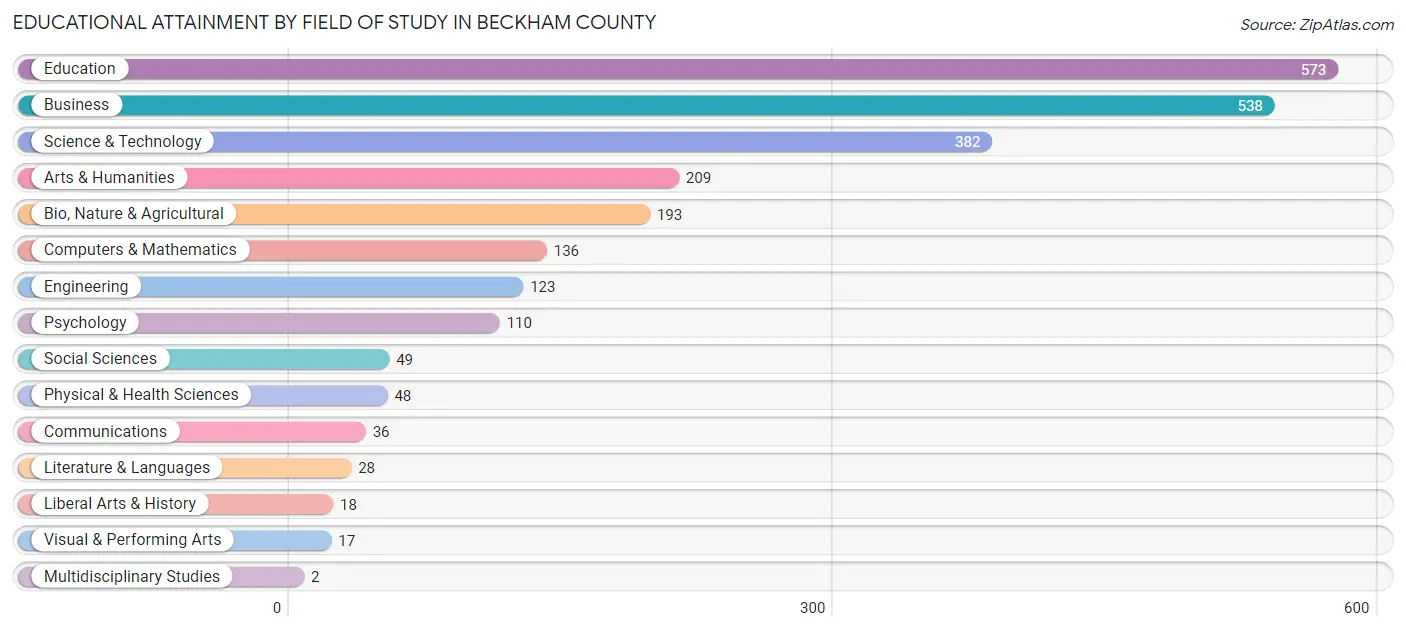
| Field of Study | # Graduates | % Graduates |
| Computers & Mathematics | 136 | 5.5% |
| Bio, Nature & Agricultural | 193 | 7.8% |
| Physical & Health Sciences | 48 | 1.9% |
| Psychology | 110 | 4.5% |
| Social Sciences | 49 | 2.0% |
| Engineering | 123 | 5.0% |
| Multidisciplinary Studies | 2 | 0.1% |
| Science & Technology | 382 | 15.5% |
| Business | 538 | 21.8% |
| Education | 573 | 23.3% |
| Literature & Languages | 28 | 1.1% |
| Liberal Arts & History | 18 | 0.7% |
| Visual & Performing Arts | 17 | 0.7% |
| Communications | 36 | 1.5% |
| Arts & Humanities | 209 | 8.5% |
| Total | 2,462 | 100.0% |
Transportation & Commute in Beckham County
Vehicle Availability by Sex in Beckham County
The most prevalent vehicle ownership categories in Beckham County are males with 2 vehicles (2,263, accounting for 50.8%) and females with 2 vehicles (1,745, making up 59.2%).
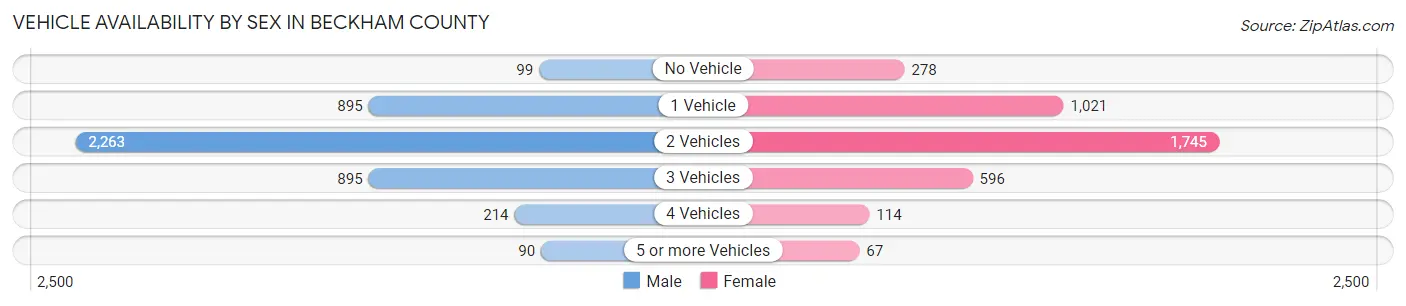
| Vehicles Available | Male | Female |
| No Vehicle | 99 (2.2%) | 278 (7.3%) |
| 1 Vehicle | 895 (20.1%) | 1,021 (26.7%) |
| 2 Vehicles | 2,263 (50.8%) | 1,745 (45.7%) |
| 3 Vehicles | 895 (20.1%) | 596 (15.6%) |
| 4 Vehicles | 214 (4.8%) | 114 (3.0%) |
| 5 or more Vehicles | 90 (2.0%) | 67 (1.8%) |
| Total | 4,456 (100.0%) | 3,821 (100.0%) |
Commute Time in Beckham County
The most frequently occuring commute durations in Beckham County are 5 to 9 minutes (1,789 commuters, 22.3%), 10 to 14 minutes (1,653 commuters, 20.6%), and less than 5 minutes (1,213 commuters, 15.1%).
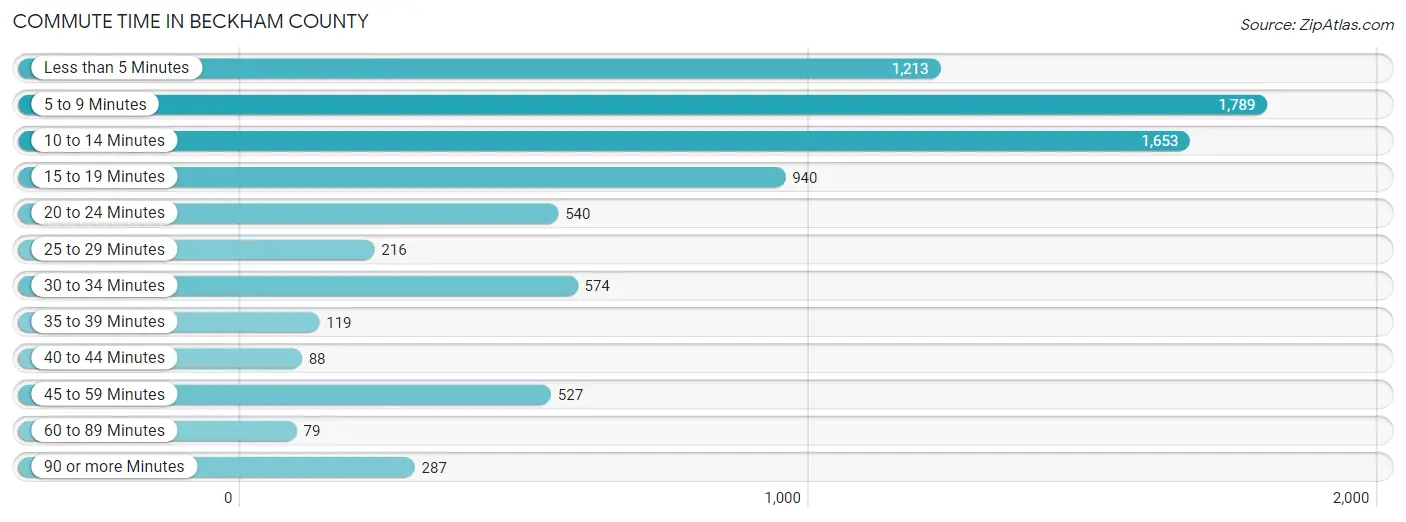
| Commute Time | # Commuters | % Commuters |
| Less than 5 Minutes | 1,213 | 15.1% |
| 5 to 9 Minutes | 1,789 | 22.3% |
| 10 to 14 Minutes | 1,653 | 20.6% |
| 15 to 19 Minutes | 940 | 11.7% |
| 20 to 24 Minutes | 540 | 6.7% |
| 25 to 29 Minutes | 216 | 2.7% |
| 30 to 34 Minutes | 574 | 7.1% |
| 35 to 39 Minutes | 119 | 1.5% |
| 40 to 44 Minutes | 88 | 1.1% |
| 45 to 59 Minutes | 527 | 6.6% |
| 60 to 89 Minutes | 79 | 1.0% |
| 90 or more Minutes | 287 | 3.6% |
Commute Time by Sex in Beckham County
The most common commute times in Beckham County are 5 to 9 minutes (755 commuters, 17.2%) for males and 5 to 9 minutes (1,034 commuters, 28.4%) for females.
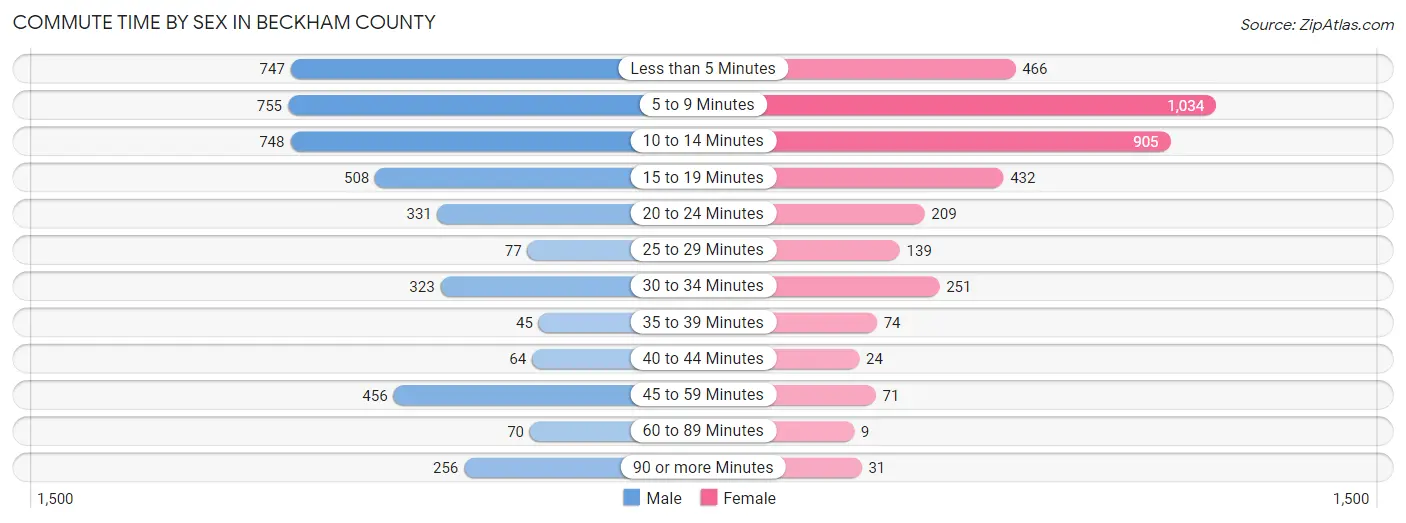
| Commute Time | Male | Female |
| Less than 5 Minutes | 747 (17.1%) | 466 (12.8%) |
| 5 to 9 Minutes | 755 (17.2%) | 1,034 (28.4%) |
| 10 to 14 Minutes | 748 (17.1%) | 905 (24.8%) |
| 15 to 19 Minutes | 508 (11.6%) | 432 (11.8%) |
| 20 to 24 Minutes | 331 (7.6%) | 209 (5.7%) |
| 25 to 29 Minutes | 77 (1.8%) | 139 (3.8%) |
| 30 to 34 Minutes | 323 (7.4%) | 251 (6.9%) |
| 35 to 39 Minutes | 45 (1.0%) | 74 (2.0%) |
| 40 to 44 Minutes | 64 (1.5%) | 24 (0.7%) |
| 45 to 59 Minutes | 456 (10.4%) | 71 (1.9%) |
| 60 to 89 Minutes | 70 (1.6%) | 9 (0.3%) |
| 90 or more Minutes | 256 (5.8%) | 31 (0.9%) |
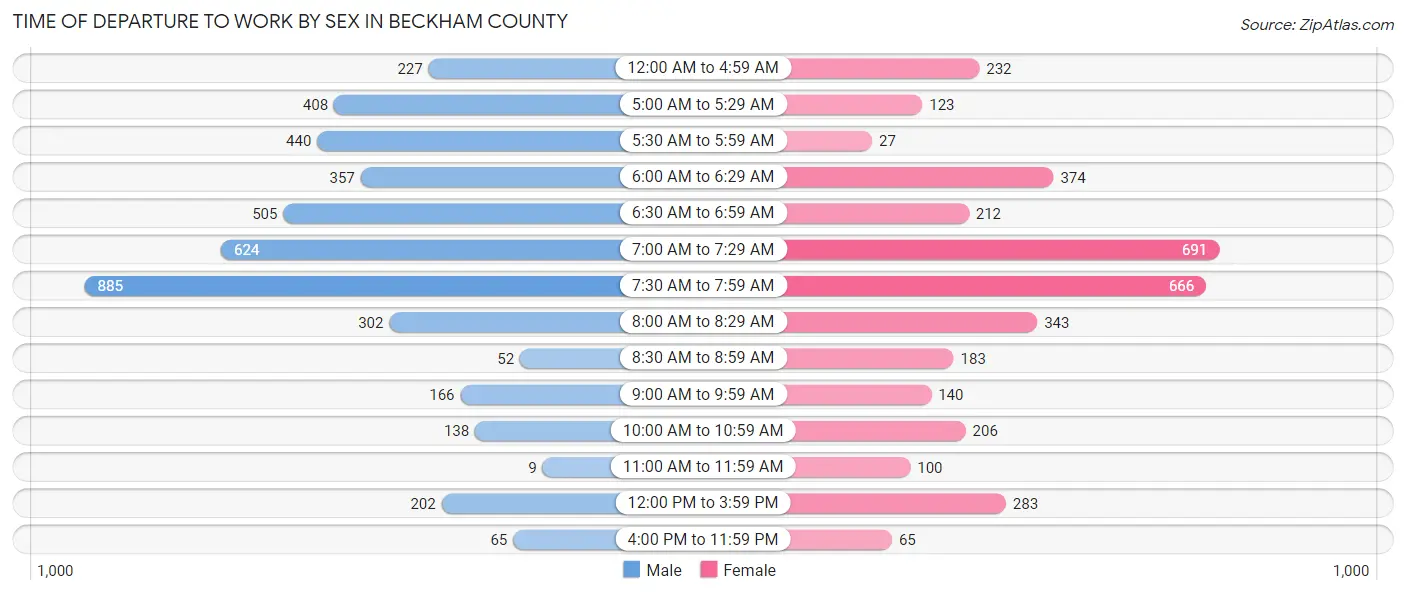
Time of Departure to Work by Sex in Beckham County
The most frequent times of departure to work in Beckham County are 7:30 AM to 7:59 AM (885, 20.2%) for males and 7:00 AM to 7:29 AM (691, 19.0%) for females.
| Time of Departure | Male | Female |
| 12:00 AM to 4:59 AM | 227 (5.2%) | 232 (6.4%) |
| 5:00 AM to 5:29 AM | 408 (9.3%) | 123 (3.4%) |
| 5:30 AM to 5:59 AM | 440 (10.1%) | 27 (0.7%) |
| 6:00 AM to 6:29 AM | 357 (8.2%) | 374 (10.3%) |
| 6:30 AM to 6:59 AM | 505 (11.5%) | 212 (5.8%) |
| 7:00 AM to 7:29 AM | 624 (14.2%) | 691 (19.0%) |
| 7:30 AM to 7:59 AM | 885 (20.2%) | 666 (18.3%) |
| 8:00 AM to 8:29 AM | 302 (6.9%) | 343 (9.4%) |
| 8:30 AM to 8:59 AM | 52 (1.2%) | 183 (5.0%) |
| 9:00 AM to 9:59 AM | 166 (3.8%) | 140 (3.8%) |
| 10:00 AM to 10:59 AM | 138 (3.2%) | 206 (5.7%) |
| 11:00 AM to 11:59 AM | 9 (0.2%) | 100 (2.7%) |
| 12:00 PM to 3:59 PM | 202 (4.6%) | 283 (7.8%) |
| 4:00 PM to 11:59 PM | 65 (1.5%) | 65 (1.8%) |
| Total | 4,380 (100.0%) | 3,645 (100.0%) |
Housing Occupancy in Beckham County
Occupancy by Ownership in Beckham County
Of the total 8,013 dwellings in Beckham County, owner-occupied units account for 5,294 (66.1%), while renter-occupied units make up 2,719 (33.9%).

| Occupancy | # Housing Units | % Housing Units |
| Owner Occupied Housing Units | 5,294 | 66.1% |
| Renter-Occupied Housing Units | 2,719 | 33.9% |
| Total Occupied Housing Units | 8,013 | 100.0% |
Occupancy by Household Size in Beckham County
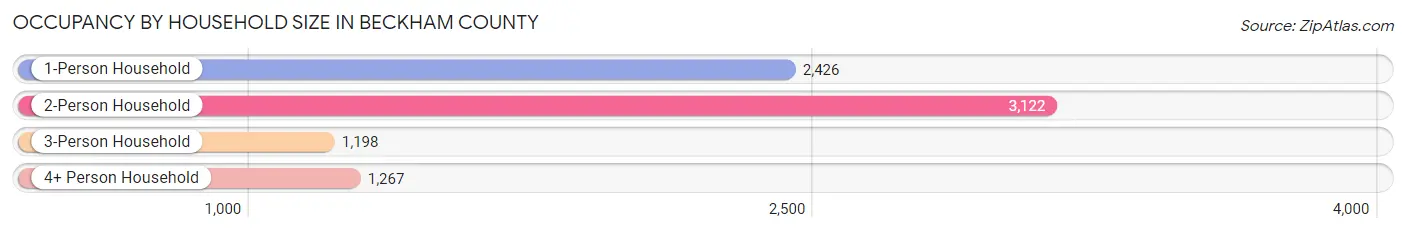
| Household Size | # Housing Units | % Housing Units |
| 1-Person Household | 2,426 | 30.3% |
| 2-Person Household | 3,122 | 39.0% |
| 3-Person Household | 1,198 | 14.9% |
| 4+ Person Household | 1,267 | 15.8% |
| Total Housing Units | 8,013 | 100.0% |
Occupancy by Ownership by Household Size in Beckham County

| Household Size | Owner-occupied | Renter-occupied |
| 1-Person Household | 1,089 (44.9%) | 1,337 (55.1%) |
| 2-Person Household | 2,370 (75.9%) | 752 (24.1%) |
| 3-Person Household | 780 (65.1%) | 418 (34.9%) |
| 4+ Person Household | 1,055 (83.3%) | 212 (16.7%) |
| Total Housing Units | 5,294 (66.1%) | 2,719 (33.9%) |
Occupancy by Educational Attainment in Beckham County
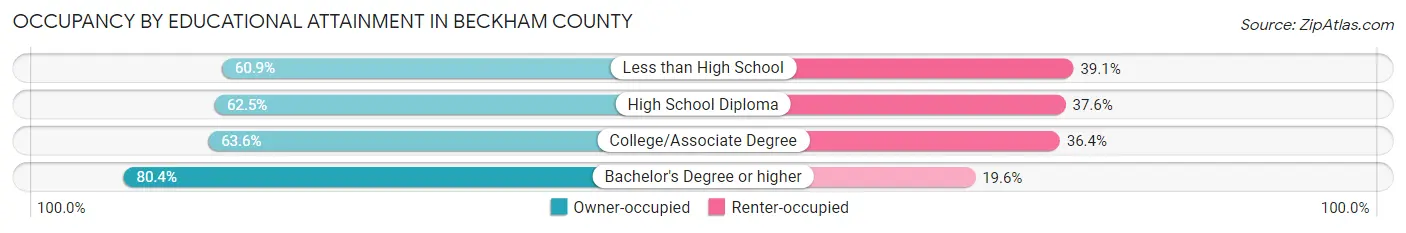
| Household Size | Owner-occupied | Renter-occupied |
| Less than High School | 459 (60.9%) | 295 (39.1%) |
| High School Diploma | 1,816 (62.5%) | 1,092 (37.6%) |
| College/Associate Degree | 1,811 (63.6%) | 1,037 (36.4%) |
| Bachelor's Degree or higher | 1,208 (80.4%) | 295 (19.6%) |
Occupancy by Age of Householder in Beckham County

| Age Bracket | # Households | % Households |
| Under 35 Years | 2,167 | 27.0% |
| 35 to 44 Years | 1,422 | 17.7% |
| 45 to 54 Years | 970 | 12.1% |
| 55 to 64 Years | 1,411 | 17.6% |
| 65 to 74 Years | 1,172 | 14.6% |
| 75 to 84 Years | 689 | 8.6% |
| 85 Years and Over | 182 | 2.3% |
| Total | 8,013 | 100.0% |
Housing Finances in Beckham County
Median Income by Occupancy in Beckham County
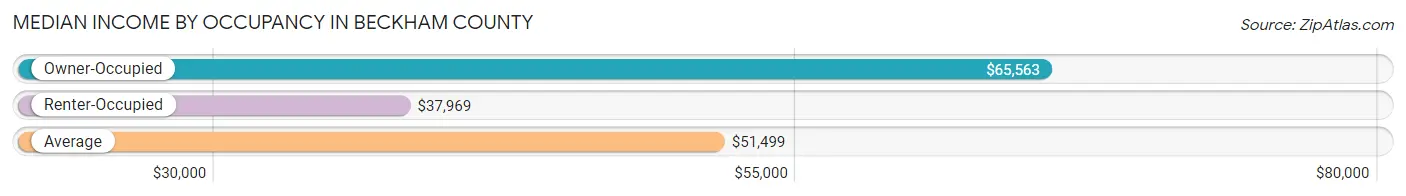
| Occupancy Type | # Households | Median Income |
| Owner-Occupied | 5,294 (66.1%) | $65,563 |
| Renter-Occupied | 2,719 (33.9%) | $37,969 |
| Average | 8,013 (100.0%) | $51,499 |
Occupancy by Householder Income Bracket in Beckham County
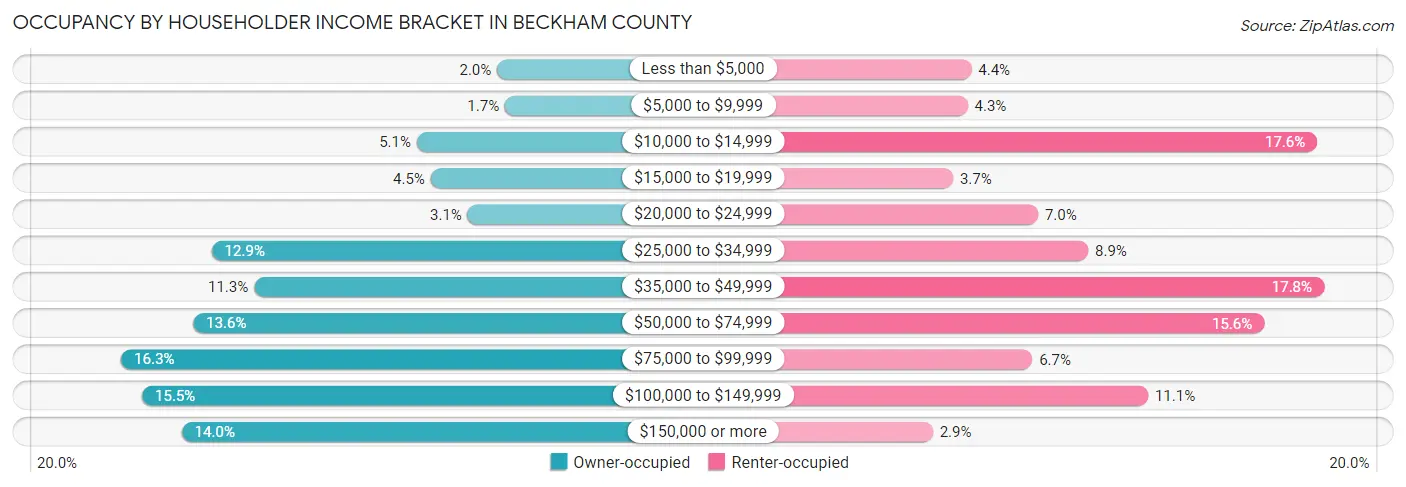
| Income Bracket | Owner-occupied | Renter-occupied |
| Less than $5,000 | 106 (2.0%) | 120 (4.4%) |
| $5,000 to $9,999 | 90 (1.7%) | 116 (4.3%) |
| $10,000 to $14,999 | 268 (5.1%) | 478 (17.6%) |
| $15,000 to $19,999 | 240 (4.5%) | 101 (3.7%) |
| $20,000 to $24,999 | 165 (3.1%) | 189 (7.0%) |
| $25,000 to $34,999 | 682 (12.9%) | 241 (8.9%) |
| $35,000 to $49,999 | 596 (11.3%) | 485 (17.8%) |
| $50,000 to $74,999 | 719 (13.6%) | 423 (15.6%) |
| $75,000 to $99,999 | 864 (16.3%) | 183 (6.7%) |
| $100,000 to $149,999 | 822 (15.5%) | 303 (11.1%) |
| $150,000 or more | 742 (14.0%) | 80 (2.9%) |
| Total | 5,294 (100.0%) | 2,719 (100.0%) |
Monthly Housing Cost Tiers in Beckham County
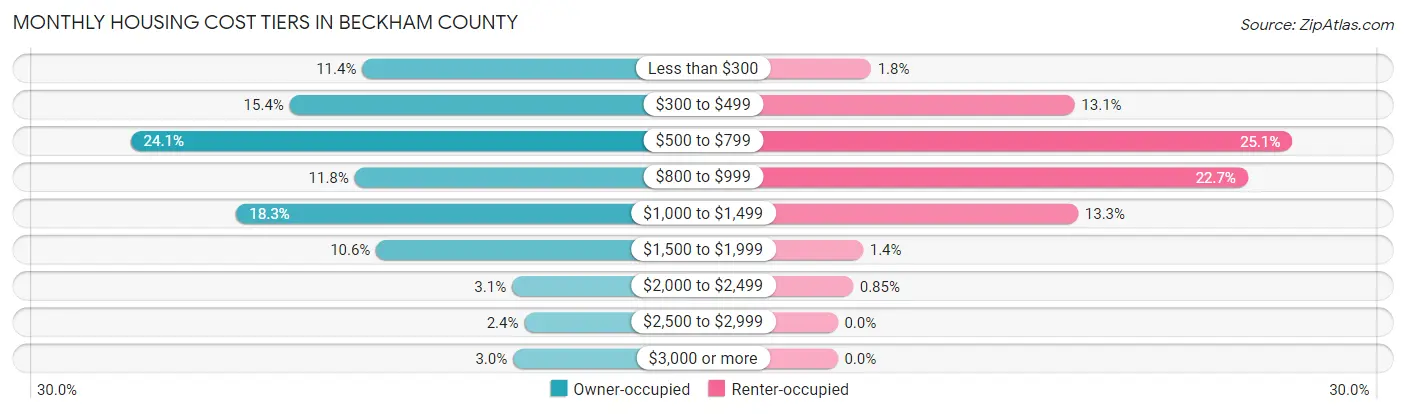
| Monthly Cost | Owner-occupied | Renter-occupied |
| Less than $300 | 601 (11.4%) | 50 (1.8%) |
| $300 to $499 | 813 (15.4%) | 356 (13.1%) |
| $500 to $799 | 1,278 (24.1%) | 683 (25.1%) |
| $800 to $999 | 623 (11.8%) | 616 (22.7%) |
| $1,000 to $1,499 | 969 (18.3%) | 361 (13.3%) |
| $1,500 to $1,999 | 560 (10.6%) | 38 (1.4%) |
| $2,000 to $2,499 | 163 (3.1%) | 23 (0.9%) |
| $2,500 to $2,999 | 127 (2.4%) | 0 (0.0%) |
| $3,000 or more | 160 (3.0%) | 0 (0.0%) |
| Total | 5,294 (100.0%) | 2,719 (100.0%) |
Physical Housing Characteristics in Beckham County
Housing Structures in Beckham County

| Structure Type | # Housing Units | % Housing Units |
| Single Unit, Detached | 5,608 | 70.0% |
| Single Unit, Attached | 209 | 2.6% |
| 2 Unit Apartments | 258 | 3.2% |
| 3 or 4 Unit Apartments | 234 | 2.9% |
| 5 to 9 Unit Apartments | 228 | 2.9% |
| 10 or more Apartments | 256 | 3.2% |
| Mobile Home / Other | 1,220 | 15.2% |
| Total | 8,013 | 100.0% |
Housing Structures by Occupancy in Beckham County
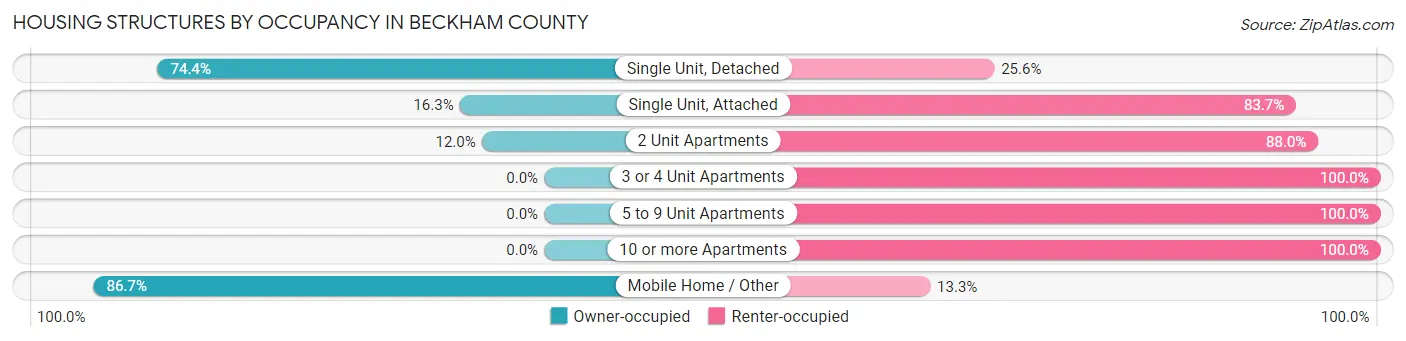
| Structure Type | Owner-occupied | Renter-occupied |
| Single Unit, Detached | 4,171 (74.4%) | 1,437 (25.6%) |
| Single Unit, Attached | 34 (16.3%) | 175 (83.7%) |
| 2 Unit Apartments | 31 (12.0%) | 227 (88.0%) |
| 3 or 4 Unit Apartments | 0 (0.0%) | 234 (100.0%) |
| 5 to 9 Unit Apartments | 0 (0.0%) | 228 (100.0%) |
| 10 or more Apartments | 0 (0.0%) | 256 (100.0%) |
| Mobile Home / Other | 1,058 (86.7%) | 162 (13.3%) |
| Total | 5,294 (66.1%) | 2,719 (33.9%) |
Housing Structures by Number of Rooms in Beckham County
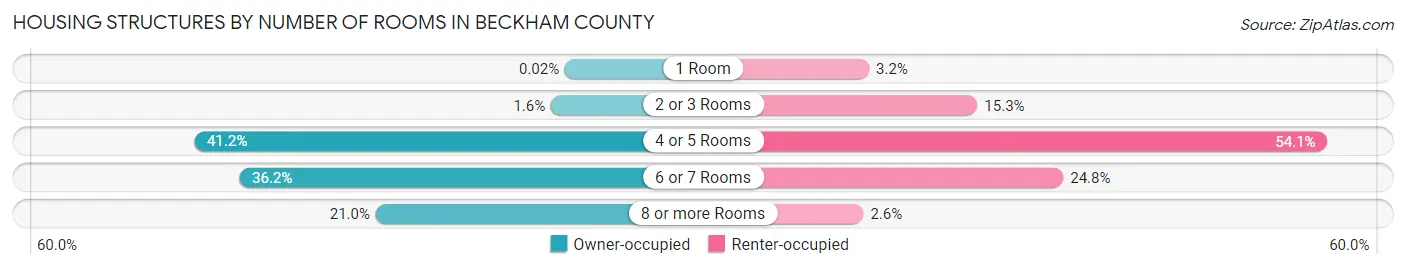
| Number of Rooms | Owner-occupied | Renter-occupied |
| 1 Room | 1 (0.0%) | 88 (3.2%) |
| 2 or 3 Rooms | 83 (1.6%) | 415 (15.3%) |
| 4 or 5 Rooms | 2,181 (41.2%) | 1,471 (54.1%) |
| 6 or 7 Rooms | 1,916 (36.2%) | 674 (24.8%) |
| 8 or more Rooms | 1,113 (21.0%) | 71 (2.6%) |
| Total | 5,294 (100.0%) | 2,719 (100.0%) |
Housing Structure by Heating Type in Beckham County
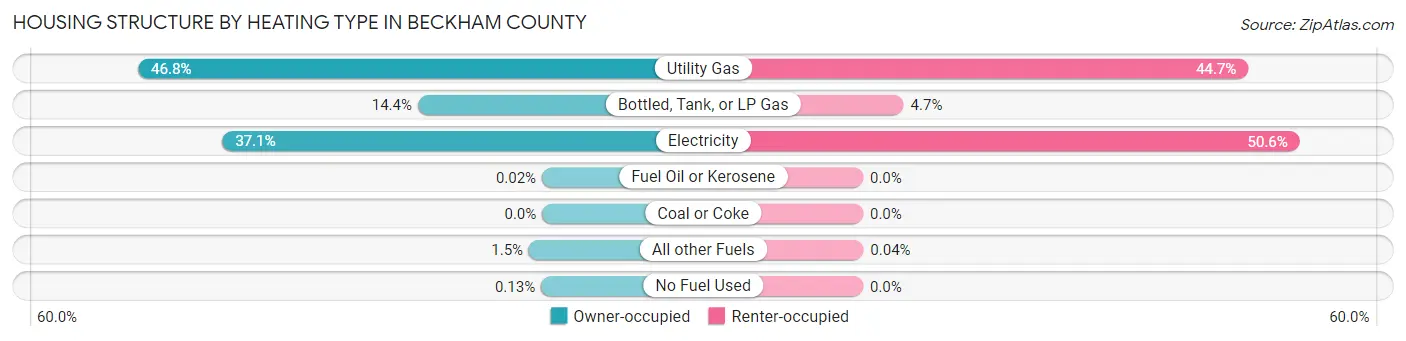
| Heating Type | Owner-occupied | Renter-occupied |
| Utility Gas | 2,479 (46.8%) | 1,214 (44.7%) |
| Bottled, Tank, or LP Gas | 763 (14.4%) | 128 (4.7%) |
| Electricity | 1,963 (37.1%) | 1,376 (50.6%) |
| Fuel Oil or Kerosene | 1 (0.0%) | 0 (0.0%) |
| Coal or Coke | 0 (0.0%) | 0 (0.0%) |
| All other Fuels | 81 (1.5%) | 1 (0.0%) |
| No Fuel Used | 7 (0.1%) | 0 (0.0%) |
| Total | 5,294 (100.0%) | 2,719 (100.0%) |
Household Vehicle Usage in Beckham County
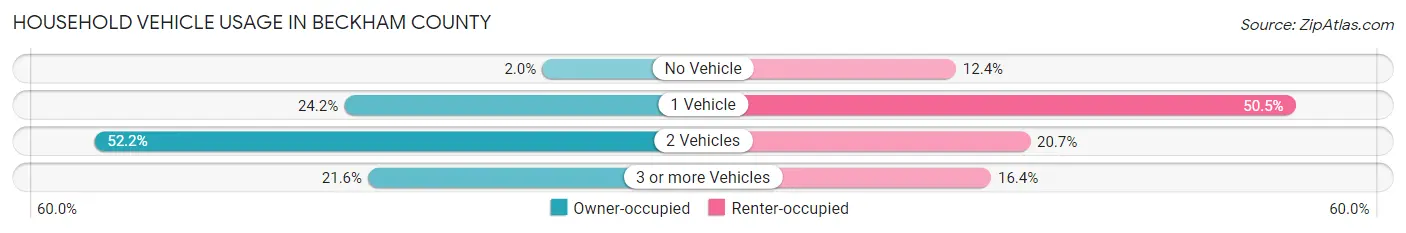
| Vehicles per Household | Owner-occupied | Renter-occupied |
| No Vehicle | 108 (2.0%) | 338 (12.4%) |
| 1 Vehicle | 1,282 (24.2%) | 1,372 (50.5%) |
| 2 Vehicles | 2,763 (52.2%) | 564 (20.7%) |
| 3 or more Vehicles | 1,141 (21.5%) | 445 (16.4%) |
| Total | 5,294 (100.0%) | 2,719 (100.0%) |
Real Estate & Mortgages in Beckham County
Real Estate and Mortgage Overview in Beckham County
| Characteristic | Without Mortgage | With Mortgage |
| Housing Units | 2,913 | 2,381 |
| Median Property Value | $131,700 | $163,300 |
| Median Household Income | $49,111 | $404 |
| Monthly Housing Costs | $510 | $160 |
| Real Estate Taxes | $810 | $21 |
Property Value by Mortgage Status in Beckham County

| Property Value | Without Mortgage | With Mortgage |
| Less than $50,000 | 602 (20.7%) | 113 (4.8%) |
| $50,000 to $99,999 | 582 (20.0%) | 335 (14.1%) |
| $100,000 to $299,999 | 1,367 (46.9%) | 1,571 (66.0%) |
| $300,000 to $499,999 | 279 (9.6%) | 233 (9.8%) |
| $500,000 to $749,999 | 26 (0.9%) | 41 (1.7%) |
| $750,000 to $999,999 | 38 (1.3%) | 60 (2.5%) |
| $1,000,000 or more | 19 (0.6%) | 28 (1.2%) |
| Total | 2,913 (100.0%) | 2,381 (100.0%) |
Household Income by Mortgage Status in Beckham County
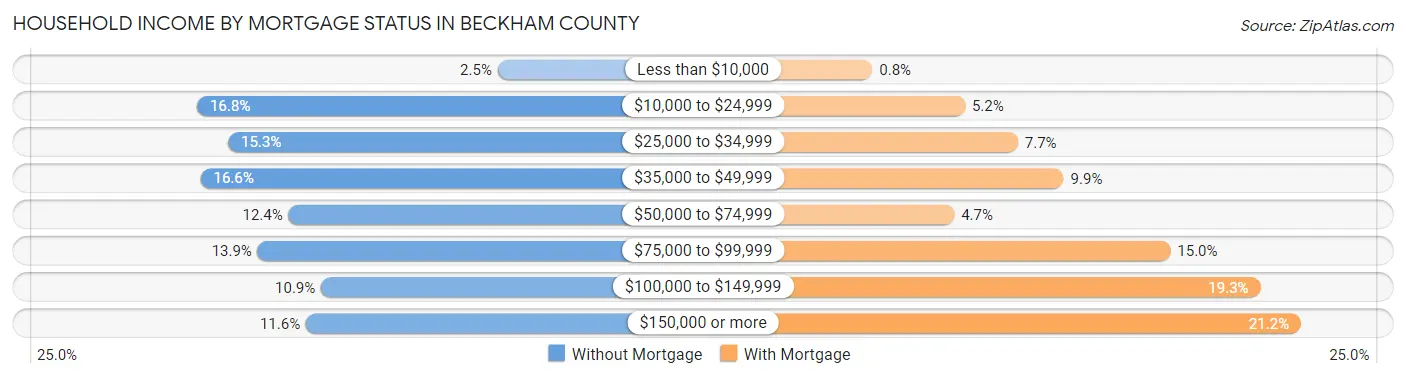
| Household Income | Without Mortgage | With Mortgage |
| Less than $10,000 | 72 (2.5%) | 19 (0.8%) |
| $10,000 to $24,999 | 489 (16.8%) | 124 (5.2%) |
| $25,000 to $34,999 | 446 (15.3%) | 184 (7.7%) |
| $35,000 to $49,999 | 484 (16.6%) | 236 (9.9%) |
| $50,000 to $74,999 | 362 (12.4%) | 112 (4.7%) |
| $75,000 to $99,999 | 405 (13.9%) | 357 (15.0%) |
| $100,000 to $149,999 | 317 (10.9%) | 459 (19.3%) |
| $150,000 or more | 338 (11.6%) | 505 (21.2%) |
| Total | 2,913 (100.0%) | 2,381 (100.0%) |
Property Value to Household Income Ratio in Beckham County
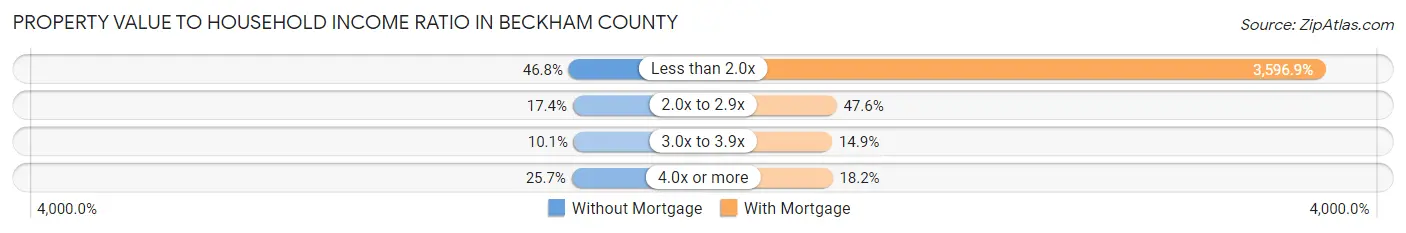
| Value-to-Income Ratio | Without Mortgage | With Mortgage |
| Less than 2.0x | 1,363 (46.8%) | 85,643 (3,596.9%) |
| 2.0x to 2.9x | 506 (17.4%) | 1,133 (47.6%) |
| 3.0x to 3.9x | 295 (10.1%) | 355 (14.9%) |
| 4.0x or more | 749 (25.7%) | 433 (18.2%) |
| Total | 2,913 (100.0%) | 2,381 (100.0%) |
Real Estate Taxes by Mortgage Status in Beckham County
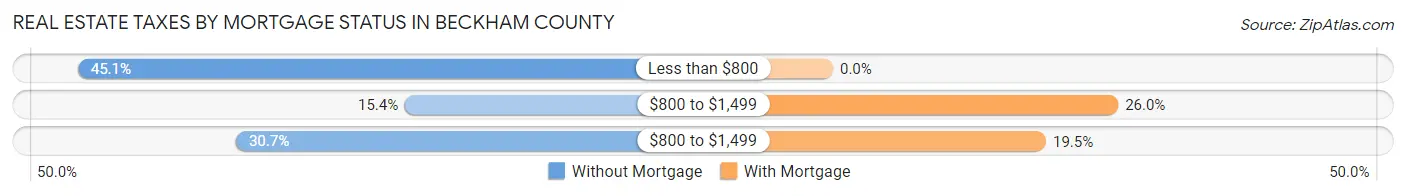
| Property Taxes | Without Mortgage | With Mortgage |
| Less than $800 | 1,315 (45.1%) | 0 (0.0%) |
| $800 to $1,499 | 447 (15.3%) | 620 (26.0%) |
| $800 to $1,499 | 894 (30.7%) | 463 (19.5%) |
| Total | 2,913 (100.0%) | 2,381 (100.0%) |
Health & Disability in Beckham County
Health Insurance Coverage by Age in Beckham County
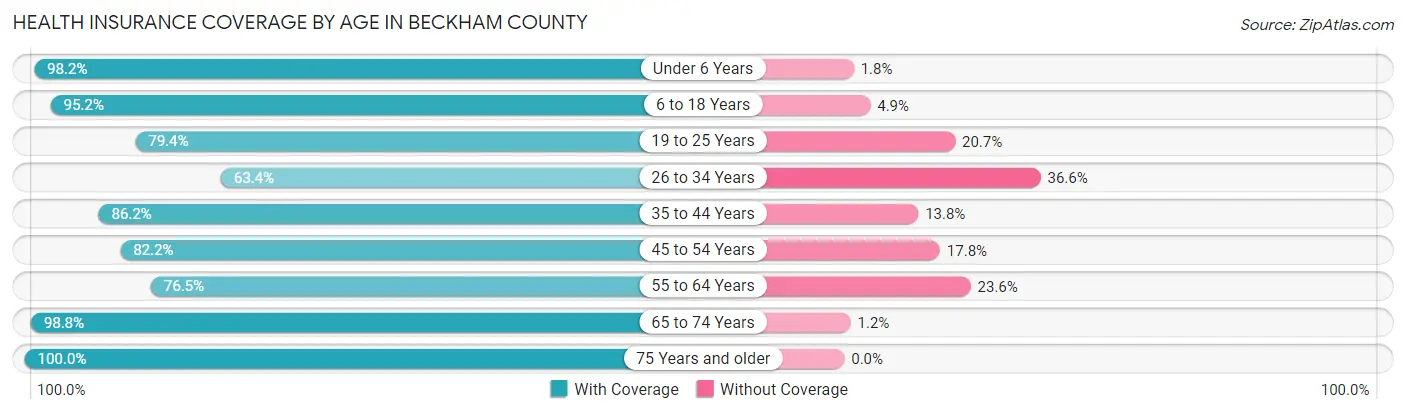
| Age Bracket | With Coverage | Without Coverage |
| Under 6 Years | 1,902 (98.2%) | 34 (1.8%) |
| 6 to 18 Years | 3,316 (95.2%) | 169 (4.9%) |
| 19 to 25 Years | 1,449 (79.3%) | 377 (20.6%) |
| 26 to 34 Years | 1,299 (63.4%) | 750 (36.6%) |
| 35 to 44 Years | 2,184 (86.2%) | 349 (13.8%) |
| 45 to 54 Years | 1,530 (82.2%) | 332 (17.8%) |
| 55 to 64 Years | 1,795 (76.4%) | 553 (23.5%) |
| 65 to 74 Years | 1,669 (98.8%) | 20 (1.2%) |
| 75 Years and older | 1,185 (100.0%) | 0 (0.0%) |
| Total | 16,329 (86.3%) | 2,584 (13.7%) |
Health Insurance Coverage by Citizenship Status in Beckham County
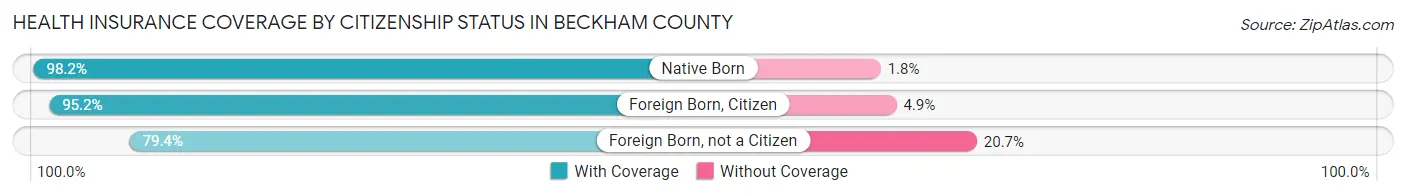
| Citizenship Status | With Coverage | Without Coverage |
| Native Born | 1,902 (98.2%) | 34 (1.8%) |
| Foreign Born, Citizen | 3,316 (95.2%) | 169 (4.9%) |
| Foreign Born, not a Citizen | 1,449 (79.3%) | 377 (20.6%) |
Health Insurance Coverage by Household Income in Beckham County
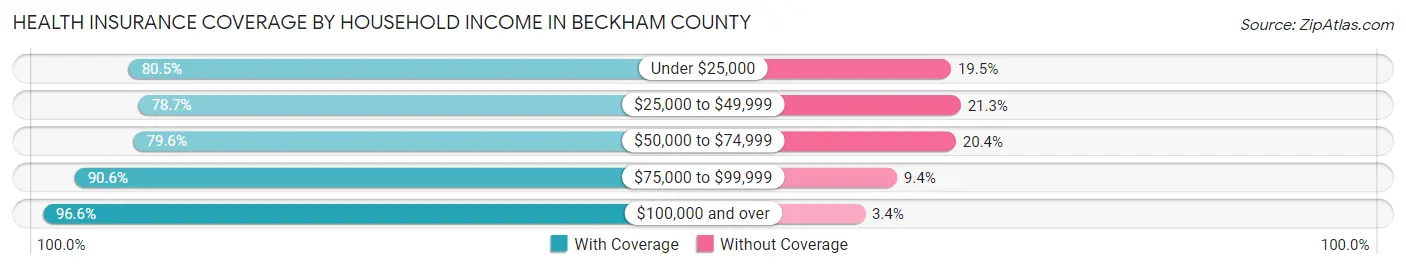
| Household Income | With Coverage | Without Coverage |
| Under $25,000 | 2,577 (80.5%) | 625 (19.5%) |
| $25,000 to $49,999 | 3,204 (78.7%) | 869 (21.3%) |
| $50,000 to $74,999 | 2,286 (79.6%) | 587 (20.4%) |
| $75,000 to $99,999 | 3,117 (90.6%) | 323 (9.4%) |
| $100,000 and over | 5,105 (96.6%) | 180 (3.4%) |
Public vs Private Health Insurance Coverage by Age in Beckham County
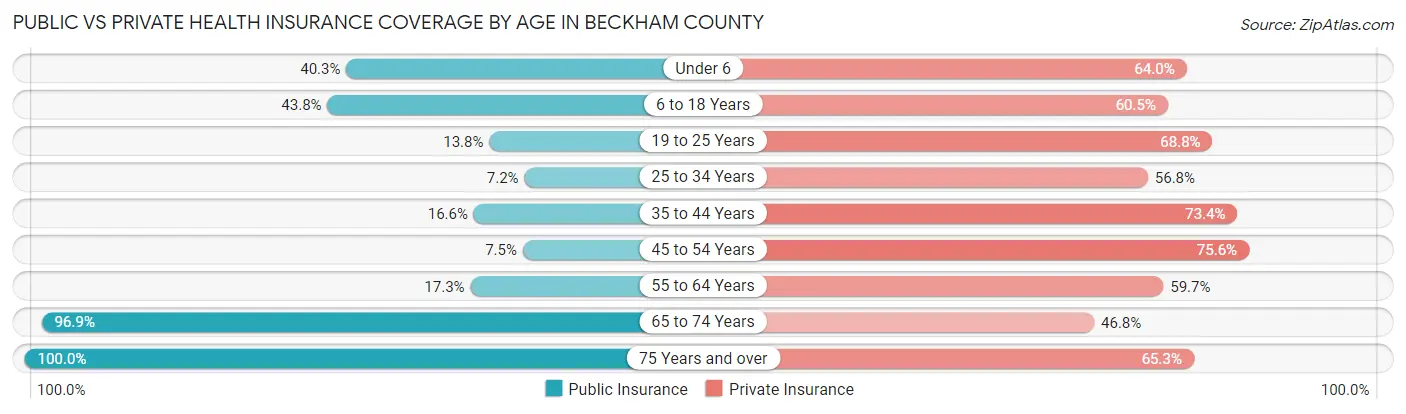
| Age Bracket | Public Insurance | Private Insurance |
| Under 6 | 780 (40.3%) | 1,239 (64.0%) |
| 6 to 18 Years | 1,526 (43.8%) | 2,108 (60.5%) |
| 19 to 25 Years | 251 (13.8%) | 1,256 (68.8%) |
| 25 to 34 Years | 148 (7.2%) | 1,164 (56.8%) |
| 35 to 44 Years | 421 (16.6%) | 1,860 (73.4%) |
| 45 to 54 Years | 140 (7.5%) | 1,407 (75.6%) |
| 55 to 64 Years | 405 (17.2%) | 1,401 (59.7%) |
| 65 to 74 Years | 1,636 (96.9%) | 791 (46.8%) |
| 75 Years and over | 1,185 (100.0%) | 774 (65.3%) |
| Total | 6,492 (34.3%) | 12,000 (63.4%) |
Disability Status by Sex by Age in Beckham County
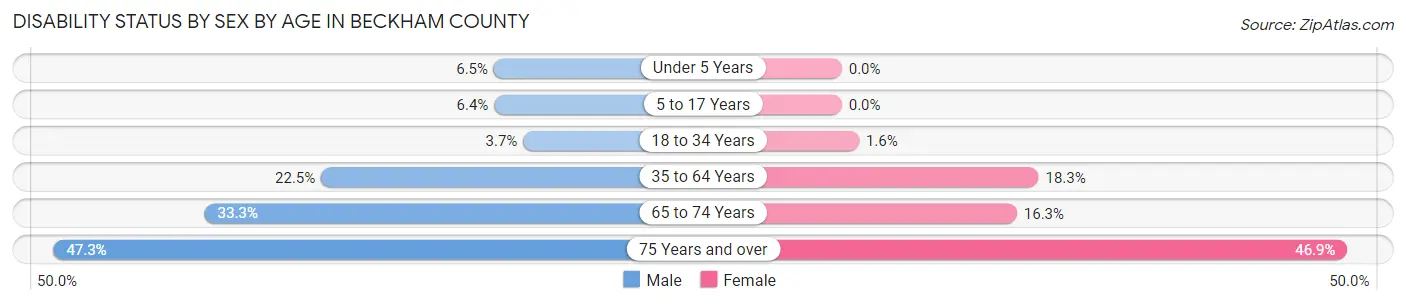
| Age Bracket | Male | Female |
| Under 5 Years | 40 (6.5%) | 0 (0.0%) |
| 5 to 17 Years | 124 (6.4%) | 0 (0.0%) |
| 18 to 34 Years | 82 (3.7%) | 30 (1.6%) |
| 35 to 64 Years | 729 (22.5%) | 639 (18.3%) |
| 65 to 74 Years | 257 (33.3%) | 149 (16.3%) |
| 75 Years and over | 247 (47.3%) | 311 (46.9%) |
Disability Class by Sex by Age in Beckham County
Disability Class: Hearing Difficulty
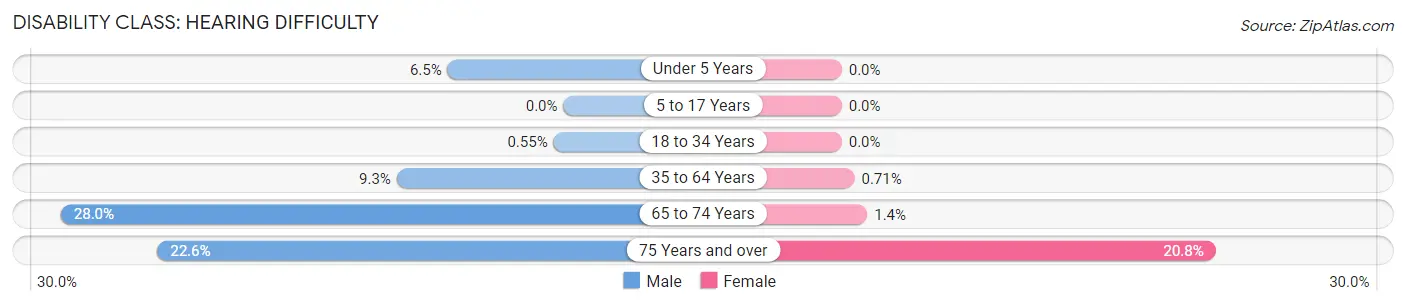
| Age Bracket | Male | Female |
| Under 5 Years | 40 (6.5%) | 0 (0.0%) |
| 5 to 17 Years | 0 (0.0%) | 0 (0.0%) |
| 18 to 34 Years | 12 (0.5%) | 0 (0.0%) |
| 35 to 64 Years | 301 (9.3%) | 25 (0.7%) |
| 65 to 74 Years | 216 (28.0%) | 13 (1.4%) |
| 75 Years and over | 118 (22.6%) | 138 (20.8%) |
Disability Class: Vision Difficulty
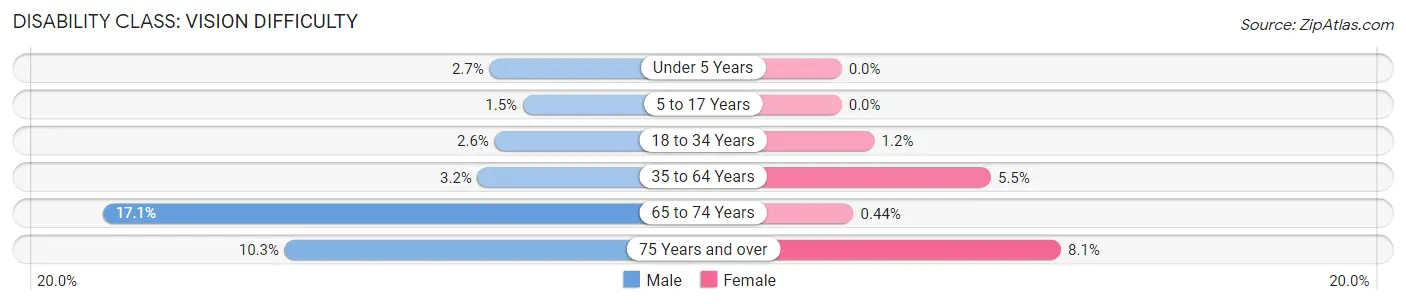
| Age Bracket | Male | Female |
| Under 5 Years | 17 (2.7%) | 0 (0.0%) |
| 5 to 17 Years | 29 (1.5%) | 0 (0.0%) |
| 18 to 34 Years | 56 (2.5%) | 23 (1.2%) |
| 35 to 64 Years | 103 (3.2%) | 194 (5.5%) |
| 65 to 74 Years | 132 (17.1%) | 4 (0.4%) |
| 75 Years and over | 54 (10.3%) | 54 (8.1%) |
Disability Class: Cognitive Difficulty
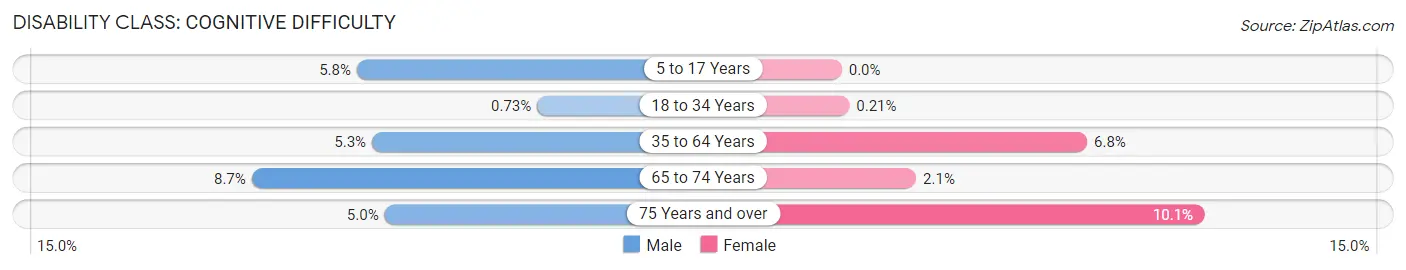
| Age Bracket | Male | Female |
| 5 to 17 Years | 111 (5.8%) | 0 (0.0%) |
| 18 to 34 Years | 16 (0.7%) | 4 (0.2%) |
| 35 to 64 Years | 173 (5.3%) | 239 (6.8%) |
| 65 to 74 Years | 67 (8.7%) | 19 (2.1%) |
| 75 Years and over | 26 (5.0%) | 67 (10.1%) |
Disability Class: Ambulatory Difficulty
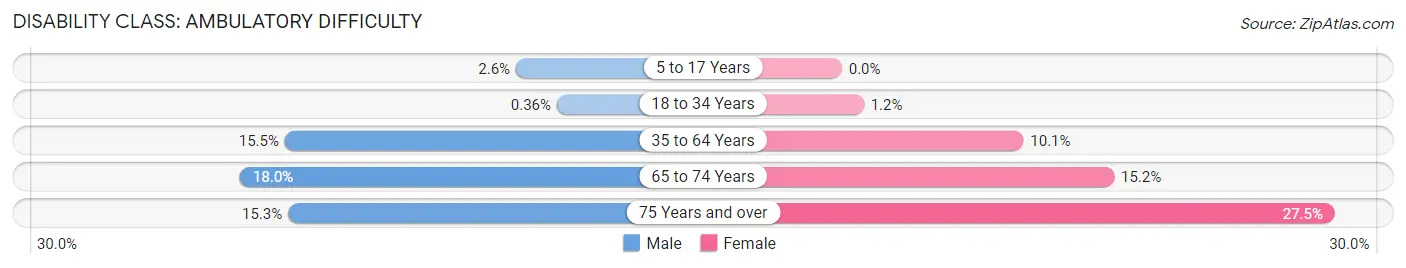
| Age Bracket | Male | Female |
| 5 to 17 Years | 51 (2.6%) | 0 (0.0%) |
| 18 to 34 Years | 8 (0.4%) | 23 (1.2%) |
| 35 to 64 Years | 503 (15.5%) | 354 (10.1%) |
| 65 to 74 Years | 139 (18.0%) | 139 (15.2%) |
| 75 Years and over | 80 (15.3%) | 182 (27.5%) |
Disability Class: Self-Care Difficulty
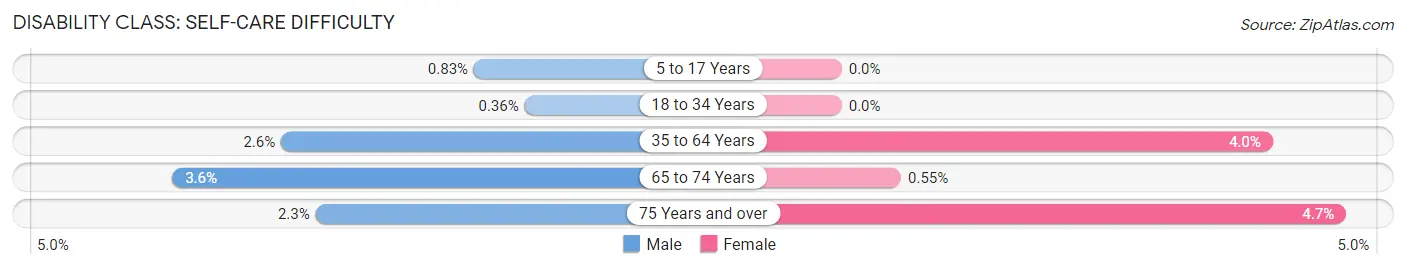
| Age Bracket | Male | Female |
| 5 to 17 Years | 16 (0.8%) | 0 (0.0%) |
| 18 to 34 Years | 8 (0.4%) | 0 (0.0%) |
| 35 to 64 Years | 85 (2.6%) | 140 (4.0%) |
| 65 to 74 Years | 28 (3.6%) | 5 (0.5%) |
| 75 Years and over | 12 (2.3%) | 31 (4.7%) |
Technology Access in Beckham County
Computing Device Access in Beckham County
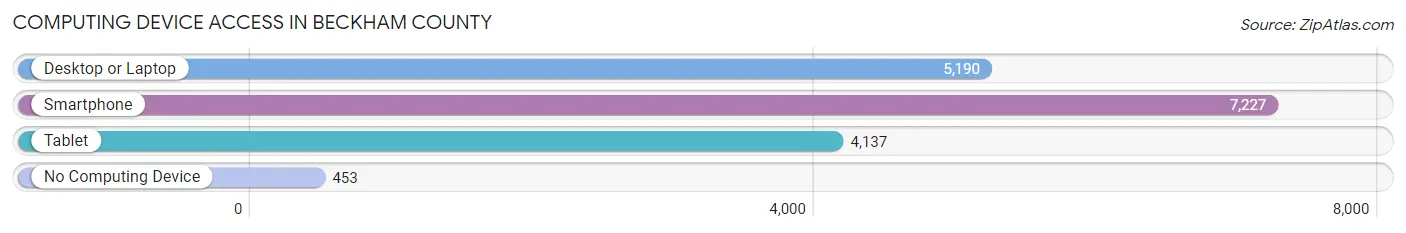
| Device Type | # Households | % Households |
| Desktop or Laptop | 5,190 | 64.8% |
| Smartphone | 7,227 | 90.2% |
| Tablet | 4,137 | 51.6% |
| No Computing Device | 453 | 5.7% |
| Total | 8,013 | 100.0% |
Internet Access in Beckham County
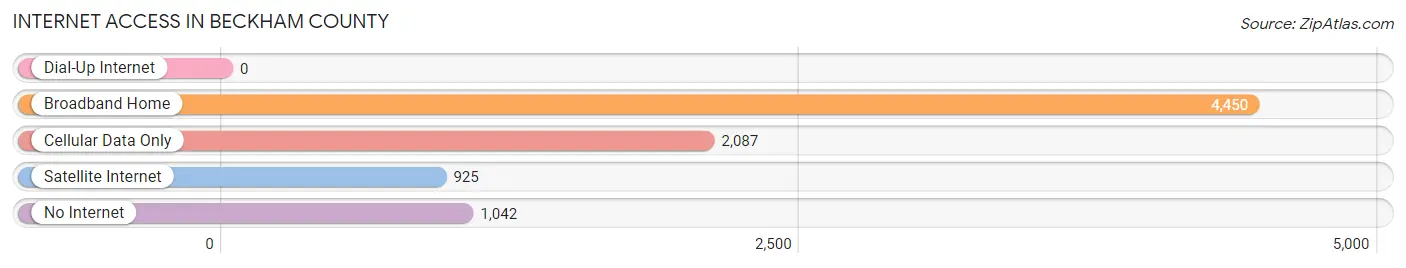
| Internet Type | # Households | % Households |
| Dial-Up Internet | 0 | 0.0% |
| Broadband Home | 4,450 | 55.5% |
| Cellular Data Only | 2,087 | 26.1% |
| Satellite Internet | 925 | 11.5% |
| No Internet | 1,042 | 13.0% |
| Total | 8,013 | 100.0% |
Beckham County Summary
Beckham County is located in the western part of Oklahoma, and is bordered by Roger Mills County to the north, Washita County to the east, Greer County to the south, and Hemphill County, Texas to the west. The county seat is Sayre, and the county was named after J.C.W. Beckham, the Governor of Kentucky from 1900 to 1907. Beckham County covers an area of 1,072 square miles, and has a population of 22,119 people, according to the 2010 census.
Geography
Beckham County is located in the western part of Oklahoma, and is bordered by Roger Mills County to the north, Washita County to the east, Greer County to the south, and Hemphill County, Texas to the west. The county is located in the Red Bed Plains region of Oklahoma, and is characterized by flat to rolling terrain, with elevations ranging from 1,400 to 2,000 feet above sea level. The county is drained by the North Canadian River, which flows through the county from north to south. The county is also home to several small lakes, including Lake Sayre, Lake Elmer Thomas, and Lake Merritt.
Economy
The economy of Beckham County is largely based on agriculture, with wheat, sorghum, and hay being the primary crops. The county is also home to several oil and gas fields, and the county’s economy is further bolstered by the presence of several manufacturing plants, including a plant that produces oilfield equipment. The county is also home to several retail stores, restaurants, and other businesses.
Demographics
According to the 2010 census, Beckham County had a population of 22,119 people, with a population density of 20.6 people per square mile. The racial makeup of the county was 87.3% White, 8.2% Native American, 0.7% Black or African American, 0.3% Asian, 0.1% Pacific Islander, 1.2% from other races, and 2.4% from two or more races. Hispanic or Latino of any race were 3.2% of the population.
The median income for a household in the county was $35,945, and the median income for a family was $41,945. The per capita income for the county was $17,845. About 16.2% of families and 19.7% of the population were below the poverty line, including 25.2% of those under age 18 and 11.7% of those age 65 or over.
History
Beckham County was created in 1907 from parts of Roger Mills and Washita Counties. The county was named after J.C.W. Beckham, the Governor of Kentucky from 1900 to 1907. The county seat was originally located in the town of Erick, but was moved to Sayre in 1910.
In the early 20th century, Beckham County was largely an agricultural county, with wheat, sorghum, and hay being the primary crops. The county was also home to several oil and gas fields, and the county’s economy was further bolstered by the presence of several manufacturing plants, including a plant that produces oilfield equipment.
In the late 20th century, Beckham County experienced a population boom, with the population increasing from 15,000 in 1990 to 22,119 in 2010. The county is now home to several retail stores, restaurants, and other businesses, and is a popular destination for tourists and outdoor enthusiasts.
Common Questions
What is the Total Population of Beckham County?
Total Population of Beckham County is 22,295.
What is the Total Male Population of Beckham County?
Total Male Population of Beckham County is 12,565.
What is the Total Female Population of Beckham County?
Total Female Population of Beckham County is 9,730.
What is the Ratio of Males per 100 Females in Beckham County?
There are 129.14 Males per 100 Females in Beckham County.
What is the Ratio of Females per 100 Males in Beckham County?
There are 77.44 Females per 100 Males in Beckham County.
What is the Median Population Age in Beckham County?
Median Population Age in Beckham County is 36.3 Years.
What is the Average Family Size in Beckham County
Average Family Size in Beckham County is 2.9 People.
What is the Average Household Size in Beckham County
Average Household Size in Beckham County is 2.4 People.
What is Per Capita Income in Beckham County?
Per Capita income in Beckham County is $26,231.
What is the Median Family Income in Beckham County?
Median Family Income in Beckham County is $75,024.
What is the Median Household income in Beckham County?
Median Household Income in Beckham County is $51,499.
What is Income or Wage Gap in Beckham County?
Income or Wage Gap in Beckham County is 39.2%.
Women in Beckham County earn 60.8 cents for every dollar earned by a man.
What is Family Income Deficit in Beckham County?
Family Income Deficit in Beckham County is $14,275.
Families that are below poverty line in Beckham County earn $14,275 less on average than the poverty threshold level.
What is Inequality or Gini Index in Beckham County?
Inequality or Gini Index in Beckham County is 0.46.
How Large is the Labor Force in Beckham County?
There are 9,119 People in the Labor Forcein in Beckham County.
What is the Percentage of People in the Labor Force in Beckham County?
51.5% of People are in the Labor Force in Beckham County.
What is the Unemployment Rate in Beckham County?
Unemployment Rate in Beckham County is 6.2%.