Zip Codes with the Highest Percentage of Population Employed in Life, Physical & Social Science in Massillon, OH
RELATED REPORTS & OPTIONS
Life, Physical & Social Science
Massillon
Compare Zip Codes
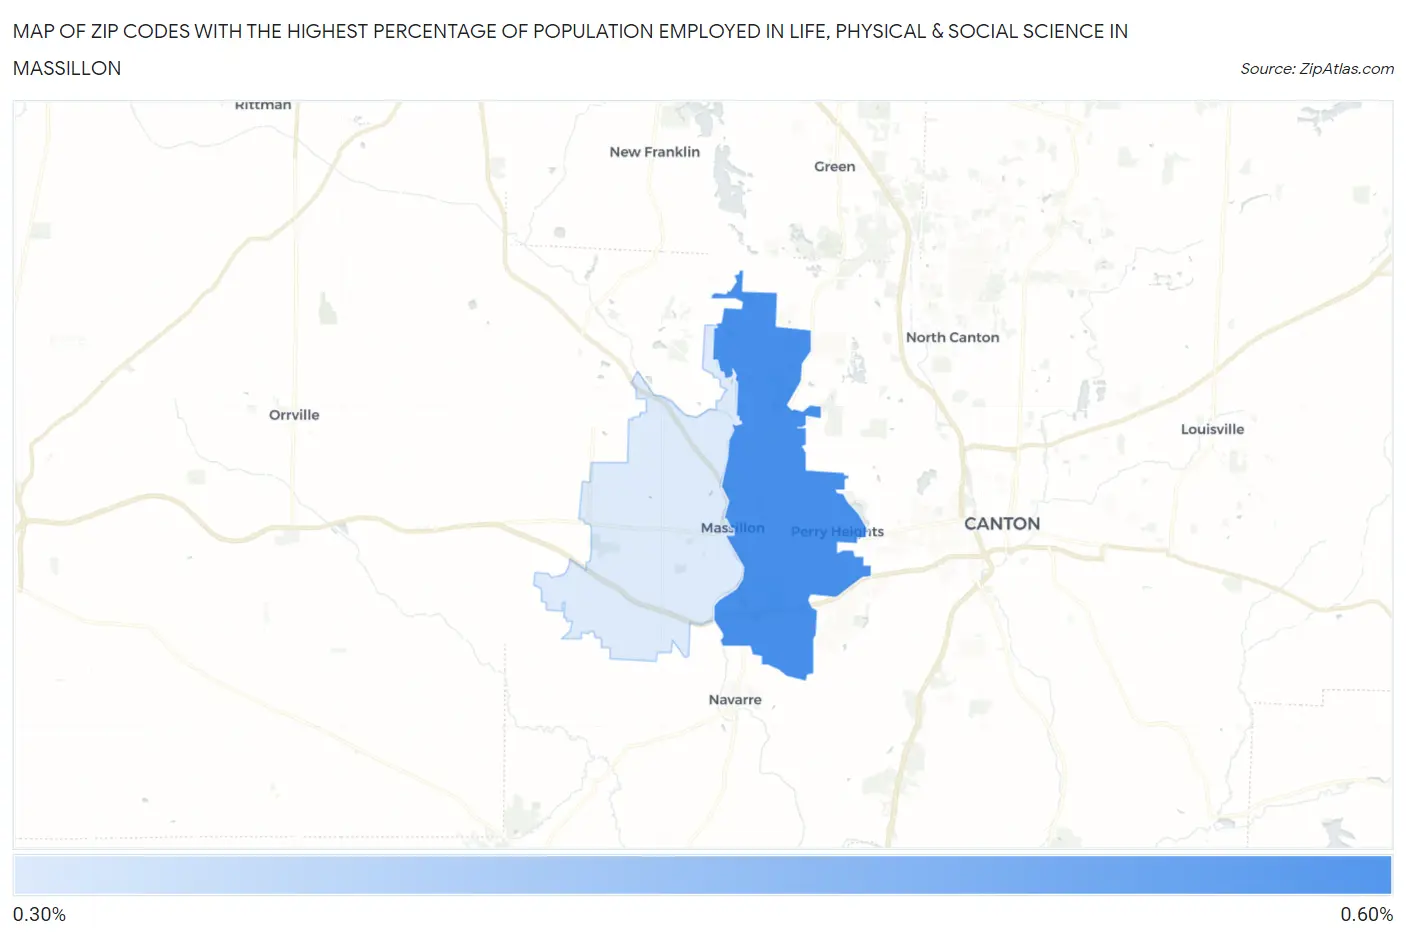
Map of Zip Codes with the Highest Percentage of Population Employed in Life, Physical & Social Science in Massillon
0.0%
0.60%
Zip Codes with the Highest Percentage of Population Employed in Life, Physical & Social Science in Massillon, OH
| Zip Code | % Employed | vs State | vs National | |
| 1. | 44646 | 0.55% | 0.90%(-0.350)#441 | 1.1%(-0.543)#13,934 |
| 2. | 44647 | 0.33% | 0.90%(-0.564)#544 | 1.1%(-0.758)#16,630 |
1
Common Questions
What are the Top Zip Codes with the Highest Percentage of Population Employed in Life, Physical & Social Science in Massillon, OH?
Top Zip Codes with the Highest Percentage of Population Employed in Life, Physical & Social Science in Massillon, OH are:
What zip code has the Highest Percentage of Population Employed in Life, Physical & Social Science in Massillon, OH?
44646 has the Highest Percentage of Population Employed in Life, Physical & Social Science in Massillon, OH with 0.55%.
What is the Percentage of Population Employed in Life, Physical & Social Science in Massillon, OH?
Percentage of Population Employed in Life, Physical & Social Science in Massillon is 0.39%.
What is the Percentage of Population Employed in Life, Physical & Social Science in Ohio?
Percentage of Population Employed in Life, Physical & Social Science in Ohio is 0.90%.
What is the Percentage of Population Employed in Life, Physical & Social Science in the United States?
Percentage of Population Employed in Life, Physical & Social Science in the United States is 1.1%.