Zip Codes with the Highest Percentage of Population Employed in Arts, Media & Entertainment in Massillon, OH
RELATED REPORTS & OPTIONS
Arts, Media & Entertainment
Massillon
Compare Zip Codes
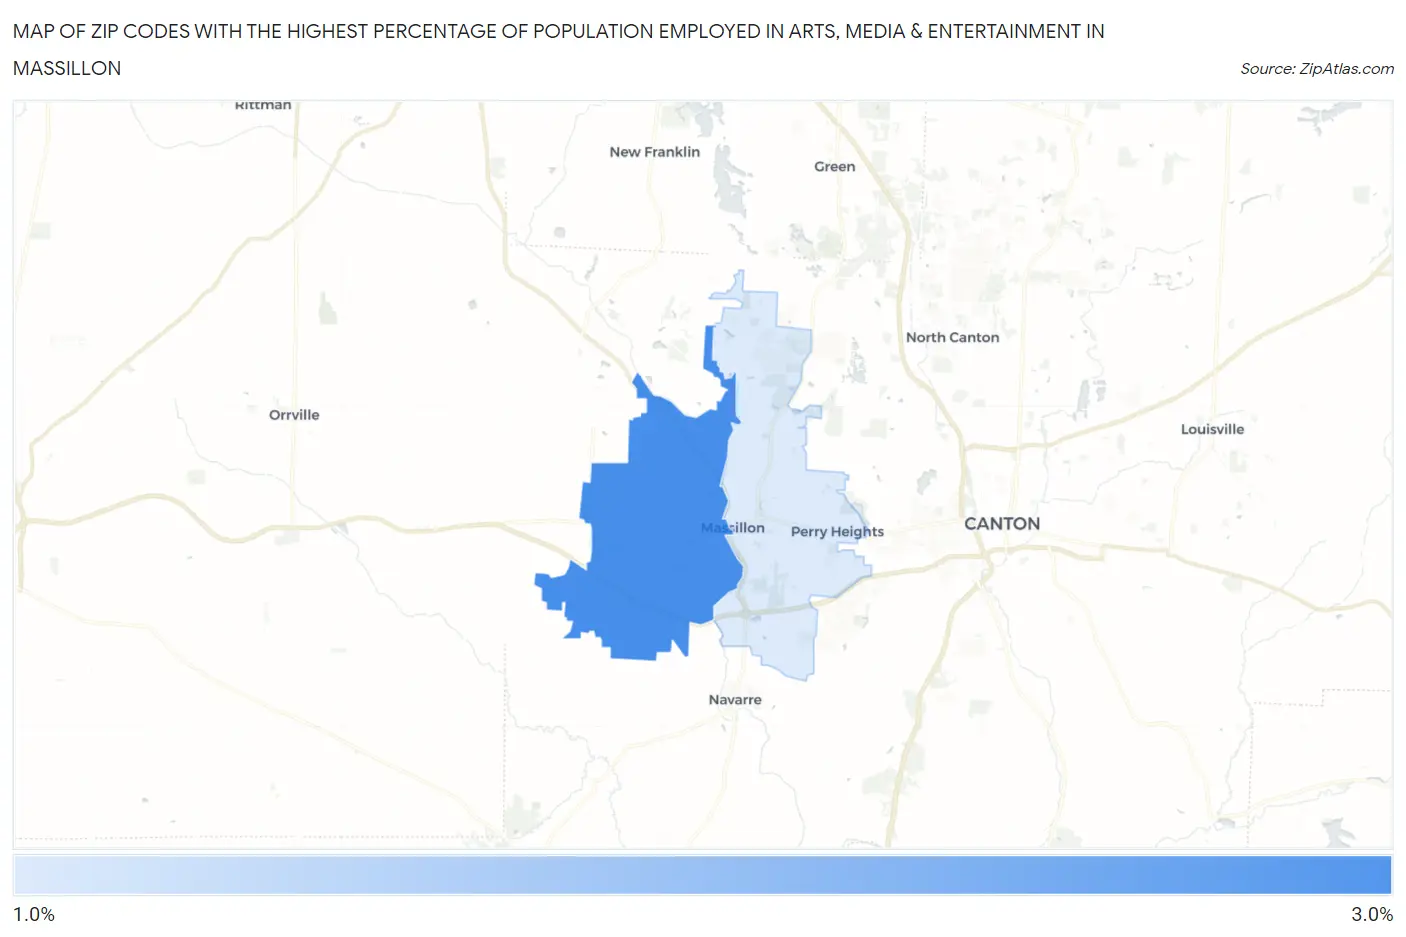
Map of Zip Codes with the Highest Percentage of Population Employed in Arts, Media & Entertainment in Massillon
0.0%
3.0%
Zip Codes with the Highest Percentage of Population Employed in Arts, Media & Entertainment in Massillon, OH
| Zip Code | % Employed | vs State | vs National | |
| 1. | 44647 | 2.6% | 1.6%(+1.08)#115 | 2.1%(+0.573)#5,119 |
| 2. | 44646 | 1.4% | 1.6%(-0.195)#382 | 2.1%(-0.704)#12,030 |
1
Common Questions
What are the Top Zip Codes with the Highest Percentage of Population Employed in Arts, Media & Entertainment in Massillon, OH?
Top Zip Codes with the Highest Percentage of Population Employed in Arts, Media & Entertainment in Massillon, OH are:
What zip code has the Highest Percentage of Population Employed in Arts, Media & Entertainment in Massillon, OH?
44647 has the Highest Percentage of Population Employed in Arts, Media & Entertainment in Massillon, OH with 2.6%.
What is the Percentage of Population Employed in Arts, Media & Entertainment in Massillon, OH?
Percentage of Population Employed in Arts, Media & Entertainment in Massillon is 0.95%.
What is the Percentage of Population Employed in Arts, Media & Entertainment in Ohio?
Percentage of Population Employed in Arts, Media & Entertainment in Ohio is 1.6%.
What is the Percentage of Population Employed in Arts, Media & Entertainment in the United States?
Percentage of Population Employed in Arts, Media & Entertainment in the United States is 2.1%.