Zip Codes with the Highest Percentage of Population Employed in Legal Services & Support in Massillon, OH
RELATED REPORTS & OPTIONS
Legal Services & Support
Massillon
Compare Zip Codes
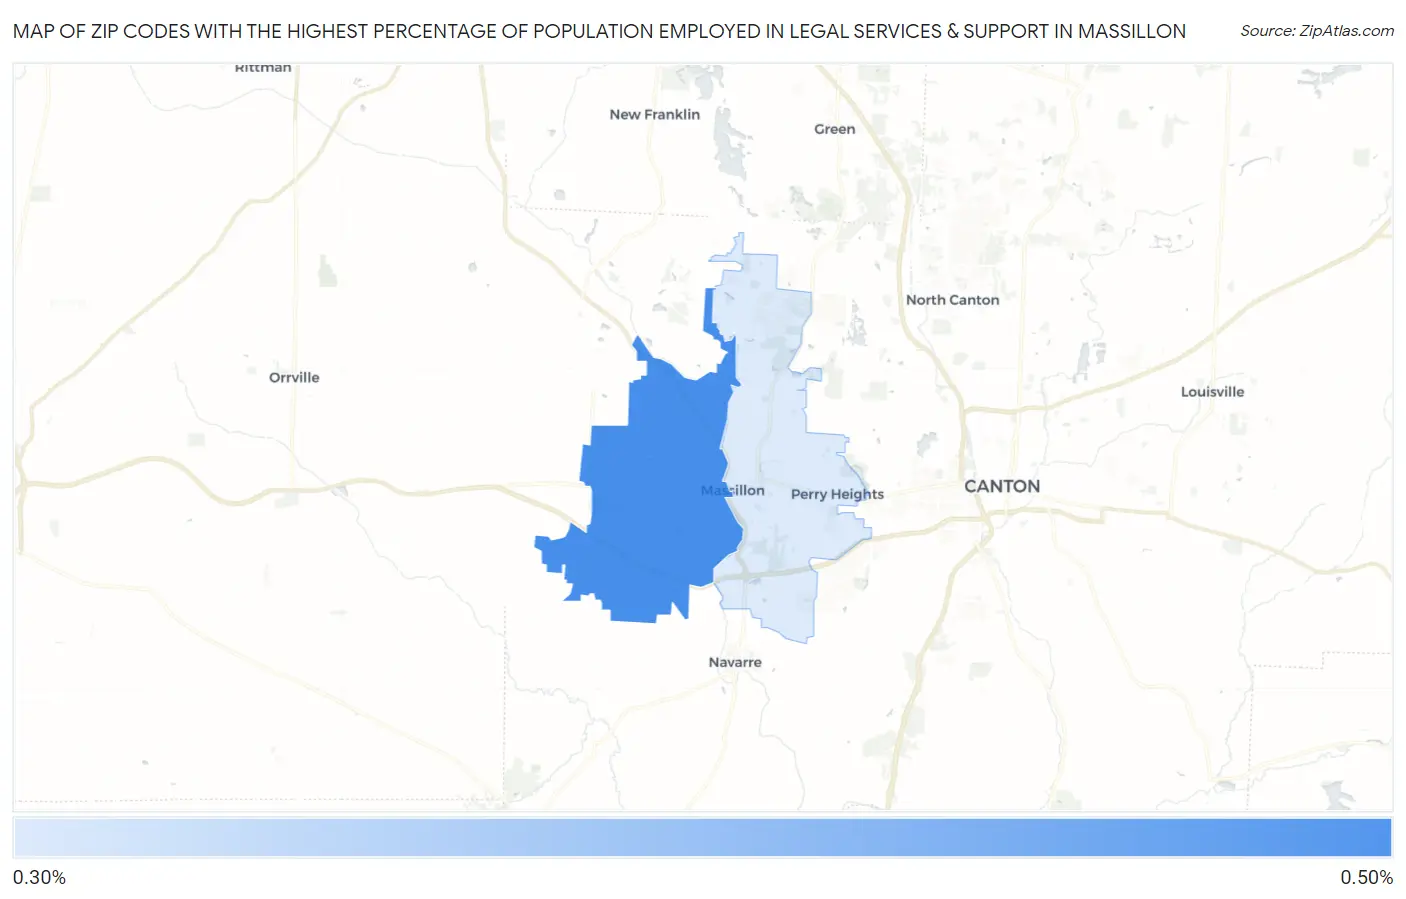
Map of Zip Codes with the Highest Percentage of Population Employed in Legal Services & Support in Massillon
0.0%
0.50%
Zip Codes with the Highest Percentage of Population Employed in Legal Services & Support in Massillon, OH
| Zip Code | % Employed | vs State | vs National | |
| 1. | 44647 | 0.41% | 0.92%(-0.516)#469 | 1.2%(-0.775)#13,756 |
| 2. | 44646 | 0.33% | 0.92%(-0.592)#507 | 1.2%(-0.851)#14,664 |
1
Common Questions
What are the Top Zip Codes with the Highest Percentage of Population Employed in Legal Services & Support in Massillon, OH?
Top Zip Codes with the Highest Percentage of Population Employed in Legal Services & Support in Massillon, OH are:
What zip code has the Highest Percentage of Population Employed in Legal Services & Support in Massillon, OH?
44647 has the Highest Percentage of Population Employed in Legal Services & Support in Massillon, OH with 0.41%.
What is the Percentage of Population Employed in Legal Services & Support in Massillon, OH?
Percentage of Population Employed in Legal Services & Support in Massillon is 0.38%.
What is the Percentage of Population Employed in Legal Services & Support in Ohio?
Percentage of Population Employed in Legal Services & Support in Ohio is 0.92%.
What is the Percentage of Population Employed in Legal Services & Support in the United States?
Percentage of Population Employed in Legal Services & Support in the United States is 1.2%.