Zip Codes with the Highest Percentage of Population Taking Taxi / Cab to Work in Massillon, OH
RELATED REPORTS & OPTIONS
Taxi / Cab
Massillon
Compare Zip Codes
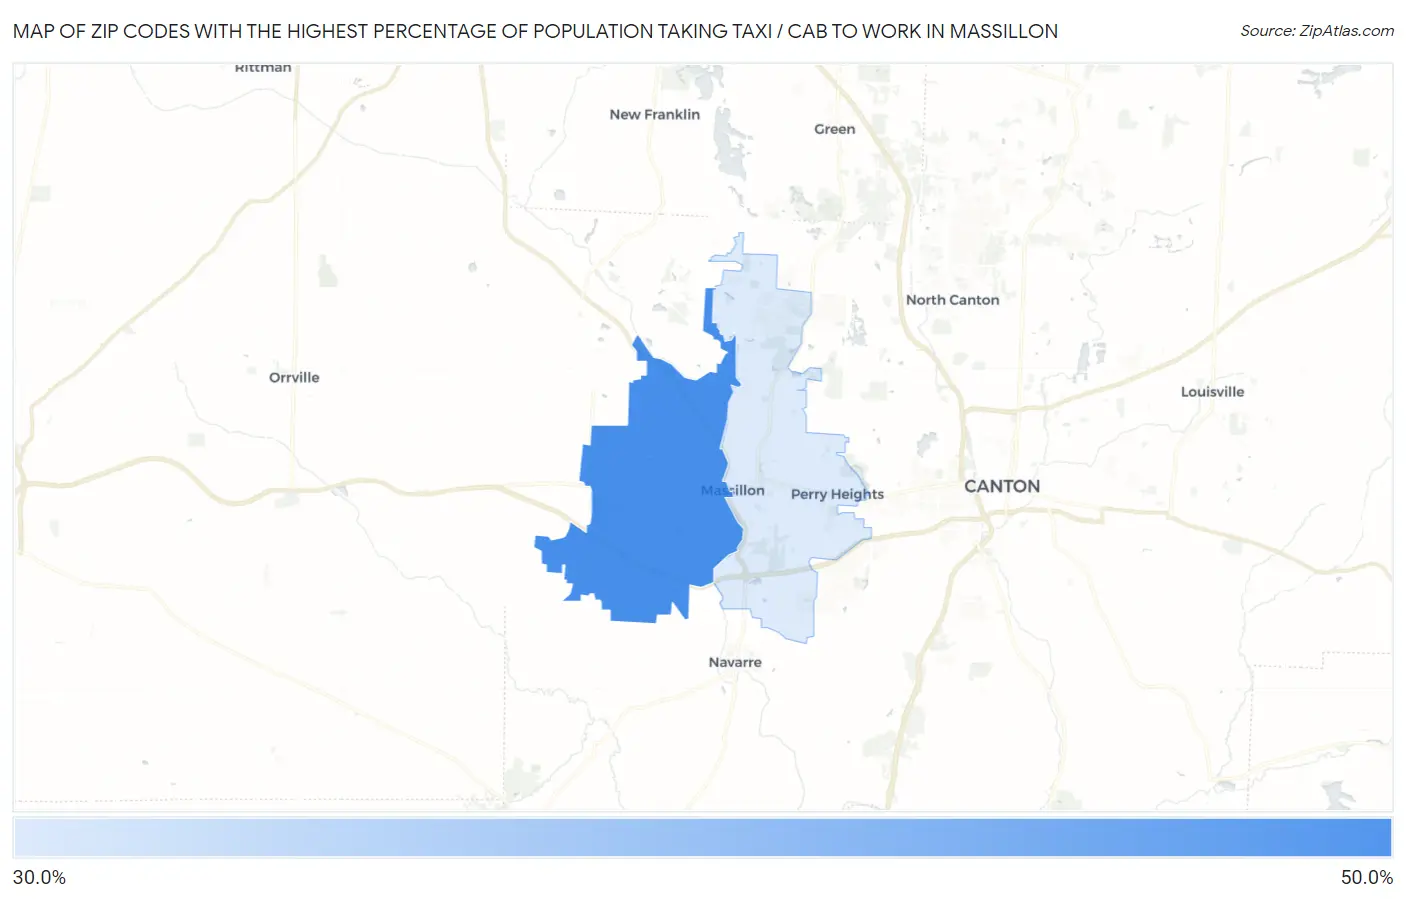
Map of Zip Codes with the Highest Percentage of Population Taking Taxi / Cab to Work in Massillon
0.0%
50.0%
Zip Codes with the Highest Percentage of Population Taking Taxi / Cab to Work in Massillon, OH
| Zip Code | % Take Taxi / Cab | vs State | vs National | |
| 1. | 44647 | 42.2% | 37.6%(+4.60)#205 | 38.2%(+4.00)#5,667 |
| 2. | 44646 | 36.3% | 37.6%(-1.30)#276 | 38.2%(-1.90)#8,294 |
1
Common Questions
What are the Top Zip Codes with the Highest Percentage of Population Taking Taxi / Cab to Work in Massillon, OH?
Top Zip Codes with the Highest Percentage of Population Taking Taxi / Cab to Work in Massillon, OH are:
What zip code has the Highest Percentage of Population Taking Taxi / Cab to Work in Massillon, OH?
44647 has the Highest Percentage of Population Taking Taxi / Cab to Work in Massillon, OH with 42.2%.
What is the Percentage of Population Taking Taxi / Cab to Work in Massillon, OH?
Percentage of Population Taking Taxi / Cab to Work in Massillon is 41.4%.
What is the Percentage of Population Taking Taxi / Cab to Work in Ohio?
Percentage of Population Taking Taxi / Cab to Work in Ohio is 37.6%.
What is the Percentage of Population Taking Taxi / Cab to Work in the United States?
Percentage of Population Taking Taxi / Cab to Work in the United States is 38.2%.