Zip Codes with the Highest Percentage of Population with a Degree in Business in Massillon, OH
RELATED REPORTS & OPTIONS
Business
Massillon
Compare Zip Codes
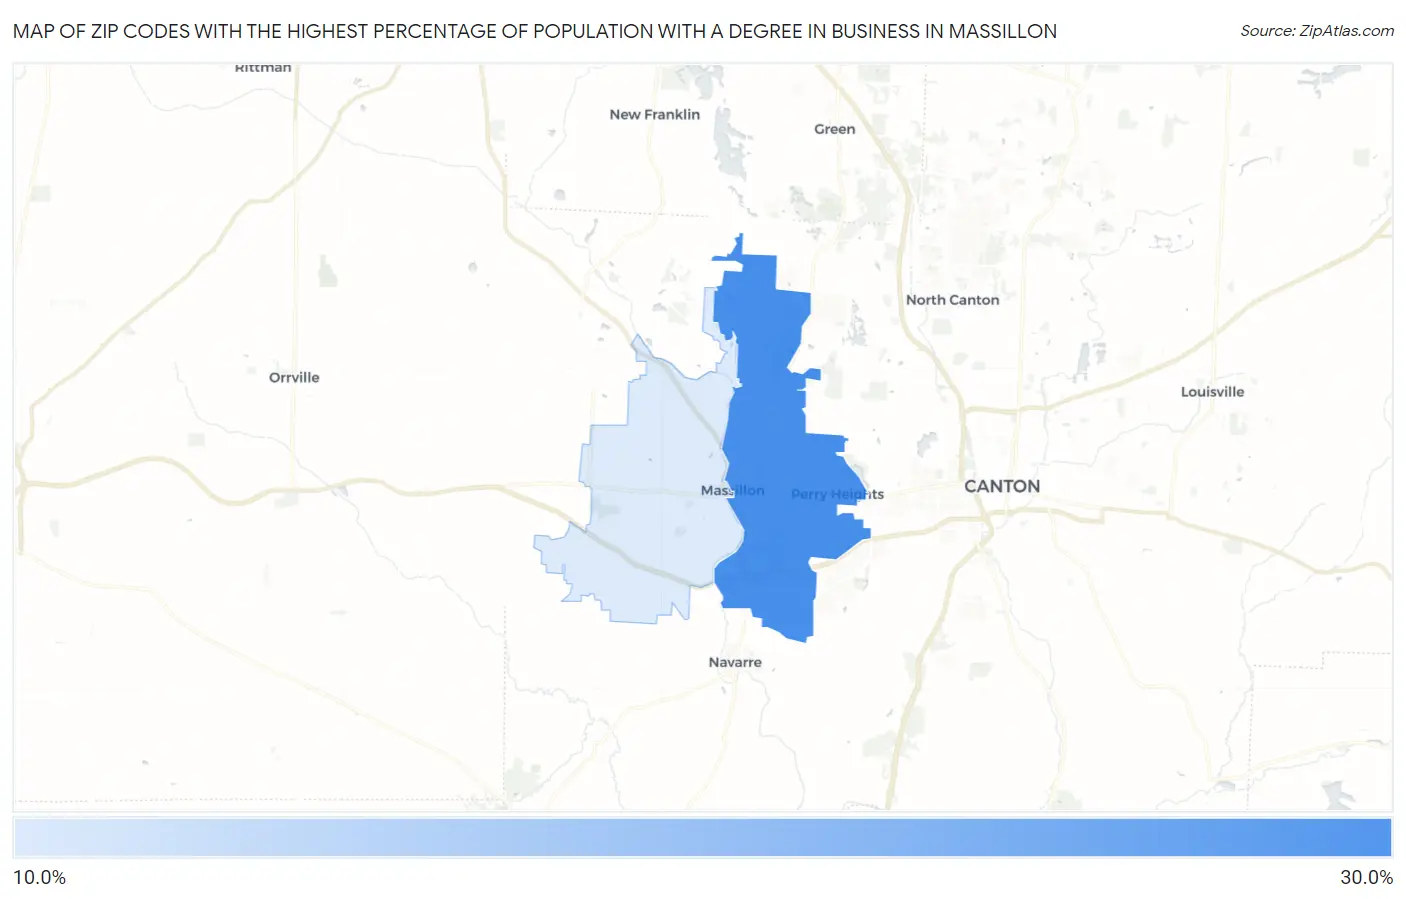
Map of Zip Codes with the Highest Percentage of Population with a Degree in Business in Massillon
0.0%
30.0%
Zip Codes with the Highest Percentage of Population with a Degree in Business in Massillon, OH
| Zip Code | % Graduates | vs State | vs National | |
| 1. | 44646 | 25.5% | 20.5%(+5.02)#191 | 19.5%(+6.04)#5,218 |
| 2. | 44647 | 16.4% | 20.5%(-4.15)#716 | 19.5%(-3.12)#17,079 |
1
Common Questions
What are the Top Zip Codes with the Highest Percentage of Population with a Degree in Business in Massillon, OH?
Top Zip Codes with the Highest Percentage of Population with a Degree in Business in Massillon, OH are:
What zip code has the Highest Percentage of Population with a Degree in Business in Massillon, OH?
44646 has the Highest Percentage of Population with a Degree in Business in Massillon, OH with 25.5%.
What is the Percentage of Population with a Degree in Business in Massillon, OH?
Percentage of Population with a Degree in Business in Massillon is 23.9%.
What is the Percentage of Population with a Degree in Business in Ohio?
Percentage of Population with a Degree in Business in Ohio is 20.5%.
What is the Percentage of Population with a Degree in Business in the United States?
Percentage of Population with a Degree in Business in the United States is 19.5%.