Zip Codes with the Highest Percentage of Population Employed in Legal Services & Support in Cuyahoga Falls, OH
RELATED REPORTS & OPTIONS
Legal Services & Support
Cuyahoga Falls
Compare Zip Codes
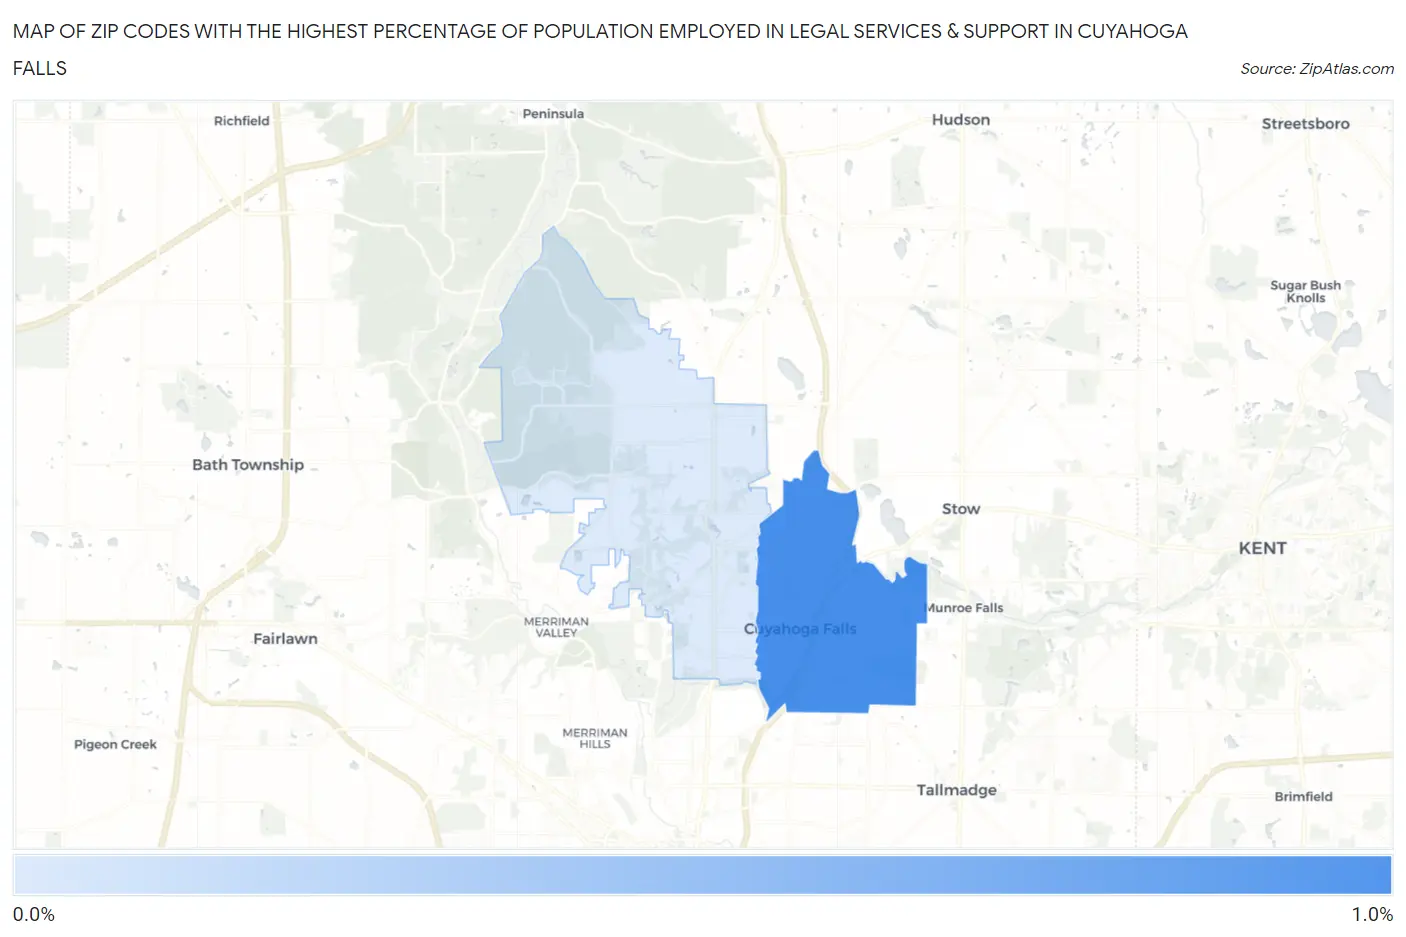
Map of Zip Codes with the Highest Percentage of Population Employed in Legal Services & Support in Cuyahoga Falls
0.0%
1.0%
Zip Codes with the Highest Percentage of Population Employed in Legal Services & Support in Cuyahoga Falls, OH
| Zip Code | % Employed | vs State | vs National | |
| 1. | 44221 | 0.97% | 0.92%(+0.043)#239 | 1.2%(-0.216)#8,050 |
| 2. | 44223 | 0.15% | 0.92%(-0.776)#607 | 1.2%(-1.04)#16,697 |
1
Common Questions
What are the Top Zip Codes with the Highest Percentage of Population Employed in Legal Services & Support in Cuyahoga Falls, OH?
Top Zip Codes with the Highest Percentage of Population Employed in Legal Services & Support in Cuyahoga Falls, OH are:
What zip code has the Highest Percentage of Population Employed in Legal Services & Support in Cuyahoga Falls, OH?
44221 has the Highest Percentage of Population Employed in Legal Services & Support in Cuyahoga Falls, OH with 0.97%.
What is the Percentage of Population Employed in Legal Services & Support in Cuyahoga Falls, OH?
Percentage of Population Employed in Legal Services & Support in Cuyahoga Falls is 0.63%.
What is the Percentage of Population Employed in Legal Services & Support in Ohio?
Percentage of Population Employed in Legal Services & Support in Ohio is 0.92%.
What is the Percentage of Population Employed in Legal Services & Support in the United States?
Percentage of Population Employed in Legal Services & Support in the United States is 1.2%.