Zip Codes with the Highest Percentage of Population Employed in Legal Services & Support in Steubenville, OH
RELATED REPORTS & OPTIONS
Legal Services & Support
Steubenville
Compare Zip Codes
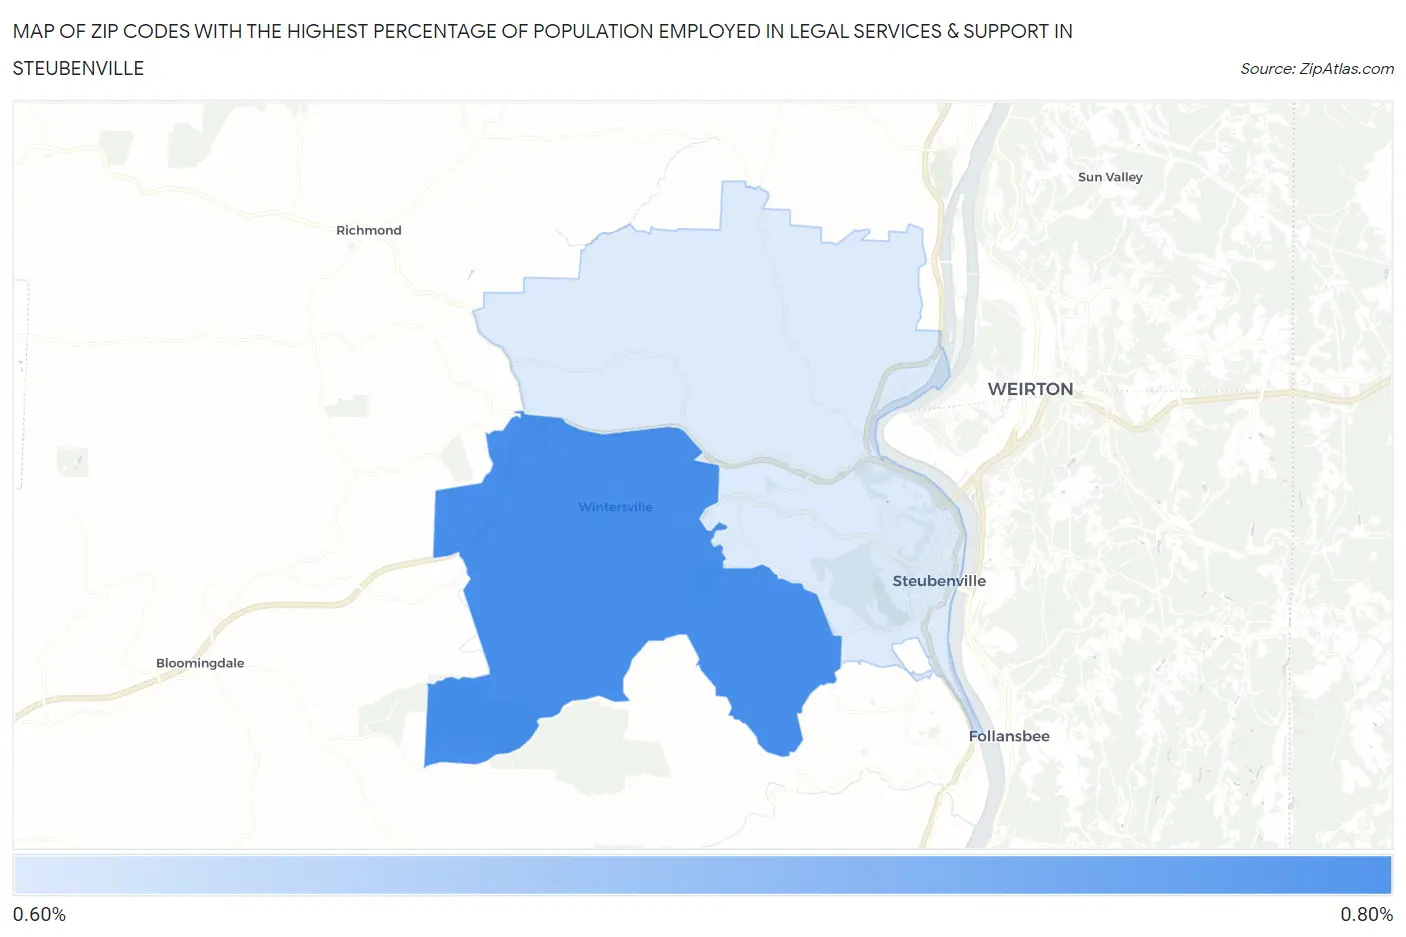
Map of Zip Codes with the Highest Percentage of Population Employed in Legal Services & Support in Steubenville
0.0%
0.80%
Zip Codes with the Highest Percentage of Population Employed in Legal Services & Support in Steubenville, OH
| Zip Code | % Employed | vs State | vs National | |
| 1. | 43953 | 0.74% | 0.92%(-0.184)#313 | 1.2%(-0.443)#10,010 |
| 2. | 43952 | 0.63% | 0.92%(-0.292)#357 | 1.2%(-0.551)#11,091 |
1
Common Questions
What are the Top Zip Codes with the Highest Percentage of Population Employed in Legal Services & Support in Steubenville, OH?
Top Zip Codes with the Highest Percentage of Population Employed in Legal Services & Support in Steubenville, OH are:
What zip code has the Highest Percentage of Population Employed in Legal Services & Support in Steubenville, OH?
43953 has the Highest Percentage of Population Employed in Legal Services & Support in Steubenville, OH with 0.74%.
What is the Percentage of Population Employed in Legal Services & Support in Steubenville, OH?
Percentage of Population Employed in Legal Services & Support in Steubenville is 0.60%.
What is the Percentage of Population Employed in Legal Services & Support in Ohio?
Percentage of Population Employed in Legal Services & Support in Ohio is 0.92%.
What is the Percentage of Population Employed in Legal Services & Support in the United States?
Percentage of Population Employed in Legal Services & Support in the United States is 1.2%.