Zip Codes with the Highest Percentage of Population Employed in Legal Services & Support in Strongsville, OH
RELATED REPORTS & OPTIONS
Legal Services & Support
Strongsville
Compare Zip Codes
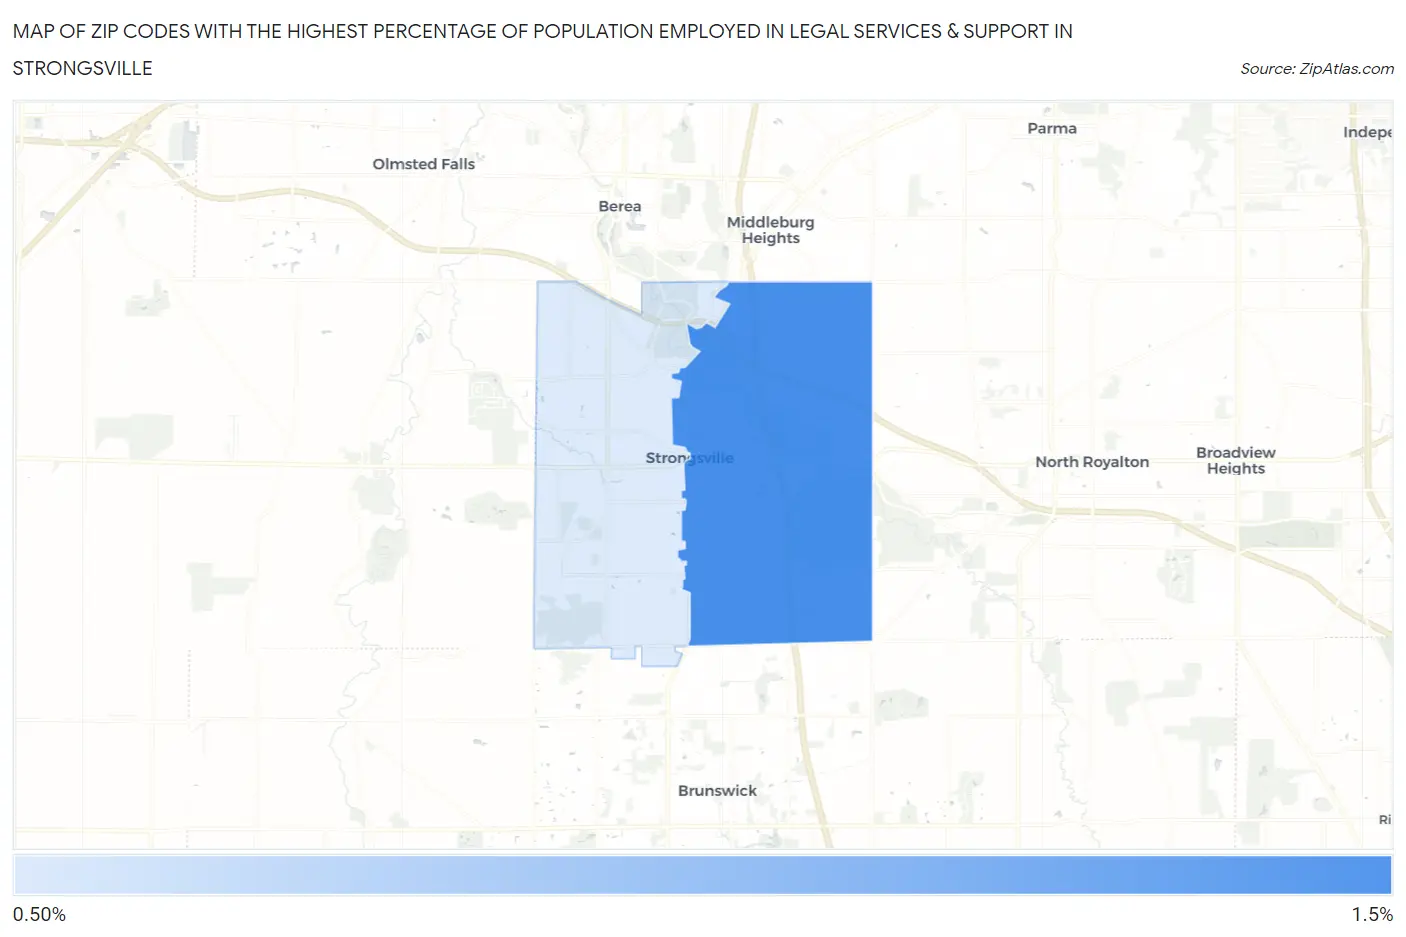
Map of Zip Codes with the Highest Percentage of Population Employed in Legal Services & Support in Strongsville
0.0%
1.5%
Zip Codes with the Highest Percentage of Population Employed in Legal Services & Support in Strongsville, OH
| Zip Code | % Employed | vs State | vs National | |
| 1. | 44136 | 1.3% | 0.92%(+0.391)#166 | 1.2%(+0.132)#5,864 |
| 2. | 44149 | 0.68% | 0.92%(-0.242)#334 | 1.2%(-0.501)#10,579 |
1
Common Questions
What are the Top Zip Codes with the Highest Percentage of Population Employed in Legal Services & Support in Strongsville, OH?
Top Zip Codes with the Highest Percentage of Population Employed in Legal Services & Support in Strongsville, OH are:
What zip code has the Highest Percentage of Population Employed in Legal Services & Support in Strongsville, OH?
44136 has the Highest Percentage of Population Employed in Legal Services & Support in Strongsville, OH with 1.3%.
What is the Percentage of Population Employed in Legal Services & Support in Strongsville, OH?
Percentage of Population Employed in Legal Services & Support in Strongsville is 1.0%.
What is the Percentage of Population Employed in Legal Services & Support in Ohio?
Percentage of Population Employed in Legal Services & Support in Ohio is 0.92%.
What is the Percentage of Population Employed in Legal Services & Support in the United States?
Percentage of Population Employed in Legal Services & Support in the United States is 1.2%.