Zip Codes with the Lowest Poverty Level Among Children Under the Age of 5 in North Dakota
RELATED REPORTS & OPTIONS
Lowest Poverty | Child 0-5
North Dakota
Compare Zip Codes
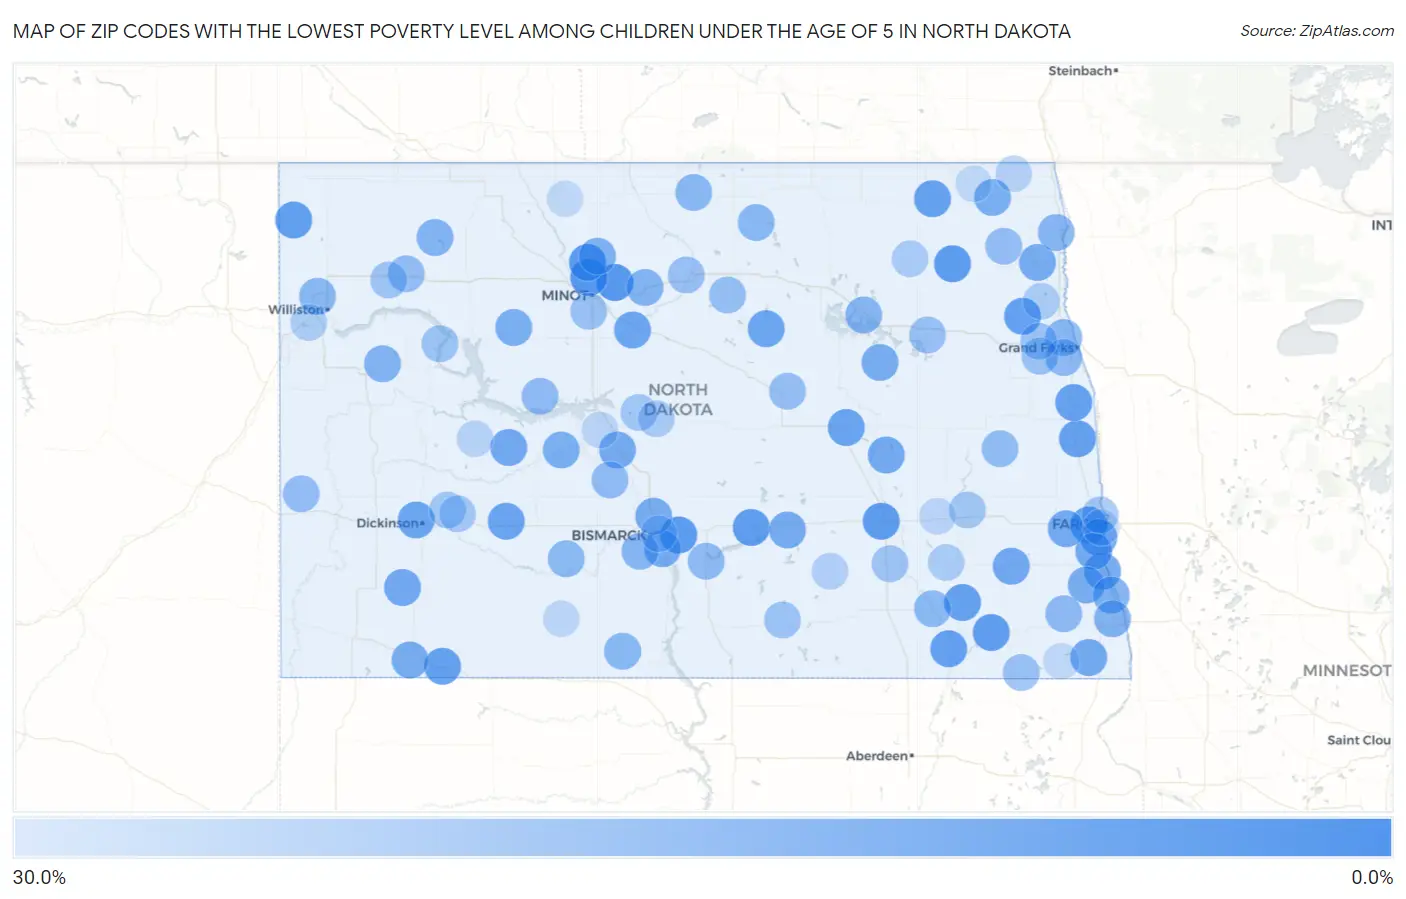
Map of Zip Codes with the Lowest Poverty Level Among Children Under the Age of 5 in North Dakota
30.0%
0.0%
Zip Codes with the Lowest Poverty Level Among Children Under the Age of 5 in North Dakota
| Zip Code | Child Poverty | vs State | vs National | |
| 1. | 58785 | 0.82% | 13.1%(-12.3)#1 | 18.1%(-17.2)#187 |
| 2. | 58703 | 0.83% | 13.1%(-12.3)#2 | 18.1%(-17.2)#194 |
| 3. | 58704 | 1.5% | 13.1%(-11.6)#3 | 18.1%(-16.5)#547 |
| 4. | 58558 | 2.0% | 13.1%(-11.1)#4 | 18.1%(-16.1)#805 |
| 5. | 58210 | 2.4% | 13.1%(-10.7)#5 | 18.1%(-15.7)#1,086 |
| 6. | 58482 | 2.8% | 13.1%(-10.3)#6 | 18.1%(-15.3)#1,353 |
| 7. | 58401 | 2.9% | 13.1%(-10.3)#7 | 18.1%(-15.2)#1,402 |
| 8. | 58040 | 2.9% | 13.1%(-10.2)#8 | 18.1%(-15.2)#1,410 |
| 9. | 58078 | 3.4% | 13.1%(-9.70)#9 | 18.1%(-14.7)#1,760 |
| 10. | 58845 | 3.6% | 13.1%(-9.53)#10 | 18.1%(-14.5)#1,864 |
| 11. | 58474 | 4.1% | 13.1%(-9.03)#11 | 18.1%(-14.0)#2,218 |
| 12. | 58235 | 4.2% | 13.1%(-8.93)#12 | 18.1%(-13.9)#2,314 |
| 13. | 58249 | 4.2% | 13.1%(-8.90)#13 | 18.1%(-13.9)#2,344 |
| 14. | 58639 | 4.5% | 13.1%(-8.64)#14 | 18.1%(-13.6)#2,529 |
| 15. | 58045 | 4.5% | 13.1%(-8.61)#15 | 18.1%(-13.6)#2,551 |
| 16. | 58218 | 4.5% | 13.1%(-8.56)#16 | 18.1%(-13.5)#2,594 |
| 17. | 58490 | 4.5% | 13.1%(-8.56)#17 | 18.1%(-13.5)#2,596 |
| 18. | 58638 | 5.5% | 13.1%(-7.65)#18 | 18.1%(-12.6)#3,211 |
| 19. | 58421 | 5.7% | 13.1%(-7.41)#19 | 18.1%(-12.4)#3,388 |
| 20. | 58601 | 5.7% | 13.1%(-7.37)#20 | 18.1%(-12.3)#3,418 |
| 21. | 58332 | 5.9% | 13.1%(-7.22)#21 | 18.1%(-12.2)#3,526 |
| 22. | 58790 | 6.1% | 13.1%(-7.01)#22 | 18.1%(-12.0)#3,653 |
| 23. | 58015 | 6.9% | 13.1%(-6.20)#23 | 18.1%(-11.2)#4,218 |
| 24. | 58647 | 7.0% | 13.1%(-6.06)#24 | 18.1%(-11.0)#4,319 |
| 25. | 58104 | 7.1% | 13.1%(-6.03)#25 | 18.1%(-11.0)#4,333 |
| 26. | 58541 | 7.1% | 13.1%(-5.96)#26 | 18.1%(-10.9)#4,386 |
| 27. | 58027 | 7.2% | 13.1%(-5.88)#27 | 18.1%(-10.8)#4,429 |
| 28. | 58041 | 7.6% | 13.1%(-5.53)#28 | 18.1%(-10.5)#4,654 |
| 29. | 58455 | 7.6% | 13.1%(-5.53)#29 | 18.1%(-10.5)#4,656 |
| 30. | 58504 | 8.0% | 13.1%(-5.12)#30 | 18.1%(-10.1)#4,906 |
| 31. | 58047 | 8.0% | 13.1%(-5.07)#31 | 18.1%(-10.0)#4,943 |
| 32. | 58059 | 8.1% | 13.1%(-5.04)#32 | 18.1%(-10.00)#4,965 |
| 33. | 58487 | 8.3% | 13.1%(-4.77)#33 | 18.1%(-9.73)#5,141 |
| 34. | 58237 | 8.4% | 13.1%(-4.66)#34 | 18.1%(-9.62)#5,217 |
| 35. | 58577 | 8.5% | 13.1%(-4.62)#35 | 18.1%(-9.58)#5,245 |
| 36. | 58503 | 8.7% | 13.1%(-4.39)#36 | 18.1%(-9.35)#5,415 |
| 37. | 58077 | 9.1% | 13.1%(-4.01)#37 | 18.1%(-8.97)#5,679 |
| 38. | 58381 | 9.1% | 13.1%(-4.01)#38 | 18.1%(-8.97)#5,689 |
| 39. | 58649 | 9.1% | 13.1%(-4.01)#39 | 18.1%(-8.97)#5,694 |
| 40. | 58220 | 9.4% | 13.1%(-3.75)#40 | 18.1%(-8.71)#5,853 |
| 41. | 58545 | 9.5% | 13.1%(-3.65)#41 | 18.1%(-8.61)#5,913 |
| 42. | 58771 | 9.7% | 13.1%(-3.42)#42 | 18.1%(-8.39)#6,071 |
| 43. | 58001 | 10.0% | 13.1%(-3.10)#43 | 18.1%(-8.06)#6,283 |
| 44. | 58740 | 10.5% | 13.1%(-2.58)#44 | 18.1%(-7.54)#6,574 |
| 45. | 58075 | 11.4% | 13.1%(-1.69)#45 | 18.1%(-6.65)#7,093 |
| 46. | 58773 | 11.6% | 13.1%(-1.47)#46 | 18.1%(-6.43)#7,221 |
| 47. | 58854 | 11.7% | 13.1%(-1.37)#47 | 18.1%(-6.33)#7,289 |
| 48. | 58741 | 11.8% | 13.1%(-1.34)#48 | 18.1%(-6.30)#7,318 |
| 49. | 58225 | 12.5% | 13.1%(-0.601)#49 | 18.1%(-5.56)#7,765 |
| 50. | 58301 | 12.7% | 13.1%(-0.411)#50 | 18.1%(-5.37)#7,863 |
| 51. | 58203 | 12.7% | 13.1%(-0.376)#51 | 18.1%(-5.34)#7,881 |
| 52. | 58554 | 12.9% | 13.1%(-0.157)#52 | 18.1%(-5.12)#8,004 |
| 53. | 58801 | 13.0% | 13.1%(-0.129)#53 | 18.1%(-5.09)#8,025 |
| 54. | 58568 | 13.2% | 13.1%(+0.056)#54 | 18.1%(-4.90)#8,134 |
| 55. | 58366 | 13.2% | 13.1%(+0.106)#55 | 18.1%(-4.86)#8,164 |
| 56. | 58318 | 13.5% | 13.1%(+0.370)#56 | 18.1%(-4.59)#8,333 |
| 57. | 58458 | 13.7% | 13.1%(+0.597)#57 | 18.1%(-4.36)#8,460 |
| 58. | 58520 | 13.8% | 13.1%(+0.692)#58 | 18.1%(-4.27)#8,512 |
| 59. | 58201 | 14.1% | 13.1%(+0.994)#59 | 18.1%(-3.97)#8,688 |
| 60. | 58081 | 14.3% | 13.1%(+1.18)#60 | 18.1%(-3.78)#8,826 |
| 61. | 58560 | 14.3% | 13.1%(+1.18)#61 | 18.1%(-3.78)#8,842 |
| 62. | 58540 | 15.0% | 13.1%(+1.90)#62 | 18.1%(-3.06)#9,204 |
| 63. | 58530 | 15.0% | 13.1%(+1.90)#63 | 18.1%(-3.06)#9,208 |
| 64. | 58046 | 15.2% | 13.1%(+2.05)#64 | 18.1%(-2.91)#9,296 |
| 65. | 58243 | 15.7% | 13.1%(+2.58)#65 | 18.1%(-2.38)#9,592 |
| 66. | 58852 | 16.0% | 13.1%(+2.92)#66 | 18.1%(-2.04)#9,759 |
| 67. | 58621 | 16.0% | 13.1%(+2.94)#67 | 18.1%(-2.03)#9,773 |
| 68. | 58438 | 16.2% | 13.1%(+3.11)#68 | 18.1%(-1.85)#9,867 |
| 69. | 58368 | 16.4% | 13.1%(+3.32)#69 | 18.1%(-1.64)#9,987 |
| 70. | 58788 | 16.7% | 13.1%(+3.57)#70 | 18.1%(-1.40)#10,118 |
| 71. | 58043 | 16.7% | 13.1%(+3.57)#71 | 18.1%(-1.40)#10,140 |
| 72. | 58228 | 16.9% | 13.1%(+3.82)#72 | 18.1%(-1.14)#10,216 |
| 73. | 58344 | 17.0% | 13.1%(+3.92)#73 | 18.1%(-1.04)#10,259 |
| 74. | 58204 | 17.3% | 13.1%(+4.19)#74 | 18.1%(-0.775)#10,388 |
| 75. | 58701 | 17.4% | 13.1%(+4.33)#75 | 18.1%(-0.629)#10,451 |
| 76. | 58495 | 17.8% | 13.1%(+4.68)#76 | 18.1%(-0.285)#10,605 |
| 77. | 58763 | 18.1% | 13.1%(+5.03)#77 | 18.1%(+0.068)#10,772 |
| 78. | 58472 | 18.2% | 13.1%(+5.08)#78 | 18.1%(+0.119)#10,818 |
| 79. | 58849 | 18.6% | 13.1%(+5.46)#79 | 18.1%(+0.494)#10,969 |
| 80. | 58102 | 19.3% | 13.1%(+6.19)#80 | 18.1%(+1.23)#11,309 |
| 81. | 58575 | 19.4% | 13.1%(+6.25)#81 | 18.1%(+1.29)#11,342 |
| 82. | 58630 | 19.4% | 13.1%(+6.25)#82 | 18.1%(+1.29)#11,344 |
| 83. | 58072 | 19.5% | 13.1%(+6.38)#83 | 18.1%(+1.41)#11,395 |
| 84. | 58656 | 20.0% | 13.1%(+6.90)#84 | 18.1%(+1.94)#11,654 |
| 85. | 58559 | 20.9% | 13.1%(+7.83)#85 | 18.1%(+2.87)#12,048 |
| 86. | 58261 | 21.3% | 13.1%(+8.23)#86 | 18.1%(+3.27)#12,207 |
| 87. | 58330 | 21.4% | 13.1%(+8.33)#87 | 18.1%(+3.37)#12,254 |
| 88. | 58461 | 21.7% | 13.1%(+8.64)#88 | 18.1%(+3.68)#12,384 |
| 89. | 58853 | 22.0% | 13.1%(+8.85)#89 | 18.1%(+3.89)#12,467 |
| 90. | 58501 | 22.4% | 13.1%(+9.26)#90 | 18.1%(+4.30)#12,654 |
| 91. | 58442 | 22.9% | 13.1%(+9.76)#91 | 18.1%(+4.79)#12,863 |
| 92. | 58265 | 24.1% | 13.1%(+11.0)#92 | 18.1%(+6.08)#13,377 |
| 93. | 58636 | 24.8% | 13.1%(+11.7)#93 | 18.1%(+6.72)#13,582 |
| 94. | 58576 | 25.0% | 13.1%(+11.9)#94 | 18.1%(+6.94)#13,662 |
| 95. | 58480 | 25.0% | 13.1%(+11.9)#95 | 18.1%(+6.94)#13,706 |
| 96. | 58103 | 25.8% | 13.1%(+12.7)#96 | 18.1%(+7.75)#13,967 |
| 97. | 58529 | 26.0% | 13.1%(+12.9)#97 | 18.1%(+7.94)#14,032 |
| 98. | 58053 | 26.7% | 13.1%(+13.6)#98 | 18.1%(+8.60)#14,254 |
| 99. | 58282 | 26.7% | 13.1%(+13.6)#99 | 18.1%(+8.60)#14,255 |
| 100. | 58761 | 26.7% | 13.1%(+13.6)#100 | 18.1%(+8.60)#14,257 |
Common Questions
What are the Top 10 Zip Codes with the Lowest Poverty Level Among Children Under the Age of 5 in North Dakota?
Top 10 Zip Codes with the Lowest Poverty Level Among Children Under the Age of 5 in North Dakota are:
What zip code has the Lowest Poverty Level Among Children Under the Age of 5 in North Dakota?
58785 has the Lowest Poverty Level Among Children Under the Age of 5 in North Dakota with 0.82%.
What is the Poverty Level Among Children Under the Age of 5 in the State of North Dakota?
Poverty Level Among Children Under the Age of 5 in North Dakota is 13.1%.
What is the Poverty Level Among Children Under the Age of 5 in the United States?
Poverty Level Among Children Under the Age of 5 in the United States is 18.1%.