Zip Codes with the Lowest Poverty Level Among Children Under the Age of 5 in Missouri
RELATED REPORTS & OPTIONS
Lowest Poverty | Child 0-5
Missouri
Compare Zip Codes
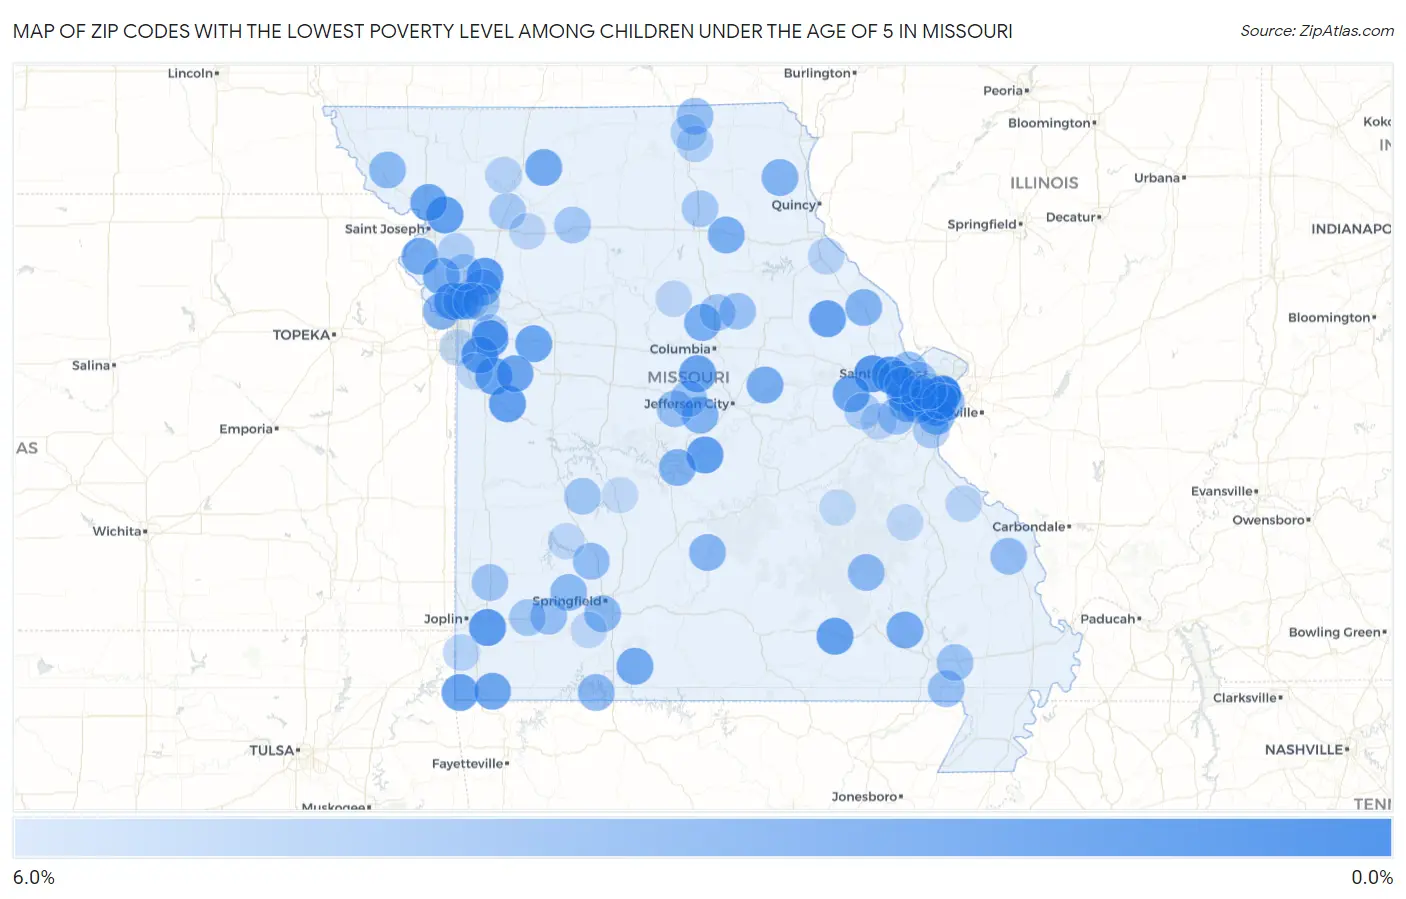
Map of Zip Codes with the Lowest Poverty Level Among Children Under the Age of 5 in Missouri
6.0%
0.0%
Zip Codes with the Lowest Poverty Level Among Children Under the Age of 5 in Missouri
| Zip Code | Child Poverty | vs State | vs National | |
| 1. | 63348 | 0.55% | 18.4%(-17.9)#1 | 18.1%(-17.5)#75 |
| 2. | 63367 | 0.67% | 18.4%(-17.7)#2 | 18.1%(-17.4)#120 |
| 3. | 64840 | 0.71% | 18.4%(-17.7)#3 | 18.1%(-17.4)#134 |
| 4. | 64048 | 0.74% | 18.4%(-17.7)#4 | 18.1%(-17.3)#143 |
| 5. | 63126 | 0.74% | 18.4%(-17.7)#5 | 18.1%(-17.3)#148 |
| 6. | 63117 | 0.79% | 18.4%(-17.6)#6 | 18.1%(-17.3)#170 |
| 7. | 64015 | 0.85% | 18.4%(-17.6)#7 | 18.1%(-17.2)#205 |
| 8. | 64154 | 0.94% | 18.4%(-17.5)#8 | 18.1%(-17.1)#250 |
| 9. | 65082 | 1.1% | 18.4%(-17.3)#9 | 18.1%(-17.0)#314 |
| 10. | 64436 | 1.1% | 18.4%(-17.3)#10 | 18.1%(-17.0)#320 |
| 11. | 63122 | 1.1% | 18.4%(-17.3)#11 | 18.1%(-17.0)#331 |
| 12. | 64080 | 1.1% | 18.4%(-17.3)#12 | 18.1%(-16.9)#348 |
| 13. | 64747 | 1.2% | 18.4%(-17.2)#13 | 18.1%(-16.9)#375 |
| 14. | 65588 | 1.2% | 18.4%(-17.2)#14 | 18.1%(-16.8)#390 |
| 15. | 64081 | 1.3% | 18.4%(-17.1)#15 | 18.1%(-16.8)#417 |
| 16. | 63011 | 1.3% | 18.4%(-17.1)#16 | 18.1%(-16.8)#429 |
| 17. | 63359 | 1.3% | 18.4%(-17.1)#17 | 18.1%(-16.7)#438 |
| 18. | 64863 | 1.4% | 18.4%(-17.1)#18 | 18.1%(-16.7)#450 |
| 19. | 63131 | 1.4% | 18.4%(-17.0)#19 | 18.1%(-16.6)#484 |
| 20. | 65046 | 1.4% | 18.4%(-17.0)#20 | 18.1%(-16.6)#500 |
| 21. | 64076 | 1.5% | 18.4%(-16.9)#21 | 18.1%(-16.5)#551 |
| 22. | 64485 | 1.6% | 18.4%(-16.8)#22 | 18.1%(-16.5)#599 |
| 23. | 64856 | 1.6% | 18.4%(-16.8)#23 | 18.1%(-16.4)#604 |
| 24. | 63357 | 1.6% | 18.4%(-16.8)#24 | 18.1%(-16.4)#616 |
| 25. | 64061 | 1.7% | 18.4%(-16.7)#25 | 18.1%(-16.4)#648 |
| 26. | 63105 | 1.7% | 18.4%(-16.7)#26 | 18.1%(-16.3)#658 |
| 27. | 64440 | 1.9% | 18.4%(-16.5)#27 | 18.1%(-16.1)#786 |
| 28. | 65759 | 2.0% | 18.4%(-16.4)#28 | 18.1%(-16.1)#828 |
| 29. | 64642 | 2.0% | 18.4%(-16.4)#29 | 18.1%(-16.1)#830 |
| 30. | 64018 | 2.1% | 18.4%(-16.4)#30 | 18.1%(-16.0)#870 |
| 31. | 63952 | 2.1% | 18.4%(-16.3)#31 | 18.1%(-16.0)#905 |
| 32. | 63005 | 2.1% | 18.4%(-16.3)#32 | 18.1%(-16.0)#907 |
| 33. | 65059 | 2.1% | 18.4%(-16.3)#33 | 18.1%(-15.9)#921 |
| 34. | 64156 | 2.2% | 18.4%(-16.2)#34 | 18.1%(-15.8)#990 |
| 35. | 63128 | 2.3% | 18.4%(-16.2)#35 | 18.1%(-15.8)#1,002 |
| 36. | 65256 | 2.3% | 18.4%(-16.1)#36 | 18.1%(-15.8)#1,019 |
| 37. | 63437 | 2.3% | 18.4%(-16.1)#37 | 18.1%(-15.8)#1,038 |
| 38. | 63040 | 2.4% | 18.4%(-16.0)#38 | 18.1%(-15.6)#1,126 |
| 39. | 64060 | 2.5% | 18.4%(-16.0)#39 | 18.1%(-15.6)#1,143 |
| 40. | 64152 | 2.5% | 18.4%(-15.9)#40 | 18.1%(-15.5)#1,180 |
| 41. | 65074 | 2.6% | 18.4%(-15.8)#41 | 18.1%(-15.5)#1,209 |
| 42. | 65065 | 2.7% | 18.4%(-15.7)#42 | 18.1%(-15.4)#1,291 |
| 43. | 63344 | 2.7% | 18.4%(-15.7)#43 | 18.1%(-15.4)#1,300 |
| 44. | 63452 | 2.7% | 18.4%(-15.7)#44 | 18.1%(-15.4)#1,301 |
| 45. | 65470 | 2.9% | 18.4%(-15.6)#45 | 18.1%(-15.2)#1,411 |
| 46. | 63109 | 2.9% | 18.4%(-15.5)#46 | 18.1%(-15.1)#1,470 |
| 47. | 65810 | 3.0% | 18.4%(-15.4)#47 | 18.1%(-15.0)#1,515 |
| 48. | 65604 | 3.1% | 18.4%(-15.4)#48 | 18.1%(-15.0)#1,541 |
| 49. | 64470 | 3.1% | 18.4%(-15.3)#49 | 18.1%(-15.0)#1,571 |
| 50. | 65611 | 3.2% | 18.4%(-15.2)#50 | 18.1%(-14.9)#1,625 |
| 51. | 63633 | 3.2% | 18.4%(-15.2)#51 | 18.1%(-14.8)#1,661 |
| 52. | 63376 | 3.4% | 18.4%(-15.0)#52 | 18.1%(-14.7)#1,743 |
| 53. | 65710 | 3.4% | 18.4%(-15.0)#53 | 18.1%(-14.7)#1,766 |
| 54. | 63021 | 3.4% | 18.4%(-15.0)#54 | 18.1%(-14.6)#1,781 |
| 55. | 63769 | 3.5% | 18.4%(-14.9)#55 | 18.1%(-14.5)#1,842 |
| 56. | 64155 | 3.6% | 18.4%(-14.8)#56 | 18.1%(-14.5)#1,861 |
| 57. | 65712 | 3.6% | 18.4%(-14.8)#57 | 18.1%(-14.5)#1,877 |
| 58. | 65050 | 3.6% | 18.4%(-14.8)#58 | 18.1%(-14.4)#1,899 |
| 59. | 63548 | 3.6% | 18.4%(-14.8)#59 | 18.1%(-14.4)#1,912 |
| 60. | 63961 | 3.7% | 18.4%(-14.7)#60 | 18.1%(-14.4)#1,936 |
| 61. | 63069 | 3.8% | 18.4%(-14.6)#61 | 18.1%(-14.3)#2,026 |
| 62. | 65240 | 3.8% | 18.4%(-14.6)#62 | 18.1%(-14.2)#2,034 |
| 63. | 63303 | 3.9% | 18.4%(-14.5)#63 | 18.1%(-14.2)#2,082 |
| 64. | 65018 | 3.9% | 18.4%(-14.5)#64 | 18.1%(-14.2)#2,084 |
| 65. | 63940 | 3.9% | 18.4%(-14.5)#65 | 18.1%(-14.1)#2,110 |
| 66. | 64755 | 4.0% | 18.4%(-14.4)#66 | 18.1%(-14.1)#2,170 |
| 67. | 65774 | 4.2% | 18.4%(-14.2)#67 | 18.1%(-13.9)#2,309 |
| 68. | 65756 | 4.2% | 18.4%(-14.2)#68 | 18.1%(-13.9)#2,310 |
| 69. | 64068 | 4.2% | 18.4%(-14.2)#69 | 18.1%(-13.8)#2,352 |
| 70. | 65284 | 4.2% | 18.4%(-14.2)#70 | 18.1%(-13.8)#2,356 |
| 71. | 64492 | 4.3% | 18.4%(-14.2)#71 | 18.1%(-13.8)#2,377 |
| 72. | 64601 | 4.3% | 18.4%(-14.1)#72 | 18.1%(-13.8)#2,386 |
| 73. | 63530 | 4.3% | 18.4%(-14.1)#73 | 18.1%(-13.7)#2,419 |
| 74. | 63368 | 4.3% | 18.4%(-14.1)#74 | 18.1%(-13.7)#2,437 |
| 75. | 64689 | 4.3% | 18.4%(-14.1)#75 | 18.1%(-13.7)#2,452 |
| 76. | 64057 | 4.5% | 18.4%(-13.9)#76 | 18.1%(-13.6)#2,566 |
| 77. | 63090 | 4.6% | 18.4%(-13.8)#77 | 18.1%(-13.5)#2,630 |
| 78. | 63052 | 4.6% | 18.4%(-13.8)#78 | 18.1%(-13.4)#2,662 |
| 79. | 63017 | 4.8% | 18.4%(-13.7)#79 | 18.1%(-13.3)#2,726 |
| 80. | 64454 | 4.8% | 18.4%(-13.6)#80 | 18.1%(-13.3)#2,768 |
| 81. | 63546 | 4.8% | 18.4%(-13.6)#81 | 18.1%(-13.2)#2,775 |
| 82. | 63119 | 4.9% | 18.4%(-13.6)#82 | 18.1%(-13.2)#2,804 |
| 83. | 63561 | 5.0% | 18.4%(-13.4)#83 | 18.1%(-13.1)#2,877 |
| 84. | 64114 | 5.0% | 18.4%(-13.4)#84 | 18.1%(-13.1)#2,883 |
| 85. | 64865 | 5.0% | 18.4%(-13.4)#85 | 18.1%(-13.0)#2,939 |
| 86. | 63304 | 5.1% | 18.4%(-13.3)#86 | 18.1%(-13.0)#2,957 |
| 87. | 64657 | 5.1% | 18.4%(-13.3)#87 | 18.1%(-12.9)#2,995 |
| 88. | 63459 | 5.1% | 18.4%(-13.3)#88 | 18.1%(-12.9)#3,004 |
| 89. | 64157 | 5.2% | 18.4%(-13.2)#89 | 18.1%(-12.9)#3,028 |
| 90. | 63670 | 5.2% | 18.4%(-13.2)#90 | 18.1%(-12.8)#3,057 |
| 91. | 64644 | 5.3% | 18.4%(-13.2)#91 | 18.1%(-12.8)#3,068 |
| 92. | 65230 | 5.3% | 18.4%(-13.2)#92 | 18.1%(-12.8)#3,078 |
| 93. | 63089 | 5.3% | 18.4%(-13.1)#93 | 18.1%(-12.7)#3,120 |
| 94. | 63624 | 5.4% | 18.4%(-13.1)#94 | 18.1%(-12.7)#3,133 |
| 95. | 63141 | 5.4% | 18.4%(-13.0)#95 | 18.1%(-12.6)#3,191 |
| 96. | 65631 | 5.5% | 18.4%(-12.9)#96 | 18.1%(-12.6)#3,247 |
| 97. | 65649 | 5.5% | 18.4%(-12.9)#97 | 18.1%(-12.5)#3,256 |
| 98. | 64083 | 5.5% | 18.4%(-12.9)#98 | 18.1%(-12.5)#3,267 |
| 99. | 65732 | 5.6% | 18.4%(-12.8)#99 | 18.1%(-12.5)#3,322 |
| 100. | 65565 | 5.6% | 18.4%(-12.8)#100 | 18.1%(-12.5)#3,326 |
Common Questions
What are the Top 10 Zip Codes with the Lowest Poverty Level Among Children Under the Age of 5 in Missouri?
Top 10 Zip Codes with the Lowest Poverty Level Among Children Under the Age of 5 in Missouri are:
What zip code has the Lowest Poverty Level Among Children Under the Age of 5 in Missouri?
63348 has the Lowest Poverty Level Among Children Under the Age of 5 in Missouri with 0.55%.
What is the Poverty Level Among Children Under the Age of 5 in the State of Missouri?
Poverty Level Among Children Under the Age of 5 in Missouri is 18.4%.
What is the Poverty Level Among Children Under the Age of 5 in the United States?
Poverty Level Among Children Under the Age of 5 in the United States is 18.1%.