Zip Codes with the Lowest Poverty Level Among Children Under the Age of 5 in Alaska
RELATED REPORTS & OPTIONS
Lowest Poverty | Child 0-5
Alaska
Compare Zip Codes
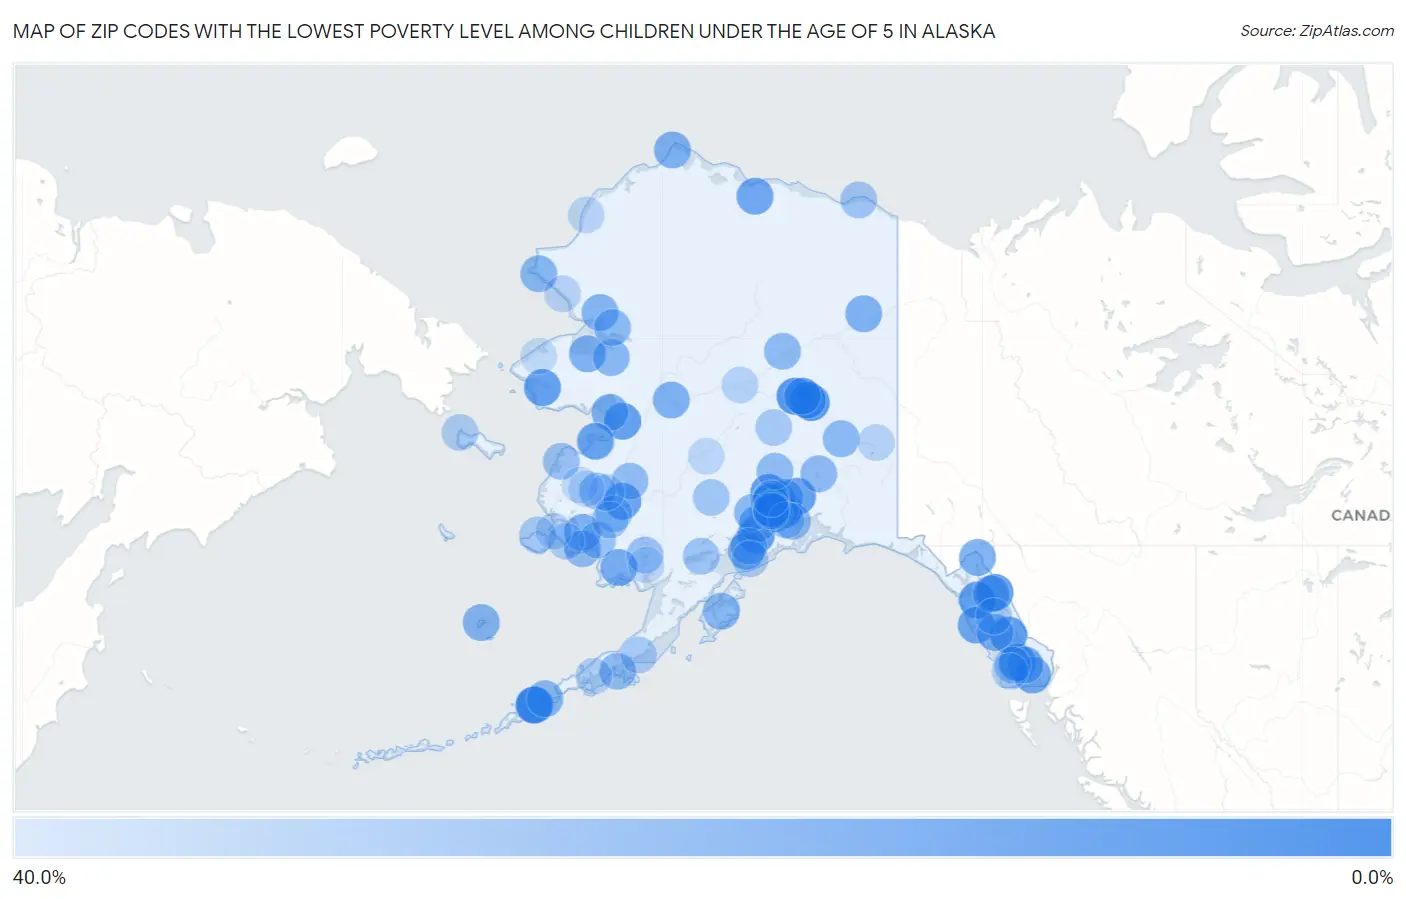
Map of Zip Codes with the Lowest Poverty Level Among Children Under the Age of 5 in Alaska
40.0%
0.0%
Zip Codes with the Lowest Poverty Level Among Children Under the Age of 5 in Alaska
| Zip Code | Child Poverty | vs State | vs National | |
| 1. | 99709 | 2.0% | 16.9%(-14.9)#1 | 18.1%(-16.1)#819 |
| 2. | 99567 | 2.6% | 16.9%(-14.3)#2 | 18.1%(-15.5)#1,225 |
| 3. | 99919 | 3.0% | 16.9%(-13.8)#3 | 18.1%(-15.0)#1,527 |
| 4. | 99702 | 3.1% | 16.9%(-13.8)#4 | 18.1%(-15.0)#1,539 |
| 5. | 99505 | 3.4% | 16.9%(-13.5)#5 | 18.1%(-14.7)#1,752 |
| 6. | 99801 | 3.4% | 16.9%(-13.5)#6 | 18.1%(-14.6)#1,771 |
| 7. | 99669 | 3.8% | 16.9%(-13.0)#7 | 18.1%(-14.2)#2,033 |
| 8. | 99516 | 4.6% | 16.9%(-12.3)#8 | 18.1%(-13.5)#2,614 |
| 9. | 99705 | 4.8% | 16.9%(-12.1)#9 | 18.1%(-13.3)#2,746 |
| 10. | 99833 | 5.4% | 16.9%(-11.5)#10 | 18.1%(-12.7)#3,160 |
| 11. | 99829 | 5.4% | 16.9%(-11.5)#11 | 18.1%(-12.7)#3,167 |
| 12. | 99515 | 5.5% | 16.9%(-11.4)#12 | 18.1%(-12.6)#3,248 |
| 13. | 99685 | 6.4% | 16.9%(-10.5)#13 | 18.1%(-11.7)#3,873 |
| 14. | 99762 | 6.4% | 16.9%(-10.5)#14 | 18.1%(-11.6)#3,885 |
| 15. | 99703 | 6.5% | 16.9%(-10.3)#15 | 18.1%(-11.5)#3,961 |
| 16. | 99674 | 6.7% | 16.9%(-10.2)#16 | 18.1%(-11.4)#4,043 |
| 17. | 99684 | 6.9% | 16.9%(-9.97)#17 | 18.1%(-11.2)#4,212 |
| 18. | 99688 | 7.3% | 16.9%(-9.59)#18 | 18.1%(-10.8)#4,463 |
| 19. | 99607 | 8.3% | 16.9%(-8.53)#19 | 18.1%(-9.73)#5,146 |
| 20. | 99507 | 8.4% | 16.9%(-8.49)#20 | 18.1%(-9.69)#5,168 |
| 21. | 99692 | 9.1% | 16.9%(-7.78)#21 | 18.1%(-8.97)#5,678 |
| 22. | 99835 | 9.2% | 16.9%(-7.63)#22 | 18.1%(-8.83)#5,775 |
| 23. | 99789 | 10.6% | 16.9%(-6.23)#23 | 18.1%(-7.42)#6,642 |
| 24. | 99518 | 11.1% | 16.9%(-5.74)#24 | 18.1%(-6.93)#6,935 |
| 25. | 99517 | 11.5% | 16.9%(-5.38)#25 | 18.1%(-6.58)#7,139 |
| 26. | 99926 | 11.6% | 16.9%(-5.27)#26 | 18.1%(-6.47)#7,199 |
| 27. | 99577 | 12.1% | 16.9%(-4.81)#27 | 18.1%(-6.00)#7,498 |
| 28. | 99678 | 12.9% | 16.9%(-3.96)#28 | 18.1%(-5.16)#7,989 |
| 29. | 99502 | 13.1% | 16.9%(-3.73)#29 | 18.1%(-4.92)#8,124 |
| 30. | 99840 | 13.9% | 16.9%(-2.94)#30 | 18.1%(-4.14)#8,601 |
| 31. | 99901 | 14.9% | 16.9%(-1.95)#31 | 18.1%(-3.14)#9,160 |
| 32. | 99771 | 15.0% | 16.9%(-1.87)#32 | 18.1%(-3.06)#9,217 |
| 33. | 99556 | 15.1% | 16.9%(-1.81)#33 | 18.1%(-3.01)#9,242 |
| 34. | 99723 | 15.3% | 16.9%(-1.56)#34 | 18.1%(-2.76)#9,383 |
| 35. | 99654 | 15.4% | 16.9%(-1.51)#35 | 18.1%(-2.71)#9,405 |
| 36. | 99740 | 15.4% | 16.9%(-1.48)#36 | 18.1%(-2.68)#9,448 |
| 37. | 99559 | 15.5% | 16.9%(-1.41)#37 | 18.1%(-2.61)#9,480 |
| 38. | 99741 | 16.0% | 16.9%(-0.866)#38 | 18.1%(-2.06)#9,754 |
| 39. | 99611 | 16.1% | 16.9%(-0.730)#39 | 18.1%(-1.93)#9,833 |
| 40. | 99660 | 16.7% | 16.9%(-0.200)#40 | 18.1%(-1.40)#10,133 |
| 41. | 99736 | 16.7% | 16.9%(-0.200)#41 | 18.1%(-1.40)#10,139 |
| 42. | 99623 | 17.0% | 16.9%(+0.111)#42 | 18.1%(-1.09)#10,240 |
| 43. | 99830 | 17.1% | 16.9%(+0.207)#43 | 18.1%(-0.990)#10,280 |
| 44. | 99645 | 17.5% | 16.9%(+0.646)#44 | 18.1%(-0.550)#10,479 |
| 45. | 99752 | 18.2% | 16.9%(+1.32)#45 | 18.1%(+0.119)#10,791 |
| 46. | 99766 | 18.3% | 16.9%(+1.41)#46 | 18.1%(+0.217)#10,857 |
| 47. | 99652 | 18.7% | 16.9%(+1.78)#47 | 18.1%(+0.588)#11,010 |
| 48. | 99553 | 18.8% | 16.9%(+1.88)#48 | 18.1%(+0.687)#11,063 |
| 49. | 99615 | 19.0% | 16.9%(+2.09)#49 | 18.1%(+0.894)#11,155 |
| 50. | 99727 | 19.1% | 16.9%(+2.23)#50 | 18.1%(+1.04)#11,213 |
| 51. | 99824 | 19.3% | 16.9%(+2.46)#51 | 18.1%(+1.26)#11,325 |
| 52. | 99763 | 19.7% | 16.9%(+2.83)#52 | 18.1%(+1.63)#11,493 |
| 53. | 99682 | 20.0% | 16.9%(+3.13)#53 | 18.1%(+1.94)#11,660 |
| 54. | 99737 | 20.2% | 16.9%(+3.31)#54 | 18.1%(+2.11)#11,718 |
| 55. | 99639 | 20.6% | 16.9%(+3.69)#55 | 18.1%(+2.50)#11,891 |
| 56. | 99693 | 20.6% | 16.9%(+3.72)#56 | 18.1%(+2.53)#11,905 |
| 57. | 99588 | 20.7% | 16.9%(+3.79)#57 | 18.1%(+2.59)#11,934 |
| 58. | 99701 | 21.0% | 16.9%(+4.16)#58 | 18.1%(+2.96)#12,085 |
| 59. | 99622 | 21.1% | 16.9%(+4.19)#59 | 18.1%(+2.99)#12,106 |
| 60. | 99661 | 21.7% | 16.9%(+4.87)#60 | 18.1%(+3.68)#12,380 |
| 61. | 99676 | 22.2% | 16.9%(+5.36)#61 | 18.1%(+4.16)#12,572 |
| 62. | 99602 | 22.2% | 16.9%(+5.36)#62 | 18.1%(+4.16)#12,594 |
| 63. | 99585 | 22.2% | 16.9%(+5.36)#63 | 18.1%(+4.16)#12,599 |
| 64. | 99501 | 23.0% | 16.9%(+6.10)#64 | 18.1%(+4.91)#12,893 |
| 65. | 99659 | 23.5% | 16.9%(+6.66)#65 | 18.1%(+5.47)#13,111 |
| 66. | 99581 | 24.5% | 16.9%(+7.66)#66 | 18.1%(+6.47)#13,507 |
| 67. | 99576 | 24.9% | 16.9%(+8.01)#67 | 18.1%(+6.81)#13,603 |
| 68. | 99578 | 25.0% | 16.9%(+8.13)#68 | 18.1%(+6.94)#13,688 |
| 69. | 99679 | 25.0% | 16.9%(+8.13)#69 | 18.1%(+6.94)#13,689 |
| 70. | 99504 | 25.3% | 16.9%(+8.39)#70 | 18.1%(+7.19)#13,773 |
| 71. | 99921 | 25.4% | 16.9%(+8.56)#71 | 18.1%(+7.36)#13,824 |
| 72. | 99606 | 26.1% | 16.9%(+9.22)#72 | 18.1%(+8.02)#14,059 |
| 73. | 99671 | 26.7% | 16.9%(+9.80)#73 | 18.1%(+8.60)#14,258 |
| 74. | 99747 | 26.7% | 16.9%(+9.80)#74 | 18.1%(+8.60)#14,267 |
| 75. | 99506 | 27.2% | 16.9%(+10.3)#75 | 18.1%(+9.14)#14,426 |
| 76. | 99503 | 27.4% | 16.9%(+10.5)#76 | 18.1%(+9.32)#14,497 |
| 77. | 99552 | 27.6% | 16.9%(+10.7)#77 | 18.1%(+9.52)#14,575 |
| 78. | 99630 | 28.6% | 16.9%(+11.7)#78 | 18.1%(+10.5)#14,895 |
| 79. | 99587 | 28.8% | 16.9%(+11.9)#79 | 18.1%(+10.8)#14,971 |
| 80. | 99743 | 29.2% | 16.9%(+12.3)#80 | 18.1%(+11.1)#15,070 |
| 81. | 99603 | 29.8% | 16.9%(+12.9)#81 | 18.1%(+11.7)#15,256 |
| 82. | 99561 | 29.8% | 16.9%(+13.0)#82 | 18.1%(+11.8)#15,276 |
| 83. | 99648 | 30.0% | 16.9%(+13.1)#83 | 18.1%(+11.9)#15,332 |
| 84. | 99508 | 30.2% | 16.9%(+13.4)#84 | 18.1%(+12.2)#15,384 |
| 85. | 99742 | 30.3% | 16.9%(+13.4)#85 | 18.1%(+12.2)#15,410 |
| 86. | 99820 | 30.6% | 16.9%(+13.7)#86 | 18.1%(+12.5)#15,470 |
| 87. | 99612 | 32.4% | 16.9%(+15.6)#87 | 18.1%(+14.4)#15,943 |
| 88. | 99694 | 33.3% | 16.9%(+16.5)#88 | 18.1%(+15.3)#16,175 |
| 89. | 99922 | 33.3% | 16.9%(+16.5)#89 | 18.1%(+15.3)#16,228 |
| 90. | 99777 | 33.3% | 16.9%(+16.5)#90 | 18.1%(+15.3)#16,236 |
| 91. | 99780 | 34.1% | 16.9%(+17.2)#91 | 18.1%(+16.0)#16,392 |
| 92. | 99750 | 34.1% | 16.9%(+17.3)#92 | 18.1%(+16.1)#16,399 |
| 93. | 99637 | 34.6% | 16.9%(+17.8)#93 | 18.1%(+16.6)#16,522 |
| 94. | 99657 | 34.8% | 16.9%(+17.9)#94 | 18.1%(+16.7)#16,556 |
| 95. | 99759 | 35.7% | 16.9%(+18.8)#95 | 18.1%(+17.7)#16,792 |
| 96. | 99627 | 36.4% | 16.9%(+19.5)#96 | 18.1%(+18.3)#16,944 |
| 97. | 99555 | 37.5% | 16.9%(+20.6)#97 | 18.1%(+19.4)#17,184 |
| 98. | 99658 | 37.7% | 16.9%(+20.9)#98 | 18.1%(+19.7)#17,218 |
| 99. | 99650 | 37.8% | 16.9%(+21.0)#99 | 18.1%(+19.8)#17,232 |
| 100. | 99772 | 38.0% | 16.9%(+21.1)#100 | 18.1%(+19.9)#17,264 |
Common Questions
What are the Top 10 Zip Codes with the Lowest Poverty Level Among Children Under the Age of 5 in Alaska?
Top 10 Zip Codes with the Lowest Poverty Level Among Children Under the Age of 5 in Alaska are:
What zip code has the Lowest Poverty Level Among Children Under the Age of 5 in Alaska?
99709 has the Lowest Poverty Level Among Children Under the Age of 5 in Alaska with 2.0%.
What is the Poverty Level Among Children Under the Age of 5 in the State of Alaska?
Poverty Level Among Children Under the Age of 5 in Alaska is 16.9%.
What is the Poverty Level Among Children Under the Age of 5 in the United States?
Poverty Level Among Children Under the Age of 5 in the United States is 18.1%.