Zip Codes with the Lowest Poverty Level Among Children Under the Age of 5 in Cleveland, OH

RELATED REPORTS & OPTIONS

Lowest Poverty | Child 0-5
Population
Families and Households
Female Fertility
Female Fertility (Unmarried)
Race (Community Size)
Race (Percentage)
Ancestry (Community Size)
AfghanAfricanAlbanianAlsatianAmericanApacheArabArgentineanArmenianAustralianAustrianBahamianBangladeshiBarbadianBelgianBelizeanBhutaneseBlackfeetBrazilianBritishBritish West IndianBulgarianBurmeseCajunCambodianCanadianCape VerdeanCarpatho RusynCelticCentral AmericanCentral American IndianCherokeeChickasawChileanChippewaChoctawColombianComancheCosta RicanCreekCroatianCubanCzechCzechoslovakianDanishDelawareDominicanDutchDutch West IndianEastern EuropeanEcuadorianEgyptianEnglishEstonianEthiopianEuropeanFilipinoFinnishFrenchFrench American IndianFrench CanadianGermanGhanaianGreekGuamanian / ChamorroGuatemalanGuyaneseHaitianHonduranHungarianIcelanderIndian (Asian)IndonesianIranianIraqiIrishIroquoisIsraeliItalianJamaicanJapaneseJordanianKoreanLaotianLatvianLebaneseLiberianLithuanianLumbeeLuxembourgerMacedonianMalaysianMexicanMexican American IndianMongolianMoroccanNative HawaiianNavajoNicaraguanNigerianNorthern EuropeanNorwegianPakistaniPalestinianPanamanianParaguayanPennsylvania GermanPeruvianPolishPortuguesePuebloPuerto RicanRomanianRussianSalvadoranSamoanScandinavianScotch-IrishScottishSeminoleSerbianSierra LeoneanSiouxSlavicSlovakSloveneSomaliSouth AfricanSouth AmericanSouth American IndianSpaniardSpanishSri LankanSubsaharan AfricanSudaneseSwedishSwissSyrianThaiTrinidadian and TobagonianTurkishU.S. Virgin IslanderUgandanUkrainianUruguayanVenezuelanVietnameseWelshWest IndianYaquiYugoslavianZimbabwean
Ancestry (Percentage)
AfghanAfricanAlbanianAlsatianAmericanApacheArabArgentineanArmenianAustralianAustrianBahamianBangladeshiBarbadianBelgianBelizeanBhutaneseBlackfeetBrazilianBritishBritish West IndianBulgarianBurmeseCajunCambodianCanadianCape VerdeanCarpatho RusynCelticCentral AmericanCentral American IndianCherokeeChickasawChileanChippewaChoctawColombianComancheCosta RicanCreekCroatianCubanCzechCzechoslovakianDanishDelawareDominicanDutchDutch West IndianEastern EuropeanEcuadorianEgyptianEnglishEstonianEthiopianEuropeanFilipinoFinnishFrenchFrench American IndianFrench CanadianGermanGhanaianGreekGuamanian / ChamorroGuatemalanGuyaneseHaitianHonduranHungarianIcelanderIndian (Asian)IndonesianIranianIraqiIrishIroquoisIsraeliItalianJamaicanJapaneseJordanianKoreanLaotianLatvianLebaneseLiberianLithuanianLumbeeLuxembourgerMacedonianMalaysianMexicanMexican American IndianMongolianMoroccanNative HawaiianNavajoNicaraguanNigerianNorthern EuropeanNorwegianPakistaniPalestinianPanamanianParaguayanPennsylvania GermanPeruvianPolishPortuguesePuebloPuerto RicanRomanianRussianSalvadoranSamoanScandinavianScotch-IrishScottishSeminoleSerbianSierra LeoneanSiouxSlavicSlovakSloveneSomaliSouth AfricanSouth AmericanSouth American IndianSpaniardSpanishSri LankanSubsaharan AfricanSudaneseSwedishSwissSyrianThaiTrinidadian and TobagonianTurkishU.S. Virgin IslanderUgandanUkrainianUruguayanVenezuelanVietnameseWelshWest IndianYaquiYugoslavianZimbabwean
Immigrant Origin (Total)
AfghanistanAfricaAlbaniaArgentinaAsiaAustraliaAustriaBangladeshBarbadosBelarusBelgiumBelizeBosnia and HerzegovinaBrazilBulgariaBurma / MyanmarCambodiaCanadaCaribbeanCentral AmericaChileChinaColombiaCongoCosta RicaCroatiaCubaCzechoslovakiaDominican RepublicEastern AfricaEastern AsiaEastern EuropeEcuadorEgyptEl SalvadorEnglandEthiopiaEuropeFranceGermanyGhanaGreeceGuatemalaGuyanaHaitiHondurasHong KongHungaryIndiaIndonesiaIranIraqIrelandIsraelItalyJamaicaJapanJordanKazakhstanKenyaKoreaKuwaitLaosLatin AmericaLatviaLebanonLiberiaLithuaniaMalaysiaMexicoMiddle AfricaMoldovaMoroccoNepalNetherlandsNicaraguaNigeriaNorthern AfricaNorthern EuropeOceaniaPakistanPanamaPeruPhilippinesPolandRomaniaRussiaSaudi ArabiaScotlandSerbiaSierra LeoneSingaporeSomaliaSouth AfricaSouth AmericaSouth Central AsiaSouth Eastern AsiaSouthern EuropeSpainSri LankaSudanSwedenSyriaTaiwanThailandTrinidad and TobagoTurkeyUgandaUkraineUruguayUzbekistanVenezuelaVietnamWest IndiesWestern AfricaWestern AsiaWestern EuropeZaireZimbabwe
Immigrant Origin (Percentage)
AfghanistanAfricaAlbaniaArgentinaAsiaAustraliaAustriaBangladeshBarbadosBelarusBelgiumBelizeBosnia and HerzegovinaBrazilBulgariaBurma / MyanmarCambodiaCanadaCaribbeanCentral AmericaChileChinaColombiaCongoCosta RicaCroatiaCubaCzechoslovakiaDominican RepublicEastern AfricaEastern AsiaEastern EuropeEcuadorEgyptEl SalvadorEnglandEthiopiaEuropeFranceGermanyGhanaGreeceGuatemalaGuyanaHaitiHondurasHong KongHungaryIndiaIndonesiaIranIraqIrelandIsraelItalyJamaicaJapanJordanKazakhstanKenyaKoreaKuwaitLaosLatin AmericaLatviaLebanonLiberiaLithuaniaMalaysiaMexicoMiddle AfricaMoldovaMoroccoNepalNetherlandsNicaraguaNigeriaNorthern AfricaNorthern EuropeOceaniaPakistanPanamaPeruPhilippinesPolandRomaniaRussiaSaudi ArabiaScotlandSerbiaSierra LeoneSingaporeSomaliaSouth AfricaSouth AmericaSouth Central AsiaSouth Eastern AsiaSouthern EuropeSpainSri LankaSudanSwedenSyriaTaiwanThailandTrinidad and TobagoTurkeyUgandaUkraineUruguayUzbekistanVenezuelaVietnamWest IndiesWestern AfricaWestern AsiaWestern EuropeZaireZimbabwe
Income
Income (Families)
Income (Households)
Poverty
Poverty (Families)
Unemployment
Employment Occupations
Employment Industries
Employer Class
Commute Time
Commute Means
School Enrollment
Education by Degree Field
Occupancy
Finances
Physical Characteristics
Cleveland
Compare Zip Codes
Comparison Subject

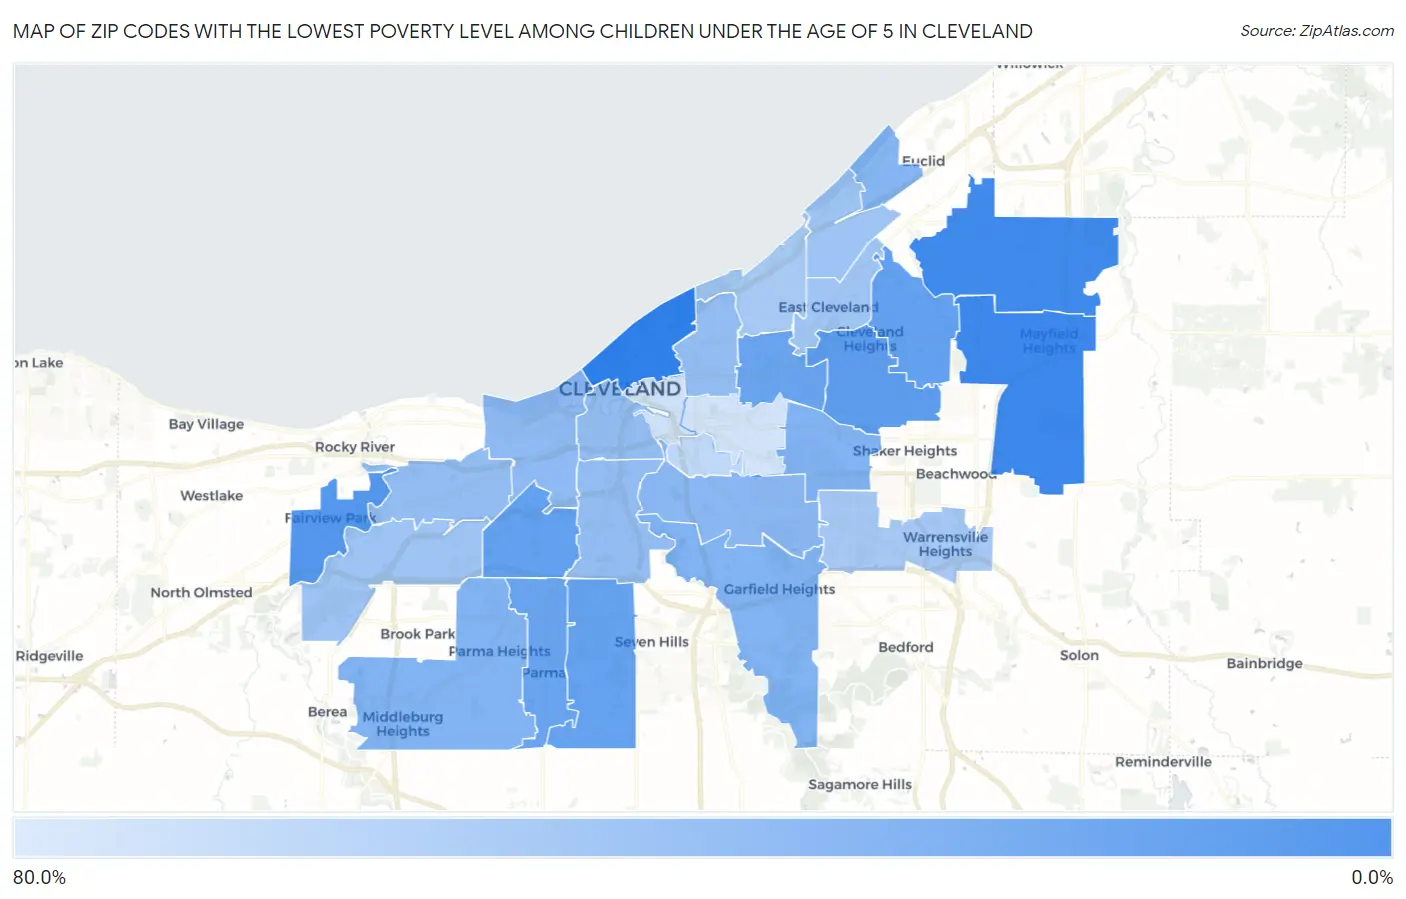
Map of Zip Codes with the Lowest Poverty Level Among Children Under the Age of 5 in Cleveland

80.0%
0.0%
Zip Codes with the Lowest Poverty Level Among Children Under the Age of 5 in Cleveland Map

Zip Codes with the Lowest Poverty Level Among Children Under the Age of 5 in Cleveland, OH

Zip Code Child Poverty vs State vs National
1.441243.8%20.7%(-16.8)#8618.1%(-14.2)#2,035
2.441435.7%20.7%(-15.0)#13818.1%(-12.4)#3,386
3.4412613.4%20.7%(-7.28)#32418.1%(-4.68)#8,282
4.4411817.7%20.7%(-2.97)#41718.1%(-0.361)#10,568
5.4412119.6%20.7%(-1.10)#45018.1%(+1.50)#11,431
6.4414419.6%20.7%(-1.03)#45218.1%(+1.57)#11,461
7.4413420.1%20.7%(-0.542)#46718.1%(+2.06)#11,708
8.4410622.7%20.7%(+2.07)#50518.1%(+4.67)#12,807
9.4412923.1%20.7%(+2.41)#51318.1%(+5.01)#12,926
10.4412032.9%20.7%(+12.3)#62918.1%(+14.9)#16,069
11.4412533.2%20.7%(+12.5)#63118.1%(+15.1)#16,121
12.4413033.7%20.7%(+13.0)#63718.1%(+15.6)#16,291
13.4411935.8%20.7%(+15.1)#66718.1%(+17.7)#16,806
14.4410538.1%20.7%(+17.4)#69118.1%(+20.0)#17,274
15.4410239.5%20.7%(+18.8)#70018.1%(+21.4)#17,553
16.4411341.9%20.7%(+21.2)#71518.1%(+23.8)#17,998
17.4411142.1%20.7%(+21.4)#71718.1%(+24.1)#18,035
18.4410342.5%20.7%(+21.8)#72018.1%(+24.4)#18,104
19.4410942.7%20.7%(+22.0)#72218.1%(+24.6)#18,136
20.4413547.9%20.7%(+27.2)#75618.1%(+29.8)#18,850
21.4411048.1%20.7%(+27.4)#75918.1%(+30.0)#18,869
22.4411250.0%20.7%(+29.4)#77718.1%(+32.0)#19,156
23.4412852.7%20.7%(+32.1)#78818.1%(+34.7)#19,396
24.4410853.8%20.7%(+33.2)#79318.1%(+35.8)#19,513
25.4412768.2%20.7%(+47.5)#83018.1%(+50.1)#20,451
26.4411576.7%20.7%(+56.0)#84518.1%(+58.6)#20,763
27.4410478.3%20.7%(+57.6)#84818.1%(+60.2)#20,809

Common Questions

What are the Top 10 Zip Codes with the Lowest Poverty Level Among Children Under the Age of 5 in Cleveland, OH?
Top 10 Zip Codes with the Lowest Poverty Level Among Children Under the Age of 5 in Cleveland, OH are:
#1
0.0%
#2
3.8%
#3
5.7%
#4
13.4%
#5
17.7%
#6
19.6%
#7
19.6%
#8
20.1%
#9
22.7%
#10
23.1%
What zip code has the Lowest Poverty Level Among Children Under the Age of 5 in Cleveland, OH?
44124 has the Lowest Poverty Level Among Children Under the Age of 5 in Cleveland, OH with 3.8%.
What is the Poverty Level Among Children Under the Age of 5 in Cleveland, OH?
Poverty Level Among Children Under the Age of 5 in Cleveland is 48.8%.
What is the Poverty Level Among Children Under the Age of 5 in Ohio?
Poverty Level Among Children Under the Age of 5 in Ohio is 20.7%.
What is the Poverty Level Among Children Under the Age of 5 in the United States?
Poverty Level Among Children Under the Age of 5 in the United States is 18.1%.