Zip Codes with the Highest Percentage of Population Employed in Architecture & Engineering in Joliet, IL
RELATED REPORTS & OPTIONS
Architecture & Engineering
Joliet
Compare Zip Codes
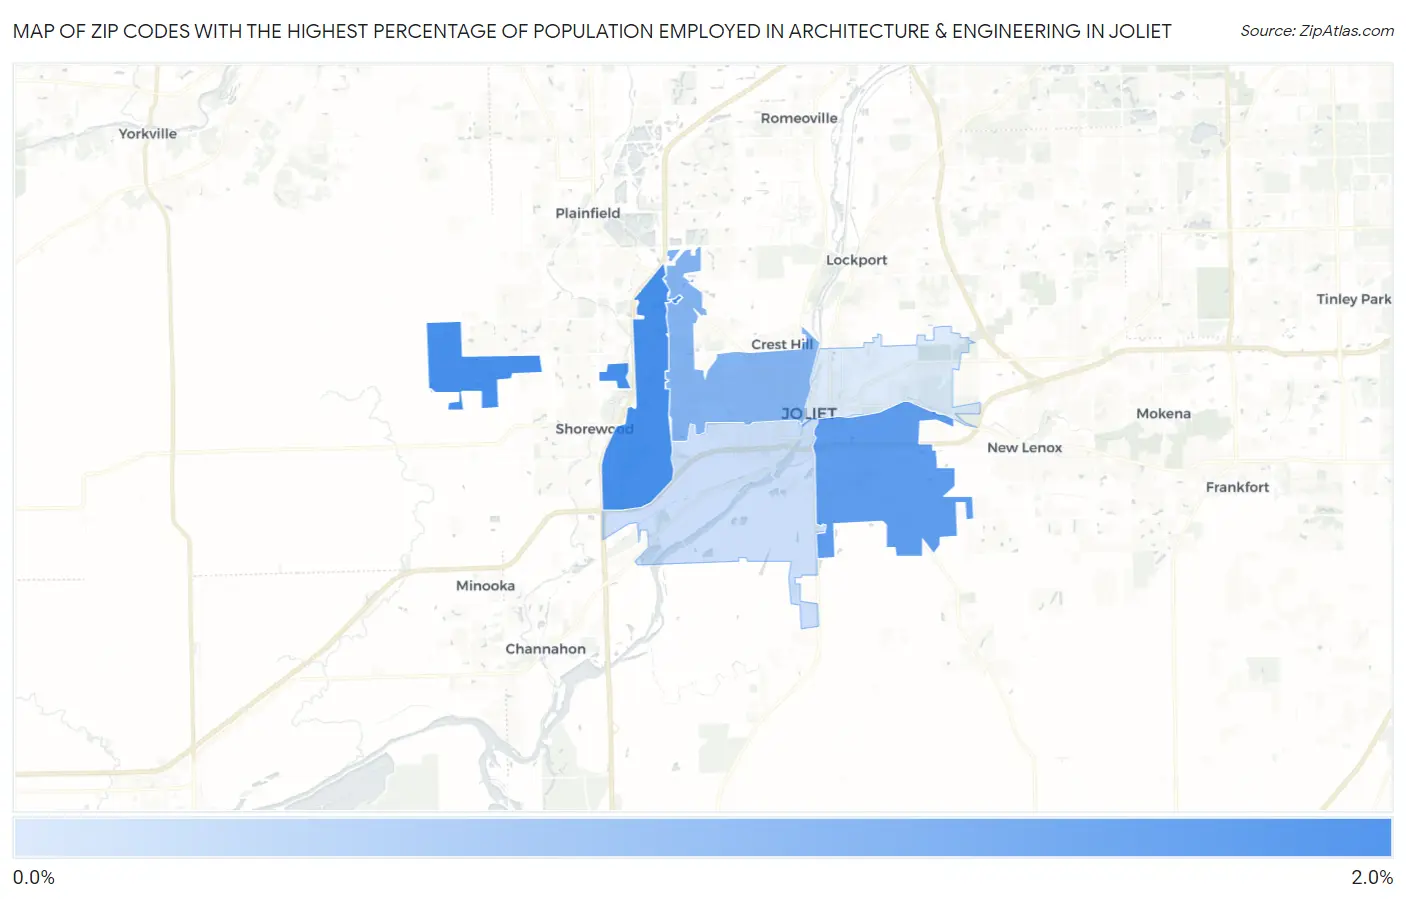
Map of Zip Codes with the Highest Percentage of Population Employed in Architecture & Engineering in Joliet
0.0%
2.0%
Zip Codes with the Highest Percentage of Population Employed in Architecture & Engineering in Joliet, IL
| Zip Code | % Employed | vs State | vs National | |
| 1. | 60431 | 1.9% | 1.9%(+0.011)#418 | 2.1%(-0.244)#10,204 |
| 2. | 60433 | 1.7% | 1.9%(-0.233)#500 | 2.1%(-0.488)#11,760 |
| 3. | 60435 | 1.3% | 1.9%(-0.620)#609 | 2.1%(-0.875)#14,498 |
| 4. | 60436 | 0.53% | 1.9%(-1.36)#873 | 2.1%(-1.62)#20,067 |
| 5. | 60432 | 0.33% | 1.9%(-1.56)#933 | 2.1%(-1.82)#21,373 |
1
Common Questions
What are the Top 3 Zip Codes with the Highest Percentage of Population Employed in Architecture & Engineering in Joliet, IL?
Top 3 Zip Codes with the Highest Percentage of Population Employed in Architecture & Engineering in Joliet, IL are:
What zip code has the Highest Percentage of Population Employed in Architecture & Engineering in Joliet, IL?
60431 has the Highest Percentage of Population Employed in Architecture & Engineering in Joliet, IL with 1.9%.
What is the Percentage of Population Employed in Architecture & Engineering in Joliet, IL?
Percentage of Population Employed in Architecture & Engineering in Joliet is 1.5%.
What is the Percentage of Population Employed in Architecture & Engineering in Illinois?
Percentage of Population Employed in Architecture & Engineering in Illinois is 1.9%.
What is the Percentage of Population Employed in Architecture & Engineering in the United States?
Percentage of Population Employed in Architecture & Engineering in the United States is 2.1%.