Zip Codes with the Highest Percentage of Population Employed in Architecture & Engineering in Urbana, IL
RELATED REPORTS & OPTIONS
Architecture & Engineering
Urbana
Compare Zip Codes
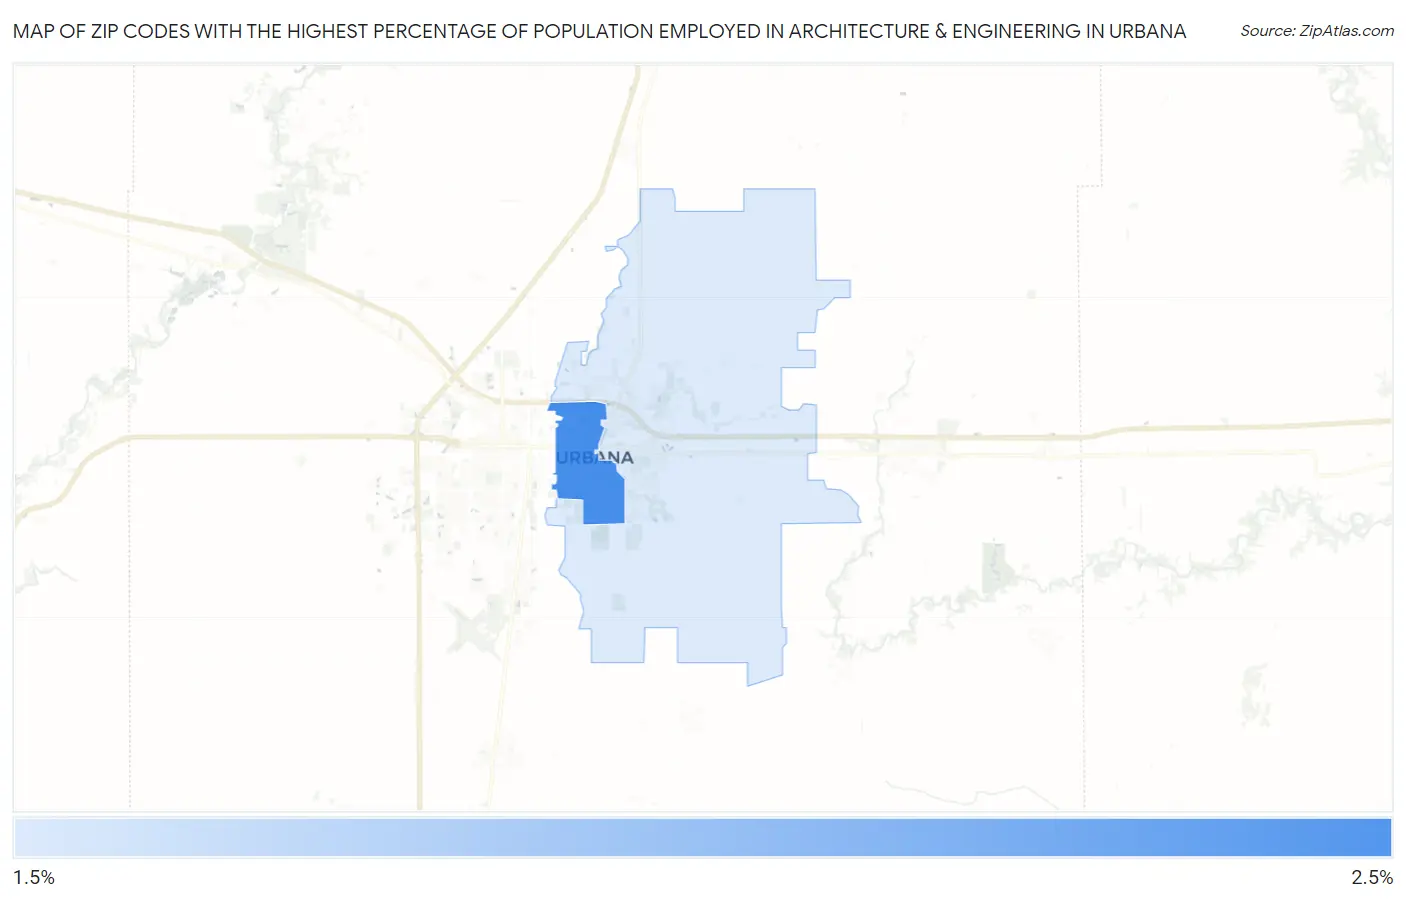
Map of Zip Codes with the Highest Percentage of Population Employed in Architecture & Engineering in Urbana
0.0%
2.5%
Zip Codes with the Highest Percentage of Population Employed in Architecture & Engineering in Urbana, IL
| Zip Code | % Employed | vs State | vs National | |
| 1. | 61801 | 2.3% | 1.9%(+0.382)#312 | 2.1%(+0.127)#8,066 |
| 2. | 61802 | 1.6% | 1.9%(-0.245)#503 | 2.1%(-0.500)#11,825 |
1
Common Questions
What are the Top Zip Codes with the Highest Percentage of Population Employed in Architecture & Engineering in Urbana, IL?
Top Zip Codes with the Highest Percentage of Population Employed in Architecture & Engineering in Urbana, IL are:
What zip code has the Highest Percentage of Population Employed in Architecture & Engineering in Urbana, IL?
61801 has the Highest Percentage of Population Employed in Architecture & Engineering in Urbana, IL with 2.3%.
What is the Percentage of Population Employed in Architecture & Engineering in Urbana, IL?
Percentage of Population Employed in Architecture & Engineering in Urbana is 2.2%.
What is the Percentage of Population Employed in Architecture & Engineering in Illinois?
Percentage of Population Employed in Architecture & Engineering in Illinois is 1.9%.
What is the Percentage of Population Employed in Architecture & Engineering in the United States?
Percentage of Population Employed in Architecture & Engineering in the United States is 2.1%.