Zip Codes with the Highest Percentage of Population Employed in Architecture & Engineering in Danville, IL
RELATED REPORTS & OPTIONS
Architecture & Engineering
Danville
Compare Zip Codes
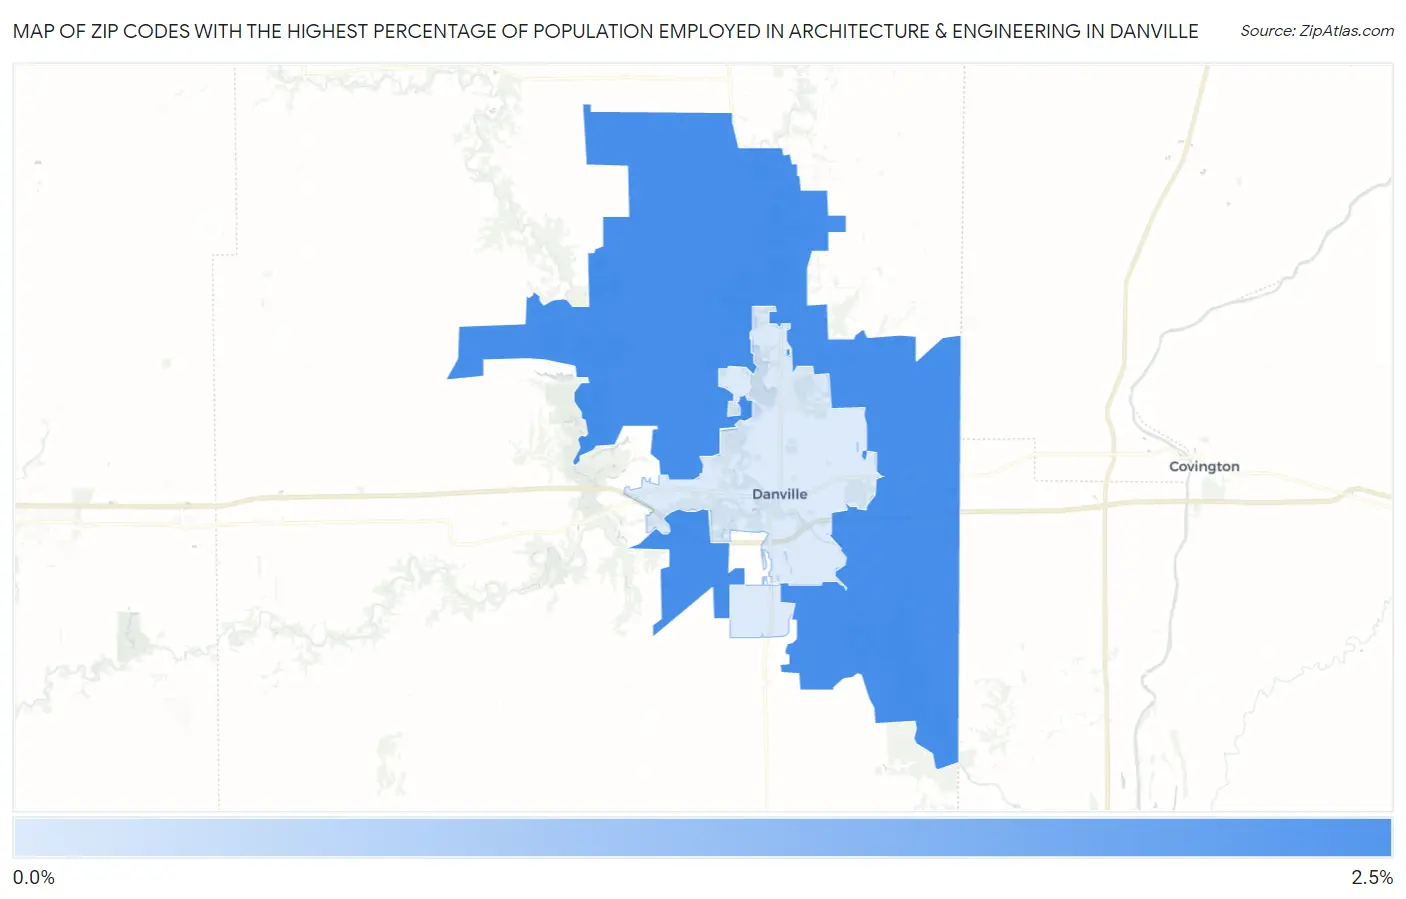
Map of Zip Codes with the Highest Percentage of Population Employed in Architecture & Engineering in Danville
0.0%
2.5%
Zip Codes with the Highest Percentage of Population Employed in Architecture & Engineering in Danville, IL
| Zip Code | % Employed | vs State | vs National | |
| 1. | 61834 | 2.1% | 1.9%(+0.186)#368 | 2.1%(-0.069)#9,156 |
| 2. | 61832 | 0.33% | 1.9%(-1.56)#932 | 2.1%(-1.81)#21,364 |
1
Common Questions
What are the Top Zip Codes with the Highest Percentage of Population Employed in Architecture & Engineering in Danville, IL?
Top Zip Codes with the Highest Percentage of Population Employed in Architecture & Engineering in Danville, IL are:
What zip code has the Highest Percentage of Population Employed in Architecture & Engineering in Danville, IL?
61834 has the Highest Percentage of Population Employed in Architecture & Engineering in Danville, IL with 2.1%.
What is the Percentage of Population Employed in Architecture & Engineering in Danville, IL?
Percentage of Population Employed in Architecture & Engineering in Danville is 0.25%.
What is the Percentage of Population Employed in Architecture & Engineering in Illinois?
Percentage of Population Employed in Architecture & Engineering in Illinois is 1.9%.
What is the Percentage of Population Employed in Architecture & Engineering in the United States?
Percentage of Population Employed in Architecture & Engineering in the United States is 2.1%.