Zip Codes with the Highest Percentage of Population Employed in Architecture & Engineering in Waukegan, IL
RELATED REPORTS & OPTIONS
Architecture & Engineering
Waukegan
Compare Zip Codes
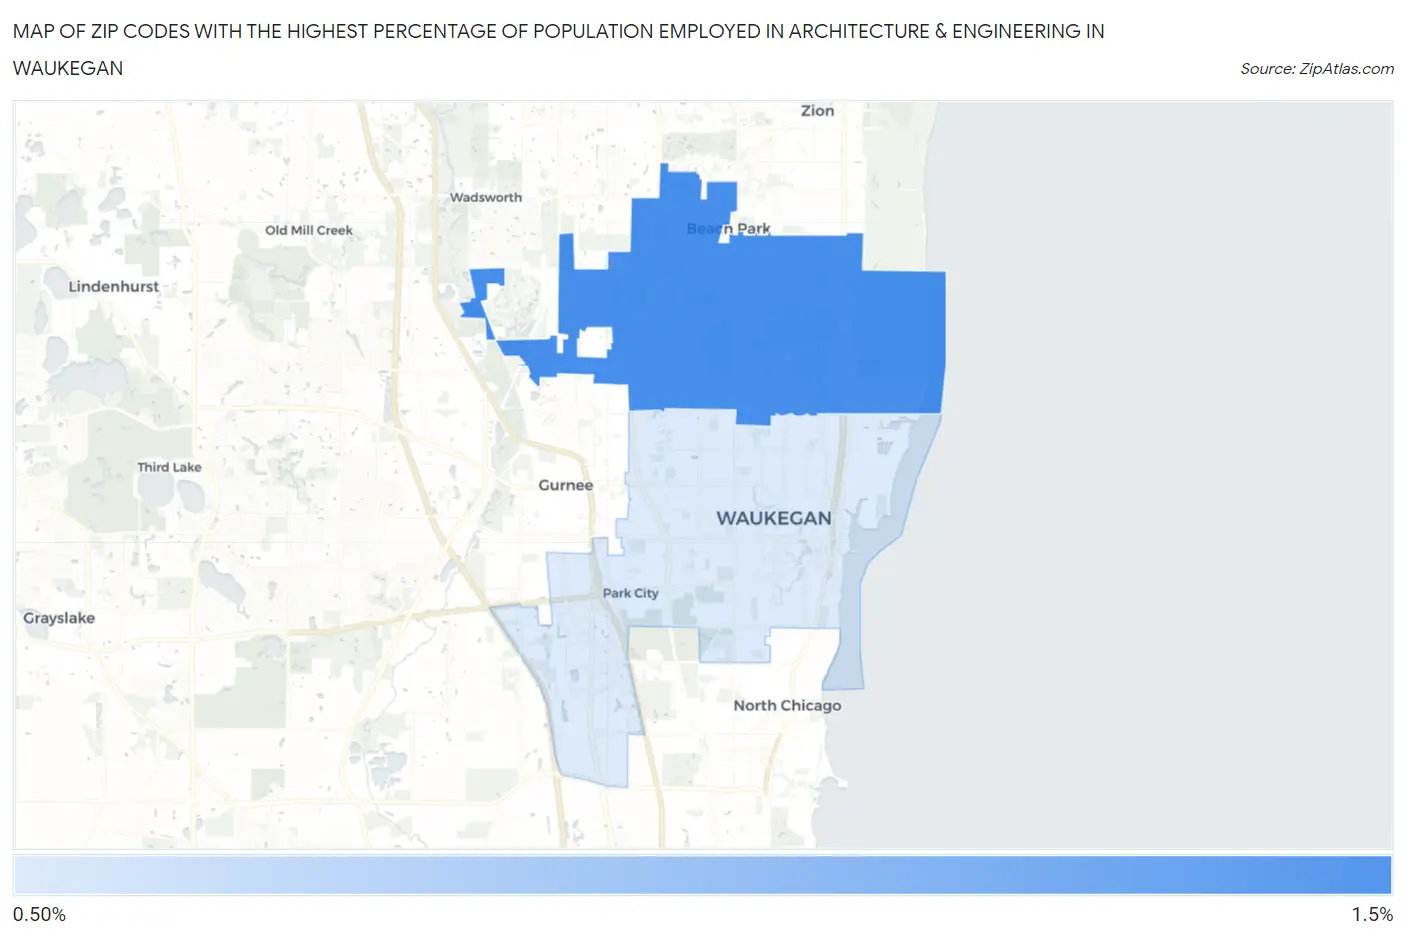
Map of Zip Codes with the Highest Percentage of Population Employed in Architecture & Engineering in Waukegan
0.0%
1.5%
Zip Codes with the Highest Percentage of Population Employed in Architecture & Engineering in Waukegan, IL
| Zip Code | % Employed | vs State | vs National | |
| 1. | 60087 | 1.3% | 1.9%(-0.566)#592 | 2.1%(-0.821)#14,111 |
| 2. | 60085 | 1.2% | 1.9%(-0.724)#642 | 2.1%(-0.979)#15,322 |
1
Common Questions
What are the Top Zip Codes with the Highest Percentage of Population Employed in Architecture & Engineering in Waukegan, IL?
Top Zip Codes with the Highest Percentage of Population Employed in Architecture & Engineering in Waukegan, IL are:
What zip code has the Highest Percentage of Population Employed in Architecture & Engineering in Waukegan, IL?
60087 has the Highest Percentage of Population Employed in Architecture & Engineering in Waukegan, IL with 1.3%.
What is the Percentage of Population Employed in Architecture & Engineering in Waukegan, IL?
Percentage of Population Employed in Architecture & Engineering in Waukegan is 1.4%.
What is the Percentage of Population Employed in Architecture & Engineering in Illinois?
Percentage of Population Employed in Architecture & Engineering in Illinois is 1.9%.
What is the Percentage of Population Employed in Architecture & Engineering in the United States?
Percentage of Population Employed in Architecture & Engineering in the United States is 2.1%.