Zip Codes with the Highest Percentage of Population Employed in Architecture & Engineering in Aurora, IL
RELATED REPORTS & OPTIONS
Architecture & Engineering
Aurora
Compare Zip Codes
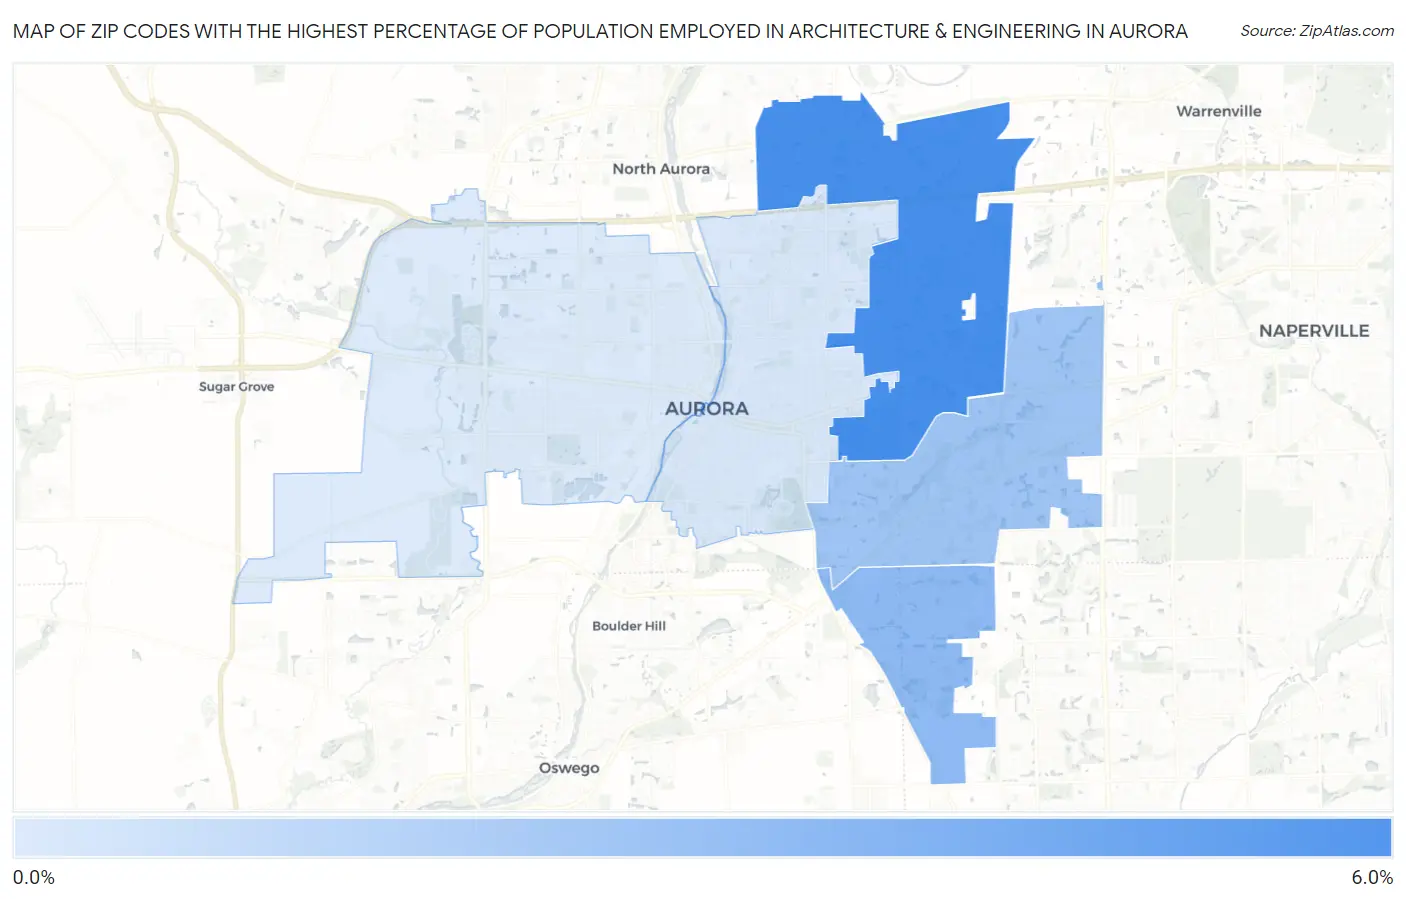
Map of Zip Codes with the Highest Percentage of Population Employed in Architecture & Engineering in Aurora
0.0%
6.0%
Zip Codes with the Highest Percentage of Population Employed in Architecture & Engineering in Aurora, IL
| Zip Code | % Employed | vs State | vs National | |
| 1. | 60502 | 6.0% | 1.9%(+4.10)#33 | 2.1%(+3.84)#1,083 |
| 2. | 60503 | 3.3% | 1.9%(+1.41)#153 | 2.1%(+1.16)#4,183 |
| 3. | 60504 | 2.7% | 1.9%(+0.807)#237 | 2.1%(+0.552)#6,154 |
| 4. | 60505 | 0.59% | 1.9%(-1.30)#860 | 2.1%(-1.56)#19,666 |
| 5. | 60506 | 0.43% | 1.9%(-1.47)#904 | 2.1%(-1.72)#20,757 |
1
Common Questions
What are the Top 3 Zip Codes with the Highest Percentage of Population Employed in Architecture & Engineering in Aurora, IL?
Top 3 Zip Codes with the Highest Percentage of Population Employed in Architecture & Engineering in Aurora, IL are:
What zip code has the Highest Percentage of Population Employed in Architecture & Engineering in Aurora, IL?
60502 has the Highest Percentage of Population Employed in Architecture & Engineering in Aurora, IL with 6.0%.
What is the Percentage of Population Employed in Architecture & Engineering in Aurora, IL?
Percentage of Population Employed in Architecture & Engineering in Aurora is 2.0%.
What is the Percentage of Population Employed in Architecture & Engineering in Illinois?
Percentage of Population Employed in Architecture & Engineering in Illinois is 1.9%.
What is the Percentage of Population Employed in Architecture & Engineering in the United States?
Percentage of Population Employed in Architecture & Engineering in the United States is 2.1%.