Pinehurst, ID
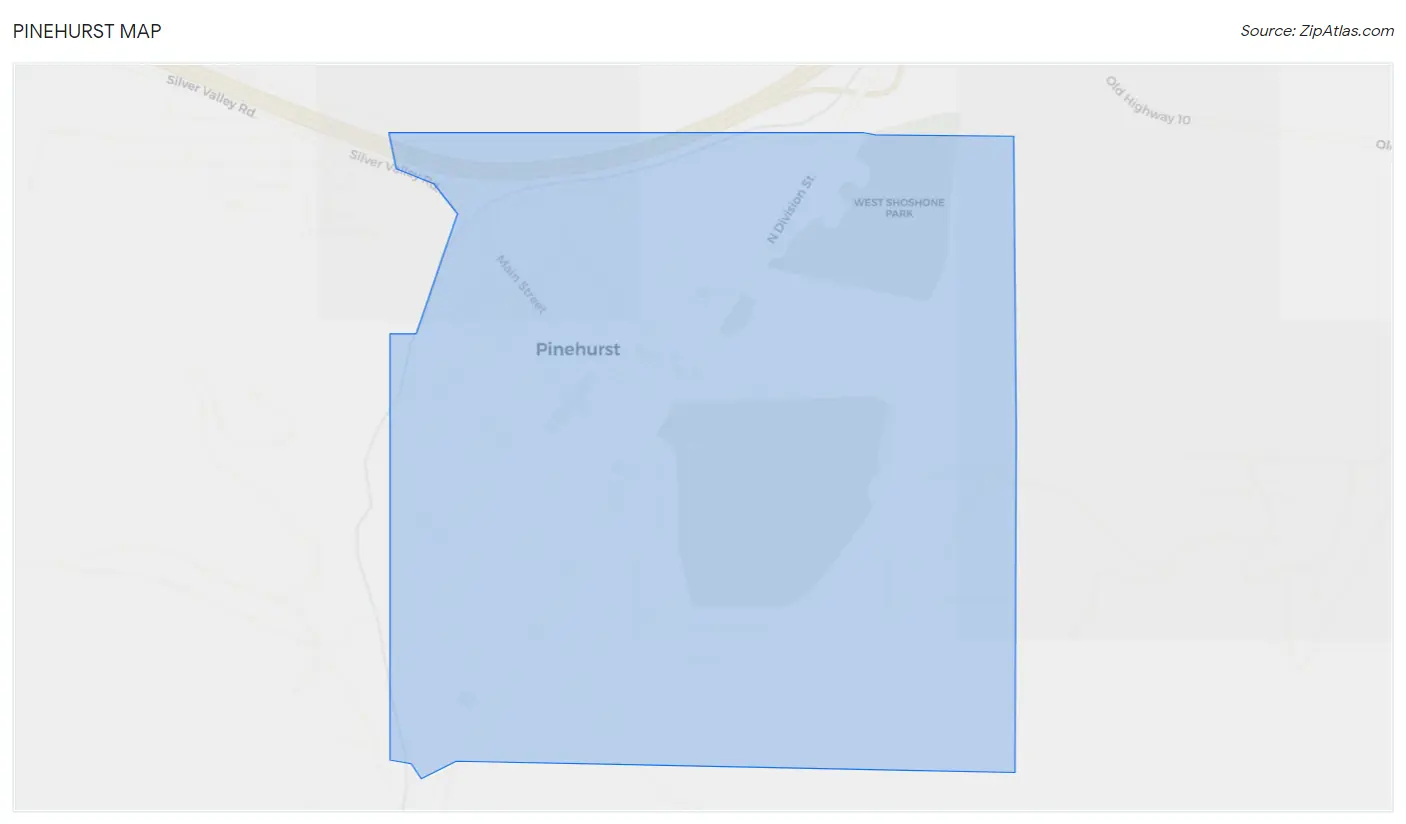
Pinehurst Map
Pinehurst Overview
1,993
TOTAL POPULATION
1,010
MALE POPULATION
983
FEMALE POPULATION
102.75
MALES / 100 FEMALES
97.33
FEMALES / 100 MALES
38.3
MEDIAN AGE
3.5
AVG FAMILY SIZE
2.8
AVG HOUSEHOLD SIZE
$28,339
PER CAPITA INCOME
$71,161
AVG FAMILY INCOME
$52,109
AVG HOUSEHOLD INCOME
39.6%
WAGE / INCOME GAP [ % ]
60.4¢/ $1
WAGE / INCOME GAP [ $ ]
0.42
INEQUALITY / GINI INDEX
859
LABOR FORCE [ PEOPLE ]
54.9%
PERCENT IN LABOR FORCE
4.0%
UNEMPLOYMENT RATE
Pinehurst Zip Codes
Pinehurst Area Codes
Race in Pinehurst
The most populous races in Pinehurst are White / Caucasian (1,711 | 85.9%), Two or more Races (228 | 11.4%), and Hispanic or Latino (168 | 8.4%).
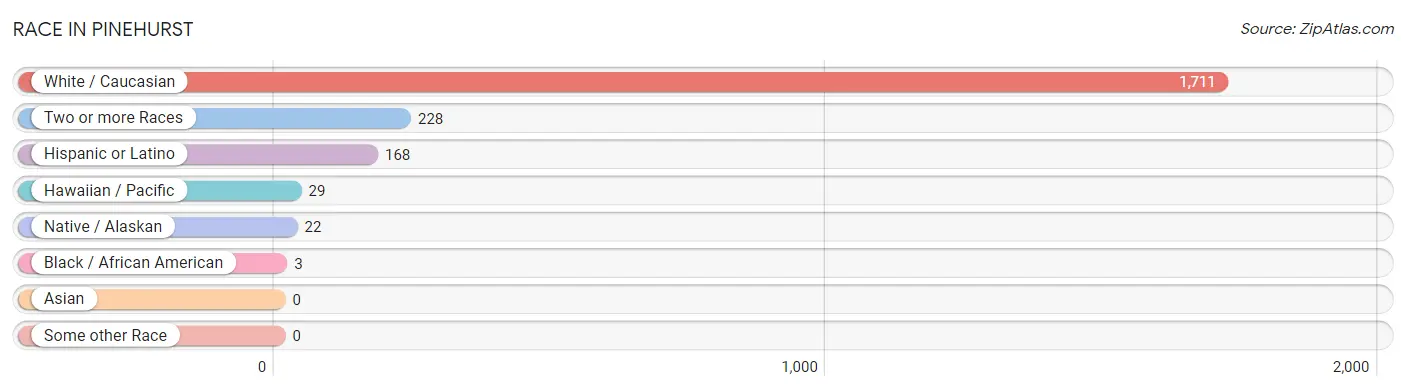
| Race | # Population | % Population |
| Asian | 0 | 0.0% |
| Black / African American | 3 | 0.2% |
| Hawaiian / Pacific | 29 | 1.5% |
| Hispanic or Latino | 168 | 8.4% |
| Native / Alaskan | 22 | 1.1% |
| White / Caucasian | 1,711 | 85.9% |
| Two or more Races | 228 | 11.4% |
| Some other Race | 0 | 0.0% |
| Total | 1,993 | 100.0% |
Ancestry in Pinehurst
The most populous ancestries reported in Pinehurst are German (450 | 22.6%), English (293 | 14.7%), Irish (227 | 11.4%), Mexican (112 | 5.6%), and Finnish (89 | 4.5%), together accounting for 58.8% of all Pinehurst residents.
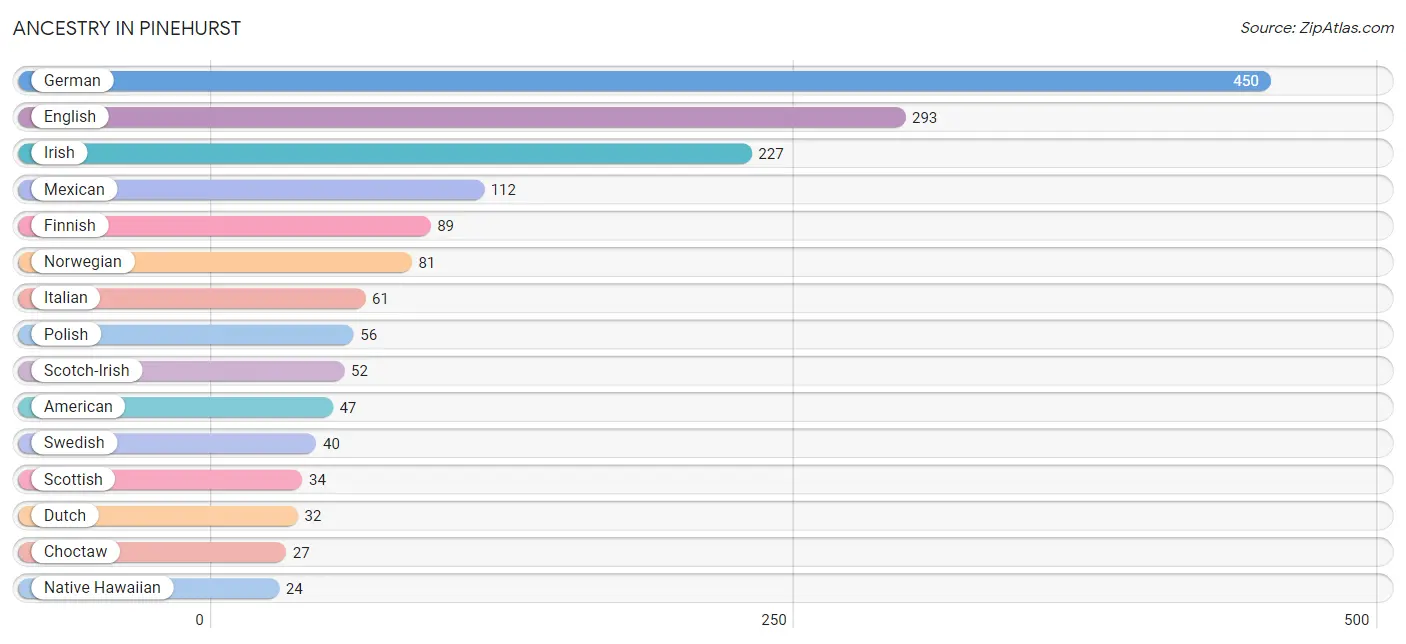
| Ancestry | # Population | % Population |
| American | 47 | 2.4% |
| Austrian | 9 | 0.4% |
| British | 14 | 0.7% |
| Canadian | 17 | 0.9% |
| Cherokee | 21 | 1.1% |
| Chippewa | 11 | 0.5% |
| Choctaw | 27 | 1.3% |
| Danish | 6 | 0.3% |
| Dutch | 32 | 1.6% |
| Eastern European | 15 | 0.7% |
| English | 293 | 14.7% |
| Finnish | 89 | 4.5% |
| French | 21 | 1.1% |
| French Canadian | 17 | 0.9% |
| German | 450 | 22.6% |
| Irish | 227 | 11.4% |
| Italian | 61 | 3.1% |
| Mexican | 112 | 5.6% |
| Native Hawaiian | 24 | 1.2% |
| Norwegian | 81 | 4.1% |
| Polish | 56 | 2.8% |
| Portuguese | 6 | 0.3% |
| Russian | 9 | 0.4% |
| Scandinavian | 9 | 0.4% |
| Scotch-Irish | 52 | 2.6% |
| Scottish | 34 | 1.7% |
| Swedish | 40 | 2.0% |
| Swiss | 3 | 0.2% |
| Welsh | 13 | 0.6% | View All 29 Rows |
Immigrants in Pinehurst
The most numerous immigrant groups reported in Pinehurst came from Canada (5 | 0.3%), Europe (2 | 0.1%), and Northern Europe (2 | 0.1%), together accounting for 0.5% of all Pinehurst residents.
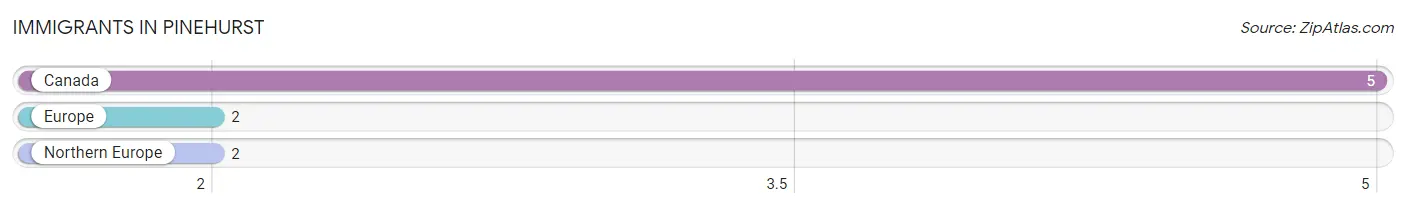
| Immigration Origin | # Population | % Population |
| Canada | 5 | 0.3% |
| Europe | 2 | 0.1% |
| Northern Europe | 2 | 0.1% | View All 3 Rows |
Sex and Age in Pinehurst
Sex and Age in Pinehurst
The most populous age groups in Pinehurst are 35 to 39 Years (131 | 13.0%) for men and 55 to 59 Years (101 | 10.3%) for women.
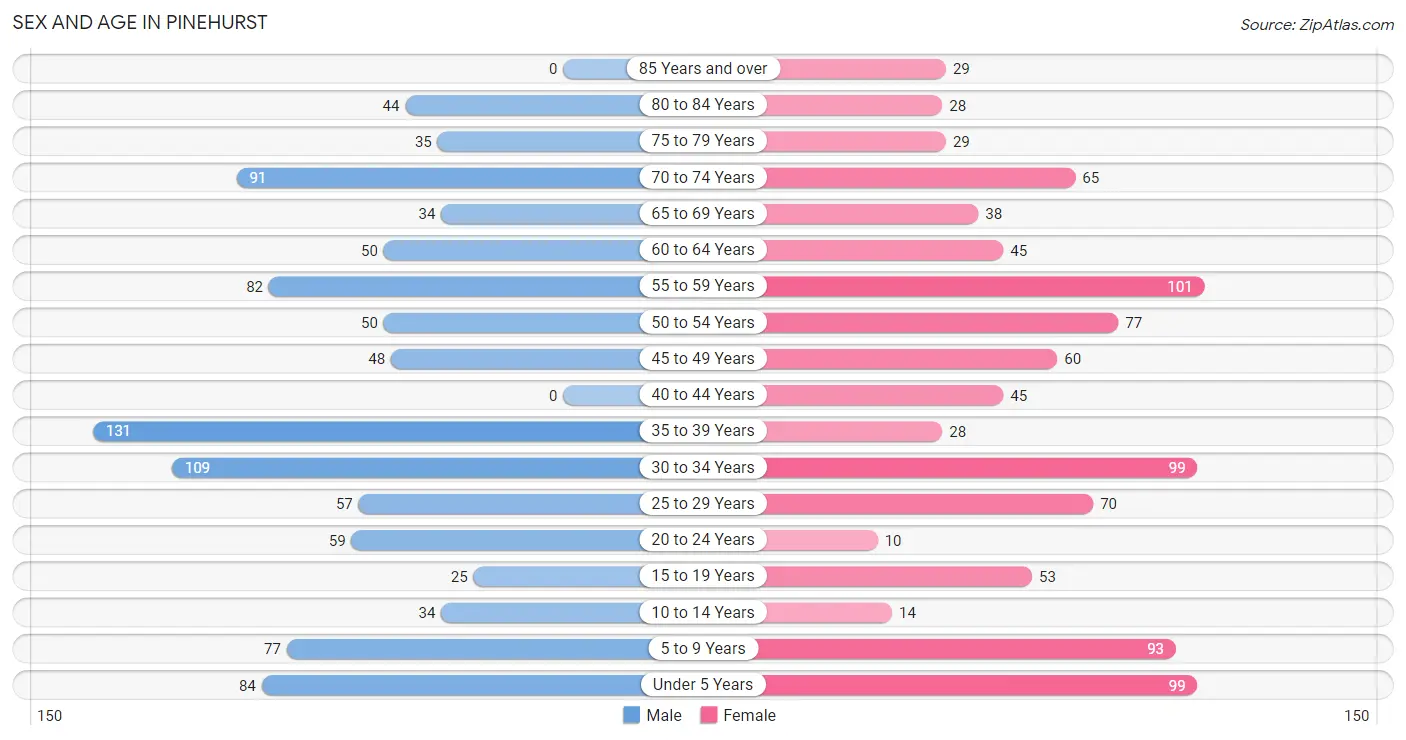
| Age Bracket | Male | Female |
| Under 5 Years | 84 (8.3%) | 99 (10.1%) |
| 5 to 9 Years | 77 (7.6%) | 93 (9.5%) |
| 10 to 14 Years | 34 (3.4%) | 14 (1.4%) |
| 15 to 19 Years | 25 (2.5%) | 53 (5.4%) |
| 20 to 24 Years | 59 (5.8%) | 10 (1.0%) |
| 25 to 29 Years | 57 (5.6%) | 70 (7.1%) |
| 30 to 34 Years | 109 (10.8%) | 99 (10.1%) |
| 35 to 39 Years | 131 (13.0%) | 28 (2.9%) |
| 40 to 44 Years | 0 (0.0%) | 45 (4.6%) |
| 45 to 49 Years | 48 (4.8%) | 60 (6.1%) |
| 50 to 54 Years | 50 (5.0%) | 77 (7.8%) |
| 55 to 59 Years | 82 (8.1%) | 101 (10.3%) |
| 60 to 64 Years | 50 (5.0%) | 45 (4.6%) |
| 65 to 69 Years | 34 (3.4%) | 38 (3.9%) |
| 70 to 74 Years | 91 (9.0%) | 65 (6.6%) |
| 75 to 79 Years | 35 (3.5%) | 29 (2.9%) |
| 80 to 84 Years | 44 (4.4%) | 28 (2.9%) |
| 85 Years and over | 0 (0.0%) | 29 (2.9%) |
| Total | 1,010 (100.0%) | 983 (100.0%) |
Families and Households in Pinehurst
Median Family Size in Pinehurst
The median family size in Pinehurst is 3.54 persons per family, with single female/mother families (60 | 14.0%) accounting for the largest median family size of 4.48 persons per family. On the other hand, married-couple families (324 | 75.7%) represent the smallest median family size with 3.36 persons per family.
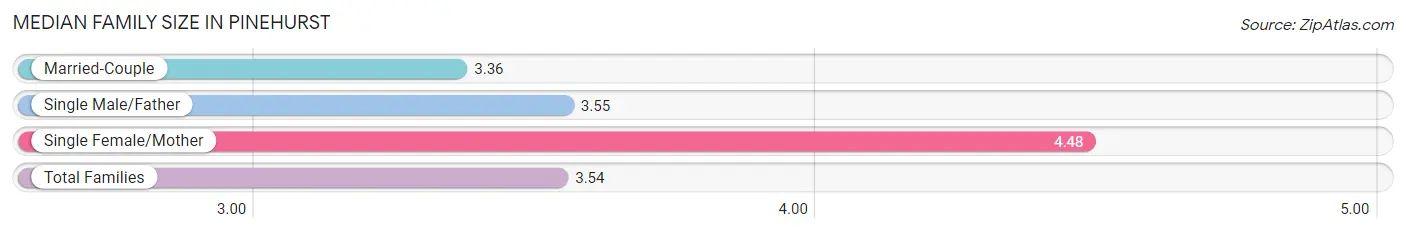
| Family Type | # Families | Family Size |
| Married-Couple | 324 (75.7%) | 3.36 |
| Single Male/Father | 44 (10.3%) | 3.55 |
| Single Female/Mother | 60 (14.0%) | 4.48 |
| Total Families | 428 (100.0%) | 3.54 |
Median Household Size in Pinehurst
The median household size in Pinehurst is 2.77 persons per household, with single female/mother households (60 | 8.3%) accounting for the largest median household size of 5.2 persons per household. non-family households (291 | 40.5%) represent the smallest median household size with 1.32 persons per household.
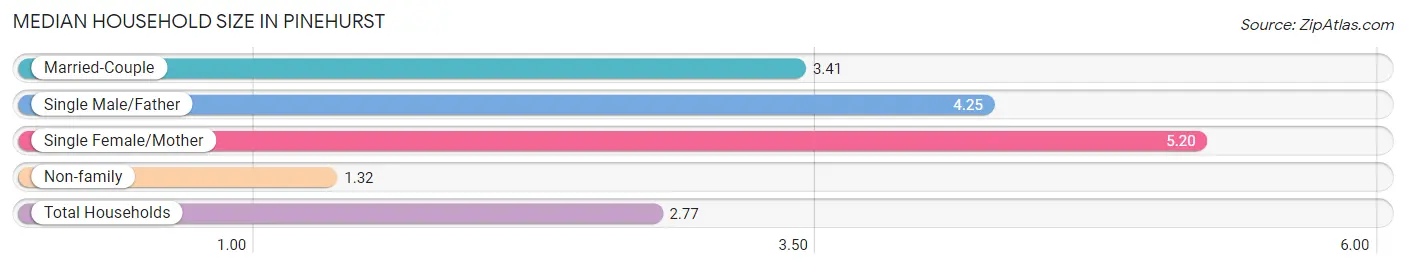
| Household Type | # Households | Household Size |
| Married-Couple | 324 (45.1%) | 3.41 |
| Single Male/Father | 44 (6.1%) | 4.25 |
| Single Female/Mother | 60 (8.3%) | 5.20 |
| Non-family | 291 (40.5%) | 1.32 |
| Total Households | 719 (100.0%) | 2.77 |
Household Size by Marriage Status in Pinehurst
Out of a total of 719 households in Pinehurst, 428 (59.5%) are family households, while 291 (40.5%) are nonfamily households. The most numerous type of family households are 2-person households, comprising 185, and the most common type of nonfamily households are 1-person households, comprising 200.
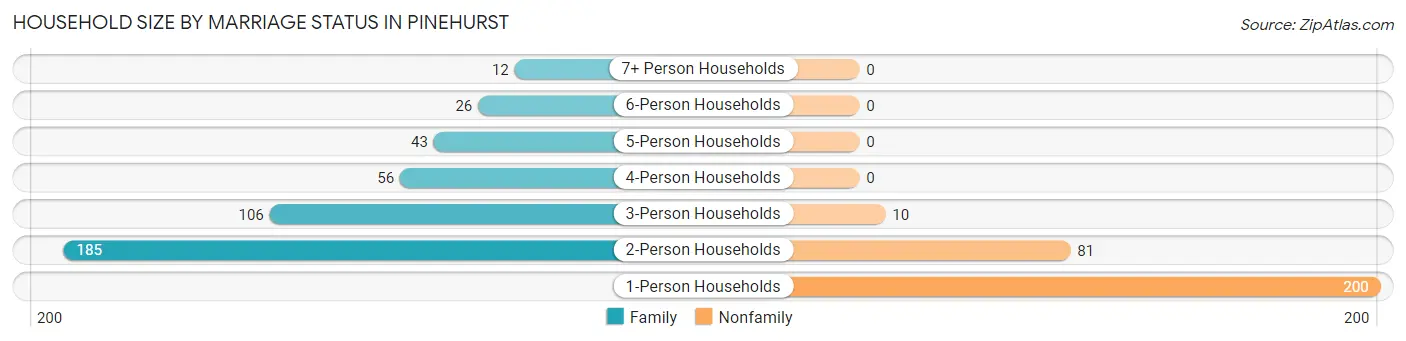
| Household Size | Family Households | Nonfamily Households |
| 1-Person Households | - | 200 (27.8%) |
| 2-Person Households | 185 (25.7%) | 81 (11.3%) |
| 3-Person Households | 106 (14.7%) | 10 (1.4%) |
| 4-Person Households | 56 (7.8%) | 0 (0.0%) |
| 5-Person Households | 43 (6.0%) | 0 (0.0%) |
| 6-Person Households | 26 (3.6%) | 0 (0.0%) |
| 7+ Person Households | 12 (1.7%) | 0 (0.0%) |
| Total | 428 (59.5%) | 291 (40.5%) |
Female Fertility in Pinehurst
Fertility by Age in Pinehurst
Average fertility rate in Pinehurst is 31.0 births per 1,000 women. Women in the age bracket of 20 to 34 years have the highest fertility rate with 67.0 births per 1,000 women. Women in the age bracket of 20 to 34 years acount for 100.0% of all women with births.
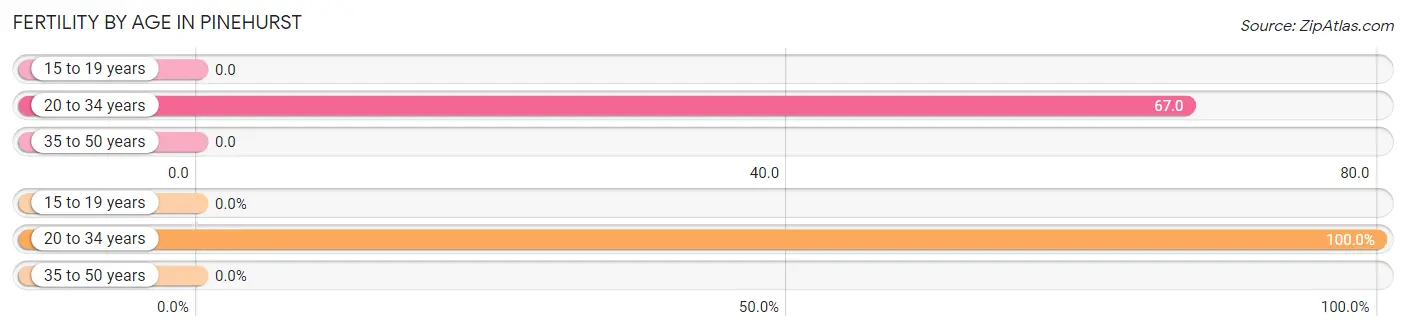
| Age Bracket | Women with Births | Births / 1,000 Women |
| 15 to 19 years | 0 (0.0%) | 0.0 |
| 20 to 34 years | 12 (100.0%) | 67.0 |
| 35 to 50 years | 0 (0.0%) | 0.0 |
| Total | 12 (100.0%) | 31.0 |
Fertility by Age by Marriage Status in Pinehurst
25.0% of women with births (12) in Pinehurst are married. The highest percentage of unmarried women with births falls into 20 to 34 years age bracket with 75.0% of them unmarried at the time of birth, while the lowest percentage of unmarried women with births belong to 20 to 34 years age bracket with 75.0% of them unmarried.
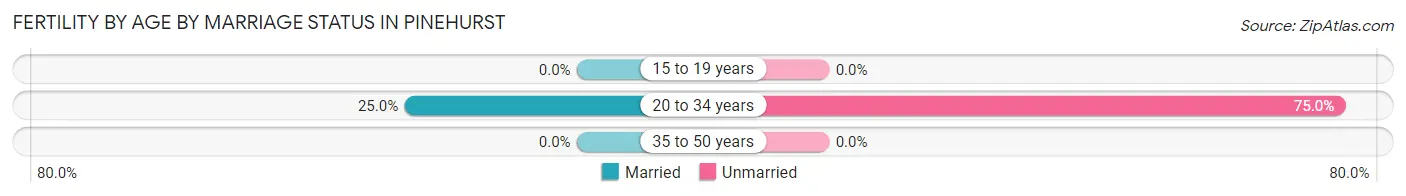
| Age Bracket | Married | Unmarried |
| 15 to 19 years | 0 (0.0%) | 0 (0.0%) |
| 20 to 34 years | 3 (25.0%) | 9 (75.0%) |
| 35 to 50 years | 0 (0.0%) | 0 (0.0%) |
| Total | 3 (25.0%) | 9 (75.0%) |
Fertility by Education in Pinehurst
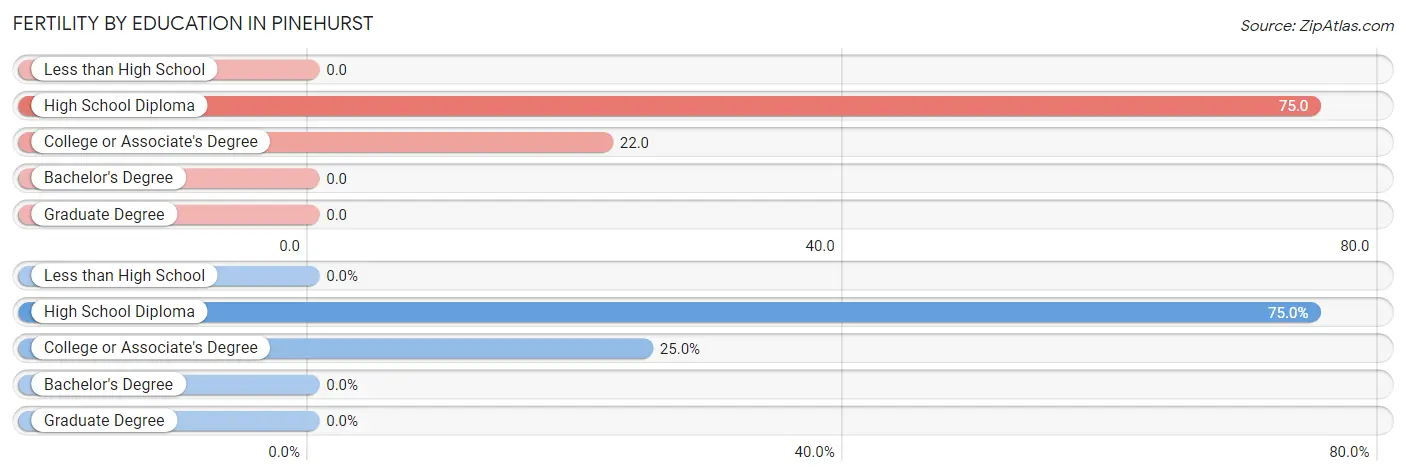
| Educational Attainment | Women with Births | Births / 1,000 Women |
| Less than High School | 0 (0.0%) | 0.0 |
| High School Diploma | 9 (75.0%) | 75.0 |
| College or Associate's Degree | 3 (25.0%) | 22.0 |
| Bachelor's Degree | 0 (0.0%) | 0.0 |
| Graduate Degree | 0 (0.0%) | 0.0 |
| Total | 12 (100.0%) | 31.0 |
Fertility by Education by Marriage Status in Pinehurst
75.0% of women with births in Pinehurst are unmarried. Women with the educational attainment of college or associate's degree are most likely to be married with 100.0% of them married at childbirth, while women with the educational attainment of high school diploma are least likely to be married with 100.0% of them unmarried at childbirth.
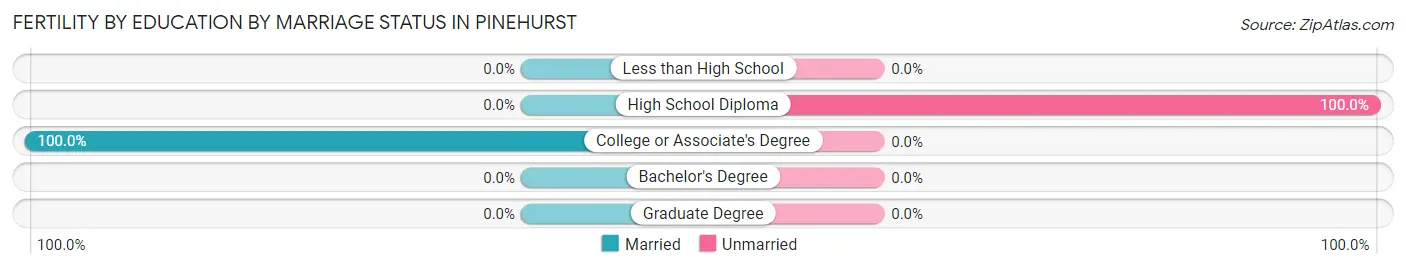
| Educational Attainment | Married | Unmarried |
| Less than High School | 0 (0.0%) | 0 (0.0%) |
| High School Diploma | 0 (0.0%) | 9 (100.0%) |
| College or Associate's Degree | 3 (100.0%) | 0 (0.0%) |
| Bachelor's Degree | 0 (0.0%) | 0 (0.0%) |
| Graduate Degree | 0 (0.0%) | 0 (0.0%) |
| Total | 3 (25.0%) | 9 (75.0%) |
Income in Pinehurst
Income Overview in Pinehurst
Per Capita Income in Pinehurst is $28,339, while median incomes of families and households are $71,161 and $52,109 respectively.
| Characteristic | Number | Measure |
| Per Capita Income | 1,993 | $28,339 |
| Median Family Income | 428 | $71,161 |
| Mean Family Income | 428 | $85,159 |
| Median Household Income | 719 | $52,109 |
| Mean Household Income | 719 | $68,477 |
| Income Deficit | 428 | $0 |
| Wage / Income Gap (%) | 1,993 | 39.60% |
| Wage / Income Gap ($) | 1,993 | 60.40¢ per $1 |
| Gini / Inequality Index | 1,993 | 0.42 |
Earnings by Sex in Pinehurst
Average Earnings in Pinehurst are $34,114, $47,596 for men and $28,750 for women, a difference of 39.6%.
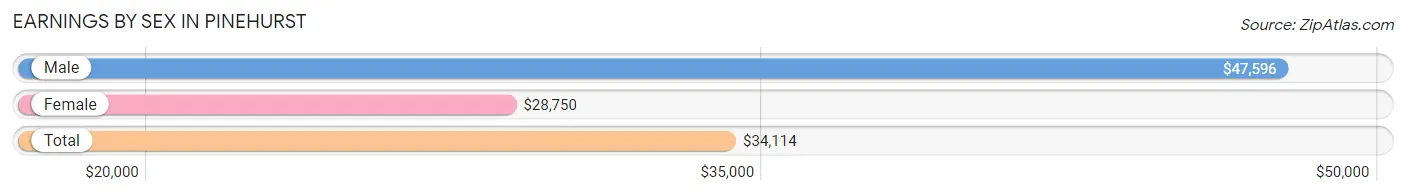
| Sex | Number | Average Earnings |
| Male | 503 (57.0%) | $47,596 |
| Female | 379 (43.0%) | $28,750 |
| Total | 882 (100.0%) | $34,114 |
Earnings by Sex by Income Bracket in Pinehurst
The most common earnings brackets in Pinehurst are $30,000 to $34,999 for men (72 | 14.3%) and $25,000 to $29,999 for women (66 | 17.4%).
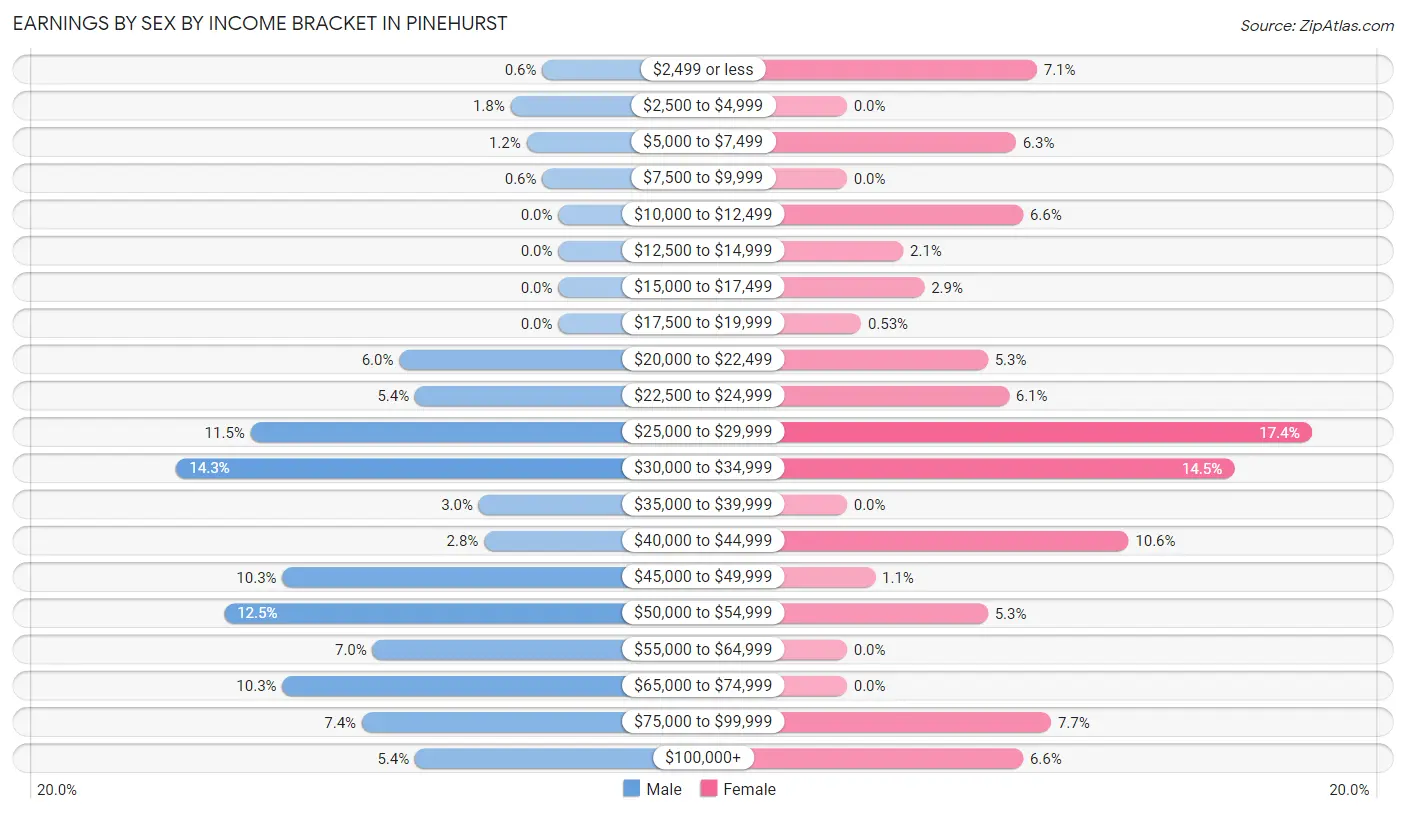
| Income | Male | Female |
| $2,499 or less | 3 (0.6%) | 27 (7.1%) |
| $2,500 to $4,999 | 9 (1.8%) | 0 (0.0%) |
| $5,000 to $7,499 | 6 (1.2%) | 24 (6.3%) |
| $7,500 to $9,999 | 3 (0.6%) | 0 (0.0%) |
| $10,000 to $12,499 | 0 (0.0%) | 25 (6.6%) |
| $12,500 to $14,999 | 0 (0.0%) | 8 (2.1%) |
| $15,000 to $17,499 | 0 (0.0%) | 11 (2.9%) |
| $17,500 to $19,999 | 0 (0.0%) | 2 (0.5%) |
| $20,000 to $22,499 | 30 (6.0%) | 20 (5.3%) |
| $22,500 to $24,999 | 27 (5.4%) | 23 (6.1%) |
| $25,000 to $29,999 | 58 (11.5%) | 66 (17.4%) |
| $30,000 to $34,999 | 72 (14.3%) | 55 (14.5%) |
| $35,000 to $39,999 | 15 (3.0%) | 0 (0.0%) |
| $40,000 to $44,999 | 14 (2.8%) | 40 (10.5%) |
| $45,000 to $49,999 | 52 (10.3%) | 4 (1.1%) |
| $50,000 to $54,999 | 63 (12.5%) | 20 (5.3%) |
| $55,000 to $64,999 | 35 (7.0%) | 0 (0.0%) |
| $65,000 to $74,999 | 52 (10.3%) | 0 (0.0%) |
| $75,000 to $99,999 | 37 (7.4%) | 29 (7.6%) |
| $100,000+ | 27 (5.4%) | 25 (6.6%) |
| Total | 503 (100.0%) | 379 (100.0%) |
Earnings by Sex by Educational Attainment in Pinehurst
Average earnings in Pinehurst are $47,596 for men and $29,962 for women, a difference of 37.0%. Men with an educational attainment of bachelor's degree enjoy the highest average annual earnings of $63,750, while those with college or associate's degree education earn the least with $29,028. Women with an educational attainment of high school diploma earn the most with the average annual earnings of $30,245, while those with college or associate's degree education have the smallest earnings of $28,641.
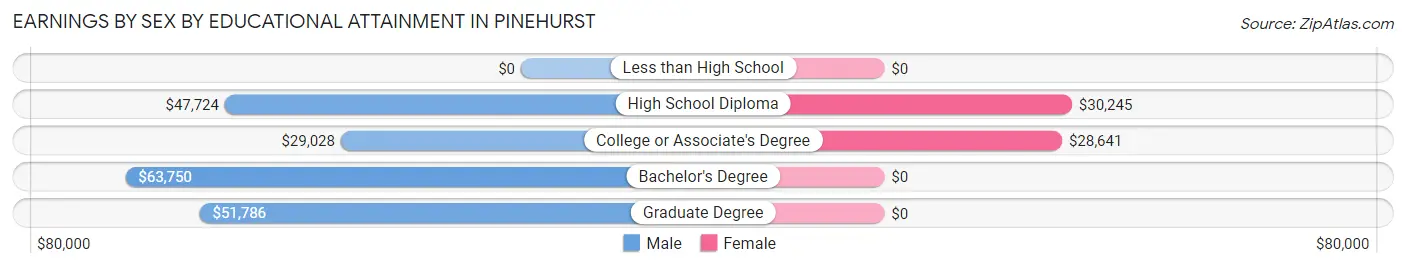
| Educational Attainment | Male Income | Female Income |
| Less than High School | - | - |
| High School Diploma | $47,724 | $30,245 |
| College or Associate's Degree | $29,028 | $28,641 |
| Bachelor's Degree | $63,750 | $0 |
| Graduate Degree | $51,786 | $0 |
| Total | $47,596 | $29,962 |
Family Income in Pinehurst
Family Income Brackets in Pinehurst
According to the Pinehurst family income data, there are 87 families falling into the $75,000 to $99,999 income range, which is the most common income bracket and makes up 20.3% of all families. Conversely, the less than $10,000 income bracket is the least frequent group with only 6 families (1.4%) belonging to this category.
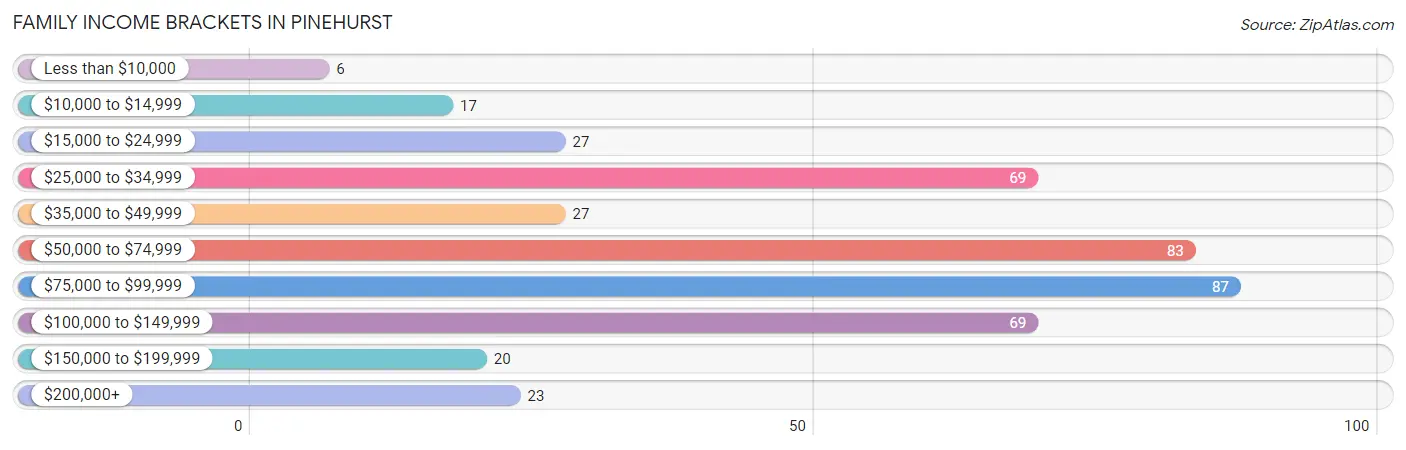
| Income Bracket | # Families | % Families |
| Less than $10,000 | 6 | 1.4% |
| $10,000 to $14,999 | 17 | 4.0% |
| $15,000 to $24,999 | 27 | 6.3% |
| $25,000 to $34,999 | 69 | 16.1% |
| $35,000 to $49,999 | 27 | 6.3% |
| $50,000 to $74,999 | 83 | 19.4% |
| $75,000 to $99,999 | 87 | 20.3% |
| $100,000 to $149,999 | 69 | 16.1% |
| $150,000 to $199,999 | 20 | 4.7% |
| $200,000+ | 23 | 5.4% |
Family Income by Famaliy Size in Pinehurst
6-person families (26 | 6.1%) account for the highest median family income in Pinehurst with $71,548 per family, while 2-person families (207 | 48.4%) have the highest median income of $31,054 per family member.
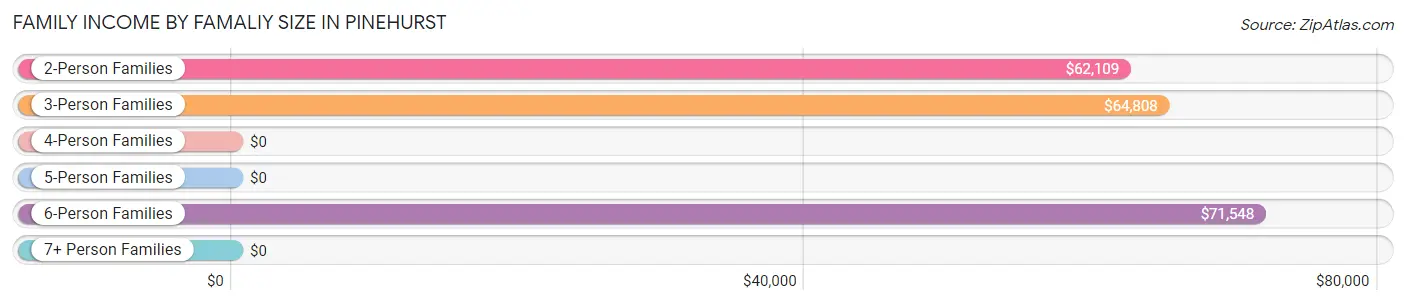
| Income Bracket | # Families | Median Income |
| 2-Person Families | 207 (48.4%) | $62,109 |
| 3-Person Families | 114 (26.6%) | $64,808 |
| 4-Person Families | 39 (9.1%) | $0 |
| 5-Person Families | 30 (7.0%) | $0 |
| 6-Person Families | 26 (6.1%) | $71,548 |
| 7+ Person Families | 12 (2.8%) | $0 |
| Total | 428 (100.0%) | $71,161 |
Family Income by Number of Earners in Pinehurst
The median family income in Pinehurst is $71,161, with families comprising 2 earners (92) having the highest median family income of $115,441, while families with no earners (85) have the lowest median family income of $32,054, accounting for 21.5% and 19.9% of families, respectively.
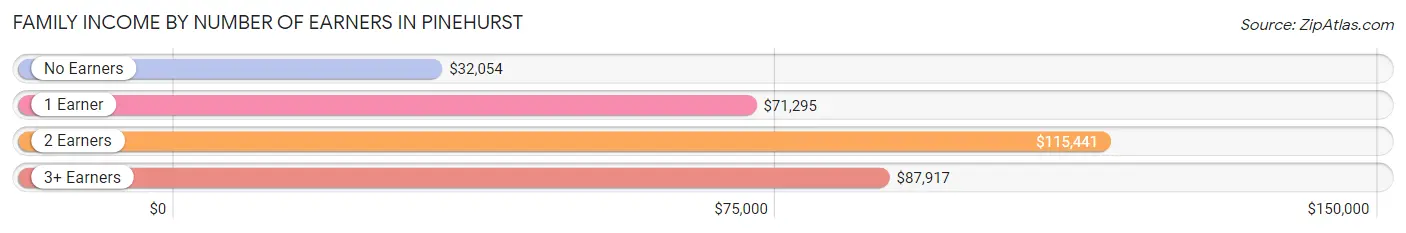
| Number of Earners | # Families | Median Income |
| No Earners | 85 (19.9%) | $32,054 |
| 1 Earner | 223 (52.1%) | $71,295 |
| 2 Earners | 92 (21.5%) | $115,441 |
| 3+ Earners | 28 (6.5%) | $87,917 |
| Total | 428 (100.0%) | $71,161 |
Household Income in Pinehurst
Household Income Brackets in Pinehurst
With 162 households falling in the category, the $75,000 to $99,999 income range is the most frequent in Pinehurst, accounting for 22.5% of all households. In contrast, only 20 households (2.8%) fall into the $150,000 to $199,999 income bracket, making it the least populous group.
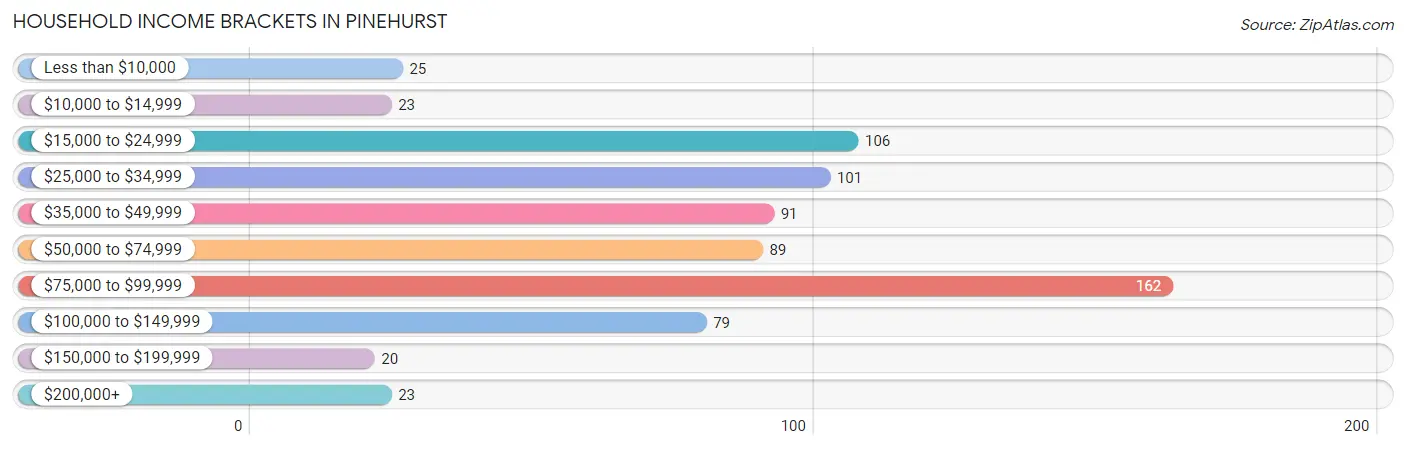
| Income Bracket | # Households | % Households |
| Less than $10,000 | 25 | 3.5% |
| $10,000 to $14,999 | 23 | 3.2% |
| $15,000 to $24,999 | 106 | 14.7% |
| $25,000 to $34,999 | 101 | 14.0% |
| $35,000 to $49,999 | 91 | 12.7% |
| $50,000 to $74,999 | 89 | 12.4% |
| $75,000 to $99,999 | 162 | 22.5% |
| $100,000 to $149,999 | 79 | 11.0% |
| $150,000 to $199,999 | 20 | 2.8% |
| $200,000+ | 23 | 3.2% |
Household Income by Householder Age in Pinehurst
The median household income in Pinehurst is $52,109, with the highest median household income of $87,969 found in the 25 to 44 years age bracket for the primary householder. A total of 186 households (25.9%) fall into this category. Meanwhile, the 15 to 24 years age bracket for the primary householder has the lowest median household income of $0, with 10 households (1.4%) in this group.
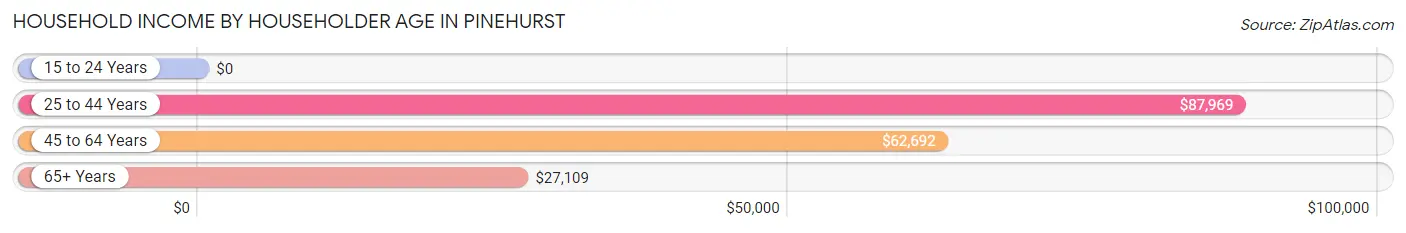
| Income Bracket | # Households | Median Income |
| 15 to 24 Years | 10 (1.4%) | $0 |
| 25 to 44 Years | 186 (25.9%) | $87,969 |
| 45 to 64 Years | 274 (38.1%) | $62,692 |
| 65+ Years | 249 (34.6%) | $27,109 |
| Total | 719 (100.0%) | $52,109 |
Poverty in Pinehurst
Income Below Poverty by Sex and Age in Pinehurst
With 11.1% poverty level for males and 17.1% for females among the residents of Pinehurst, 12 to 14 year old males and 45 to 54 year old females are the most vulnerable to poverty, with 13 males (76.5%) and 60 females (43.8%) in their respective age groups living below the poverty level.
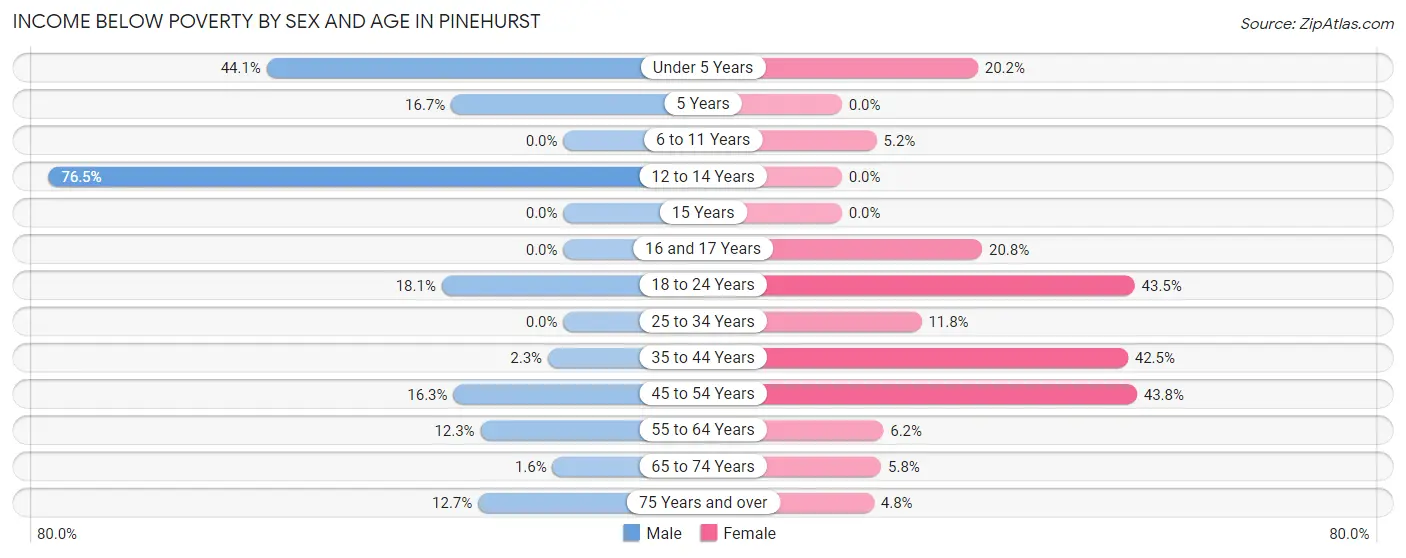
| Age Bracket | Male | Female |
| Under 5 Years | 37 (44.1%) | 20 (20.2%) |
| 5 Years | 2 (16.7%) | 0 (0.0%) |
| 6 to 11 Years | 0 (0.0%) | 3 (5.2%) |
| 12 to 14 Years | 13 (76.5%) | 0 (0.0%) |
| 15 Years | 0 (0.0%) | 0 (0.0%) |
| 16 and 17 Years | 0 (0.0%) | 5 (20.8%) |
| 18 to 24 Years | 13 (18.1%) | 10 (43.5%) |
| 25 to 34 Years | 0 (0.0%) | 20 (11.8%) |
| 35 to 44 Years | 3 (2.3%) | 31 (42.5%) |
| 45 to 54 Years | 16 (16.3%) | 60 (43.8%) |
| 55 to 64 Years | 16 (12.3%) | 9 (6.2%) |
| 65 to 74 Years | 2 (1.6%) | 6 (5.8%) |
| 75 Years and over | 10 (12.7%) | 4 (4.8%) |
| Total | 112 (11.1%) | 168 (17.1%) |
Income Above Poverty by Sex and Age in Pinehurst
According to the poverty statistics in Pinehurst, males aged 6 to 11 years and females aged 5 years are the age groups that are most secure financially, with 100.0% of males and 100.0% of females in these age groups living above the poverty line.
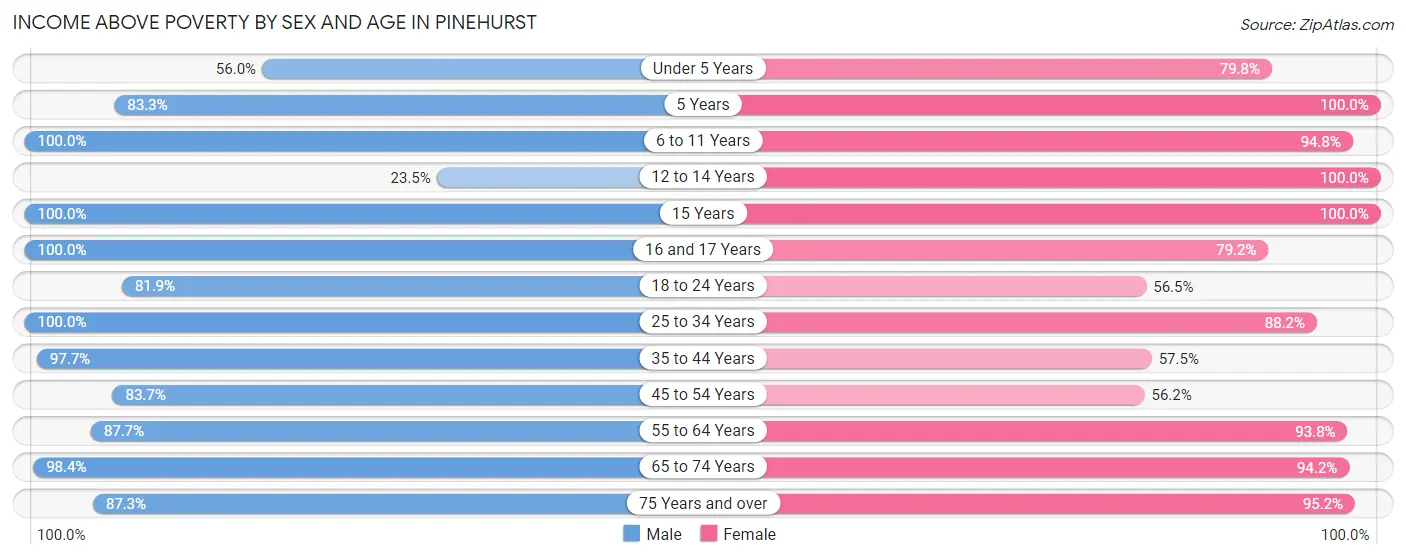
| Age Bracket | Male | Female |
| Under 5 Years | 47 (55.9%) | 79 (79.8%) |
| 5 Years | 10 (83.3%) | 41 (100.0%) |
| 6 to 11 Years | 82 (100.0%) | 55 (94.8%) |
| 12 to 14 Years | 4 (23.5%) | 8 (100.0%) |
| 15 Years | 11 (100.0%) | 16 (100.0%) |
| 16 and 17 Years | 1 (100.0%) | 19 (79.2%) |
| 18 to 24 Years | 59 (81.9%) | 13 (56.5%) |
| 25 to 34 Years | 166 (100.0%) | 149 (88.2%) |
| 35 to 44 Years | 128 (97.7%) | 42 (57.5%) |
| 45 to 54 Years | 82 (83.7%) | 77 (56.2%) |
| 55 to 64 Years | 114 (87.7%) | 137 (93.8%) |
| 65 to 74 Years | 123 (98.4%) | 97 (94.2%) |
| 75 Years and over | 69 (87.3%) | 80 (95.2%) |
| Total | 896 (88.9%) | 813 (82.9%) |
Income Below Poverty Among Married-Couple Families in Pinehurst
The poverty statistics for married-couple families in Pinehurst show that 2.8% or 9 of the total 324 families live below the poverty line. Families with 3 or 4 children have the highest poverty rate of 6.1%, comprising of 3 families. On the other hand, families with 1 or 2 children have the lowest poverty rate of 0.0%, which includes 0 families.
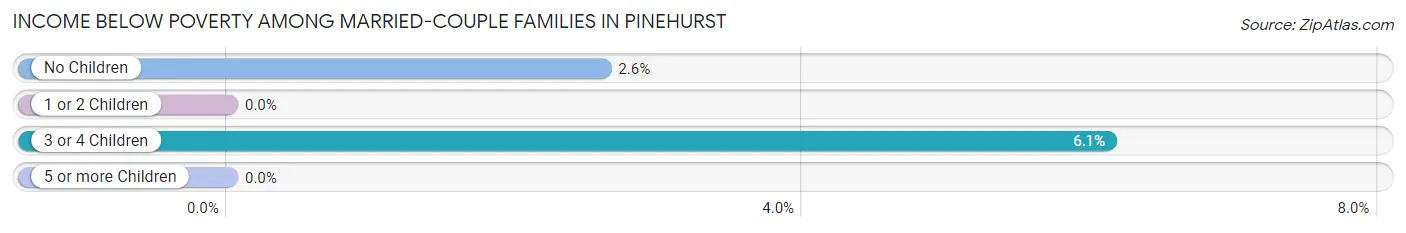
| Children | Above Poverty | Below Poverty |
| No Children | 225 (97.4%) | 6 (2.6%) |
| 1 or 2 Children | 44 (100.0%) | 0 (0.0%) |
| 3 or 4 Children | 46 (93.9%) | 3 (6.1%) |
| 5 or more Children | 0 (0.0%) | 0 (0.0%) |
| Total | 315 (97.2%) | 9 (2.8%) |
Income Below Poverty Among Single-Parent Households in Pinehurst
According to the poverty data in Pinehurst, 25.0% or 11 single-father households and 28.3% or 17 single-mother households are living below the poverty line. Among single-father households, those with 1 or 2 children have the highest poverty rate, with 11 households (25.0%) experiencing poverty. Likewise, among single-mother households, those with 1 or 2 children have the highest poverty rate, with 17 households (32.1%) falling below the poverty line.
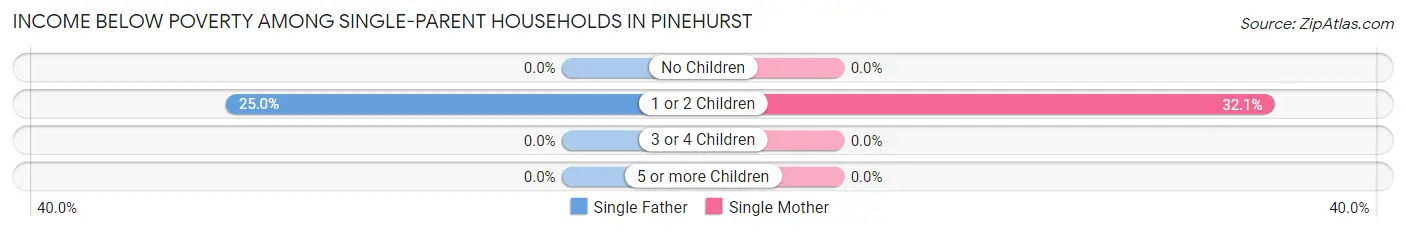
| Children | Single Father | Single Mother |
| No Children | 0 (0.0%) | 0 (0.0%) |
| 1 or 2 Children | 11 (25.0%) | 17 (32.1%) |
| 3 or 4 Children | 0 (0.0%) | 0 (0.0%) |
| 5 or more Children | 0 (0.0%) | 0 (0.0%) |
| Total | 11 (25.0%) | 17 (28.3%) |
Income Below Poverty Among Married-Couple vs Single-Parent Households in Pinehurst
The poverty data for Pinehurst shows that 9 of the married-couple family households (2.8%) and 28 of the single-parent households (26.9%) are living below the poverty level. Within the married-couple family households, those with 3 or 4 children have the highest poverty rate, with 3 households (6.1%) falling below the poverty line. Among the single-parent households, those with 1 or 2 children have the highest poverty rate, with 28 household (28.9%) living below poverty.
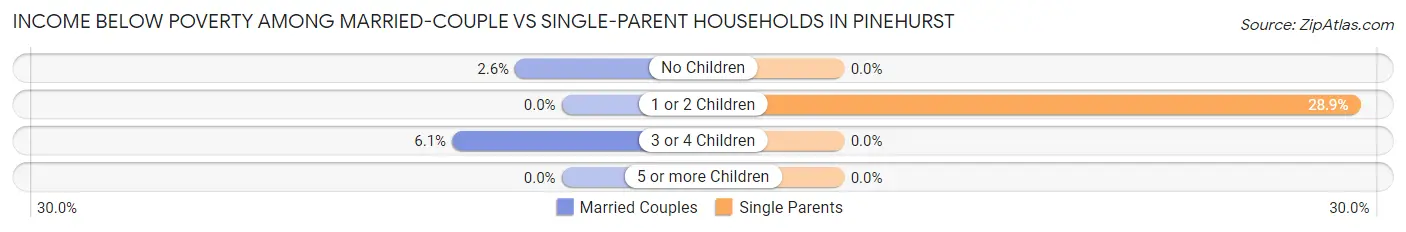
| Children | Married-Couple Families | Single-Parent Households |
| No Children | 6 (2.6%) | 0 (0.0%) |
| 1 or 2 Children | 0 (0.0%) | 28 (28.9%) |
| 3 or 4 Children | 3 (6.1%) | 0 (0.0%) |
| 5 or more Children | 0 (0.0%) | 0 (0.0%) |
| Total | 9 (2.8%) | 28 (26.9%) |
Employment Characteristics in Pinehurst
Employment by Class of Employer in Pinehurst
Among the 803 employed individuals in Pinehurst, private company employees (619 | 77.1%), state government employees (54 | 6.7%), and not-for-profit organizations (52 | 6.5%) make up the most common classes of employment.
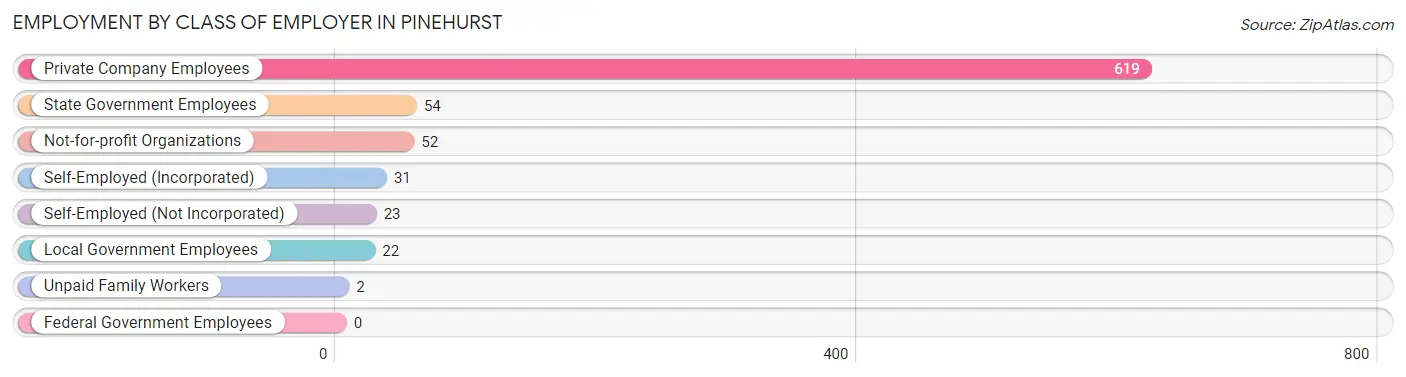
| Employer Class | # Employees | % Employees |
| Private Company Employees | 619 | 77.1% |
| Self-Employed (Incorporated) | 31 | 3.9% |
| Self-Employed (Not Incorporated) | 23 | 2.9% |
| Not-for-profit Organizations | 52 | 6.5% |
| Local Government Employees | 22 | 2.7% |
| State Government Employees | 54 | 6.7% |
| Federal Government Employees | 0 | 0.0% |
| Unpaid Family Workers | 2 | 0.3% |
| Total | 803 | 100.0% |
Employment Status by Age in Pinehurst
According to the labor force statistics for Pinehurst, out of the total population over 16 years of age (1,565), 54.9% or 859 individuals are in the labor force, with 4.0% or 34 of them unemployed. The age group with the highest labor force participation rate is 35 to 44 years, with 91.2% or 186 individuals in the labor force. Within the labor force, the 35 to 44 years age range has the highest percentage of unemployed individuals, with 16.1% or 30 of them being unemployed.
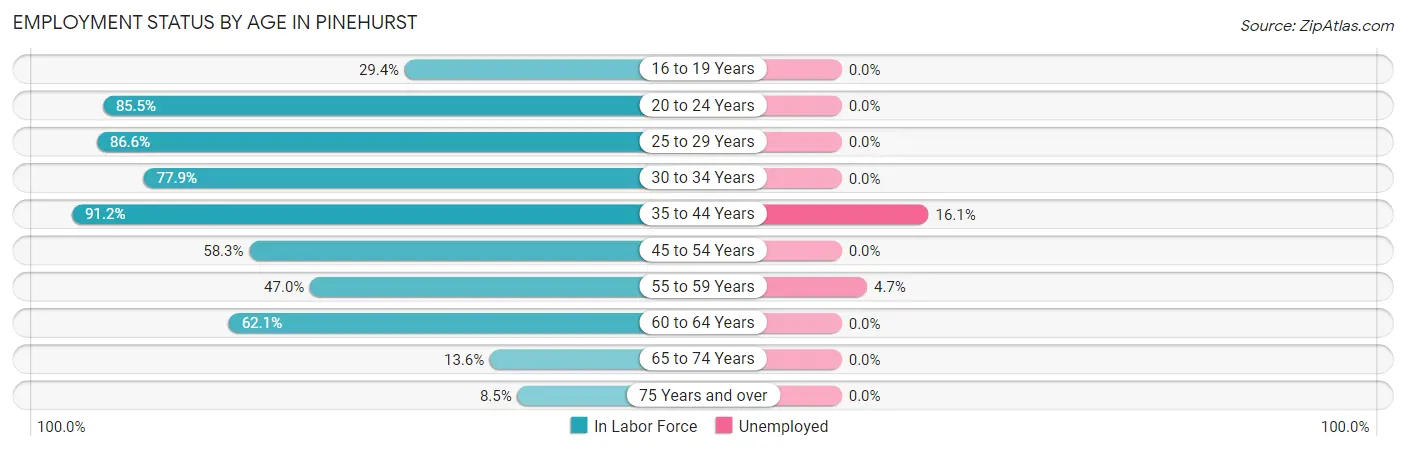
| Age Bracket | In Labor Force | Unemployed |
| 16 to 19 Years | 15 (29.4%) | 0 (0.0%) |
| 20 to 24 Years | 59 (85.5%) | 0 (0.0%) |
| 25 to 29 Years | 110 (86.6%) | 0 (0.0%) |
| 30 to 34 Years | 162 (77.9%) | 0 (0.0%) |
| 35 to 44 Years | 186 (91.2%) | 30 (16.1%) |
| 45 to 54 Years | 137 (58.3%) | 0 (0.0%) |
| 55 to 59 Years | 86 (47.0%) | 4 (4.7%) |
| 60 to 64 Years | 59 (62.1%) | 0 (0.0%) |
| 65 to 74 Years | 31 (13.6%) | 0 (0.0%) |
| 75 Years and over | 14 (8.5%) | 0 (0.0%) |
| Total | 859 (54.9%) | 34 (4.0%) |
Employment Status by Educational Attainment in Pinehurst
According to labor force statistics for Pinehurst, 70.3% of individuals (740) out of the total population between 25 and 64 years of age (1,052) are in the labor force, with 4.6% or 34 of them being unemployed. The group with the highest labor force participation rate are those with the educational attainment of high school diploma, with 75.8% or 357 individuals in the labor force. Within the labor force, individuals with college / associate degree education have the highest percentage of unemployment, with 6.5% or 17 of them being unemployed.
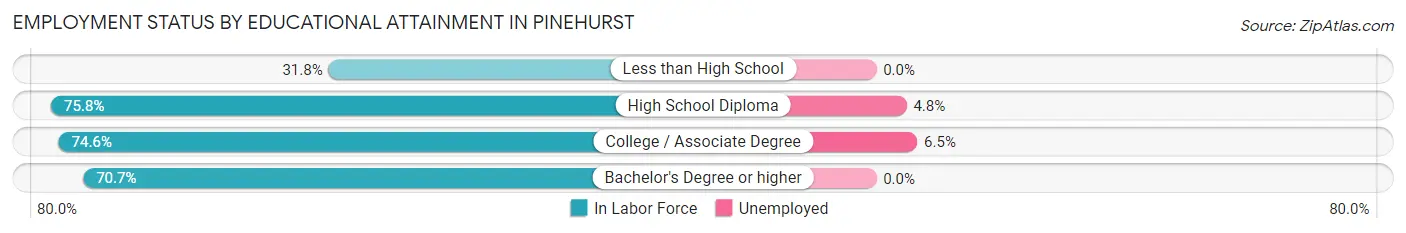
| Educational Attainment | In Labor Force | Unemployed |
| Less than High School | 34 (31.8%) | 0 (0.0%) |
| High School Diploma | 357 (75.8%) | 23 (4.8%) |
| College / Associate Degree | 262 (74.6%) | 23 (6.5%) |
| Bachelor's Degree or higher | 87 (70.7%) | 0 (0.0%) |
| Total | 740 (70.3%) | 48 (4.6%) |
Employment Occupations by Sex in Pinehurst
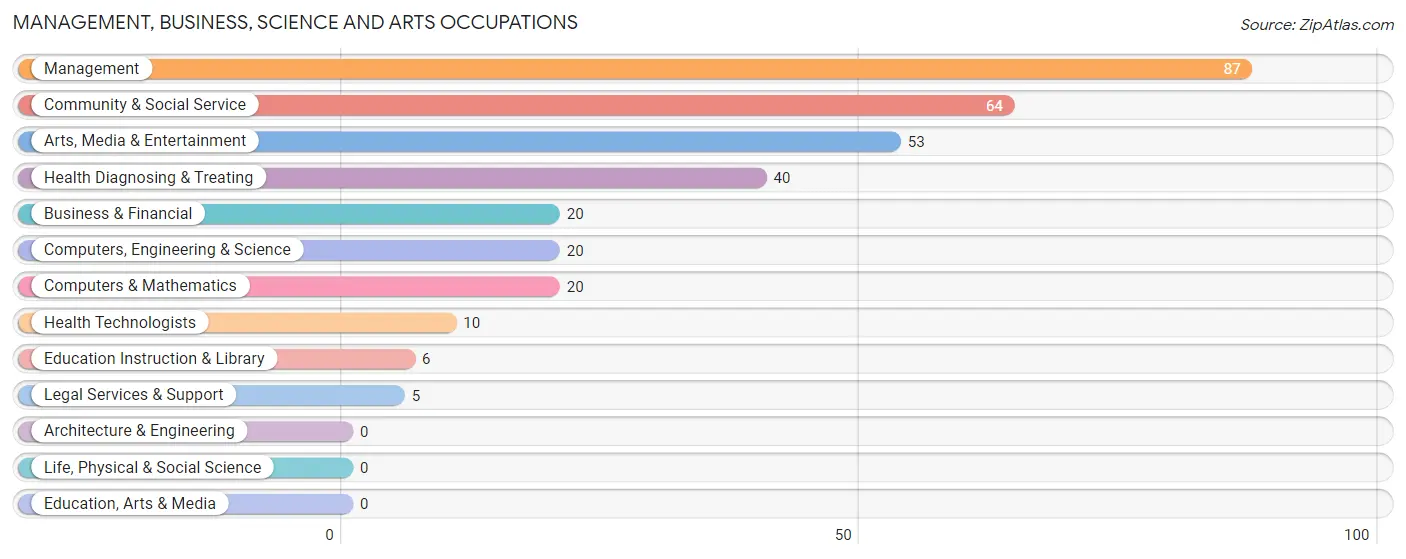
Management, Business, Science and Arts Occupations
The most common Management, Business, Science and Arts occupations in Pinehurst are Management (87 | 10.5%), Community & Social Service (64 | 7.8%), Arts, Media & Entertainment (53 | 6.4%), Health Diagnosing & Treating (40 | 4.9%), and Business & Financial (20 | 2.4%).
Management, Business, Science and Arts Occupations by Sex
Within the Management, Business, Science and Arts occupations in Pinehurst, the most male-oriented occupations are Business & Financial (100.0%), Computers, Engineering & Science (100.0%), and Computers & Mathematics (100.0%), while the most female-oriented occupations are Community & Social Service (100.0%), Legal Services & Support (100.0%), and Education Instruction & Library (100.0%).
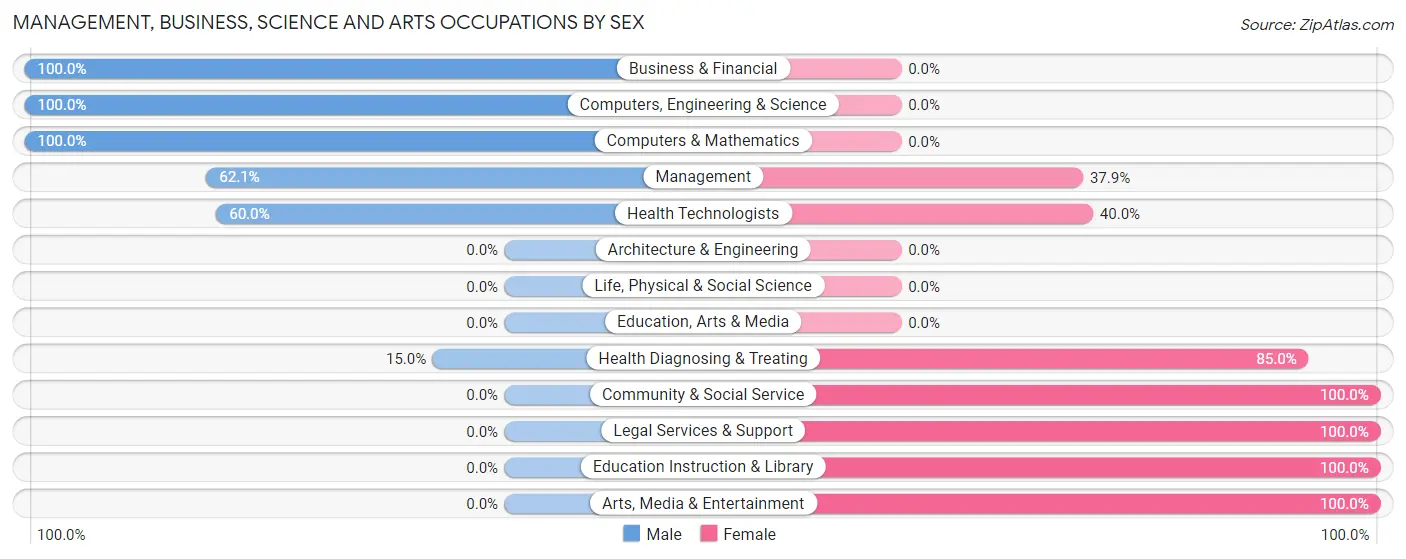
| Occupation | Male | Female |
| Management | 54 (62.1%) | 33 (37.9%) |
| Business & Financial | 20 (100.0%) | 0 (0.0%) |
| Computers, Engineering & Science | 20 (100.0%) | 0 (0.0%) |
| Computers & Mathematics | 20 (100.0%) | 0 (0.0%) |
| Architecture & Engineering | 0 (0.0%) | 0 (0.0%) |
| Life, Physical & Social Science | 0 (0.0%) | 0 (0.0%) |
| Community & Social Service | 0 (0.0%) | 64 (100.0%) |
| Education, Arts & Media | 0 (0.0%) | 0 (0.0%) |
| Legal Services & Support | 0 (0.0%) | 5 (100.0%) |
| Education Instruction & Library | 0 (0.0%) | 6 (100.0%) |
| Arts, Media & Entertainment | 0 (0.0%) | 53 (100.0%) |
| Health Diagnosing & Treating | 6 (15.0%) | 34 (85.0%) |
| Health Technologists | 6 (60.0%) | 4 (40.0%) |
| Total (Category) | 100 (43.3%) | 131 (56.7%) |
| Total (Overall) | 483 (58.6%) | 342 (41.4%) |
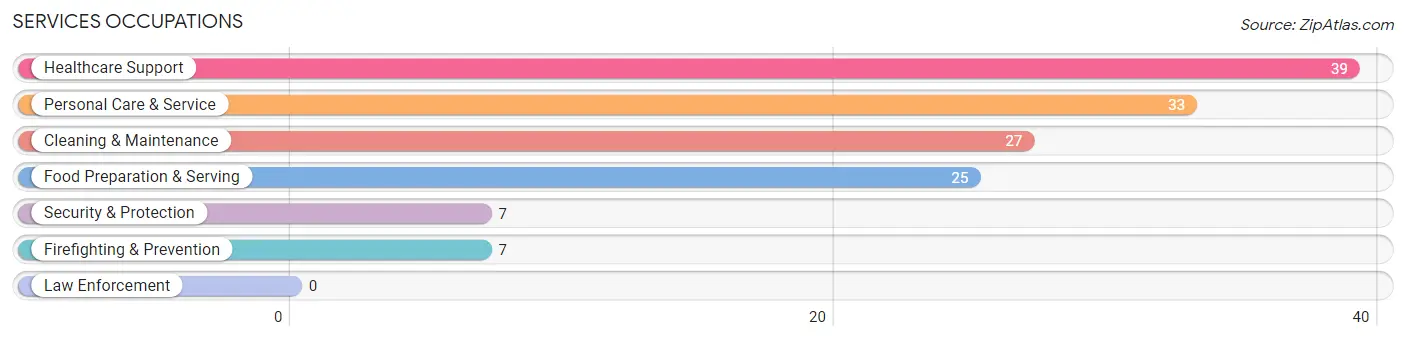
Services Occupations
The most common Services occupations in Pinehurst are Healthcare Support (39 | 4.7%), Personal Care & Service (33 | 4.0%), Cleaning & Maintenance (27 | 3.3%), Food Preparation & Serving (25 | 3.0%), and Security & Protection (7 | 0.9%).
Services Occupations by Sex
Within the Services occupations in Pinehurst, the most male-oriented occupations are Cleaning & Maintenance (100.0%), Food Preparation & Serving (44.0%), and Security & Protection (42.9%), while the most female-oriented occupations are Personal Care & Service (100.0%), Healthcare Support (66.7%), and Security & Protection (57.1%).
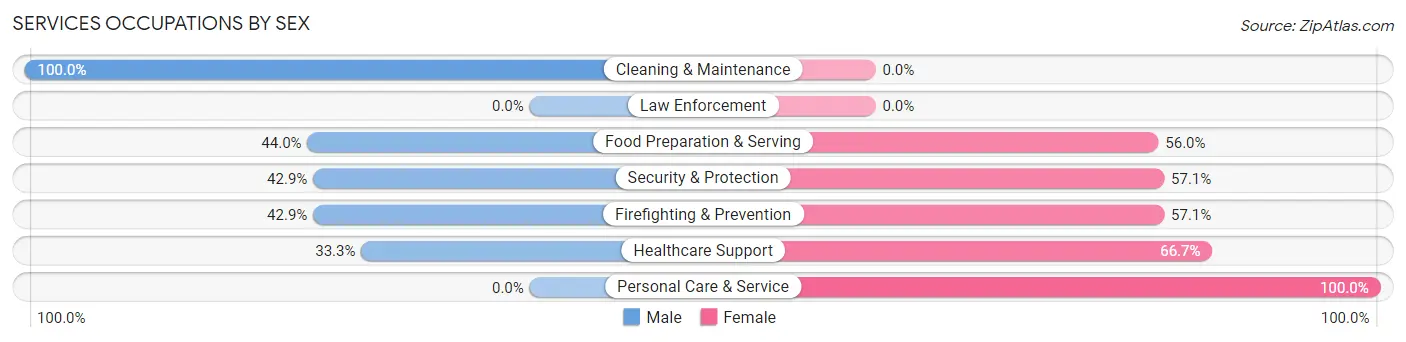
| Occupation | Male | Female |
| Healthcare Support | 13 (33.3%) | 26 (66.7%) |
| Security & Protection | 3 (42.9%) | 4 (57.1%) |
| Firefighting & Prevention | 3 (42.9%) | 4 (57.1%) |
| Law Enforcement | 0 (0.0%) | 0 (0.0%) |
| Food Preparation & Serving | 11 (44.0%) | 14 (56.0%) |
| Cleaning & Maintenance | 27 (100.0%) | 0 (0.0%) |
| Personal Care & Service | 0 (0.0%) | 33 (100.0%) |
| Total (Category) | 54 (41.2%) | 77 (58.8%) |
| Total (Overall) | 483 (58.6%) | 342 (41.4%) |
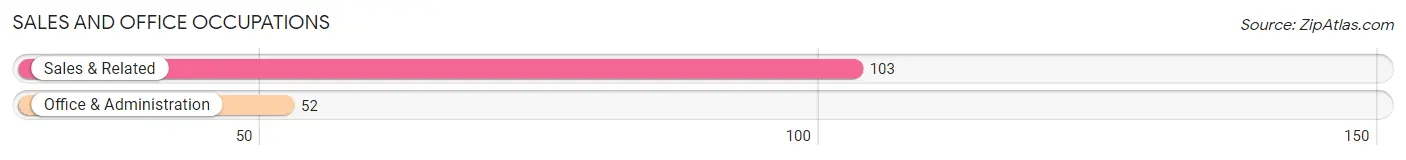
Sales and Office Occupations
The most common Sales and Office occupations in Pinehurst are Sales & Related (103 | 12.5%), and Office & Administration (52 | 6.3%).
Sales and Office Occupations by Sex
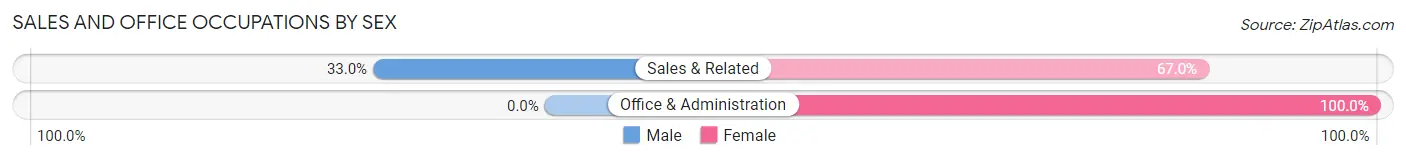
| Occupation | Male | Female |
| Sales & Related | 34 (33.0%) | 69 (67.0%) |
| Office & Administration | 0 (0.0%) | 52 (100.0%) |
| Total (Category) | 34 (21.9%) | 121 (78.1%) |
| Total (Overall) | 483 (58.6%) | 342 (41.4%) |
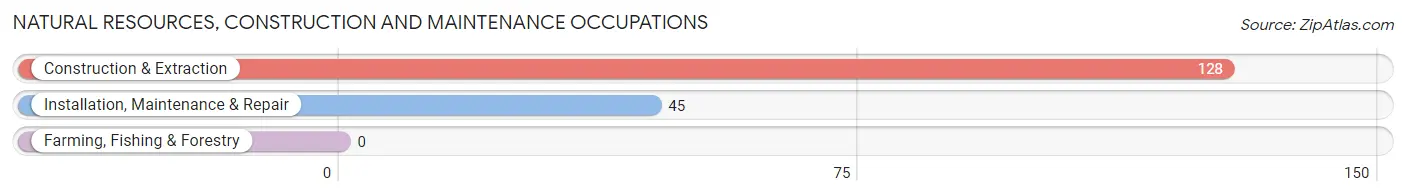
Natural Resources, Construction and Maintenance Occupations
The most common Natural Resources, Construction and Maintenance occupations in Pinehurst are Construction & Extraction (128 | 15.5%), and Installation, Maintenance & Repair (45 | 5.4%).
Natural Resources, Construction and Maintenance Occupations by Sex
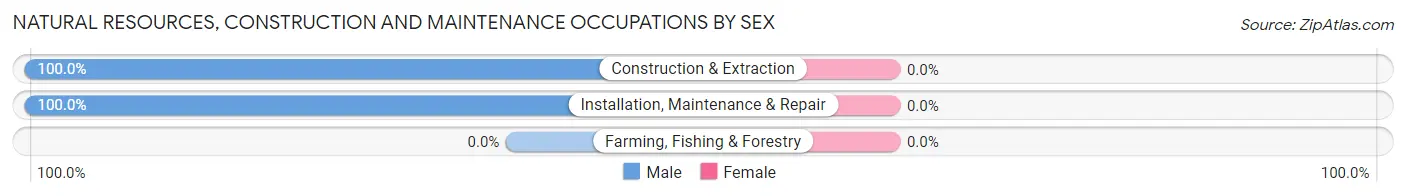
| Occupation | Male | Female |
| Farming, Fishing & Forestry | 0 (0.0%) | 0 (0.0%) |
| Construction & Extraction | 128 (100.0%) | 0 (0.0%) |
| Installation, Maintenance & Repair | 45 (100.0%) | 0 (0.0%) |
| Total (Category) | 173 (100.0%) | 0 (0.0%) |
| Total (Overall) | 483 (58.6%) | 342 (41.4%) |
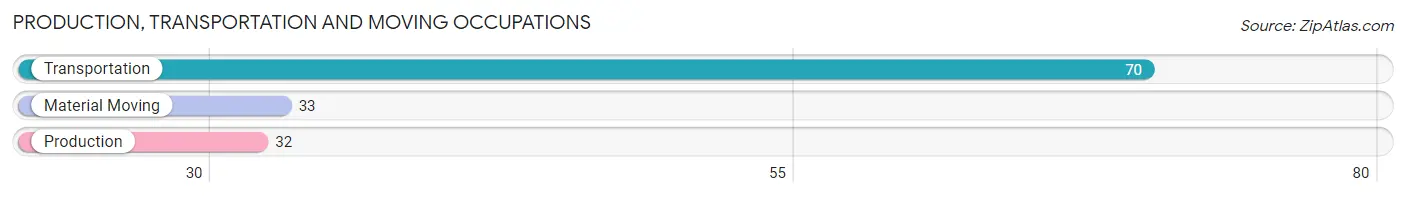
Production, Transportation and Moving Occupations
The most common Production, Transportation and Moving occupations in Pinehurst are Transportation (70 | 8.5%), Material Moving (33 | 4.0%), and Production (32 | 3.9%).
Production, Transportation and Moving Occupations by Sex
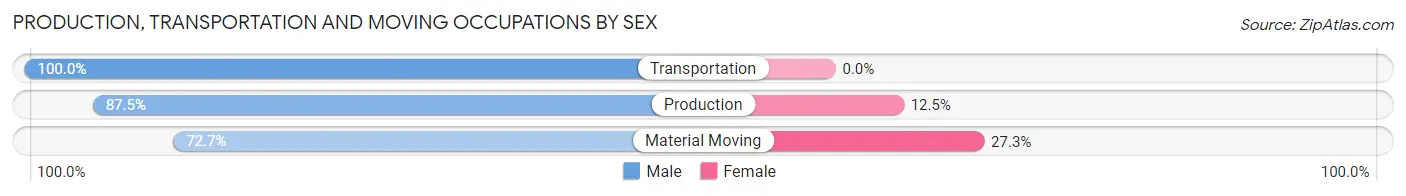
| Occupation | Male | Female |
| Production | 28 (87.5%) | 4 (12.5%) |
| Transportation | 70 (100.0%) | 0 (0.0%) |
| Material Moving | 24 (72.7%) | 9 (27.3%) |
| Total (Category) | 122 (90.4%) | 13 (9.6%) |
| Total (Overall) | 483 (58.6%) | 342 (41.4%) |
Employment Industries by Sex in Pinehurst
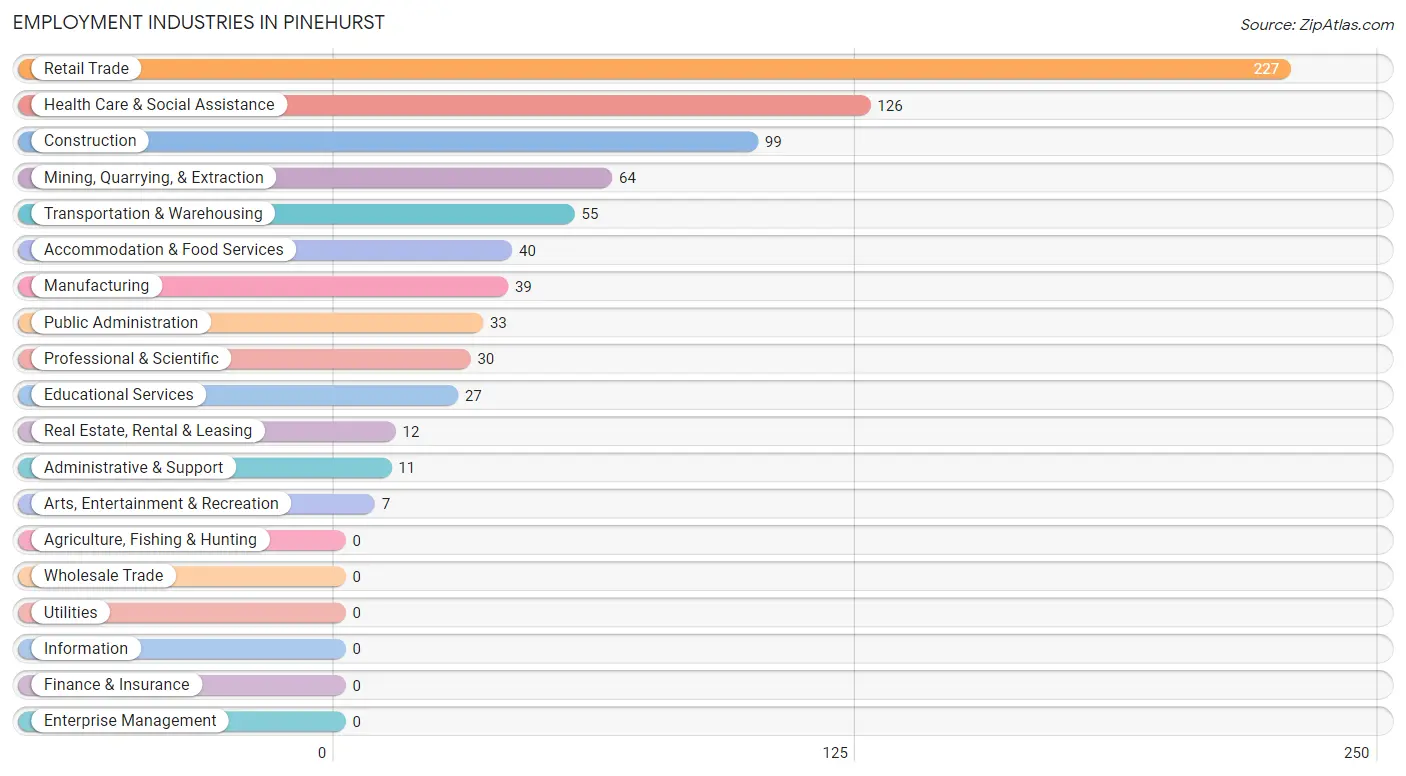
Employment Industries in Pinehurst
The major employment industries in Pinehurst include Retail Trade (227 | 27.5%), Health Care & Social Assistance (126 | 15.3%), Construction (99 | 12.0%), Mining, Quarrying, & Extraction (64 | 7.8%), and Transportation & Warehousing (55 | 6.7%).
Employment Industries by Sex in Pinehurst
The Pinehurst industries that see more men than women are Construction (100.0%), Transportation & Warehousing (100.0%), and Administrative & Support (100.0%), whereas the industries that tend to have a higher number of women are Real Estate, Rental & Leasing (100.0%), Health Care & Social Assistance (74.6%), and Retail Trade (62.6%).
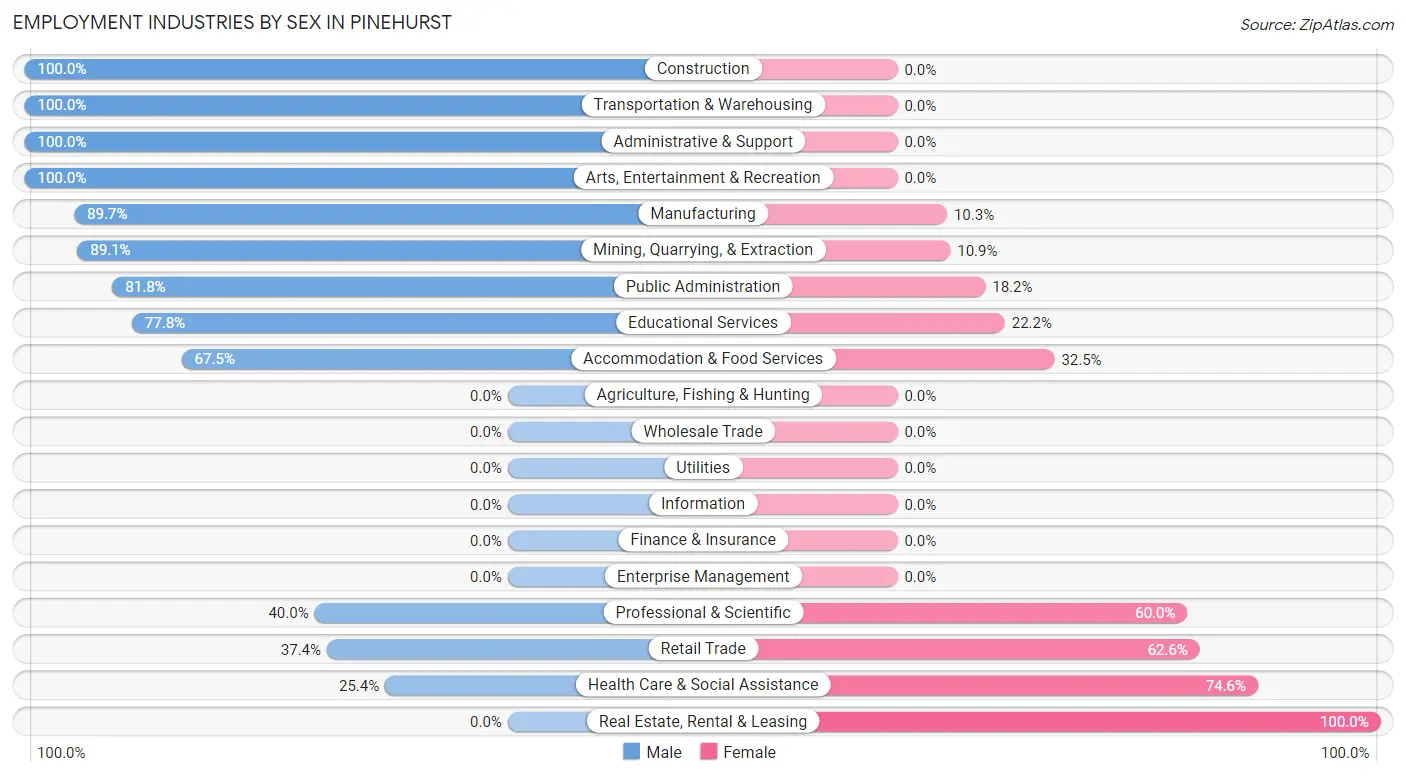
| Industry | Male | Female |
| Agriculture, Fishing & Hunting | 0 (0.0%) | 0 (0.0%) |
| Mining, Quarrying, & Extraction | 57 (89.1%) | 7 (10.9%) |
| Construction | 99 (100.0%) | 0 (0.0%) |
| Manufacturing | 35 (89.7%) | 4 (10.3%) |
| Wholesale Trade | 0 (0.0%) | 0 (0.0%) |
| Retail Trade | 85 (37.4%) | 142 (62.6%) |
| Transportation & Warehousing | 55 (100.0%) | 0 (0.0%) |
| Utilities | 0 (0.0%) | 0 (0.0%) |
| Information | 0 (0.0%) | 0 (0.0%) |
| Finance & Insurance | 0 (0.0%) | 0 (0.0%) |
| Real Estate, Rental & Leasing | 0 (0.0%) | 12 (100.0%) |
| Professional & Scientific | 12 (40.0%) | 18 (60.0%) |
| Enterprise Management | 0 (0.0%) | 0 (0.0%) |
| Administrative & Support | 11 (100.0%) | 0 (0.0%) |
| Educational Services | 21 (77.8%) | 6 (22.2%) |
| Health Care & Social Assistance | 32 (25.4%) | 94 (74.6%) |
| Arts, Entertainment & Recreation | 7 (100.0%) | 0 (0.0%) |
| Accommodation & Food Services | 27 (67.5%) | 13 (32.5%) |
| Public Administration | 27 (81.8%) | 6 (18.2%) |
| Total | 483 (58.6%) | 342 (41.4%) |
Education in Pinehurst
School Enrollment in Pinehurst
The most common levels of schooling among the 325 students in Pinehurst are elementary school (114 | 35.1%), high school (74 | 22.8%), and kindergarten (40 | 12.3%).
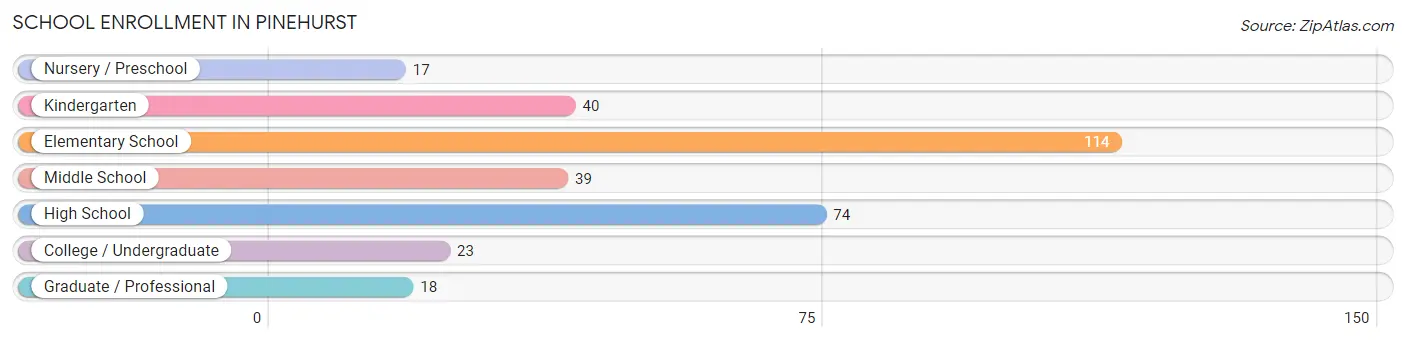
| School Level | # Students | % Students |
| Nursery / Preschool | 17 | 5.2% |
| Kindergarten | 40 | 12.3% |
| Elementary School | 114 | 35.1% |
| Middle School | 39 | 12.0% |
| High School | 74 | 22.8% |
| College / Undergraduate | 23 | 7.1% |
| Graduate / Professional | 18 | 5.5% |
| Total | 325 | 100.0% |
School Enrollment by Age by Funding Source in Pinehurst
Out of a total of 325 students who are enrolled in schools in Pinehurst, 5 (1.5%) attend a private institution, while the remaining 320 (98.5%) are enrolled in public schools. The age group of 5 to 9 year old has the highest likelihood of being enrolled in private schools, with 5 (3.0% in the age bracket) enrolled. Conversely, the age group of 3 to 4 year olds has the lowest likelihood of being enrolled in a private school, with 5 (100.0% in the age bracket) attending a public institution.
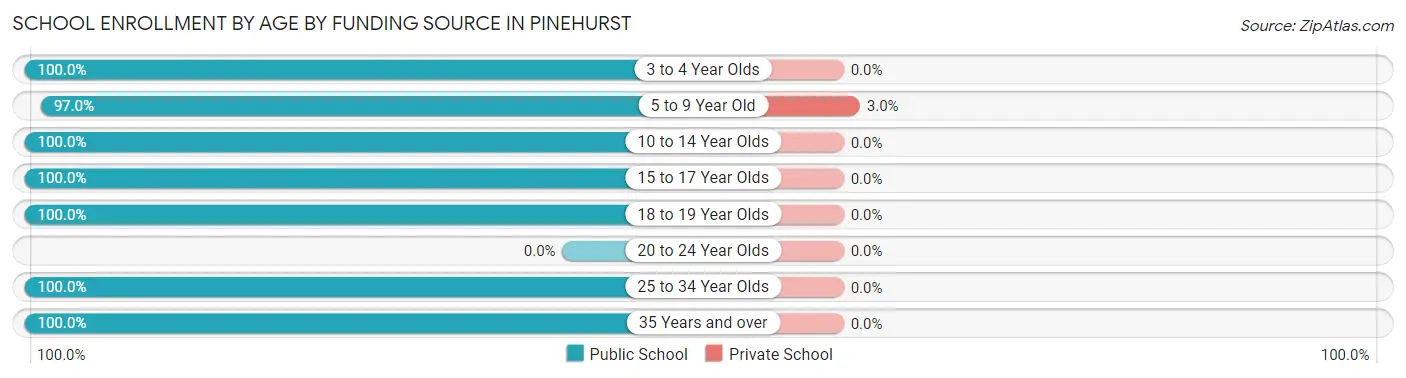
| Age Bracket | Public School | Private School |
| 3 to 4 Year Olds | 5 (100.0%) | 0 (0.0%) |
| 5 to 9 Year Old | 161 (97.0%) | 5 (3.0%) |
| 10 to 14 Year Olds | 48 (100.0%) | 0 (0.0%) |
| 15 to 17 Year Olds | 52 (100.0%) | 0 (0.0%) |
| 18 to 19 Year Olds | 13 (100.0%) | 0 (0.0%) |
| 20 to 24 Year Olds | 0 (0.0%) | 0 (0.0%) |
| 25 to 34 Year Olds | 37 (100.0%) | 0 (0.0%) |
| 35 Years and over | 4 (100.0%) | 0 (0.0%) |
| Total | 320 (98.5%) | 5 (1.5%) |
Educational Attainment by Field of Study in Pinehurst
Arts & humanities (48 | 26.2%), business (37 | 20.2%), science & technology (22 | 12.0%), psychology (17 | 9.3%), and computers & mathematics (13 | 7.1%) are the most common fields of study among 183 individuals in Pinehurst who have obtained a bachelor's degree or higher.
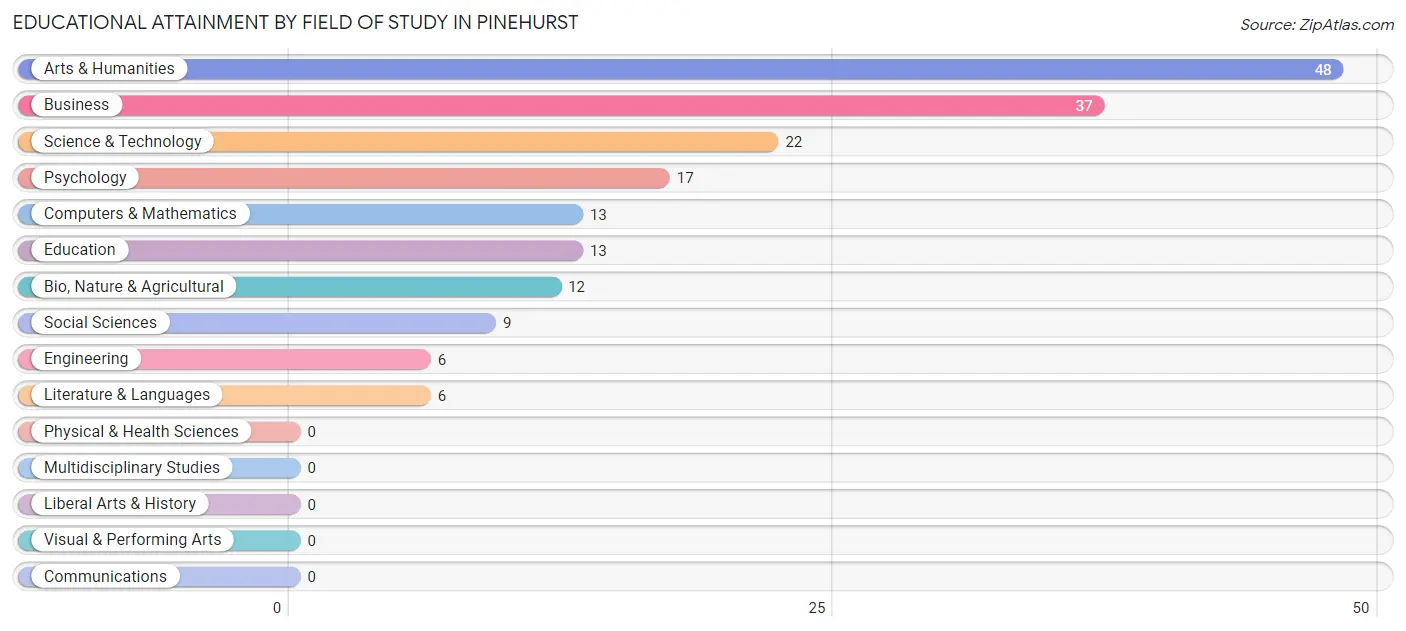
| Field of Study | # Graduates | % Graduates |
| Computers & Mathematics | 13 | 7.1% |
| Bio, Nature & Agricultural | 12 | 6.6% |
| Physical & Health Sciences | 0 | 0.0% |
| Psychology | 17 | 9.3% |
| Social Sciences | 9 | 4.9% |
| Engineering | 6 | 3.3% |
| Multidisciplinary Studies | 0 | 0.0% |
| Science & Technology | 22 | 12.0% |
| Business | 37 | 20.2% |
| Education | 13 | 7.1% |
| Literature & Languages | 6 | 3.3% |
| Liberal Arts & History | 0 | 0.0% |
| Visual & Performing Arts | 0 | 0.0% |
| Communications | 0 | 0.0% |
| Arts & Humanities | 48 | 26.2% |
| Total | 183 | 100.0% |
Transportation & Commute in Pinehurst
Vehicle Availability by Sex in Pinehurst
The most prevalent vehicle ownership categories in Pinehurst are males with 3 vehicles (238, accounting for 50.6%) and females with 3 vehicles (148, making up 71.5%).
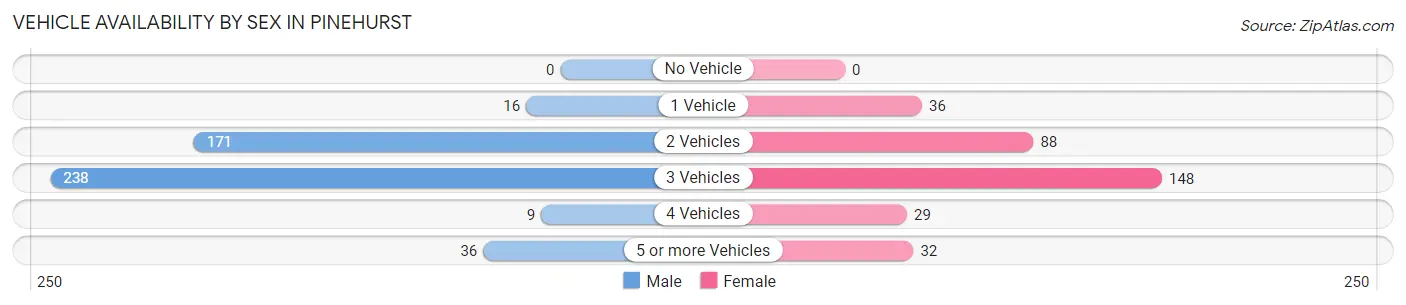
| Vehicles Available | Male | Female |
| No Vehicle | 0 (0.0%) | 0 (0.0%) |
| 1 Vehicle | 16 (3.4%) | 36 (10.8%) |
| 2 Vehicles | 171 (36.4%) | 88 (26.4%) |
| 3 Vehicles | 238 (50.6%) | 148 (44.4%) |
| 4 Vehicles | 9 (1.9%) | 29 (8.7%) |
| 5 or more Vehicles | 36 (7.7%) | 32 (9.6%) |
| Total | 470 (100.0%) | 333 (100.0%) |
Commute Time in Pinehurst
The most frequently occuring commute durations in Pinehurst are 10 to 14 minutes (224 commuters, 29.2%), 60 to 89 minutes (108 commuters, 14.1%), and 5 to 9 minutes (84 commuters, 10.9%).
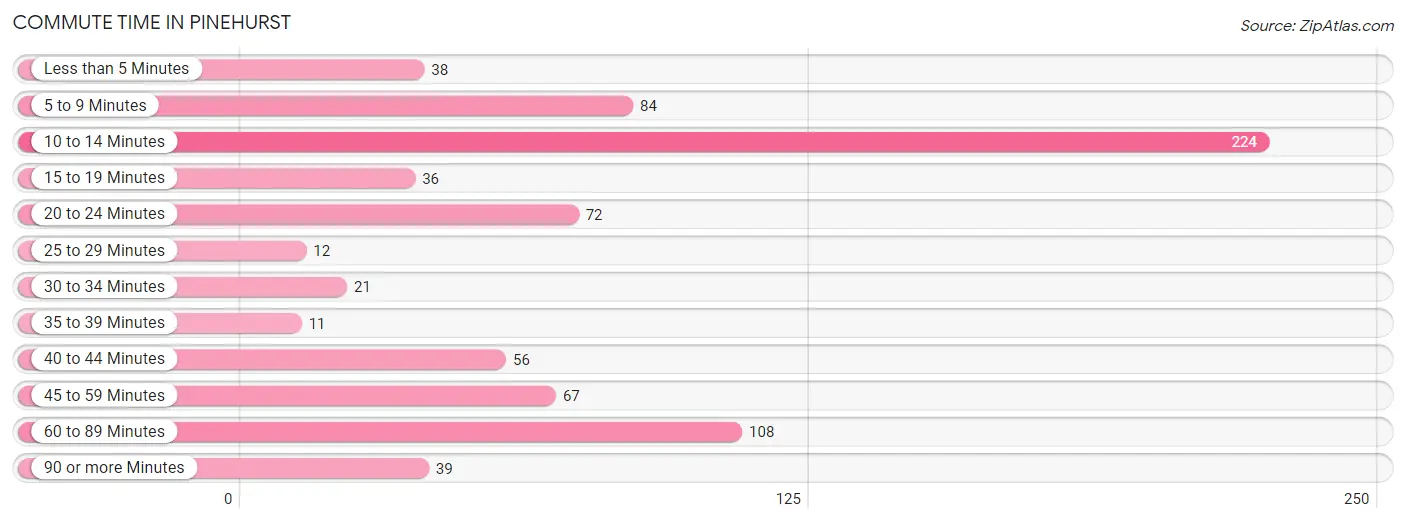
| Commute Time | # Commuters | % Commuters |
| Less than 5 Minutes | 38 | 5.0% |
| 5 to 9 Minutes | 84 | 10.9% |
| 10 to 14 Minutes | 224 | 29.2% |
| 15 to 19 Minutes | 36 | 4.7% |
| 20 to 24 Minutes | 72 | 9.4% |
| 25 to 29 Minutes | 12 | 1.6% |
| 30 to 34 Minutes | 21 | 2.7% |
| 35 to 39 Minutes | 11 | 1.4% |
| 40 to 44 Minutes | 56 | 7.3% |
| 45 to 59 Minutes | 67 | 8.7% |
| 60 to 89 Minutes | 108 | 14.1% |
| 90 or more Minutes | 39 | 5.1% |
Commute Time by Sex in Pinehurst
The most common commute times in Pinehurst are 60 to 89 minutes (103 commuters, 22.5%) for males and 10 to 14 minutes (146 commuters, 47.1%) for females.
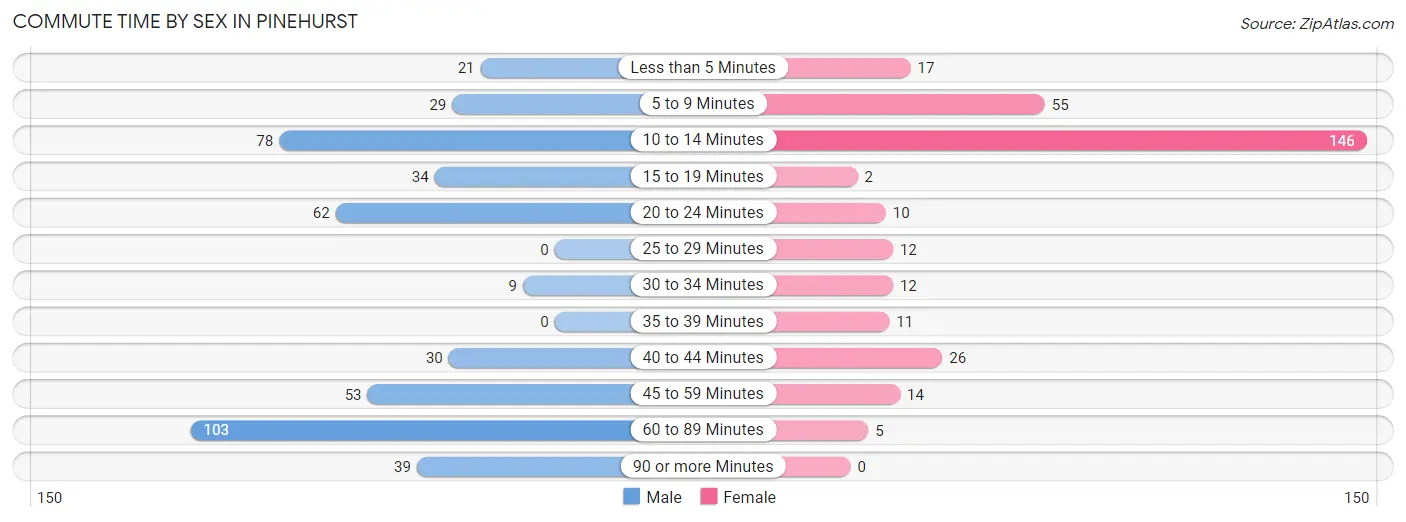
| Commute Time | Male | Female |
| Less than 5 Minutes | 21 (4.6%) | 17 (5.5%) |
| 5 to 9 Minutes | 29 (6.3%) | 55 (17.7%) |
| 10 to 14 Minutes | 78 (17.0%) | 146 (47.1%) |
| 15 to 19 Minutes | 34 (7.4%) | 2 (0.6%) |
| 20 to 24 Minutes | 62 (13.5%) | 10 (3.2%) |
| 25 to 29 Minutes | 0 (0.0%) | 12 (3.9%) |
| 30 to 34 Minutes | 9 (2.0%) | 12 (3.9%) |
| 35 to 39 Minutes | 0 (0.0%) | 11 (3.5%) |
| 40 to 44 Minutes | 30 (6.6%) | 26 (8.4%) |
| 45 to 59 Minutes | 53 (11.6%) | 14 (4.5%) |
| 60 to 89 Minutes | 103 (22.5%) | 5 (1.6%) |
| 90 or more Minutes | 39 (8.5%) | 0 (0.0%) |
Time of Departure to Work by Sex in Pinehurst
The most frequent times of departure to work in Pinehurst are 12:00 AM to 4:59 AM (130, 28.4%) for males and 8:00 AM to 8:29 AM (78, 25.2%) for females.
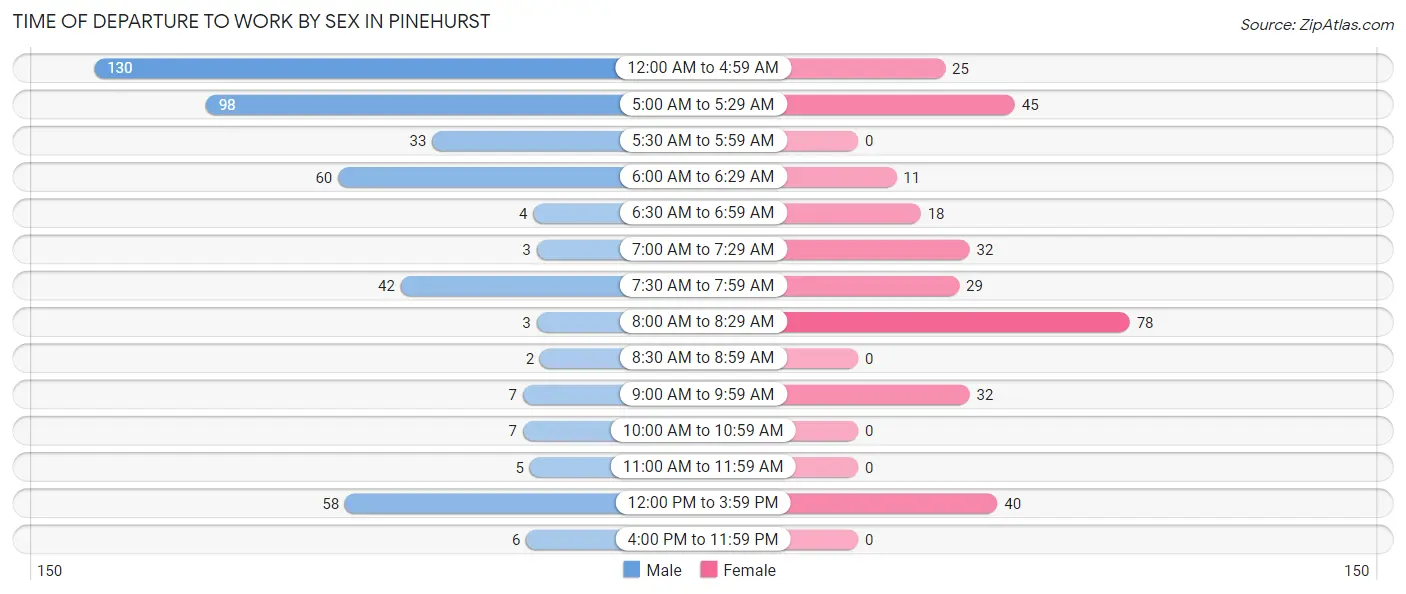
| Time of Departure | Male | Female |
| 12:00 AM to 4:59 AM | 130 (28.4%) | 25 (8.1%) |
| 5:00 AM to 5:29 AM | 98 (21.4%) | 45 (14.5%) |
| 5:30 AM to 5:59 AM | 33 (7.2%) | 0 (0.0%) |
| 6:00 AM to 6:29 AM | 60 (13.1%) | 11 (3.5%) |
| 6:30 AM to 6:59 AM | 4 (0.9%) | 18 (5.8%) |
| 7:00 AM to 7:29 AM | 3 (0.7%) | 32 (10.3%) |
| 7:30 AM to 7:59 AM | 42 (9.2%) | 29 (9.3%) |
| 8:00 AM to 8:29 AM | 3 (0.7%) | 78 (25.2%) |
| 8:30 AM to 8:59 AM | 2 (0.4%) | 0 (0.0%) |
| 9:00 AM to 9:59 AM | 7 (1.5%) | 32 (10.3%) |
| 10:00 AM to 10:59 AM | 7 (1.5%) | 0 (0.0%) |
| 11:00 AM to 11:59 AM | 5 (1.1%) | 0 (0.0%) |
| 12:00 PM to 3:59 PM | 58 (12.7%) | 40 (12.9%) |
| 4:00 PM to 11:59 PM | 6 (1.3%) | 0 (0.0%) |
| Total | 458 (100.0%) | 310 (100.0%) |
Housing Occupancy in Pinehurst
Occupancy by Ownership in Pinehurst
Of the total 719 dwellings in Pinehurst, owner-occupied units account for 549 (76.4%), while renter-occupied units make up 170 (23.6%).
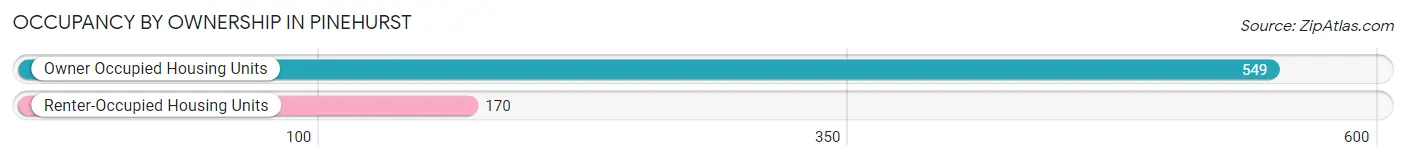
| Occupancy | # Housing Units | % Housing Units |
| Owner Occupied Housing Units | 549 | 76.4% |
| Renter-Occupied Housing Units | 170 | 23.6% |
| Total Occupied Housing Units | 719 | 100.0% |
Occupancy by Household Size in Pinehurst
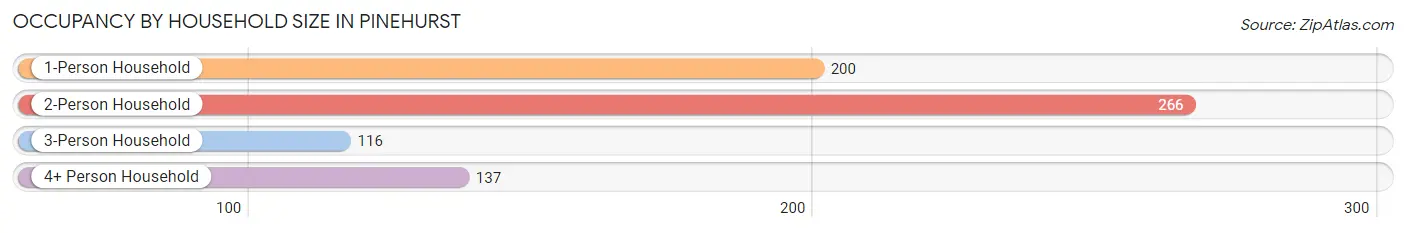
| Household Size | # Housing Units | % Housing Units |
| 1-Person Household | 200 | 27.8% |
| 2-Person Household | 266 | 37.0% |
| 3-Person Household | 116 | 16.1% |
| 4+ Person Household | 137 | 19.1% |
| Total Housing Units | 719 | 100.0% |
Occupancy by Ownership by Household Size in Pinehurst
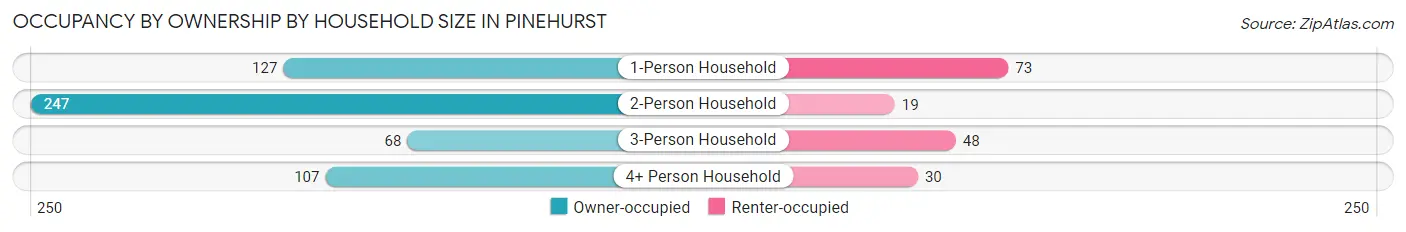
| Household Size | Owner-occupied | Renter-occupied |
| 1-Person Household | 127 (63.5%) | 73 (36.5%) |
| 2-Person Household | 247 (92.9%) | 19 (7.1%) |
| 3-Person Household | 68 (58.6%) | 48 (41.4%) |
| 4+ Person Household | 107 (78.1%) | 30 (21.9%) |
| Total Housing Units | 549 (76.4%) | 170 (23.6%) |
Occupancy by Educational Attainment in Pinehurst
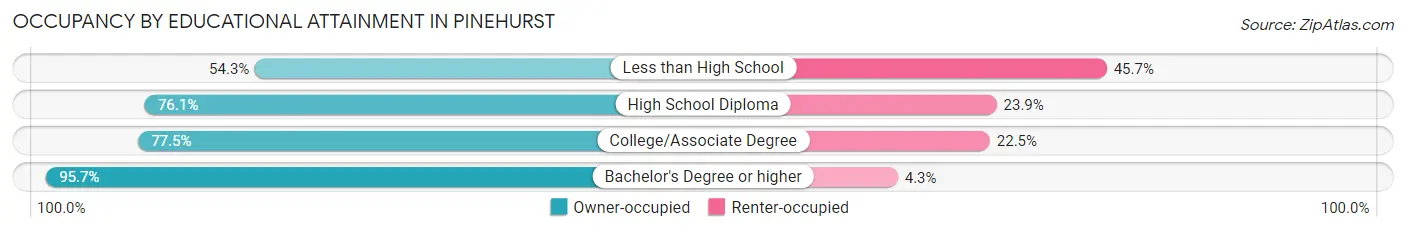
| Household Size | Owner-occupied | Renter-occupied |
| Less than High School | 38 (54.3%) | 32 (45.7%) |
| High School Diploma | 255 (76.1%) | 80 (23.9%) |
| College/Associate Degree | 189 (77.5%) | 55 (22.5%) |
| Bachelor's Degree or higher | 67 (95.7%) | 3 (4.3%) |
Occupancy by Age of Householder in Pinehurst
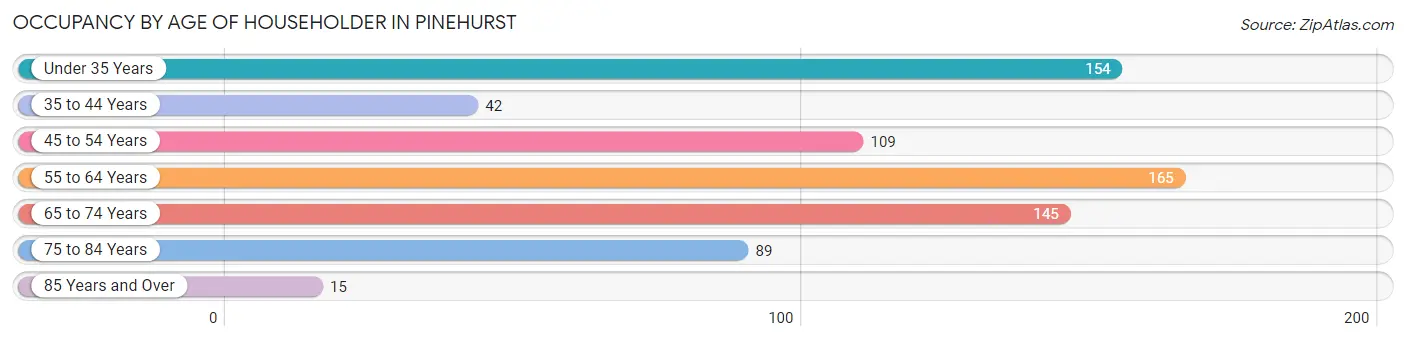
| Age Bracket | # Households | % Households |
| Under 35 Years | 154 | 21.4% |
| 35 to 44 Years | 42 | 5.8% |
| 45 to 54 Years | 109 | 15.2% |
| 55 to 64 Years | 165 | 23.0% |
| 65 to 74 Years | 145 | 20.2% |
| 75 to 84 Years | 89 | 12.4% |
| 85 Years and Over | 15 | 2.1% |
| Total | 719 | 100.0% |
Housing Finances in Pinehurst
Median Income by Occupancy in Pinehurst
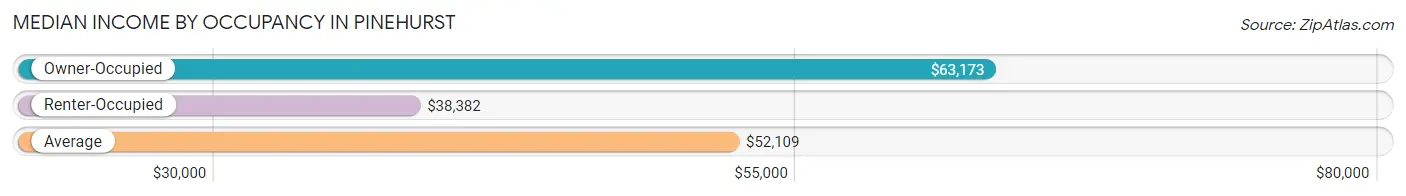
| Occupancy Type | # Households | Median Income |
| Owner-Occupied | 549 (76.4%) | $63,173 |
| Renter-Occupied | 170 (23.6%) | $38,382 |
| Average | 719 (100.0%) | $52,109 |
Occupancy by Householder Income Bracket in Pinehurst
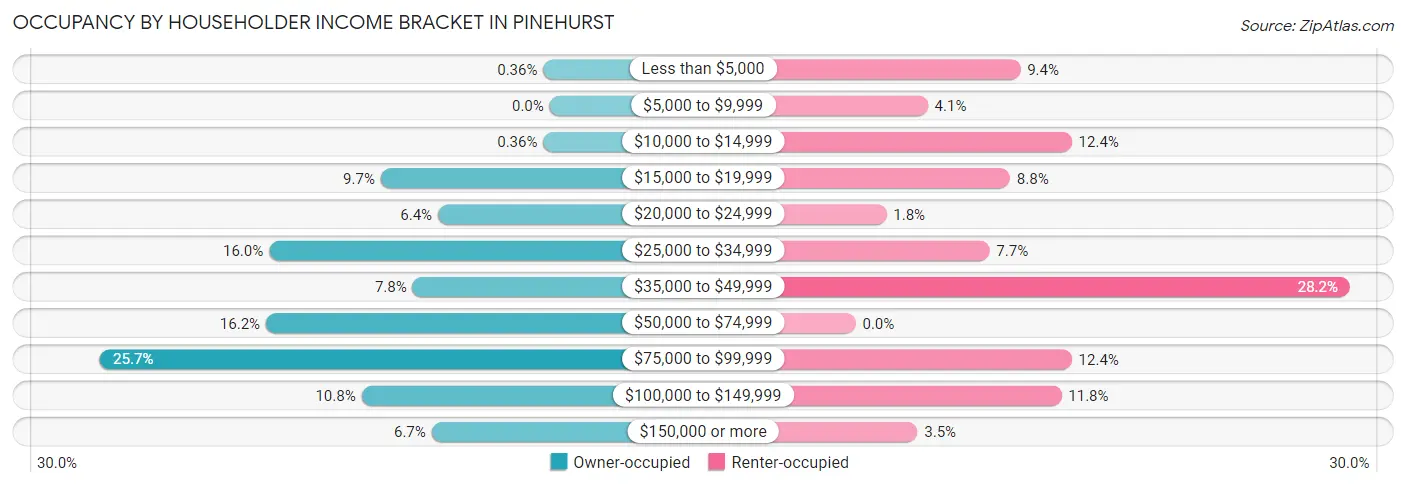
| Income Bracket | Owner-occupied | Renter-occupied |
| Less than $5,000 | 2 (0.4%) | 16 (9.4%) |
| $5,000 to $9,999 | 0 (0.0%) | 7 (4.1%) |
| $10,000 to $14,999 | 2 (0.4%) | 21 (12.3%) |
| $15,000 to $19,999 | 53 (9.7%) | 15 (8.8%) |
| $20,000 to $24,999 | 35 (6.4%) | 3 (1.8%) |
| $25,000 to $34,999 | 88 (16.0%) | 13 (7.6%) |
| $35,000 to $49,999 | 43 (7.8%) | 48 (28.2%) |
| $50,000 to $74,999 | 89 (16.2%) | 0 (0.0%) |
| $75,000 to $99,999 | 141 (25.7%) | 21 (12.3%) |
| $100,000 to $149,999 | 59 (10.7%) | 20 (11.8%) |
| $150,000 or more | 37 (6.7%) | 6 (3.5%) |
| Total | 549 (100.0%) | 170 (100.0%) |
Monthly Housing Cost Tiers in Pinehurst
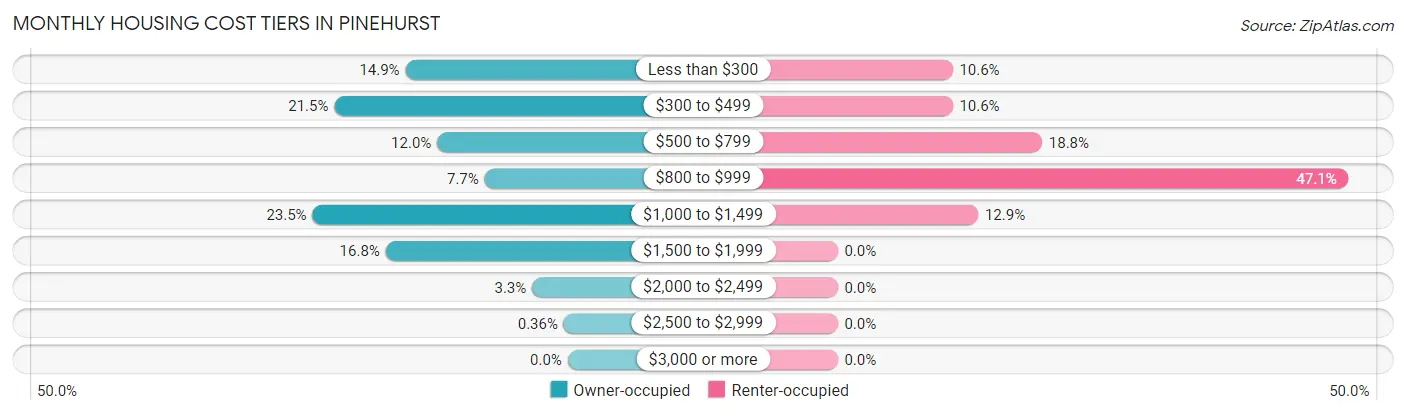
| Monthly Cost | Owner-occupied | Renter-occupied |
| Less than $300 | 82 (14.9%) | 18 (10.6%) |
| $300 to $499 | 118 (21.5%) | 18 (10.6%) |
| $500 to $799 | 66 (12.0%) | 32 (18.8%) |
| $800 to $999 | 42 (7.6%) | 80 (47.1%) |
| $1,000 to $1,499 | 129 (23.5%) | 22 (12.9%) |
| $1,500 to $1,999 | 92 (16.8%) | 0 (0.0%) |
| $2,000 to $2,499 | 18 (3.3%) | 0 (0.0%) |
| $2,500 to $2,999 | 2 (0.4%) | 0 (0.0%) |
| $3,000 or more | 0 (0.0%) | 0 (0.0%) |
| Total | 549 (100.0%) | 170 (100.0%) |
Physical Housing Characteristics in Pinehurst
Housing Structures in Pinehurst
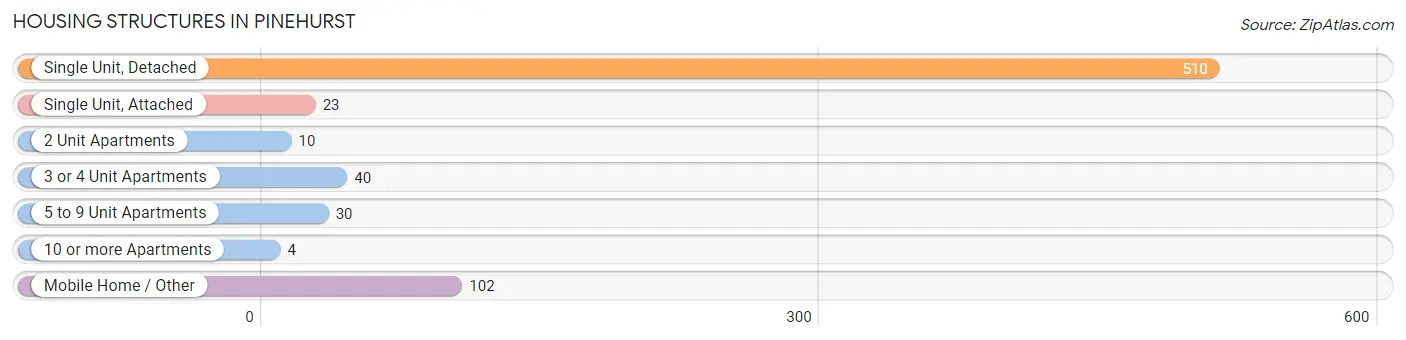
| Structure Type | # Housing Units | % Housing Units |
| Single Unit, Detached | 510 | 70.9% |
| Single Unit, Attached | 23 | 3.2% |
| 2 Unit Apartments | 10 | 1.4% |
| 3 or 4 Unit Apartments | 40 | 5.6% |
| 5 to 9 Unit Apartments | 30 | 4.2% |
| 10 or more Apartments | 4 | 0.6% |
| Mobile Home / Other | 102 | 14.2% |
| Total | 719 | 100.0% |
Housing Structures by Occupancy in Pinehurst
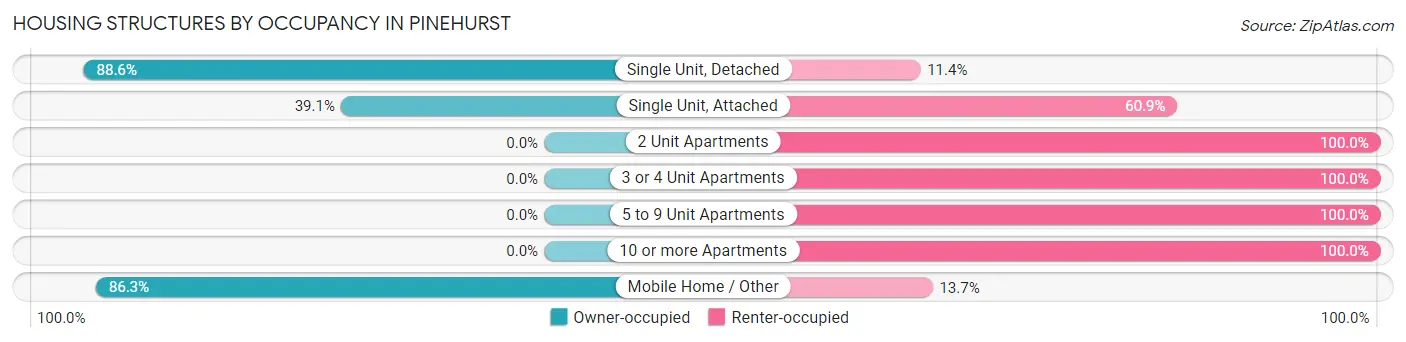
| Structure Type | Owner-occupied | Renter-occupied |
| Single Unit, Detached | 452 (88.6%) | 58 (11.4%) |
| Single Unit, Attached | 9 (39.1%) | 14 (60.9%) |
| 2 Unit Apartments | 0 (0.0%) | 10 (100.0%) |
| 3 or 4 Unit Apartments | 0 (0.0%) | 40 (100.0%) |
| 5 to 9 Unit Apartments | 0 (0.0%) | 30 (100.0%) |
| 10 or more Apartments | 0 (0.0%) | 4 (100.0%) |
| Mobile Home / Other | 88 (86.3%) | 14 (13.7%) |
| Total | 549 (76.4%) | 170 (23.6%) |
Housing Structures by Number of Rooms in Pinehurst
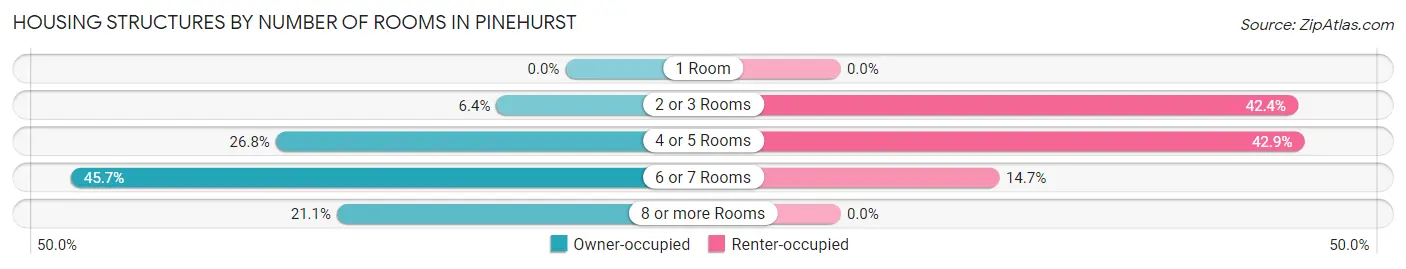
| Number of Rooms | Owner-occupied | Renter-occupied |
| 1 Room | 0 (0.0%) | 0 (0.0%) |
| 2 or 3 Rooms | 35 (6.4%) | 72 (42.3%) |
| 4 or 5 Rooms | 147 (26.8%) | 73 (42.9%) |
| 6 or 7 Rooms | 251 (45.7%) | 25 (14.7%) |
| 8 or more Rooms | 116 (21.1%) | 0 (0.0%) |
| Total | 549 (100.0%) | 170 (100.0%) |
Housing Structure by Heating Type in Pinehurst
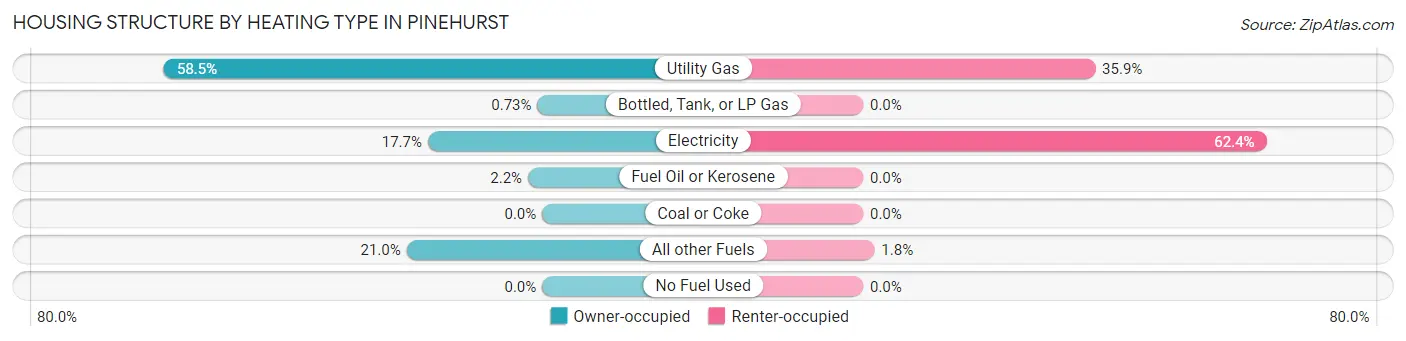
| Heating Type | Owner-occupied | Renter-occupied |
| Utility Gas | 321 (58.5%) | 61 (35.9%) |
| Bottled, Tank, or LP Gas | 4 (0.7%) | 0 (0.0%) |
| Electricity | 97 (17.7%) | 106 (62.4%) |
| Fuel Oil or Kerosene | 12 (2.2%) | 0 (0.0%) |
| Coal or Coke | 0 (0.0%) | 0 (0.0%) |
| All other Fuels | 115 (20.9%) | 3 (1.8%) |
| No Fuel Used | 0 (0.0%) | 0 (0.0%) |
| Total | 549 (100.0%) | 170 (100.0%) |
Household Vehicle Usage in Pinehurst
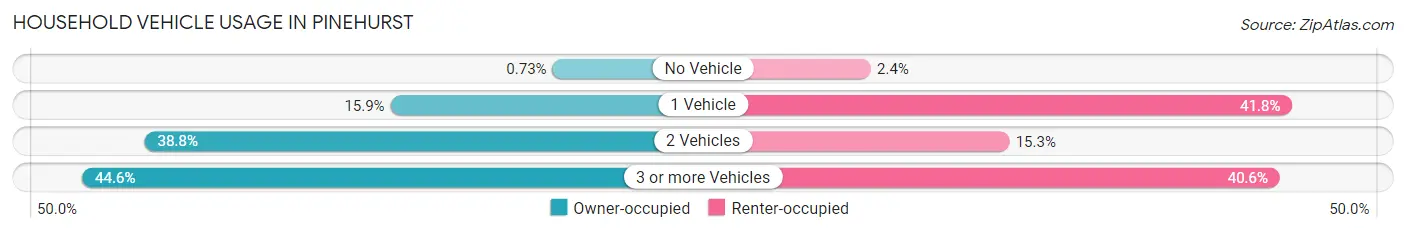
| Vehicles per Household | Owner-occupied | Renter-occupied |
| No Vehicle | 4 (0.7%) | 4 (2.4%) |
| 1 Vehicle | 87 (15.9%) | 71 (41.8%) |
| 2 Vehicles | 213 (38.8%) | 26 (15.3%) |
| 3 or more Vehicles | 245 (44.6%) | 69 (40.6%) |
| Total | 549 (100.0%) | 170 (100.0%) |
Real Estate & Mortgages in Pinehurst
Real Estate and Mortgage Overview in Pinehurst
| Characteristic | Without Mortgage | With Mortgage |
| Housing Units | 249 | 300 |
| Median Property Value | $140,300 | $239,500 |
| Median Household Income | $44,875 | $19 |
| Monthly Housing Costs | $399 | $0 |
| Real Estate Taxes | $1,146 | $0 |
Property Value by Mortgage Status in Pinehurst
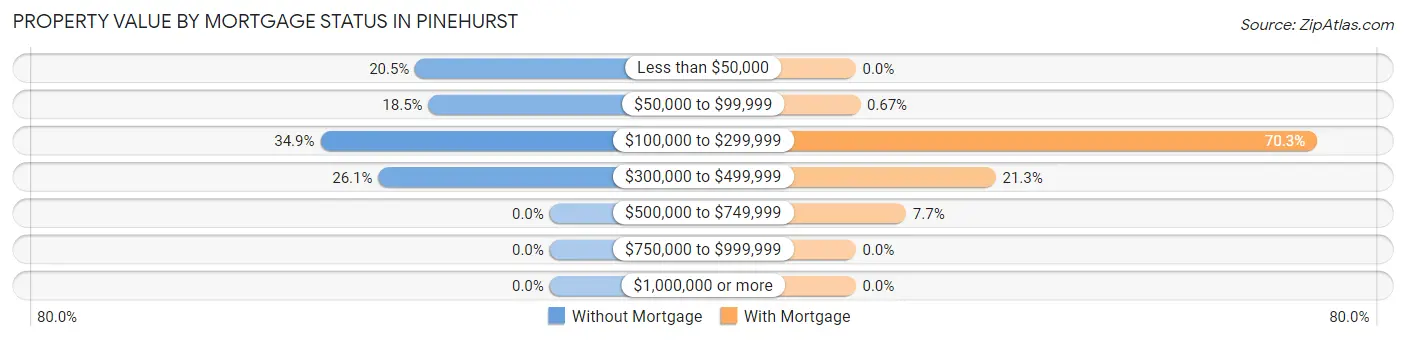
| Property Value | Without Mortgage | With Mortgage |
| Less than $50,000 | 51 (20.5%) | 0 (0.0%) |
| $50,000 to $99,999 | 46 (18.5%) | 2 (0.7%) |
| $100,000 to $299,999 | 87 (34.9%) | 211 (70.3%) |
| $300,000 to $499,999 | 65 (26.1%) | 64 (21.3%) |
| $500,000 to $749,999 | 0 (0.0%) | 23 (7.7%) |
| $750,000 to $999,999 | 0 (0.0%) | 0 (0.0%) |
| $1,000,000 or more | 0 (0.0%) | 0 (0.0%) |
| Total | 249 (100.0%) | 300 (100.0%) |
Household Income by Mortgage Status in Pinehurst
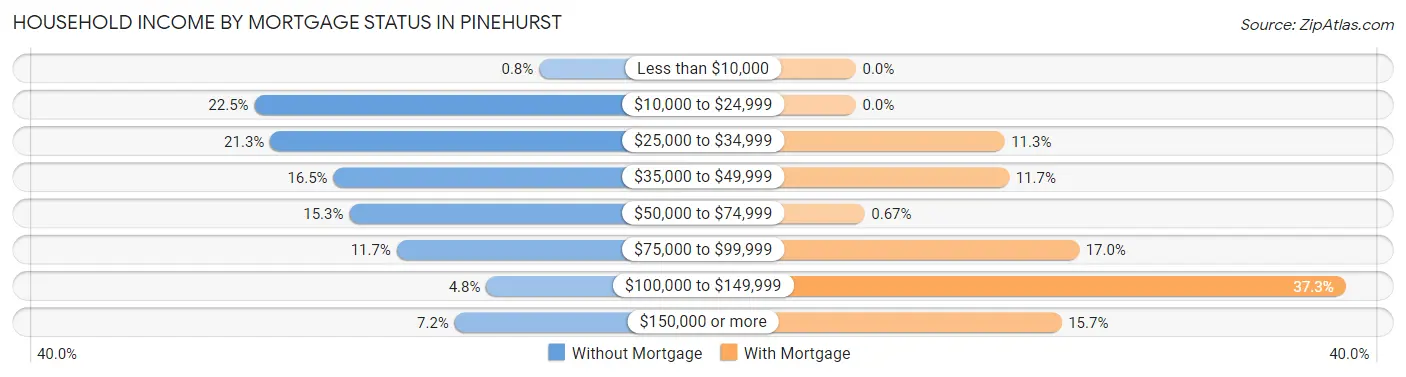
| Household Income | Without Mortgage | With Mortgage |
| Less than $10,000 | 2 (0.8%) | 0 (0.0%) |
| $10,000 to $24,999 | 56 (22.5%) | 0 (0.0%) |
| $25,000 to $34,999 | 53 (21.3%) | 34 (11.3%) |
| $35,000 to $49,999 | 41 (16.5%) | 35 (11.7%) |
| $50,000 to $74,999 | 38 (15.3%) | 2 (0.7%) |
| $75,000 to $99,999 | 29 (11.7%) | 51 (17.0%) |
| $100,000 to $149,999 | 12 (4.8%) | 112 (37.3%) |
| $150,000 or more | 18 (7.2%) | 47 (15.7%) |
| Total | 249 (100.0%) | 300 (100.0%) |
Property Value to Household Income Ratio in Pinehurst
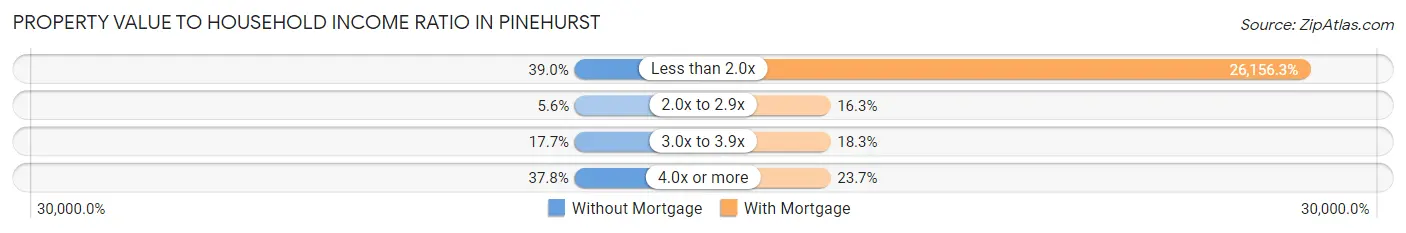
| Value-to-Income Ratio | Without Mortgage | With Mortgage |
| Less than 2.0x | 97 (39.0%) | 78,469 (26,156.3%) |
| 2.0x to 2.9x | 14 (5.6%) | 49 (16.3%) |
| 3.0x to 3.9x | 44 (17.7%) | 55 (18.3%) |
| 4.0x or more | 94 (37.8%) | 71 (23.7%) |
| Total | 249 (100.0%) | 300 (100.0%) |
Real Estate Taxes by Mortgage Status in Pinehurst
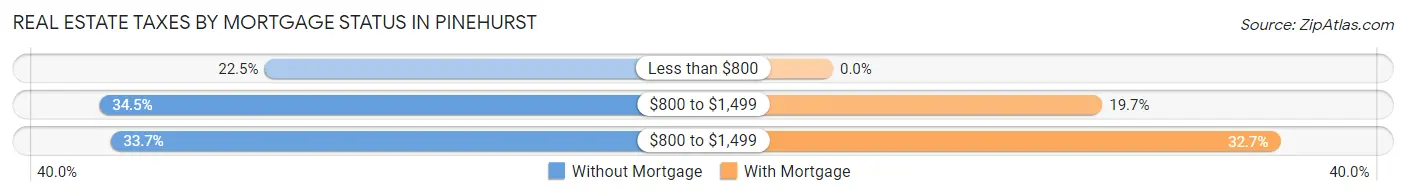
| Property Taxes | Without Mortgage | With Mortgage |
| Less than $800 | 56 (22.5%) | 0 (0.0%) |
| $800 to $1,499 | 86 (34.5%) | 59 (19.7%) |
| $800 to $1,499 | 84 (33.7%) | 98 (32.7%) |
| Total | 249 (100.0%) | 300 (100.0%) |
Health & Disability in Pinehurst
Health Insurance Coverage by Age in Pinehurst
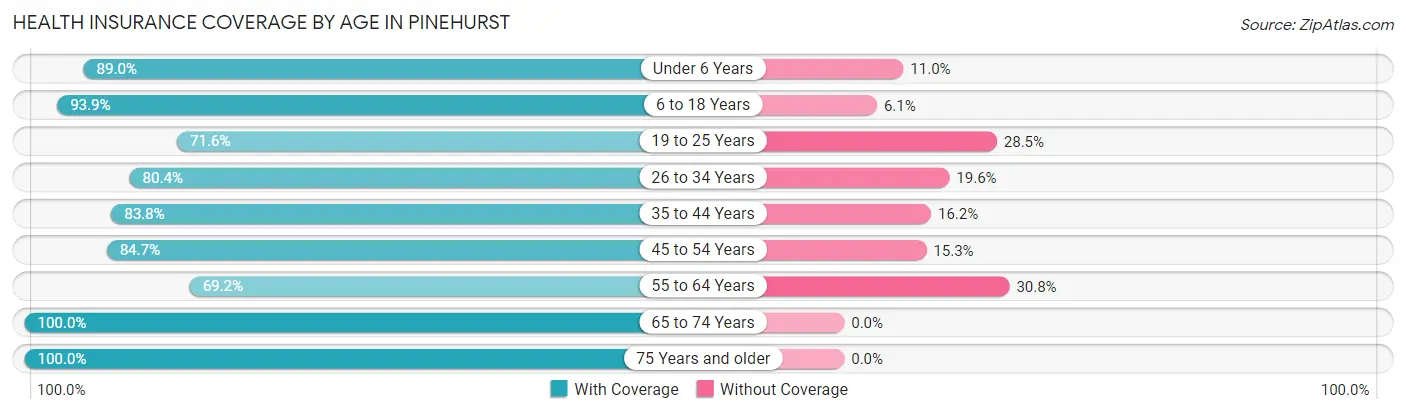
| Age Bracket | With Coverage | Without Coverage |
| Under 6 Years | 210 (89.0%) | 26 (11.0%) |
| 6 to 18 Years | 216 (93.9%) | 14 (6.1%) |
| 19 to 25 Years | 83 (71.6%) | 33 (28.4%) |
| 26 to 34 Years | 242 (80.4%) | 59 (19.6%) |
| 35 to 44 Years | 171 (83.8%) | 33 (16.2%) |
| 45 to 54 Years | 199 (84.7%) | 36 (15.3%) |
| 55 to 64 Years | 191 (69.2%) | 85 (30.8%) |
| 65 to 74 Years | 228 (100.0%) | 0 (0.0%) |
| 75 Years and older | 163 (100.0%) | 0 (0.0%) |
| Total | 1,703 (85.6%) | 286 (14.4%) |
Health Insurance Coverage by Citizenship Status in Pinehurst
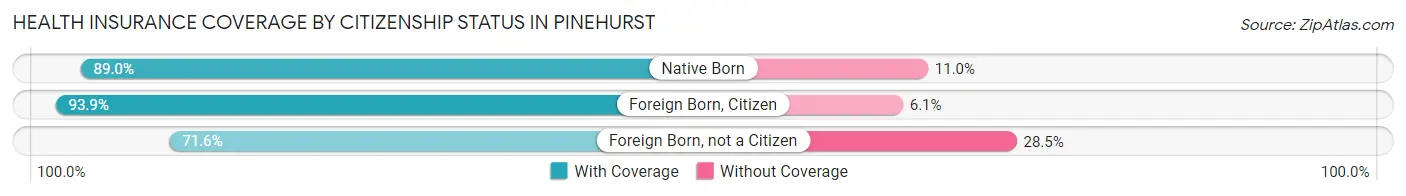
| Citizenship Status | With Coverage | Without Coverage |
| Native Born | 210 (89.0%) | 26 (11.0%) |
| Foreign Born, Citizen | 216 (93.9%) | 14 (6.1%) |
| Foreign Born, not a Citizen | 83 (71.6%) | 33 (28.4%) |
Health Insurance Coverage by Household Income in Pinehurst
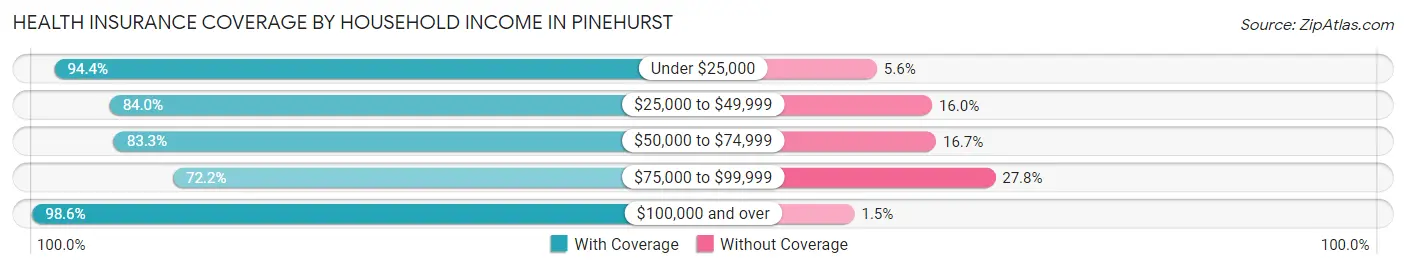
| Household Income | With Coverage | Without Coverage |
| Under $25,000 | 184 (94.4%) | 11 (5.6%) |
| $25,000 to $49,999 | 479 (84.0%) | 91 (16.0%) |
| $50,000 to $74,999 | 219 (83.3%) | 44 (16.7%) |
| $75,000 to $99,999 | 345 (72.2%) | 133 (27.8%) |
| $100,000 and over | 476 (98.6%) | 7 (1.5%) |
Public vs Private Health Insurance Coverage by Age in Pinehurst
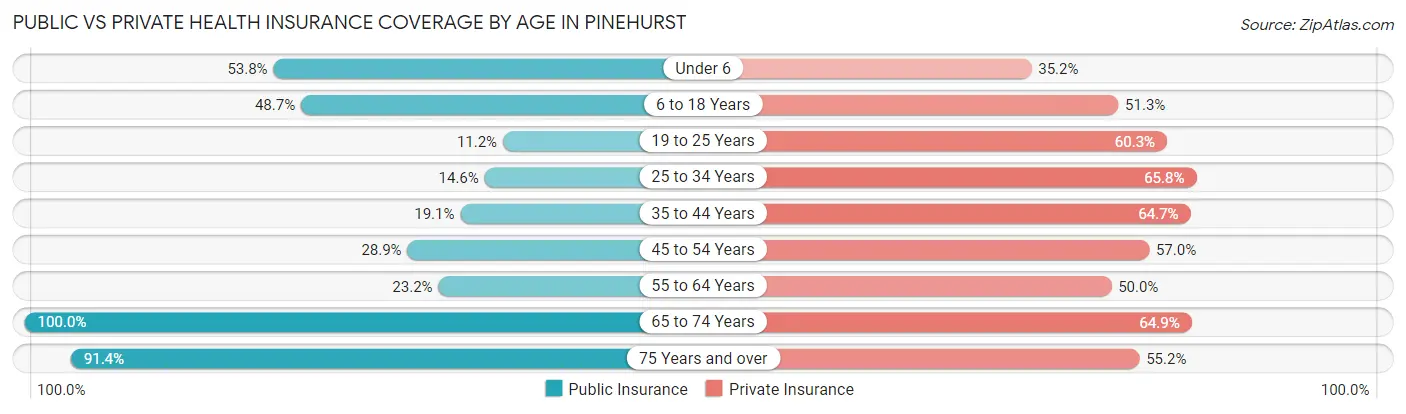
| Age Bracket | Public Insurance | Private Insurance |
| Under 6 | 127 (53.8%) | 83 (35.2%) |
| 6 to 18 Years | 112 (48.7%) | 118 (51.3%) |
| 19 to 25 Years | 13 (11.2%) | 70 (60.3%) |
| 25 to 34 Years | 44 (14.6%) | 198 (65.8%) |
| 35 to 44 Years | 39 (19.1%) | 132 (64.7%) |
| 45 to 54 Years | 68 (28.9%) | 134 (57.0%) |
| 55 to 64 Years | 64 (23.2%) | 138 (50.0%) |
| 65 to 74 Years | 228 (100.0%) | 148 (64.9%) |
| 75 Years and over | 149 (91.4%) | 90 (55.2%) |
| Total | 844 (42.4%) | 1,111 (55.9%) |
Disability Status by Sex by Age in Pinehurst
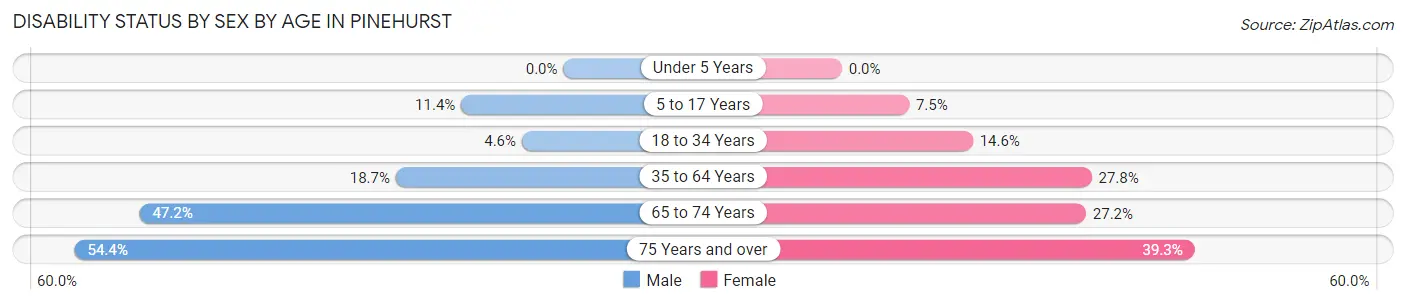
| Age Bracket | Male | Female |
| Under 5 Years | 0 (0.0%) | 0 (0.0%) |
| 5 to 17 Years | 14 (11.4%) | 11 (7.5%) |
| 18 to 34 Years | 11 (4.6%) | 28 (14.6%) |
| 35 to 64 Years | 67 (18.7%) | 99 (27.8%) |
| 65 to 74 Years | 59 (47.2%) | 28 (27.2%) |
| 75 Years and over | 43 (54.4%) | 33 (39.3%) |
Disability Class by Sex by Age in Pinehurst
Disability Class: Hearing Difficulty
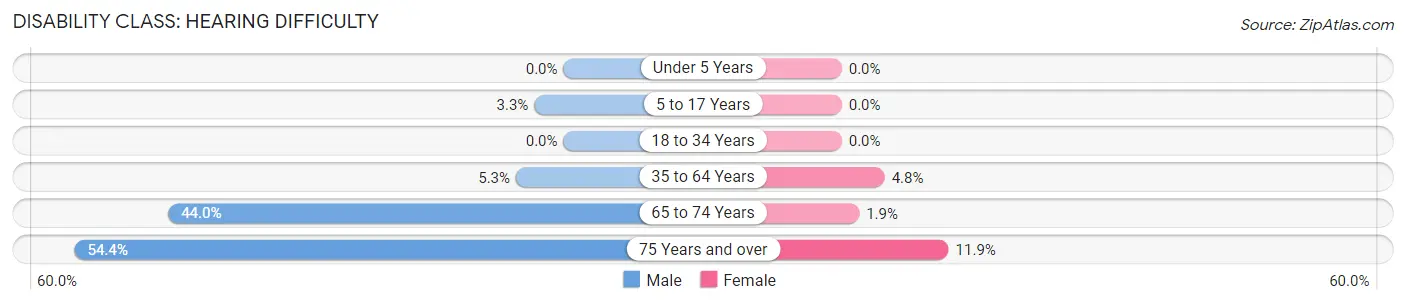
| Age Bracket | Male | Female |
| Under 5 Years | 0 (0.0%) | 0 (0.0%) |
| 5 to 17 Years | 4 (3.3%) | 0 (0.0%) |
| 18 to 34 Years | 0 (0.0%) | 0 (0.0%) |
| 35 to 64 Years | 19 (5.3%) | 17 (4.8%) |
| 65 to 74 Years | 55 (44.0%) | 2 (1.9%) |
| 75 Years and over | 43 (54.4%) | 10 (11.9%) |
Disability Class: Vision Difficulty
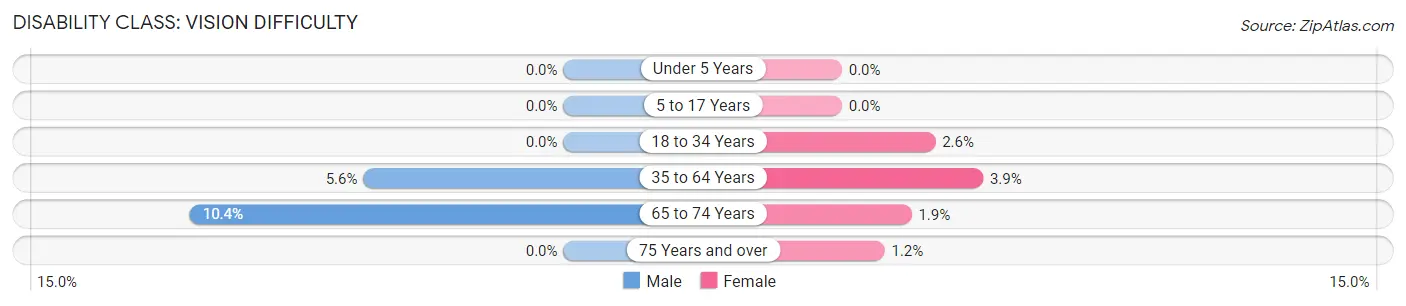
| Age Bracket | Male | Female |
| Under 5 Years | 0 (0.0%) | 0 (0.0%) |
| 5 to 17 Years | 0 (0.0%) | 0 (0.0%) |
| 18 to 34 Years | 0 (0.0%) | 5 (2.6%) |
| 35 to 64 Years | 20 (5.6%) | 14 (3.9%) |
| 65 to 74 Years | 13 (10.4%) | 2 (1.9%) |
| 75 Years and over | 0 (0.0%) | 1 (1.2%) |
Disability Class: Cognitive Difficulty
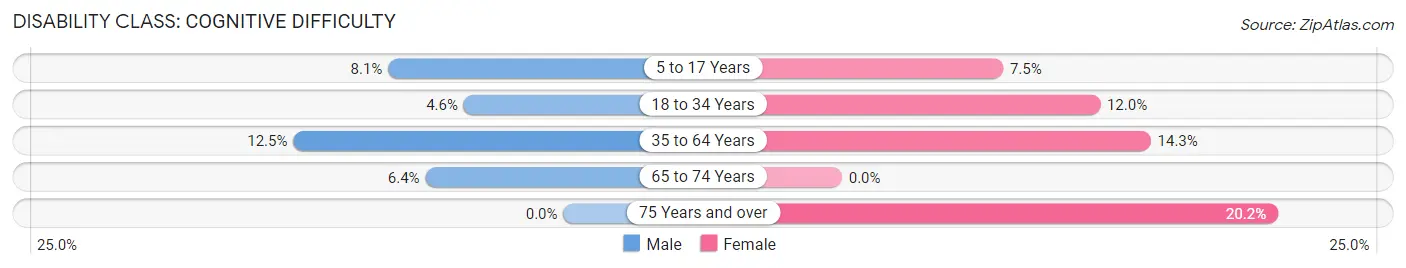
| Age Bracket | Male | Female |
| 5 to 17 Years | 10 (8.1%) | 11 (7.5%) |
| 18 to 34 Years | 11 (4.6%) | 23 (12.0%) |
| 35 to 64 Years | 45 (12.5%) | 51 (14.3%) |
| 65 to 74 Years | 8 (6.4%) | 0 (0.0%) |
| 75 Years and over | 0 (0.0%) | 17 (20.2%) |
Disability Class: Ambulatory Difficulty
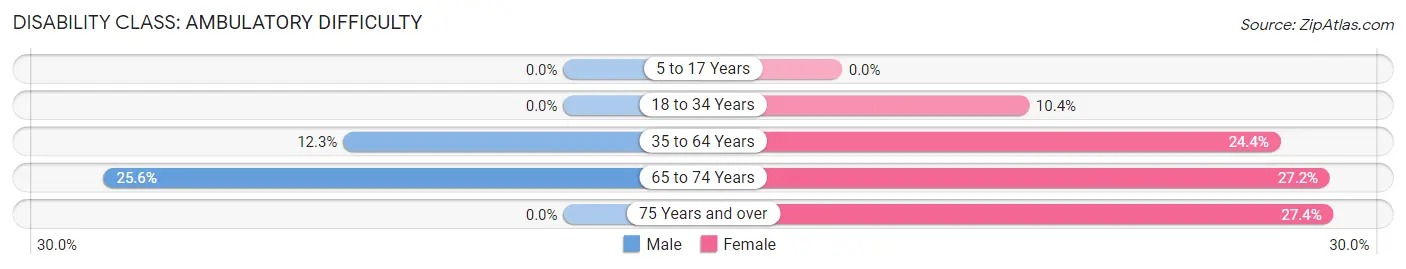
| Age Bracket | Male | Female |
| 5 to 17 Years | 0 (0.0%) | 0 (0.0%) |
| 18 to 34 Years | 0 (0.0%) | 20 (10.4%) |
| 35 to 64 Years | 44 (12.3%) | 87 (24.4%) |
| 65 to 74 Years | 32 (25.6%) | 28 (27.2%) |
| 75 Years and over | 0 (0.0%) | 23 (27.4%) |
Disability Class: Self-Care Difficulty
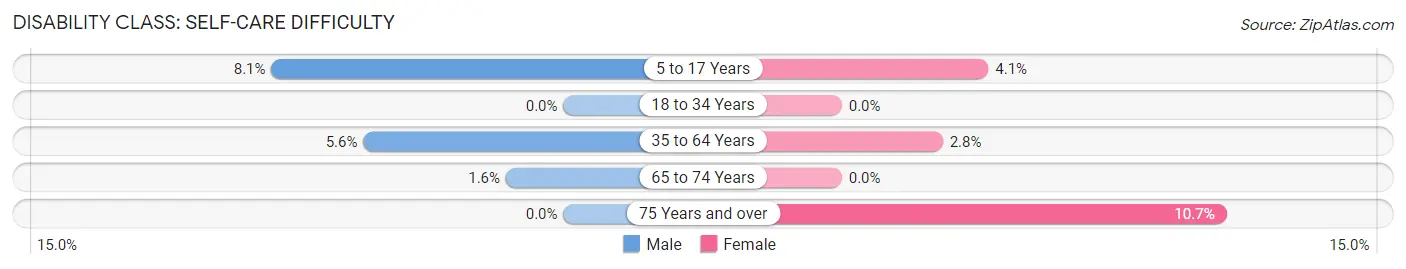
| Age Bracket | Male | Female |
| 5 to 17 Years | 10 (8.1%) | 6 (4.1%) |
| 18 to 34 Years | 0 (0.0%) | 0 (0.0%) |
| 35 to 64 Years | 20 (5.6%) | 10 (2.8%) |
| 65 to 74 Years | 2 (1.6%) | 0 (0.0%) |
| 75 Years and over | 0 (0.0%) | 9 (10.7%) |
Technology Access in Pinehurst
Computing Device Access in Pinehurst
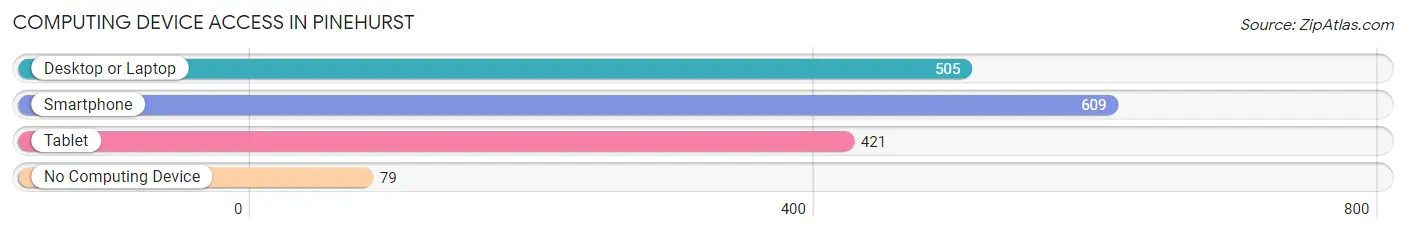
| Device Type | # Households | % Households |
| Desktop or Laptop | 505 | 70.2% |
| Smartphone | 609 | 84.7% |
| Tablet | 421 | 58.6% |
| No Computing Device | 79 | 11.0% |
| Total | 719 | 100.0% |
Internet Access in Pinehurst
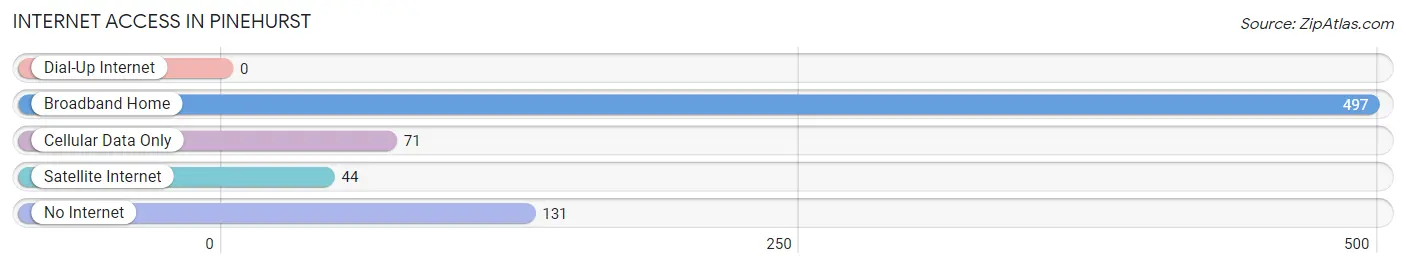
| Internet Type | # Households | % Households |
| Dial-Up Internet | 0 | 0.0% |
| Broadband Home | 497 | 69.1% |
| Cellular Data Only | 71 | 9.9% |
| Satellite Internet | 44 | 6.1% |
| No Internet | 131 | 18.2% |
| Total | 719 | 100.0% |
Pinehurst Summary
Pinehurst is a small city located in the northern part of Idaho, United States. It is situated in the county of Shoshone, and is part of the Coeur d'Alene metropolitan area. The city has a population of approximately 1,500 people, and is located in a rural area surrounded by forests and mountains.
History
Pinehurst was founded in 1883 by a group of settlers from the Midwest. The settlers were looking for a place to settle and start a new life, and they chose the area due to its abundance of natural resources. The settlers named the town after the abundance of pine trees in the area.
The town quickly grew and became a hub for the timber industry. The timber industry provided jobs for many of the town's residents, and the town soon became a prosperous community.
In the early 1900s, the town was connected to the rest of the country by the Northern Pacific Railway. This allowed for the transportation of goods and people to and from the town.
In the 1950s, the town began to experience a decline in the timber industry. This led to a decrease in the population and the town's economy.
In the late 1970s, the town began to experience a resurgence in the timber industry. This led to an increase in the population and the town's economy.
Geography
Pinehurst is located in the northern part of Idaho, in the county of Shoshone. The city is situated in a rural area surrounded by forests and mountains. The city is located at an elevation of 2,845 feet above sea level.
The city is located near the Coeur d'Alene River, which is a tributary of the Columbia River. The city is also located near the Coeur d'Alene National Forest, which is a popular destination for outdoor recreation.
Economy
The economy of Pinehurst is largely based on the timber industry. The city is home to several timber companies, which provide jobs for many of the town's residents.
The city is also home to several small businesses, including restaurants, retail stores, and other services.
Demographics
As of the 2010 census, the population of Pinehurst was 1,500. The racial makeup of the city was 95.2% White, 0.7% African American, 0.7% Native American, 0.7% Asian, 0.7% from other races, and 1.7% from two or more races.
The median household income in Pinehurst was $37,500, and the median family income was $41,250. The per capita income in Pinehurst was $17,500.
Conclusion
Pinehurst is a small city located in the northern part of Idaho, United States. It is situated in the county of Shoshone, and is part of the Coeur d'Alene metropolitan area. The city has a population of approximately 1,500 people, and is located in a rural area surrounded by forests and mountains. The economy of Pinehurst is largely based on the timber industry, and the city is home to several small businesses. The racial makeup of the city is predominantly White, with a small percentage of African American, Native American, and Asian residents. The median household income in Pinehurst is $37,500, and the per capita income is $17,500.
Common Questions
What is the Total Population of Pinehurst?
Total Population of Pinehurst is 1,993.
What is the Total Male Population of Pinehurst?
Total Male Population of Pinehurst is 1,010.
What is the Total Female Population of Pinehurst?
Total Female Population of Pinehurst is 983.
What is the Ratio of Males per 100 Females in Pinehurst?
There are 102.75 Males per 100 Females in Pinehurst.
What is the Ratio of Females per 100 Males in Pinehurst?
There are 97.33 Females per 100 Males in Pinehurst.
What is the Median Population Age in Pinehurst?
Median Population Age in Pinehurst is 38.3 Years.
What is the Average Family Size in Pinehurst
Average Family Size in Pinehurst is 3.5 People.
What is the Average Household Size in Pinehurst
Average Household Size in Pinehurst is 2.8 People.
What is Per Capita Income in Pinehurst?
Per Capita income in Pinehurst is $28,339.
What is the Median Family Income in Pinehurst?
Median Family Income in Pinehurst is $71,161.
What is the Median Household income in Pinehurst?
Median Household Income in Pinehurst is $52,109.
What is Income or Wage Gap in Pinehurst?
Income or Wage Gap in Pinehurst is 39.6%.
Women in Pinehurst earn 60.4 cents for every dollar earned by a man.
What is Inequality or Gini Index in Pinehurst?
Inequality or Gini Index in Pinehurst is 0.42.
How Large is the Labor Force in Pinehurst?
There are 859 People in the Labor Forcein in Pinehurst.
What is the Percentage of People in the Labor Force in Pinehurst?
54.9% of People are in the Labor Force in Pinehurst.
What is the Unemployment Rate in Pinehurst?
Unemployment Rate in Pinehurst is 4.0%.