Carey, ID
Carey Map
Carey Overview
1,244
TOTAL POPULATION
700
MALE POPULATION
544
FEMALE POPULATION
128.68
MALES / 100 FEMALES
77.71
FEMALES / 100 MALES
30.0
MEDIAN AGE
4.8
AVG FAMILY SIZE
4.7
AVG HOUSEHOLD SIZE
$21,921
PER CAPITA INCOME
$45,469
AVG FAMILY INCOME
$50,000
AVG HOUSEHOLD INCOME
9.9%
WAGE / INCOME GAP [ % ]
90.1¢/ $1
WAGE / INCOME GAP [ $ ]
$5,556
FAMILY INCOME DEFICIT
0.35
INEQUALITY / GINI INDEX
541
LABOR FORCE [ PEOPLE ]
65.7%
PERCENT IN LABOR FORCE
4.6%
UNEMPLOYMENT RATE
Carey Zip Codes
Carey Area Codes
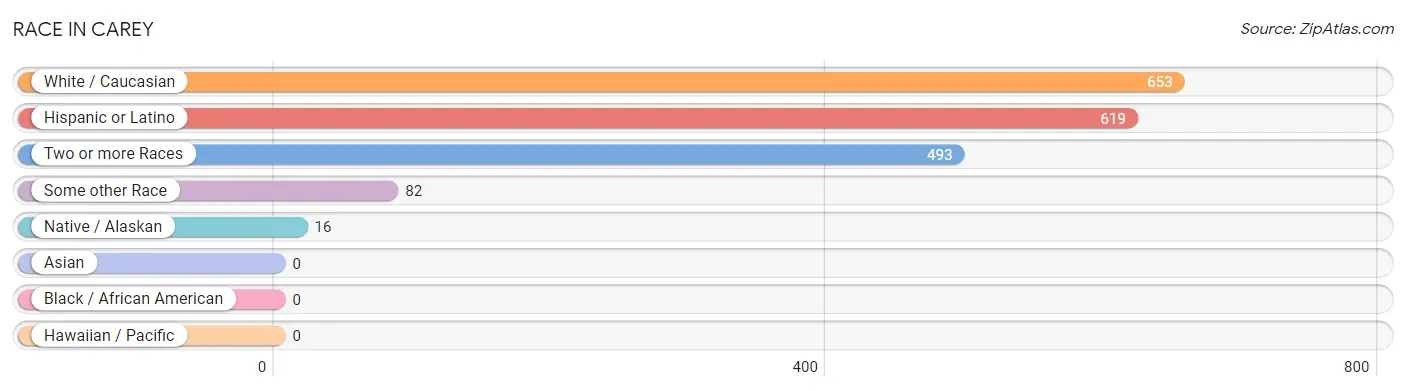
Race in Carey
The most populous races in Carey are White / Caucasian (653 | 52.5%), Hispanic or Latino (619 | 49.8%), and Two or more Races (493 | 39.6%).
| Race | # Population | % Population |
| Asian | 0 | 0.0% |
| Black / African American | 0 | 0.0% |
| Hawaiian / Pacific | 0 | 0.0% |
| Hispanic or Latino | 619 | 49.8% |
| Native / Alaskan | 16 | 1.3% |
| White / Caucasian | 653 | 52.5% |
| Two or more Races | 493 | 39.6% |
| Some other Race | 82 | 6.6% |
| Total | 1,244 | 100.0% |
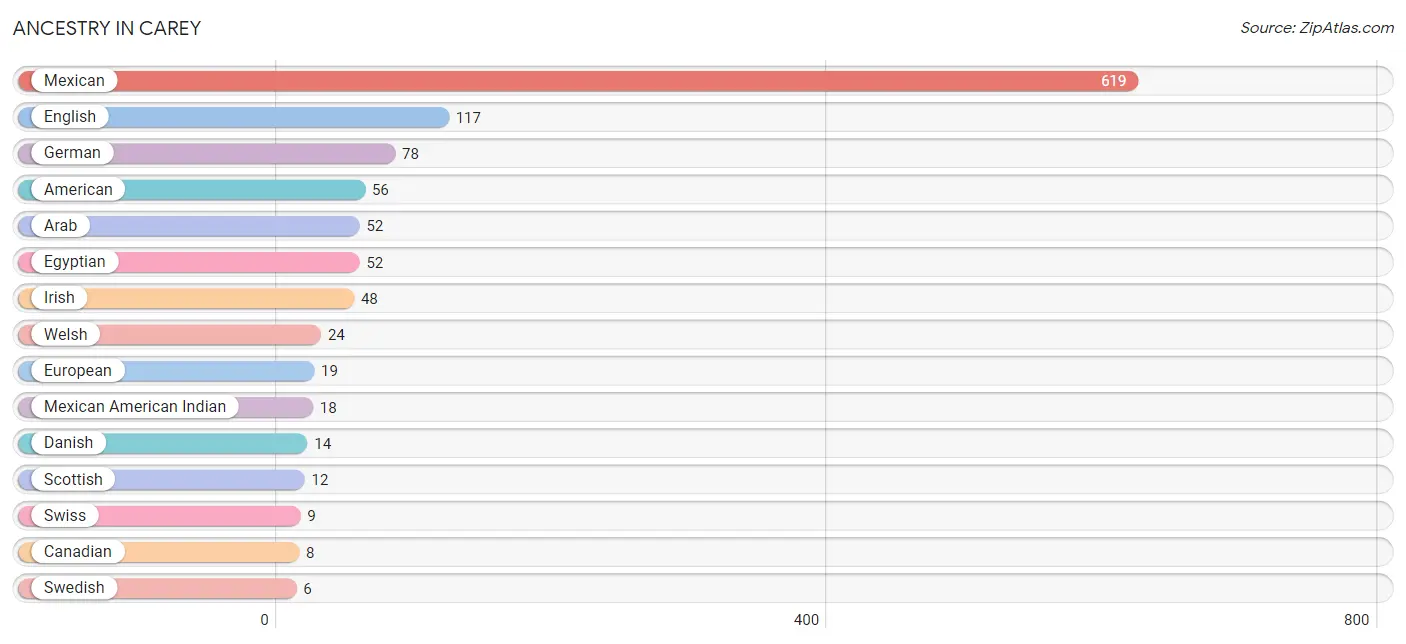
Ancestry in Carey
The most populous ancestries reported in Carey are Mexican (619 | 49.8%), English (117 | 9.4%), German (78 | 6.3%), American (56 | 4.5%), and Arab (52 | 4.2%), together accounting for 74.1% of all Carey residents.
| Ancestry | # Population | % Population |
| American | 56 | 4.5% |
| Arab | 52 | 4.2% |
| British | 1 | 0.1% |
| Canadian | 8 | 0.6% |
| Danish | 14 | 1.1% |
| Egyptian | 52 | 4.2% |
| English | 117 | 9.4% |
| European | 19 | 1.5% |
| French | 2 | 0.2% |
| French Canadian | 4 | 0.3% |
| German | 78 | 6.3% |
| Irish | 48 | 3.9% |
| Mexican | 619 | 49.8% |
| Mexican American Indian | 18 | 1.5% |
| Norwegian | 2 | 0.2% |
| Polish | 1 | 0.1% |
| Scotch-Irish | 1 | 0.1% |
| Scottish | 12 | 1.0% |
| Swedish | 6 | 0.5% |
| Swiss | 9 | 0.7% |
| Welsh | 24 | 1.9% | View All 21 Rows |
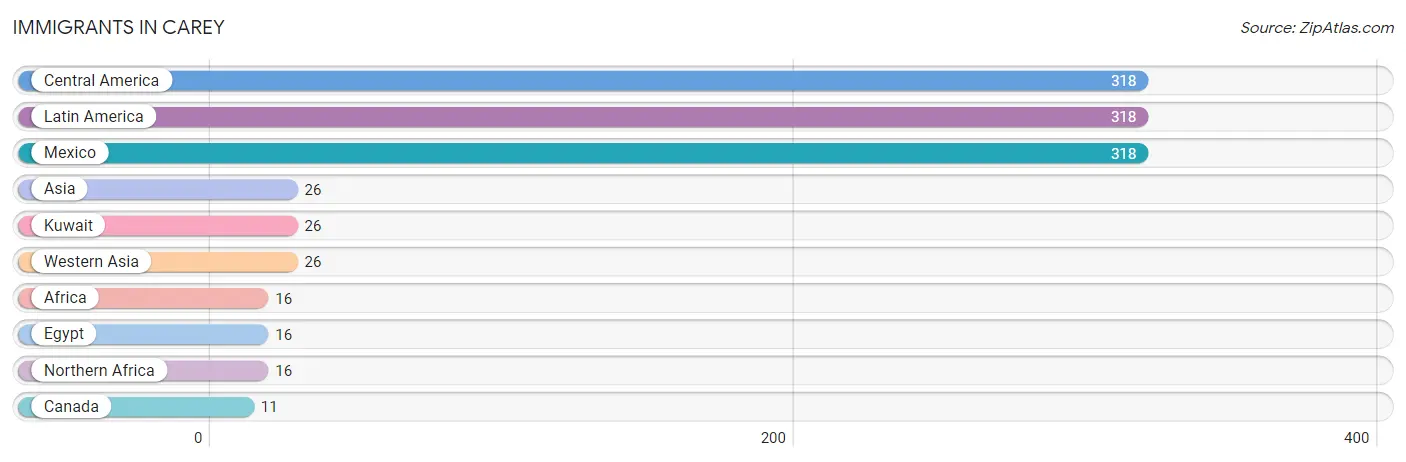
Immigrants in Carey
The most numerous immigrant groups reported in Carey came from Central America (318 | 25.6%), Latin America (318 | 25.6%), Mexico (318 | 25.6%), Asia (26 | 2.1%), and Kuwait (26 | 2.1%), together accounting for 80.9% of all Carey residents.
| Immigration Origin | # Population | % Population |
| Africa | 16 | 1.3% |
| Asia | 26 | 2.1% |
| Canada | 11 | 0.9% |
| Central America | 318 | 25.6% |
| Egypt | 16 | 1.3% |
| Kuwait | 26 | 2.1% |
| Latin America | 318 | 25.6% |
| Mexico | 318 | 25.6% |
| Northern Africa | 16 | 1.3% |
| Western Asia | 26 | 2.1% | View All 10 Rows |
Sex and Age in Carey
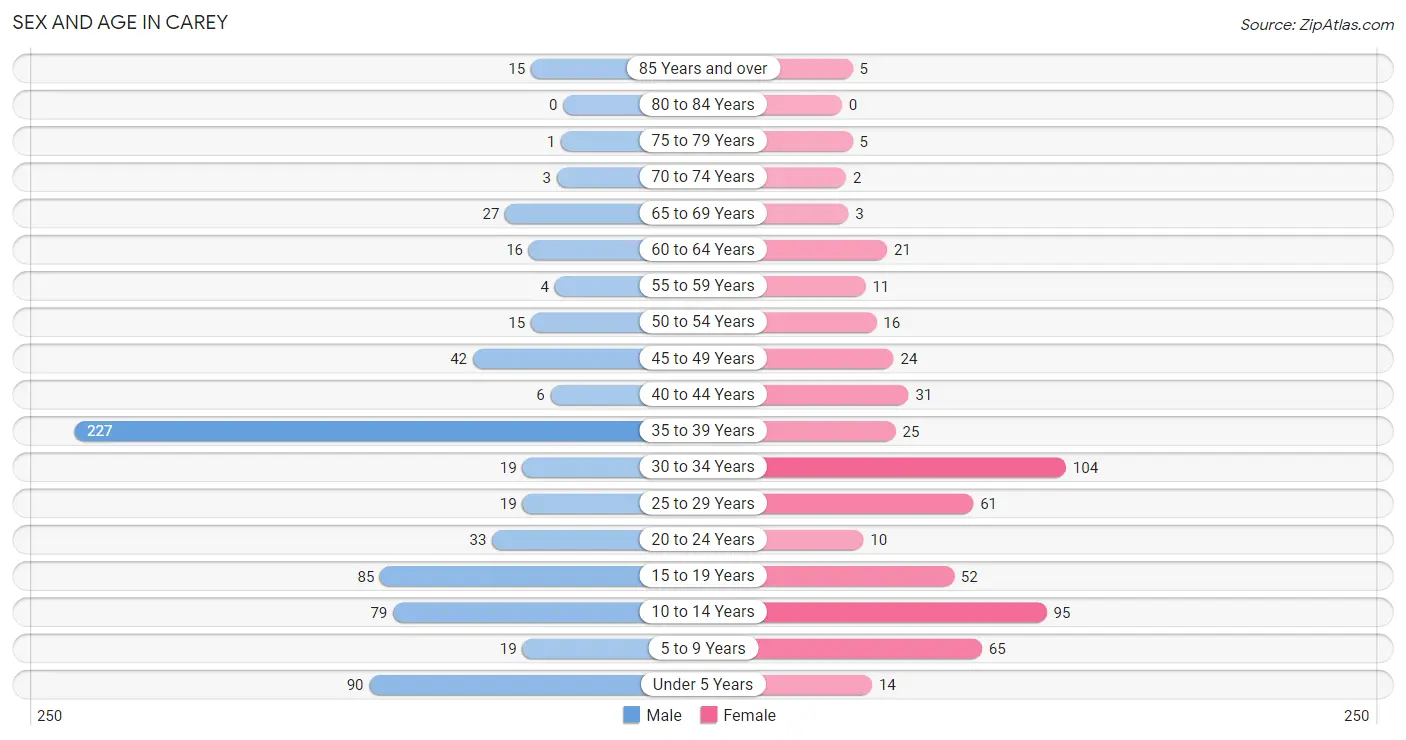
Sex and Age in Carey
The most populous age groups in Carey are 35 to 39 Years (227 | 32.4%) for men and 30 to 34 Years (104 | 19.1%) for women.
| Age Bracket | Male | Female |
| Under 5 Years | 90 (12.9%) | 14 (2.6%) |
| 5 to 9 Years | 19 (2.7%) | 65 (11.9%) |
| 10 to 14 Years | 79 (11.3%) | 95 (17.5%) |
| 15 to 19 Years | 85 (12.1%) | 52 (9.6%) |
| 20 to 24 Years | 33 (4.7%) | 10 (1.8%) |
| 25 to 29 Years | 19 (2.7%) | 61 (11.2%) |
| 30 to 34 Years | 19 (2.7%) | 104 (19.1%) |
| 35 to 39 Years | 227 (32.4%) | 25 (4.6%) |
| 40 to 44 Years | 6 (0.9%) | 31 (5.7%) |
| 45 to 49 Years | 42 (6.0%) | 24 (4.4%) |
| 50 to 54 Years | 15 (2.1%) | 16 (2.9%) |
| 55 to 59 Years | 4 (0.6%) | 11 (2.0%) |
| 60 to 64 Years | 16 (2.3%) | 21 (3.9%) |
| 65 to 69 Years | 27 (3.9%) | 3 (0.5%) |
| 70 to 74 Years | 3 (0.4%) | 2 (0.4%) |
| 75 to 79 Years | 1 (0.1%) | 5 (0.9%) |
| 80 to 84 Years | 0 (0.0%) | 0 (0.0%) |
| 85 Years and over | 15 (2.1%) | 5 (0.9%) |
| Total | 700 (100.0%) | 544 (100.0%) |
Families and Households in Carey
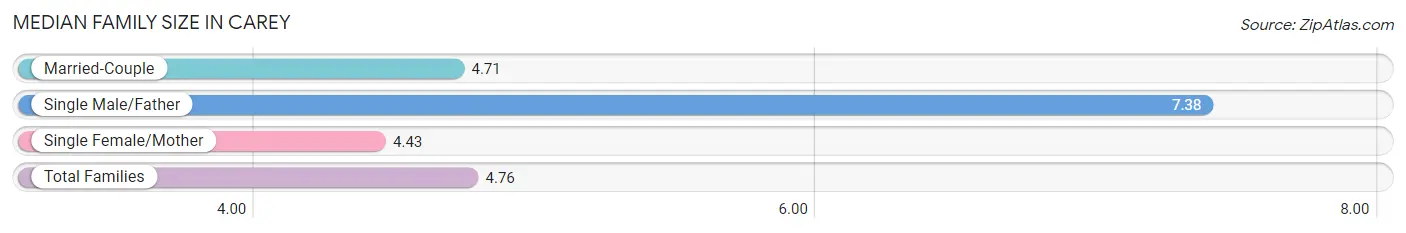
Median Family Size in Carey
The median family size in Carey is 4.76 persons per family, with single male/father families (8 | 3.5%) accounting for the largest median family size of 7.38 persons per family. On the other hand, single female/mother families (37 | 16.2%) represent the smallest median family size with 4.43 persons per family.
| Family Type | # Families | Family Size |
| Married-Couple | 184 (80.3%) | 4.71 |
| Single Male/Father | 8 (3.5%) | 7.38 |
| Single Female/Mother | 37 (16.2%) | 4.43 |
| Total Families | 229 (100.0%) | 4.76 |
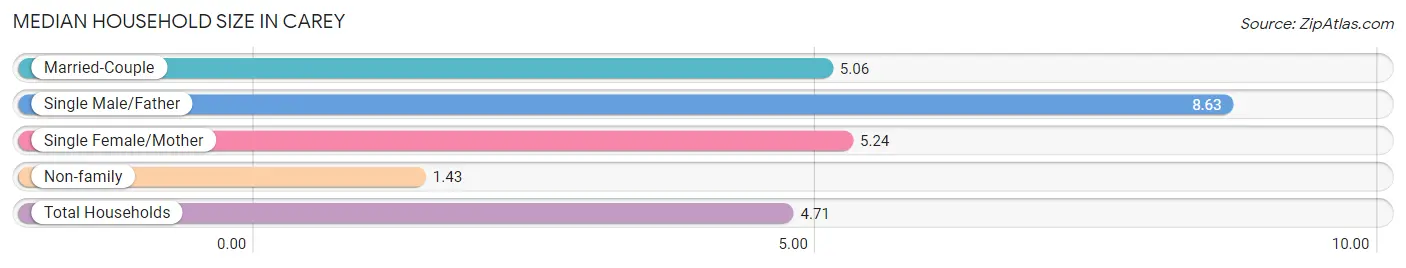
Median Household Size in Carey
The median household size in Carey is 4.71 persons per household, with single male/father households (8 | 3.0%) accounting for the largest median household size of 8.63 persons per household. non-family households (35 | 13.3%) represent the smallest median household size with 1.43 persons per household.
| Household Type | # Households | Household Size |
| Married-Couple | 184 (69.7%) | 5.06 |
| Single Male/Father | 8 (3.0%) | 8.63 |
| Single Female/Mother | 37 (14.0%) | 5.24 |
| Non-family | 35 (13.3%) | 1.43 |
| Total Households | 264 (100.0%) | 4.71 |
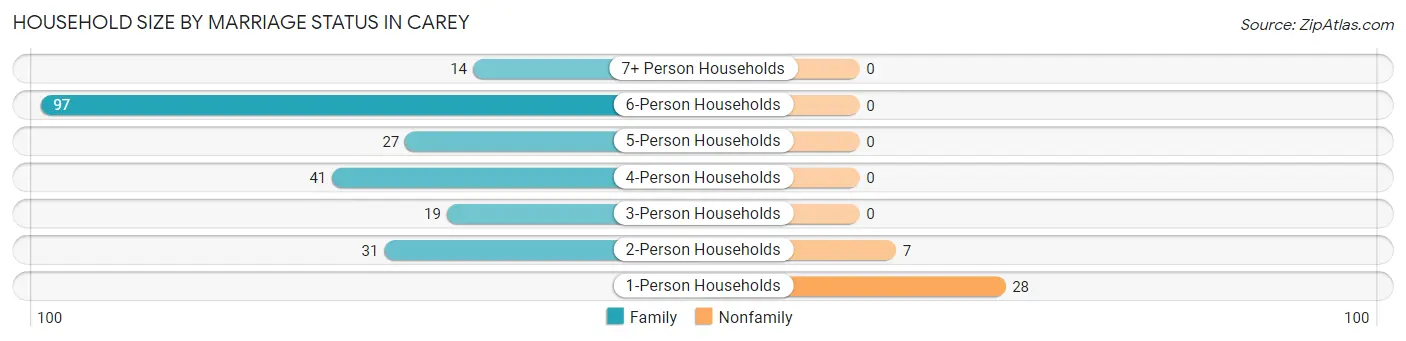
Household Size by Marriage Status in Carey
Out of a total of 264 households in Carey, 229 (86.7%) are family households, while 35 (13.3%) are nonfamily households. The most numerous type of family households are 6-person households, comprising 97, and the most common type of nonfamily households are 1-person households, comprising 28.
| Household Size | Family Households | Nonfamily Households |
| 1-Person Households | - | 28 (10.6%) |
| 2-Person Households | 31 (11.7%) | 7 (2.6%) |
| 3-Person Households | 19 (7.2%) | 0 (0.0%) |
| 4-Person Households | 41 (15.5%) | 0 (0.0%) |
| 5-Person Households | 27 (10.2%) | 0 (0.0%) |
| 6-Person Households | 97 (36.7%) | 0 (0.0%) |
| 7+ Person Households | 14 (5.3%) | 0 (0.0%) |
| Total | 229 (86.7%) | 35 (13.3%) |
Female Fertility in Carey
Fertility by Age in Carey
Average fertility rate in Carey is 107.0 births per 1,000 women. Women in the age bracket of 20 to 34 years have the highest fertility rate with 189.0 births per 1,000 women. Women in the age bracket of 20 to 34 years acount for 97.1% of all women with births.
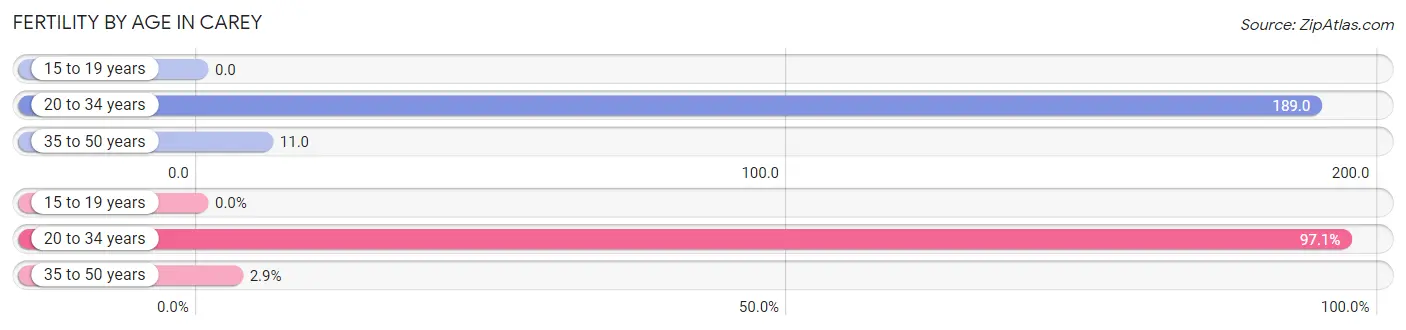
| Age Bracket | Women with Births | Births / 1,000 Women |
| 15 to 19 years | 0 (0.0%) | 0.0 |
| 20 to 34 years | 33 (97.1%) | 189.0 |
| 35 to 50 years | 1 (2.9%) | 11.0 |
| Total | 34 (100.0%) | 107.0 |
Fertility by Age by Marriage Status in Carey
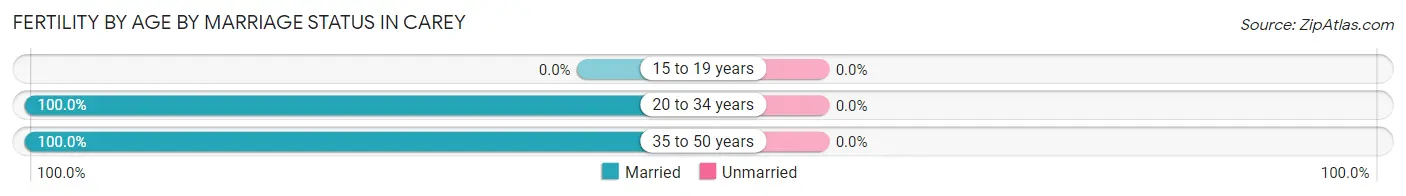
| Age Bracket | Married | Unmarried |
| 15 to 19 years | 0 (0.0%) | 0 (0.0%) |
| 20 to 34 years | 33 (100.0%) | 0 (0.0%) |
| 35 to 50 years | 1 (100.0%) | 0 (0.0%) |
| Total | 34 (100.0%) | 0 (0.0%) |
Fertility by Education in Carey
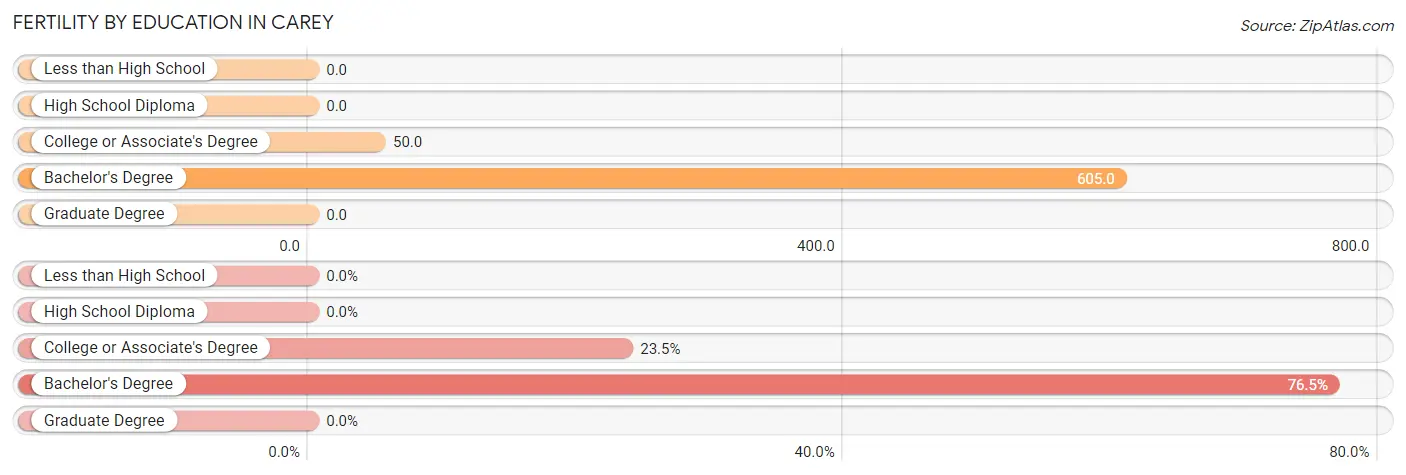
| Educational Attainment | Women with Births | Births / 1,000 Women |
| Less than High School | 0 (0.0%) | 0.0 |
| High School Diploma | 0 (0.0%) | 0.0 |
| College or Associate's Degree | 8 (23.5%) | 50.0 |
| Bachelor's Degree | 26 (76.5%) | 605.0 |
| Graduate Degree | 0 (0.0%) | 0.0 |
| Total | 34 (100.0%) | 107.0 |
Fertility by Education by Marriage Status in Carey
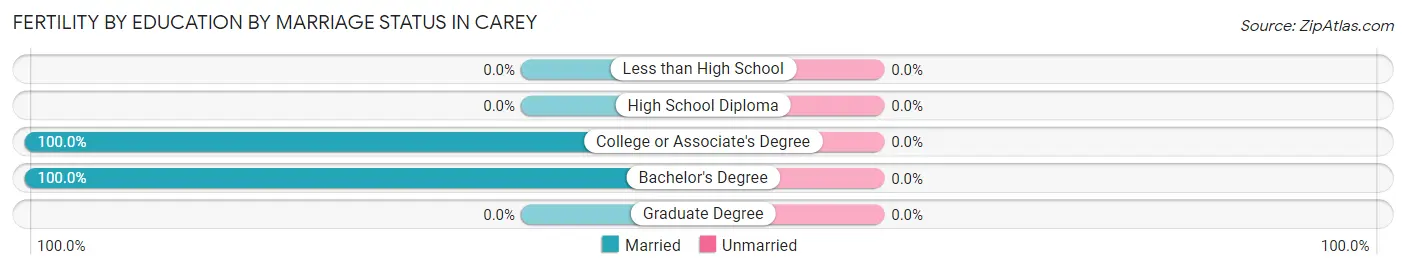
| Educational Attainment | Married | Unmarried |
| Less than High School | 0 (0.0%) | 0 (0.0%) |
| High School Diploma | 0 (0.0%) | 0 (0.0%) |
| College or Associate's Degree | 8 (100.0%) | 0 (0.0%) |
| Bachelor's Degree | 26 (100.0%) | 0 (0.0%) |
| Graduate Degree | 0 (0.0%) | 0 (0.0%) |
| Total | 34 (100.0%) | 0 (0.0%) |
Income in Carey
Income Overview in Carey
Per Capita Income in Carey is $21,921, while median incomes of families and households are $45,469 and $50,000 respectively.
| Characteristic | Number | Measure |
| Per Capita Income | 1,244 | $21,921 |
| Median Family Income | 229 | $45,469 |
| Mean Family Income | 229 | $73,459 |
| Median Household Income | 264 | $50,000 |
| Mean Household Income | 264 | $75,429 |
| Income Deficit | 229 | $5,556 |
| Wage / Income Gap (%) | 1,244 | 9.86% |
| Wage / Income Gap ($) | 1,244 | 90.14¢ per $1 |
| Gini / Inequality Index | 1,244 | 0.35 |
Earnings by Sex in Carey
Average Earnings in Carey are $39,087, $39,291 for men and $35,417 for women, a difference of 9.9%.
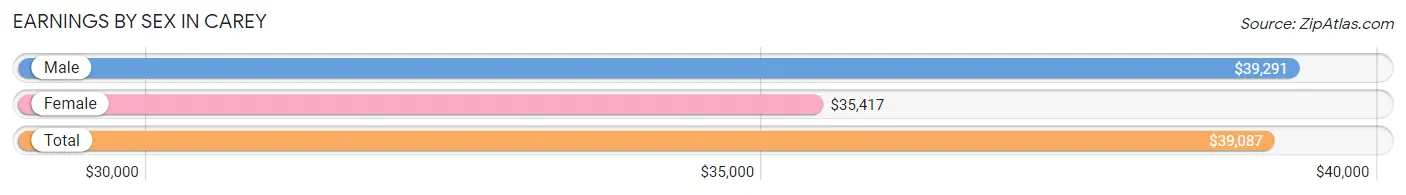
| Sex | Number | Average Earnings |
| Male | 409 (73.2%) | $39,291 |
| Female | 150 (26.8%) | $35,417 |
| Total | 559 (100.0%) | $39,087 |
Earnings by Sex by Income Bracket in Carey
The most common earnings brackets in Carey are $35,000 to $39,999 for men (191 | 46.7%) and $35,000 to $39,999 for women (20 | 13.3%).
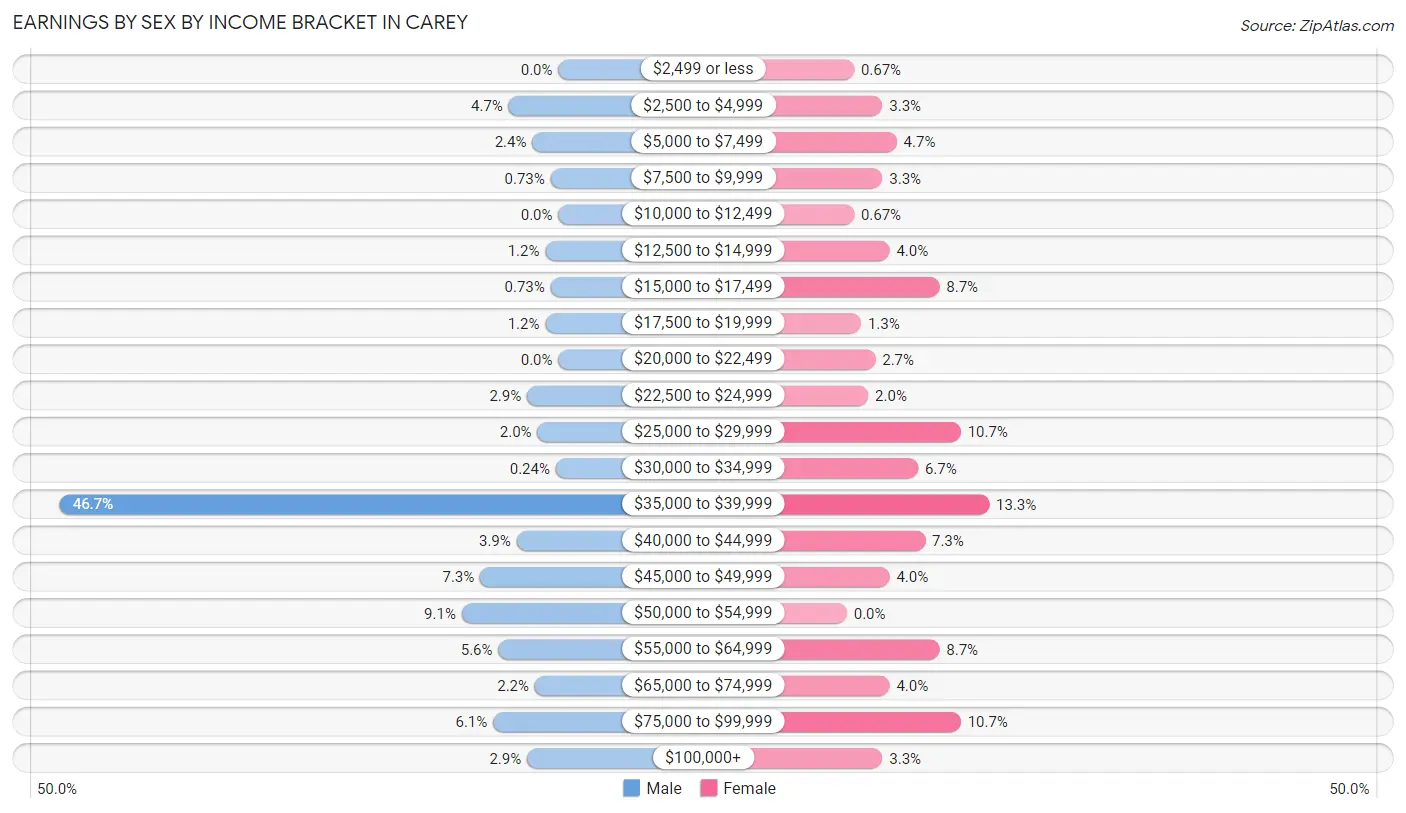
| Income | Male | Female |
| $2,499 or less | 0 (0.0%) | 1 (0.7%) |
| $2,500 to $4,999 | 19 (4.6%) | 5 (3.3%) |
| $5,000 to $7,499 | 10 (2.4%) | 7 (4.7%) |
| $7,500 to $9,999 | 3 (0.7%) | 5 (3.3%) |
| $10,000 to $12,499 | 0 (0.0%) | 1 (0.7%) |
| $12,500 to $14,999 | 5 (1.2%) | 6 (4.0%) |
| $15,000 to $17,499 | 3 (0.7%) | 13 (8.7%) |
| $17,500 to $19,999 | 5 (1.2%) | 2 (1.3%) |
| $20,000 to $22,499 | 0 (0.0%) | 4 (2.7%) |
| $22,500 to $24,999 | 12 (2.9%) | 3 (2.0%) |
| $25,000 to $29,999 | 8 (2.0%) | 16 (10.7%) |
| $30,000 to $34,999 | 1 (0.2%) | 10 (6.7%) |
| $35,000 to $39,999 | 191 (46.7%) | 20 (13.3%) |
| $40,000 to $44,999 | 16 (3.9%) | 11 (7.3%) |
| $45,000 to $49,999 | 30 (7.3%) | 6 (4.0%) |
| $50,000 to $54,999 | 37 (9.0%) | 0 (0.0%) |
| $55,000 to $64,999 | 23 (5.6%) | 13 (8.7%) |
| $65,000 to $74,999 | 9 (2.2%) | 6 (4.0%) |
| $75,000 to $99,999 | 25 (6.1%) | 16 (10.7%) |
| $100,000+ | 12 (2.9%) | 5 (3.3%) |
| Total | 409 (100.0%) | 150 (100.0%) |
Earnings by Sex by Educational Attainment in Carey
Average earnings in Carey are $39,520 for men and $37,188 for women, a difference of 5.9%. Men with an educational attainment of less than high school enjoy the highest average annual earnings of $55,250, while those with high school diploma education earn the least with $38,939. Women with an educational attainment of bachelor's degree earn the most with the average annual earnings of $63,125, while those with high school diploma education have the smallest earnings of $27,083.
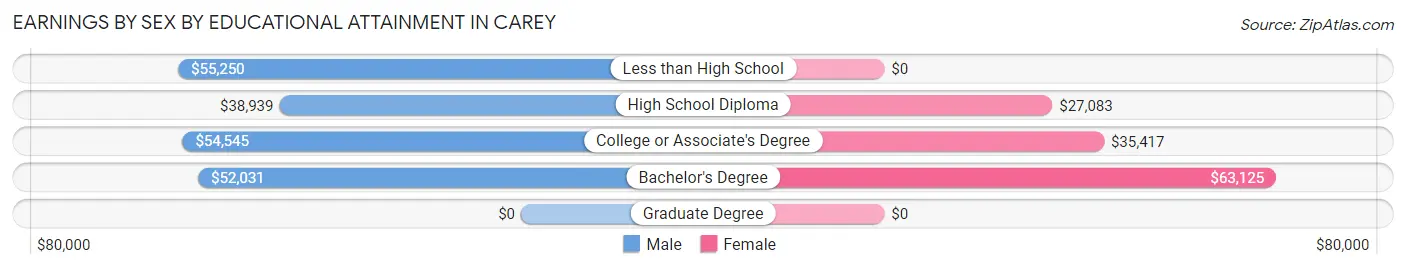
| Educational Attainment | Male Income | Female Income |
| Less than High School | $55,250 | $0 |
| High School Diploma | $38,939 | $27,083 |
| College or Associate's Degree | $54,545 | $35,417 |
| Bachelor's Degree | $52,031 | $63,125 |
| Graduate Degree | - | - |
| Total | $39,520 | $37,188 |
Family Income in Carey
Family Income Brackets in Carey
According to the Carey family income data, there are 114 families falling into the $35,000 to $49,999 income range, which is the most common income bracket and makes up 49.8% of all families.
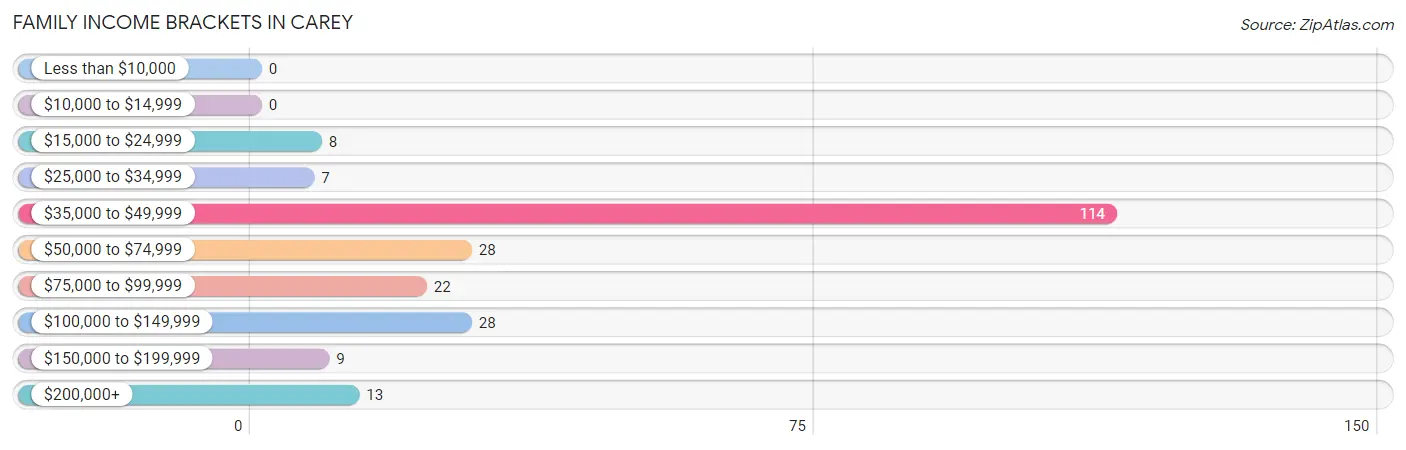
| Income Bracket | # Families | % Families |
| Less than $10,000 | 0 | 0.0% |
| $10,000 to $14,999 | 0 | 0.0% |
| $15,000 to $24,999 | 8 | 3.5% |
| $25,000 to $34,999 | 7 | 3.1% |
| $35,000 to $49,999 | 114 | 49.8% |
| $50,000 to $74,999 | 28 | 12.2% |
| $75,000 to $99,999 | 22 | 9.6% |
| $100,000 to $149,999 | 28 | 12.2% |
| $150,000 to $199,999 | 9 | 3.9% |
| $200,000+ | 13 | 5.7% |
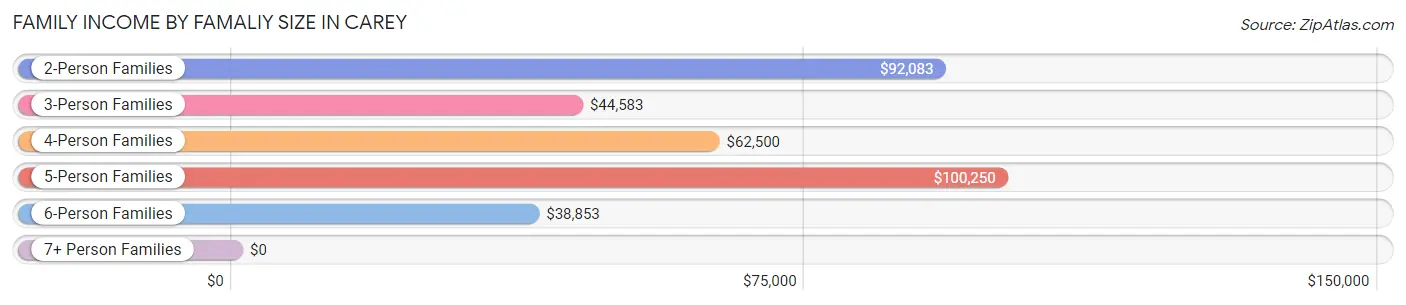
Family Income by Famaliy Size in Carey
5-person families (25 | 10.9%) account for the highest median family income in Carey with $100,250 per family, while 2-person families (40 | 17.5%) have the highest median income of $46,042 per family member.
| Income Bracket | # Families | Median Income |
| 2-Person Families | 40 (17.5%) | $92,083 |
| 3-Person Families | 27 (11.8%) | $44,583 |
| 4-Person Families | 36 (15.7%) | $62,500 |
| 5-Person Families | 25 (10.9%) | $100,250 |
| 6-Person Families | 92 (40.2%) | $38,853 |
| 7+ Person Families | 9 (3.9%) | $0 |
| Total | 229 (100.0%) | $45,469 |
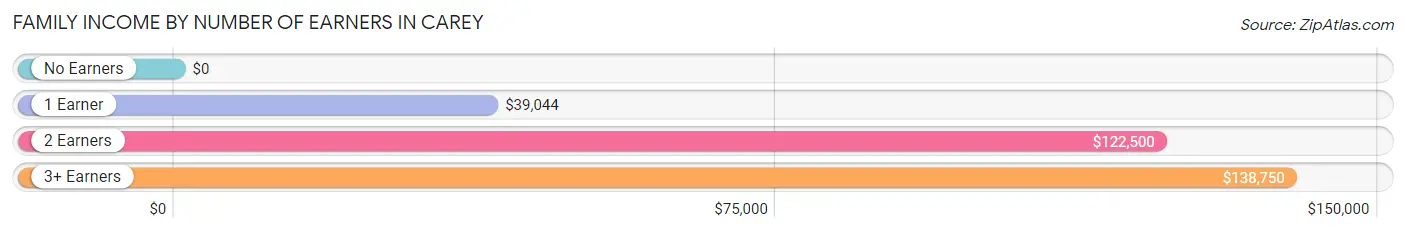
Family Income by Number of Earners in Carey
| Number of Earners | # Families | Median Income |
| No Earners | 9 (3.9%) | $0 |
| 1 Earner | 135 (59.0%) | $39,044 |
| 2 Earners | 70 (30.6%) | $122,500 |
| 3+ Earners | 15 (6.6%) | $138,750 |
| Total | 229 (100.0%) | $45,469 |
Household Income in Carey
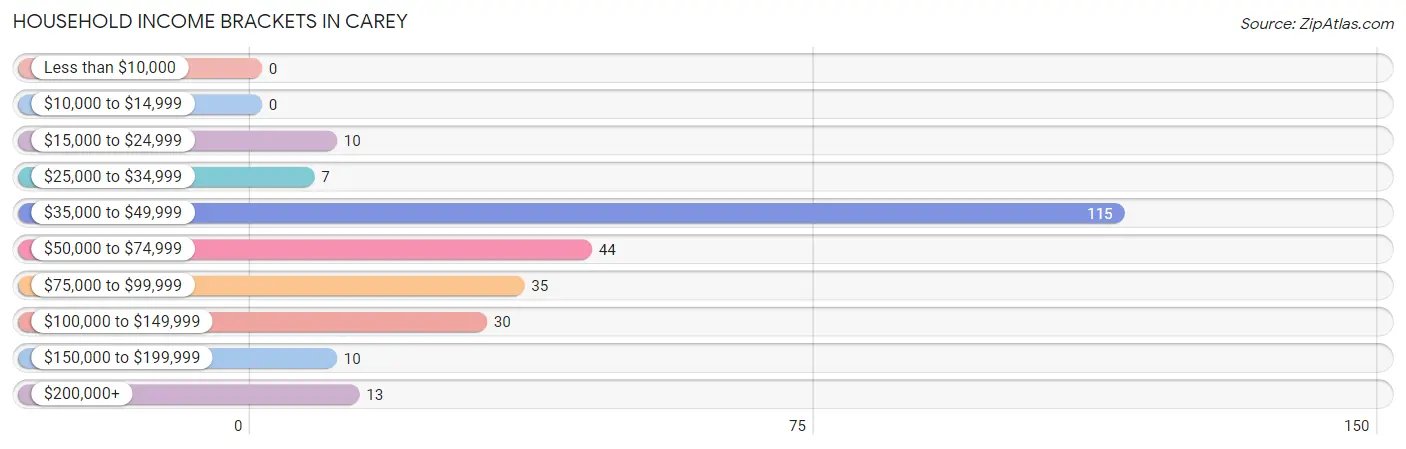
Household Income Brackets in Carey
With 115 households falling in the category, the $35,000 to $49,999 income range is the most frequent in Carey, accounting for 43.6% of all households.
| Income Bracket | # Households | % Households |
| Less than $10,000 | 0 | 0.0% |
| $10,000 to $14,999 | 0 | 0.0% |
| $15,000 to $24,999 | 10 | 3.8% |
| $25,000 to $34,999 | 7 | 2.7% |
| $35,000 to $49,999 | 115 | 43.6% |
| $50,000 to $74,999 | 44 | 16.7% |
| $75,000 to $99,999 | 35 | 13.3% |
| $100,000 to $149,999 | 30 | 11.4% |
| $150,000 to $199,999 | 10 | 3.8% |
| $200,000+ | 13 | 4.9% |
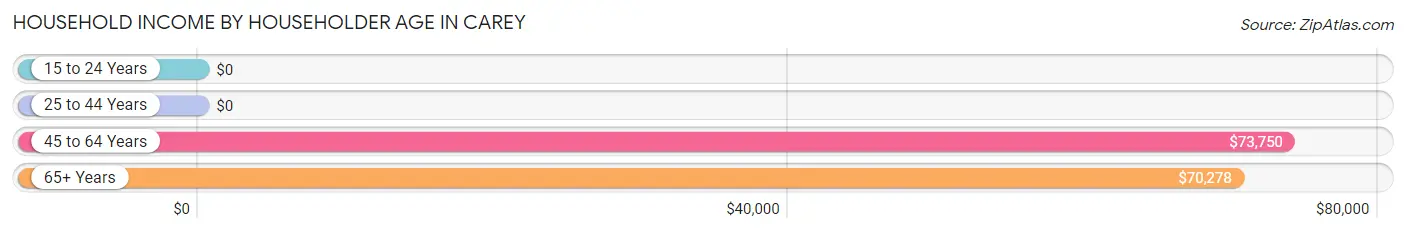
Household Income by Householder Age in Carey
The median household income in Carey is $50,000, with the highest median household income of $73,750 found in the 45 to 64 years age bracket for the primary householder. A total of 73 households (27.7%) fall into this category. Meanwhile, the 15 to 24 years age bracket for the primary householder has the lowest median household income of $0, with 2 households (0.8%) in this group.
| Income Bracket | # Households | Median Income |
| 15 to 24 Years | 2 (0.8%) | $0 |
| 25 to 44 Years | 161 (61.0%) | $0 |
| 45 to 64 Years | 73 (27.7%) | $73,750 |
| 65+ Years | 28 (10.6%) | $70,278 |
| Total | 264 (100.0%) | $50,000 |
Poverty in Carey
Income Below Poverty by Sex and Age in Carey
With 5.9% poverty level for males and 10.0% for females among the residents of Carey, 12 to 14 year old males and 55 to 64 year old females are the most vulnerable to poverty, with 13 males (43.3%) and 13 females (40.6%) in their respective age groups living below the poverty level.
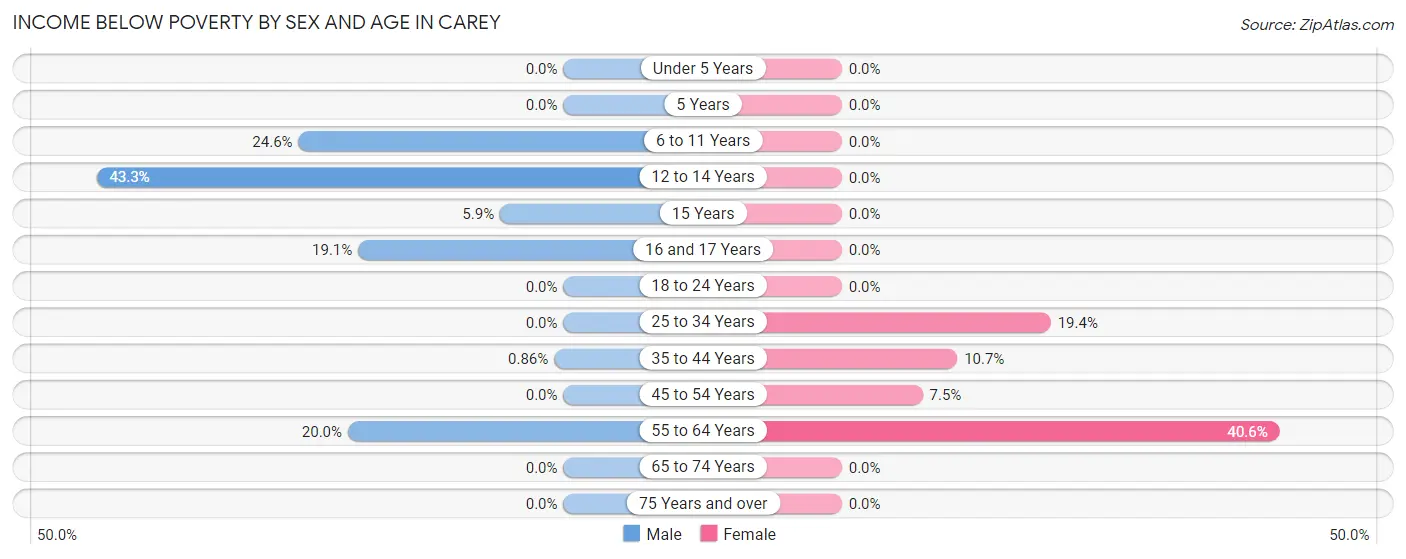
| Age Bracket | Male | Female |
| Under 5 Years | 0 (0.0%) | 0 (0.0%) |
| 5 Years | 0 (0.0%) | 0 (0.0%) |
| 6 to 11 Years | 15 (24.6%) | 0 (0.0%) |
| 12 to 14 Years | 13 (43.3%) | 0 (0.0%) |
| 15 Years | 3 (5.9%) | 0 (0.0%) |
| 16 and 17 Years | 4 (19.1%) | 0 (0.0%) |
| 18 to 24 Years | 0 (0.0%) | 0 (0.0%) |
| 25 to 34 Years | 0 (0.0%) | 32 (19.4%) |
| 35 to 44 Years | 2 (0.9%) | 6 (10.7%) |
| 45 to 54 Years | 0 (0.0%) | 3 (7.5%) |
| 55 to 64 Years | 4 (20.0%) | 13 (40.6%) |
| 65 to 74 Years | 0 (0.0%) | 0 (0.0%) |
| 75 Years and over | 0 (0.0%) | 0 (0.0%) |
| Total | 41 (5.9%) | 54 (10.0%) |
Income Above Poverty by Sex and Age in Carey
According to the poverty statistics in Carey, males aged under 5 years and females aged under 5 years are the age groups that are most secure financially, with 100.0% of males and 100.0% of females in these age groups living above the poverty line.
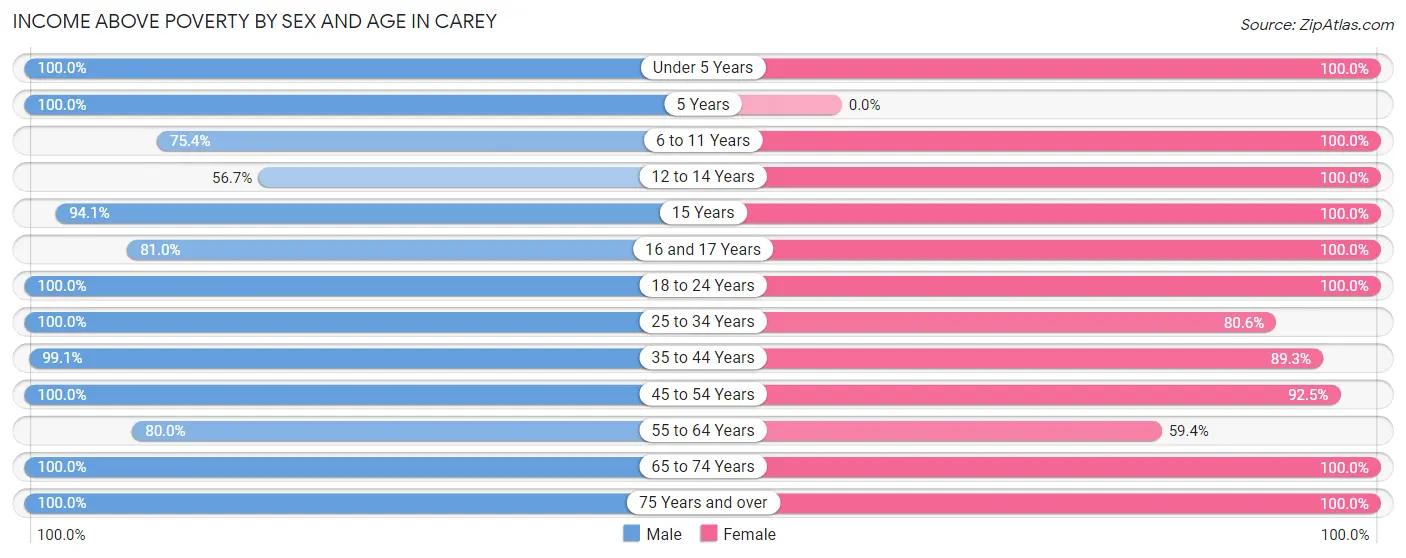
| Age Bracket | Male | Female |
| Under 5 Years | 85 (100.0%) | 9 (100.0%) |
| 5 Years | 2 (100.0%) | 0 (0.0%) |
| 6 to 11 Years | 46 (75.4%) | 73 (100.0%) |
| 12 to 14 Years | 17 (56.7%) | 87 (100.0%) |
| 15 Years | 48 (94.1%) | 8 (100.0%) |
| 16 and 17 Years | 17 (80.9%) | 15 (100.0%) |
| 18 to 24 Years | 46 (100.0%) | 39 (100.0%) |
| 25 to 34 Years | 38 (100.0%) | 133 (80.6%) |
| 35 to 44 Years | 231 (99.1%) | 50 (89.3%) |
| 45 to 54 Years | 57 (100.0%) | 37 (92.5%) |
| 55 to 64 Years | 16 (80.0%) | 19 (59.4%) |
| 65 to 74 Years | 30 (100.0%) | 5 (100.0%) |
| 75 Years and over | 16 (100.0%) | 10 (100.0%) |
| Total | 649 (94.1%) | 485 (90.0%) |
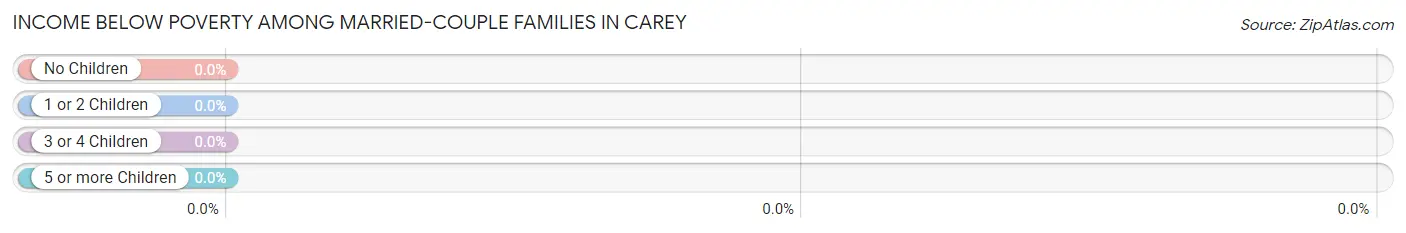
Income Below Poverty Among Married-Couple Families in Carey
| Children | Above Poverty | Below Poverty |
| No Children | 33 (100.0%) | 0 (0.0%) |
| 1 or 2 Children | 45 (100.0%) | 0 (0.0%) |
| 3 or 4 Children | 100 (100.0%) | 0 (0.0%) |
| 5 or more Children | 6 (100.0%) | 0 (0.0%) |
| Total | 184 (100.0%) | 0 (0.0%) |
Income Below Poverty Among Single-Parent Households in Carey
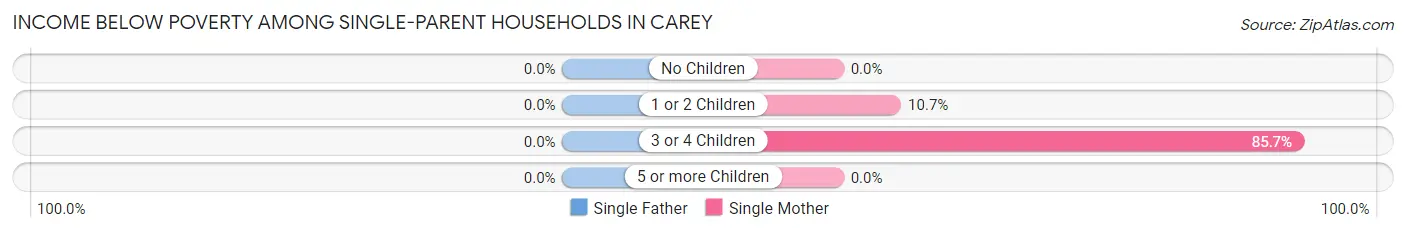
| Children | Single Father | Single Mother |
| No Children | 0 (0.0%) | 0 (0.0%) |
| 1 or 2 Children | 0 (0.0%) | 3 (10.7%) |
| 3 or 4 Children | 0 (0.0%) | 6 (85.7%) |
| 5 or more Children | 0 (0.0%) | 0 (0.0%) |
| Total | 0 (0.0%) | 9 (24.3%) |
Income Below Poverty Among Married-Couple vs Single-Parent Households in Carey
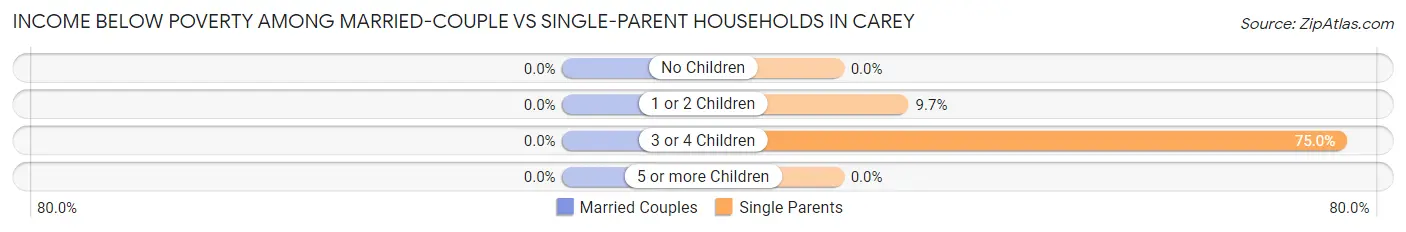
| Children | Married-Couple Families | Single-Parent Households |
| No Children | 0 (0.0%) | 0 (0.0%) |
| 1 or 2 Children | 0 (0.0%) | 3 (9.7%) |
| 3 or 4 Children | 0 (0.0%) | 6 (75.0%) |
| 5 or more Children | 0 (0.0%) | 0 (0.0%) |
| Total | 0 (0.0%) | 9 (20.0%) |
Employment Characteristics in Carey
Employment by Class of Employer in Carey
Among the 514 employed individuals in Carey, private company employees (365 | 71.0%), self-employed (incorporated) (57 | 11.1%), and local government employees (54 | 10.5%) make up the most common classes of employment.
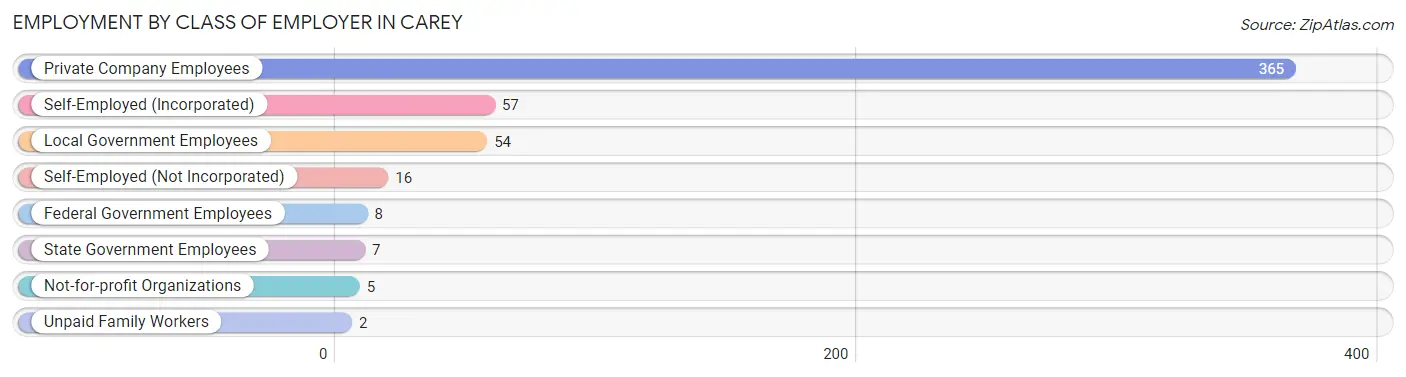
| Employer Class | # Employees | % Employees |
| Private Company Employees | 365 | 71.0% |
| Self-Employed (Incorporated) | 57 | 11.1% |
| Self-Employed (Not Incorporated) | 16 | 3.1% |
| Not-for-profit Organizations | 5 | 1.0% |
| Local Government Employees | 54 | 10.5% |
| State Government Employees | 7 | 1.4% |
| Federal Government Employees | 8 | 1.6% |
| Unpaid Family Workers | 2 | 0.4% |
| Total | 514 | 100.0% |
Employment Status by Age in Carey
According to the labor force statistics for Carey, out of the total population over 16 years of age (823), 65.7% or 541 individuals are in the labor force, with 4.6% or 25 of them unemployed. The age group with the highest labor force participation rate is 35 to 44 years, with 95.8% or 277 individuals in the labor force. Within the labor force, the 25 to 29 years age range has the highest percentage of unemployed individuals, with 39.0% or 16 of them being unemployed.
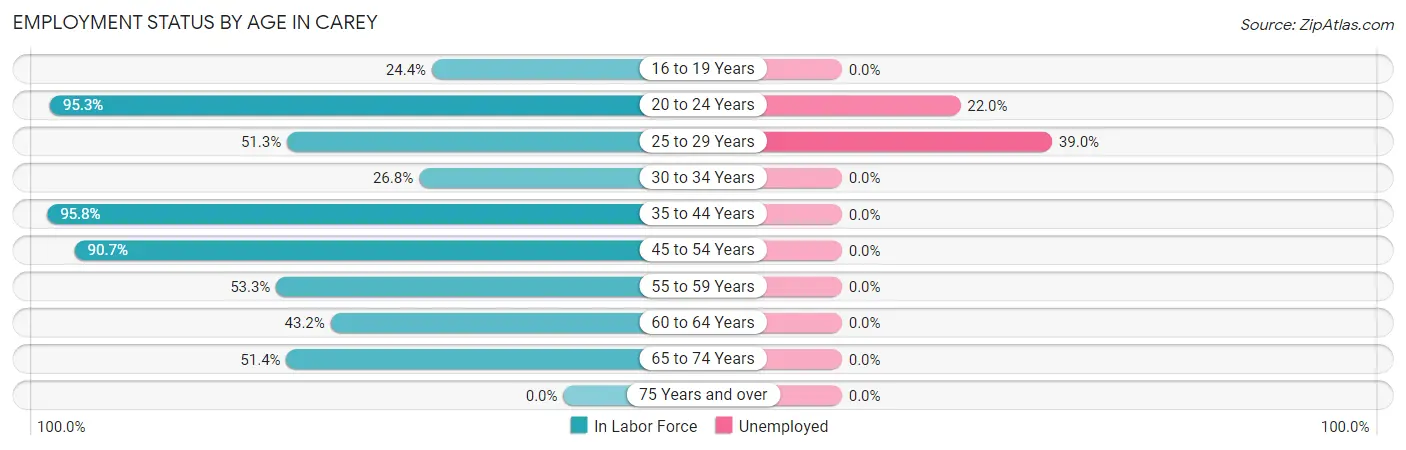
| Age Bracket | In Labor Force | Unemployed |
| 16 to 19 Years | 19 (24.4%) | 0 (0.0%) |
| 20 to 24 Years | 41 (95.3%) | 9 (22.0%) |
| 25 to 29 Years | 41 (51.3%) | 16 (39.0%) |
| 30 to 34 Years | 33 (26.8%) | 0 (0.0%) |
| 35 to 44 Years | 277 (95.8%) | 0 (0.0%) |
| 45 to 54 Years | 88 (90.7%) | 0 (0.0%) |
| 55 to 59 Years | 8 (53.3%) | 0 (0.0%) |
| 60 to 64 Years | 16 (43.2%) | 0 (0.0%) |
| 65 to 74 Years | 18 (51.4%) | 0 (0.0%) |
| 75 Years and over | 0 (0.0%) | 0 (0.0%) |
| Total | 541 (65.7%) | 25 (4.6%) |
Employment Status by Educational Attainment in Carey
According to labor force statistics for Carey, 72.2% of individuals (463) out of the total population between 25 and 64 years of age (641) are in the labor force, with 3.5% or 16 of them being unemployed. The group with the highest labor force participation rate are those with the educational attainment of high school diploma, with 91.6% or 262 individuals in the labor force. Within the labor force, individuals with bachelor's degree or higher education have the highest percentage of unemployment, with 24.6% or 16 of them being unemployed.
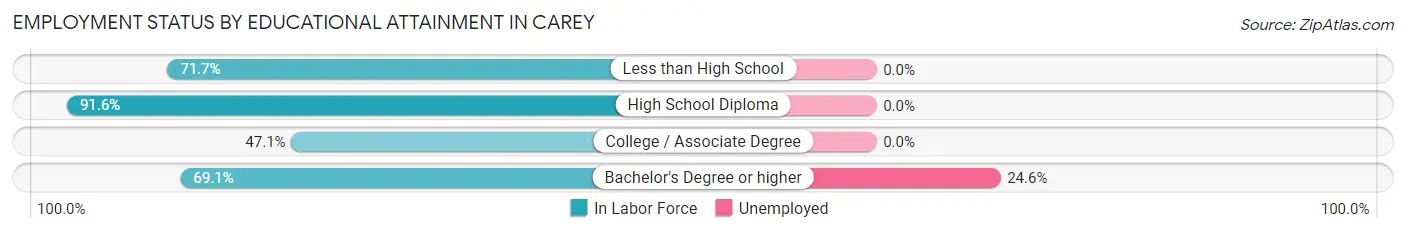
| Educational Attainment | In Labor Force | Unemployed |
| Less than High School | 38 (71.7%) | 0 (0.0%) |
| High School Diploma | 262 (91.6%) | 0 (0.0%) |
| College / Associate Degree | 98 (47.1%) | 0 (0.0%) |
| Bachelor's Degree or higher | 65 (69.1%) | 23 (24.6%) |
| Total | 463 (72.2%) | 22 (3.5%) |
Employment Occupations by Sex in Carey
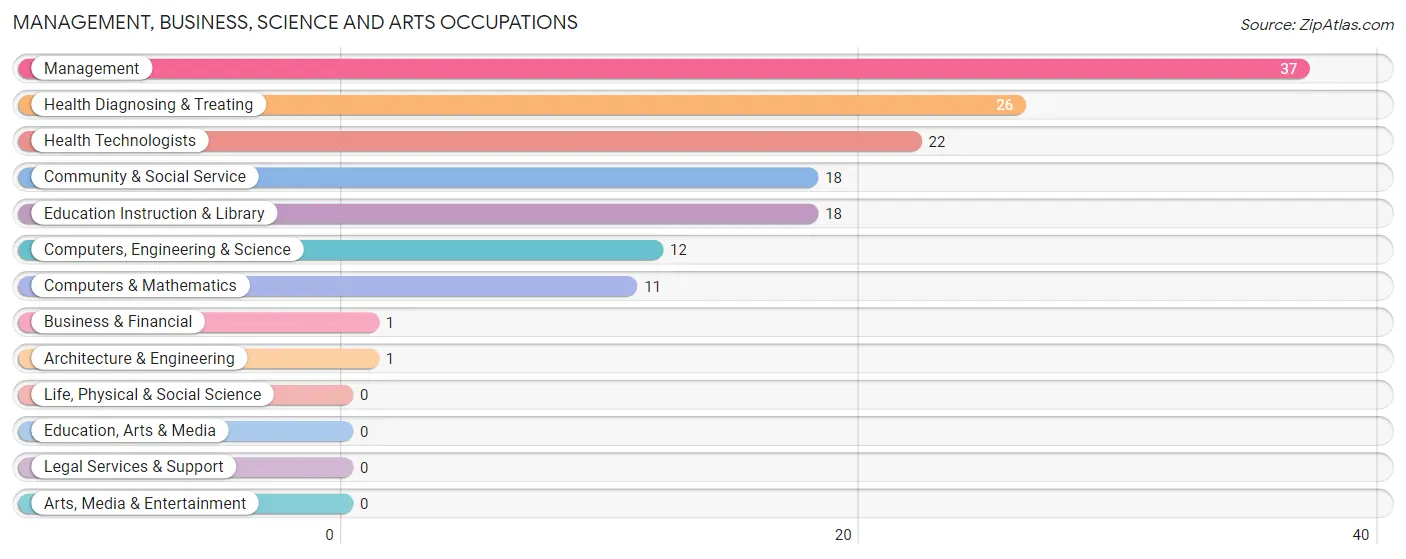
Management, Business, Science and Arts Occupations
The most common Management, Business, Science and Arts occupations in Carey are Management (37 | 7.2%), Health Diagnosing & Treating (26 | 5.0%), Health Technologists (22 | 4.3%), Community & Social Service (18 | 3.5%), and Education Instruction & Library (18 | 3.5%).
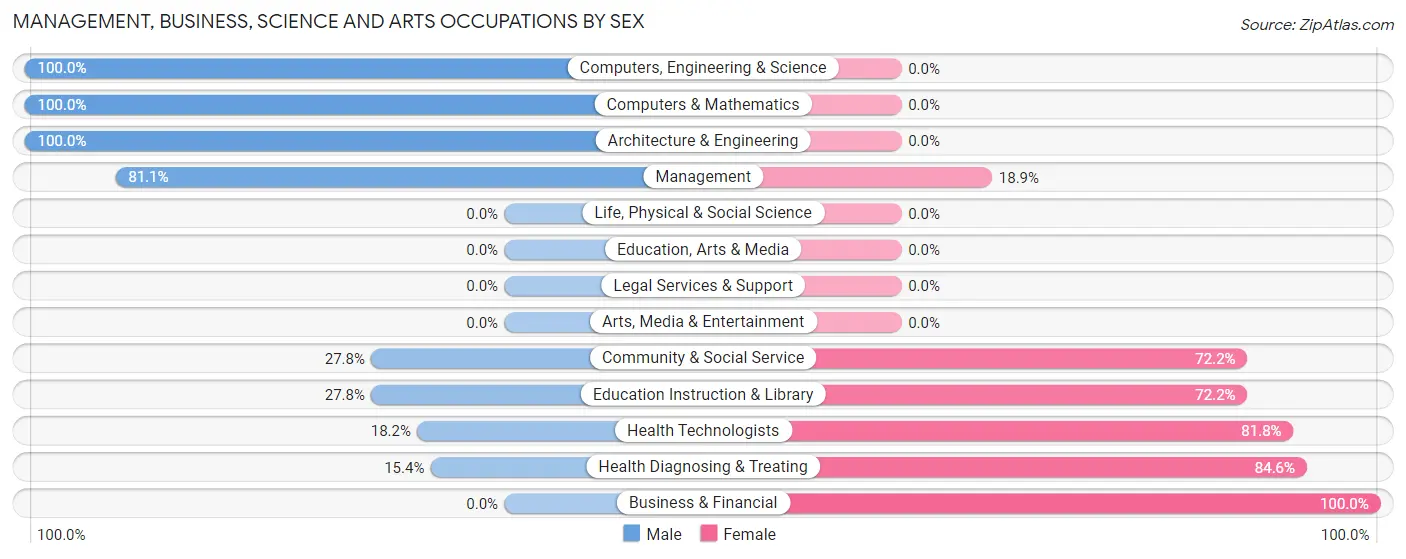
Management, Business, Science and Arts Occupations by Sex
Within the Management, Business, Science and Arts occupations in Carey, the most male-oriented occupations are Computers, Engineering & Science (100.0%), Computers & Mathematics (100.0%), and Architecture & Engineering (100.0%), while the most female-oriented occupations are Business & Financial (100.0%), Health Diagnosing & Treating (84.6%), and Health Technologists (81.8%).
| Occupation | Male | Female |
| Management | 30 (81.1%) | 7 (18.9%) |
| Business & Financial | 0 (0.0%) | 1 (100.0%) |
| Computers, Engineering & Science | 12 (100.0%) | 0 (0.0%) |
| Computers & Mathematics | 11 (100.0%) | 0 (0.0%) |
| Architecture & Engineering | 1 (100.0%) | 0 (0.0%) |
| Life, Physical & Social Science | 0 (0.0%) | 0 (0.0%) |
| Community & Social Service | 5 (27.8%) | 13 (72.2%) |
| Education, Arts & Media | 0 (0.0%) | 0 (0.0%) |
| Legal Services & Support | 0 (0.0%) | 0 (0.0%) |
| Education Instruction & Library | 5 (27.8%) | 13 (72.2%) |
| Arts, Media & Entertainment | 0 (0.0%) | 0 (0.0%) |
| Health Diagnosing & Treating | 4 (15.4%) | 22 (84.6%) |
| Health Technologists | 4 (18.2%) | 18 (81.8%) |
| Total (Category) | 51 (54.3%) | 43 (45.7%) |
| Total (Overall) | 376 (72.9%) | 140 (27.1%) |
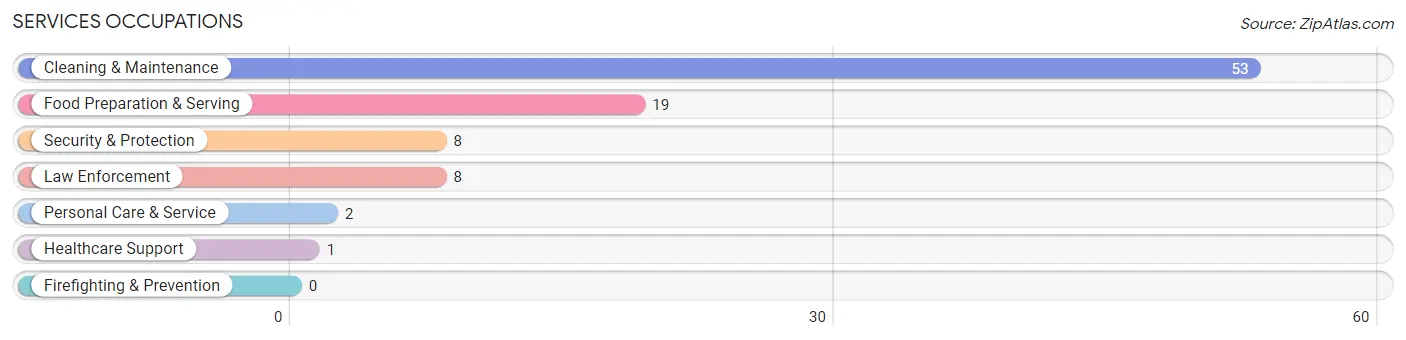
Services Occupations
The most common Services occupations in Carey are Cleaning & Maintenance (53 | 10.3%), Food Preparation & Serving (19 | 3.7%), Security & Protection (8 | 1.5%), Law Enforcement (8 | 1.5%), and Personal Care & Service (2 | 0.4%).
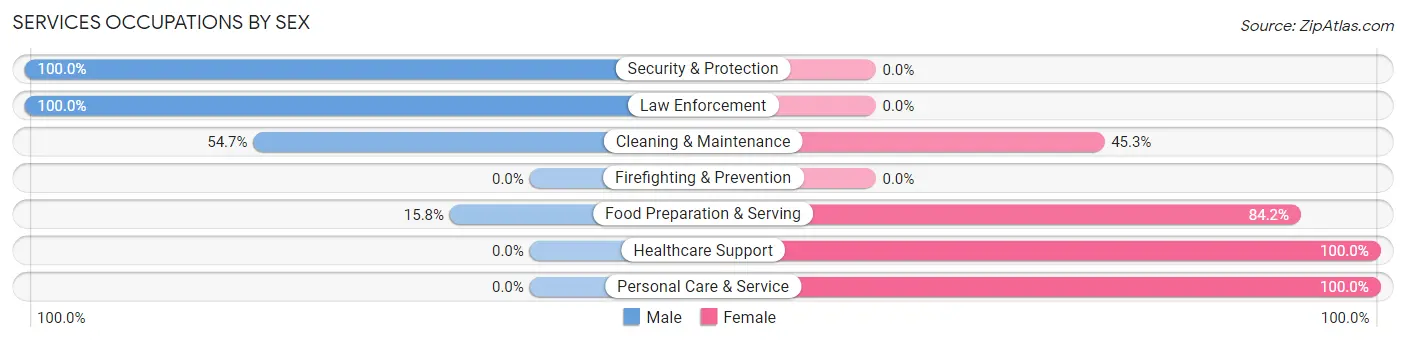
Services Occupations by Sex
Within the Services occupations in Carey, the most male-oriented occupations are Security & Protection (100.0%), Law Enforcement (100.0%), and Cleaning & Maintenance (54.7%), while the most female-oriented occupations are Healthcare Support (100.0%), Personal Care & Service (100.0%), and Food Preparation & Serving (84.2%).
| Occupation | Male | Female |
| Healthcare Support | 0 (0.0%) | 1 (100.0%) |
| Security & Protection | 8 (100.0%) | 0 (0.0%) |
| Firefighting & Prevention | 0 (0.0%) | 0 (0.0%) |
| Law Enforcement | 8 (100.0%) | 0 (0.0%) |
| Food Preparation & Serving | 3 (15.8%) | 16 (84.2%) |
| Cleaning & Maintenance | 29 (54.7%) | 24 (45.3%) |
| Personal Care & Service | 0 (0.0%) | 2 (100.0%) |
| Total (Category) | 40 (48.2%) | 43 (51.8%) |
| Total (Overall) | 376 (72.9%) | 140 (27.1%) |
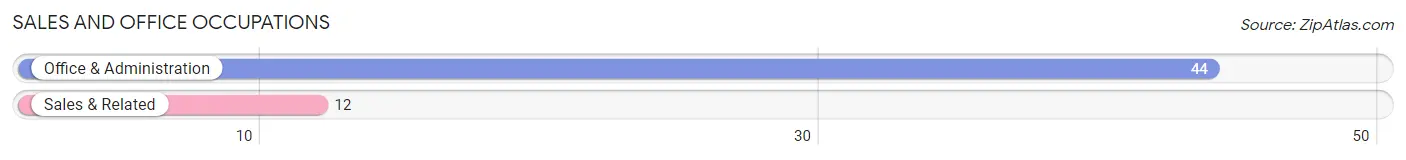
Sales and Office Occupations
The most common Sales and Office occupations in Carey are Office & Administration (44 | 8.5%), and Sales & Related (12 | 2.3%).
Sales and Office Occupations by Sex
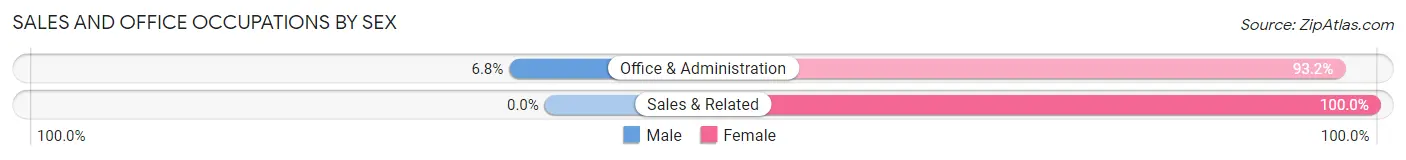
| Occupation | Male | Female |
| Sales & Related | 0 (0.0%) | 12 (100.0%) |
| Office & Administration | 3 (6.8%) | 41 (93.2%) |
| Total (Category) | 3 (5.4%) | 53 (94.6%) |
| Total (Overall) | 376 (72.9%) | 140 (27.1%) |
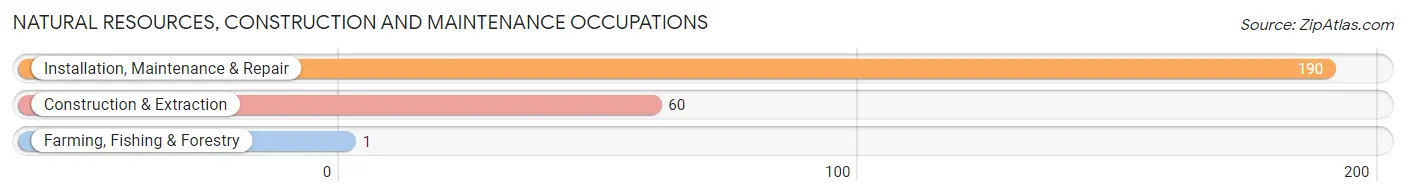
Natural Resources, Construction and Maintenance Occupations
The most common Natural Resources, Construction and Maintenance occupations in Carey are Installation, Maintenance & Repair (190 | 36.8%), Construction & Extraction (60 | 11.6%), and Farming, Fishing & Forestry (1 | 0.2%).
Natural Resources, Construction and Maintenance Occupations by Sex
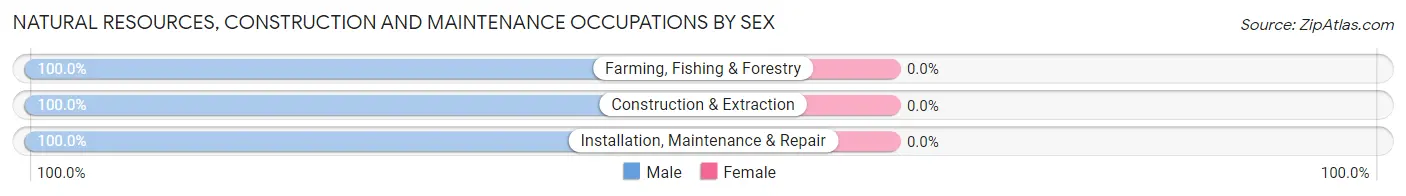
| Occupation | Male | Female |
| Farming, Fishing & Forestry | 1 (100.0%) | 0 (0.0%) |
| Construction & Extraction | 60 (100.0%) | 0 (0.0%) |
| Installation, Maintenance & Repair | 190 (100.0%) | 0 (0.0%) |
| Total (Category) | 251 (100.0%) | 0 (0.0%) |
| Total (Overall) | 376 (72.9%) | 140 (27.1%) |
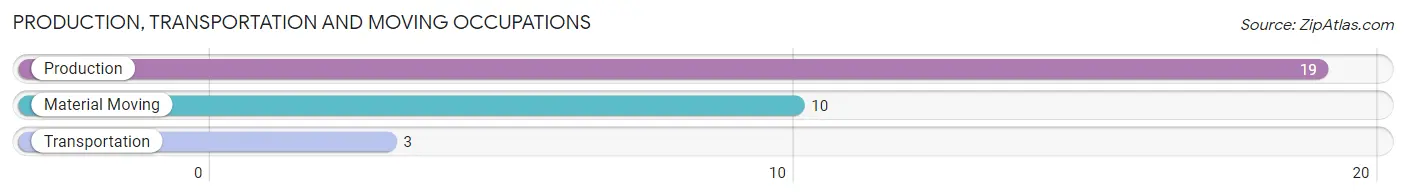
Production, Transportation and Moving Occupations
The most common Production, Transportation and Moving occupations in Carey are Production (19 | 3.7%), Material Moving (10 | 1.9%), and Transportation (3 | 0.6%).
Production, Transportation and Moving Occupations by Sex
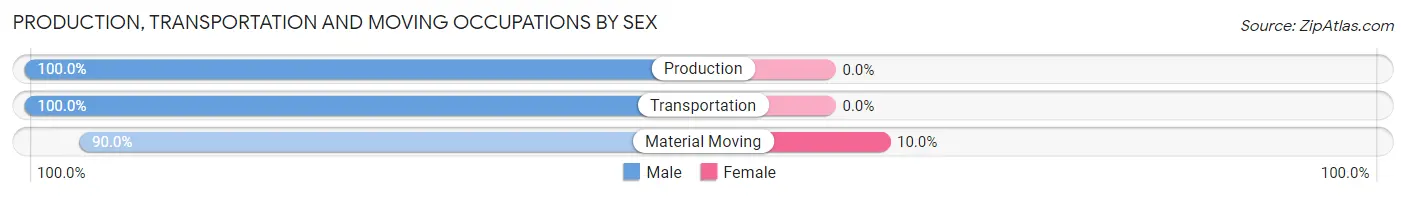
| Occupation | Male | Female |
| Production | 19 (100.0%) | 0 (0.0%) |
| Transportation | 3 (100.0%) | 0 (0.0%) |
| Material Moving | 9 (90.0%) | 1 (10.0%) |
| Total (Category) | 31 (96.9%) | 1 (3.1%) |
| Total (Overall) | 376 (72.9%) | 140 (27.1%) |
Employment Industries by Sex in Carey
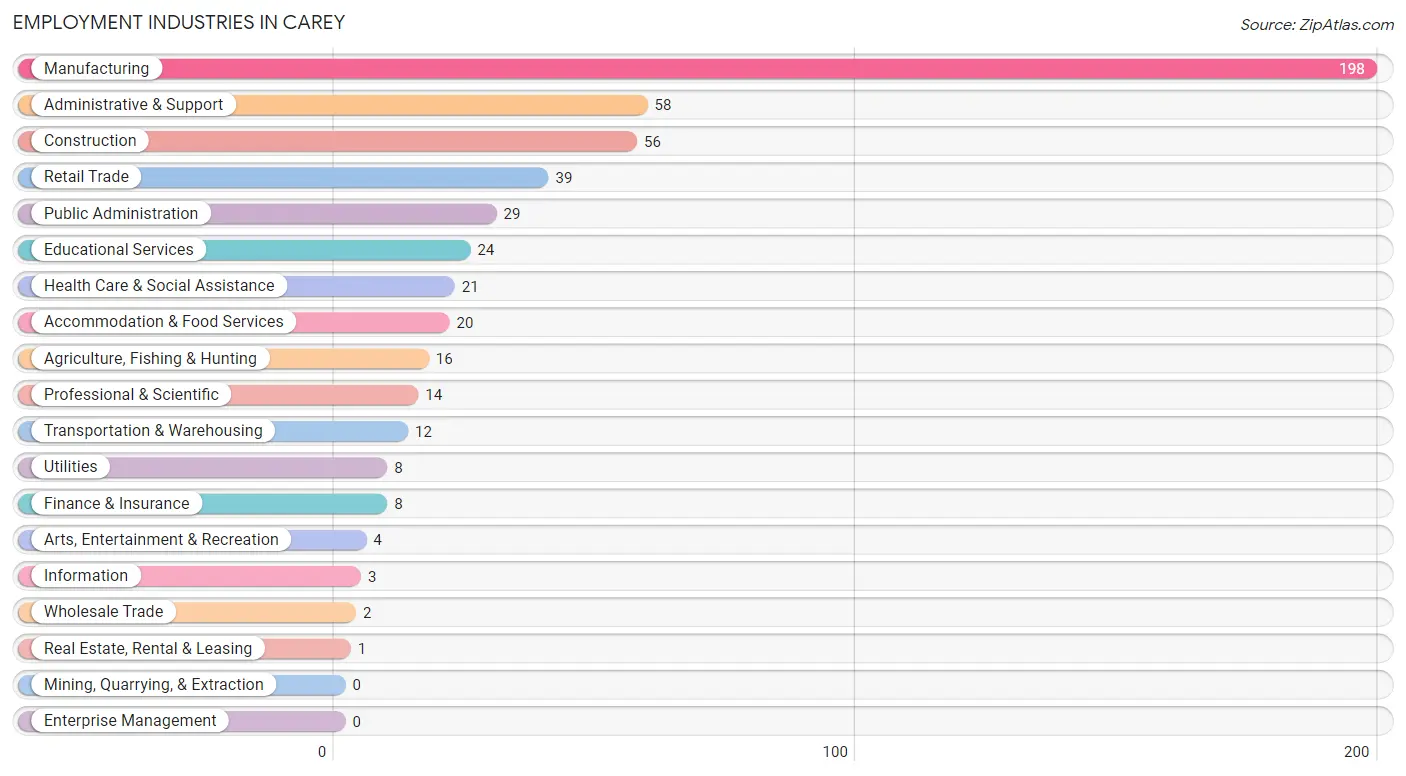
Employment Industries in Carey
The major employment industries in Carey include Manufacturing (198 | 38.4%), Administrative & Support (58 | 11.2%), Construction (56 | 10.8%), Retail Trade (39 | 7.6%), and Public Administration (29 | 5.6%).
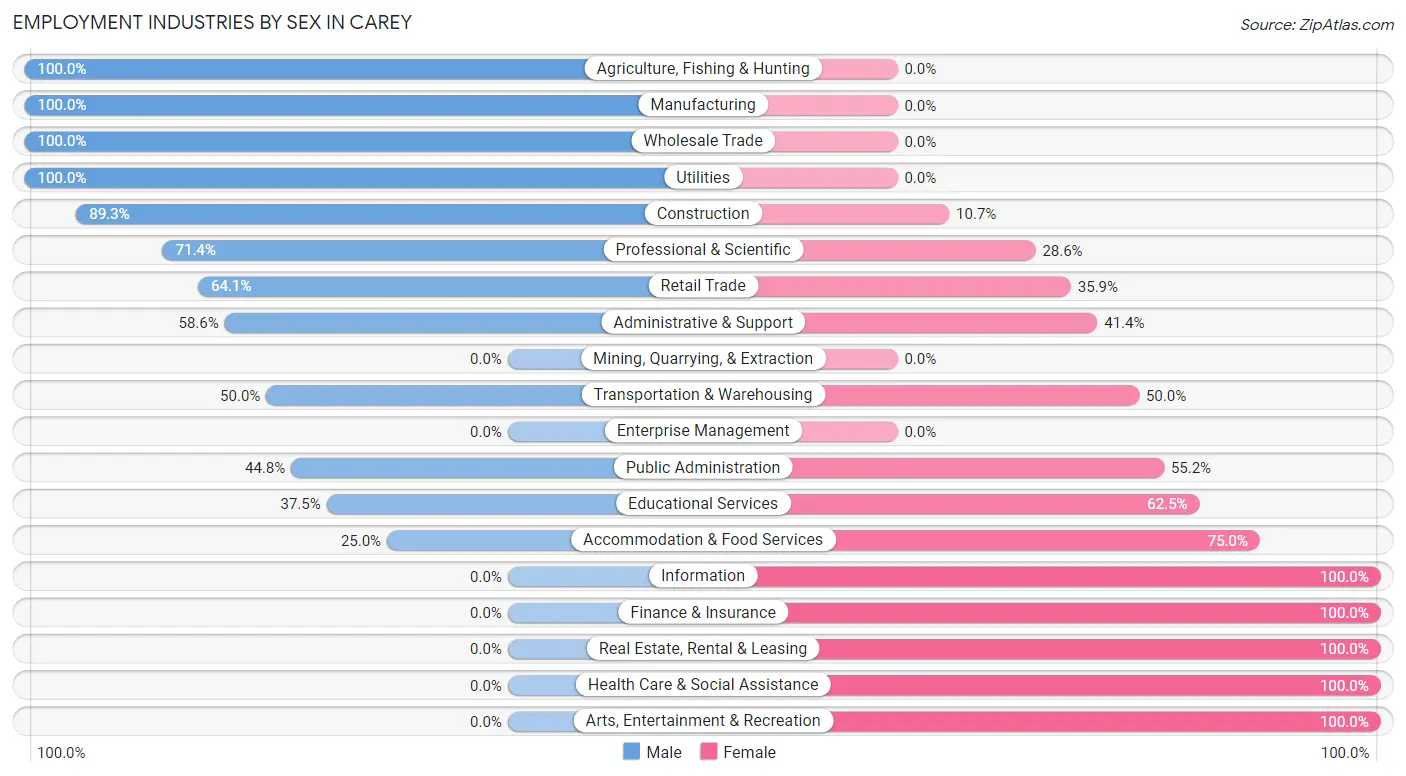
Employment Industries by Sex in Carey
The Carey industries that see more men than women are Agriculture, Fishing & Hunting (100.0%), Manufacturing (100.0%), and Wholesale Trade (100.0%), whereas the industries that tend to have a higher number of women are Information (100.0%), Finance & Insurance (100.0%), and Real Estate, Rental & Leasing (100.0%).
| Industry | Male | Female |
| Agriculture, Fishing & Hunting | 16 (100.0%) | 0 (0.0%) |
| Mining, Quarrying, & Extraction | 0 (0.0%) | 0 (0.0%) |
| Construction | 50 (89.3%) | 6 (10.7%) |
| Manufacturing | 198 (100.0%) | 0 (0.0%) |
| Wholesale Trade | 2 (100.0%) | 0 (0.0%) |
| Retail Trade | 25 (64.1%) | 14 (35.9%) |
| Transportation & Warehousing | 6 (50.0%) | 6 (50.0%) |
| Utilities | 8 (100.0%) | 0 (0.0%) |
| Information | 0 (0.0%) | 3 (100.0%) |
| Finance & Insurance | 0 (0.0%) | 8 (100.0%) |
| Real Estate, Rental & Leasing | 0 (0.0%) | 1 (100.0%) |
| Professional & Scientific | 10 (71.4%) | 4 (28.6%) |
| Enterprise Management | 0 (0.0%) | 0 (0.0%) |
| Administrative & Support | 34 (58.6%) | 24 (41.4%) |
| Educational Services | 9 (37.5%) | 15 (62.5%) |
| Health Care & Social Assistance | 0 (0.0%) | 21 (100.0%) |
| Arts, Entertainment & Recreation | 0 (0.0%) | 4 (100.0%) |
| Accommodation & Food Services | 5 (25.0%) | 15 (75.0%) |
| Public Administration | 13 (44.8%) | 16 (55.2%) |
| Total | 376 (72.9%) | 140 (27.1%) |
Education in Carey
School Enrollment in Carey
The most common levels of schooling among the 476 students in Carey are middle school (154 | 32.4%), high school (134 | 28.1%), and elementary school (81 | 17.0%).
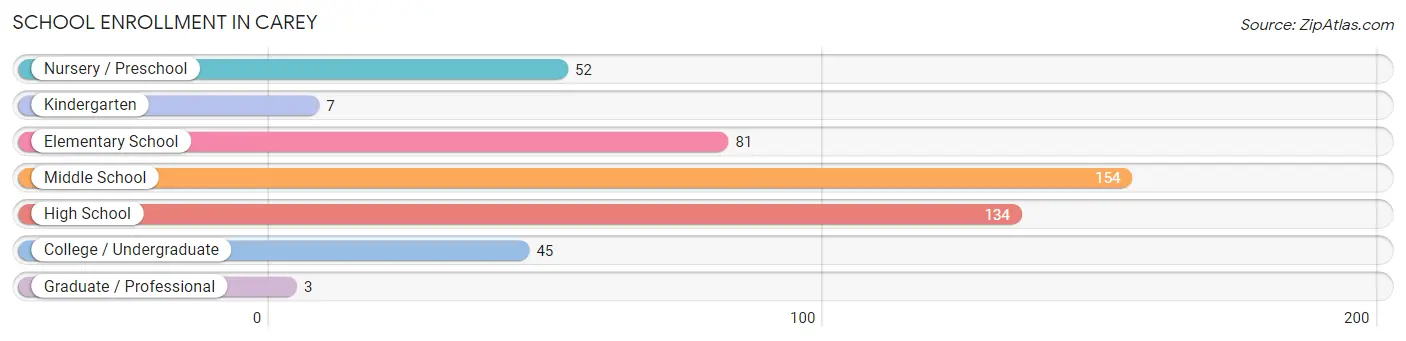
| School Level | # Students | % Students |
| Nursery / Preschool | 52 | 10.9% |
| Kindergarten | 7 | 1.5% |
| Elementary School | 81 | 17.0% |
| Middle School | 154 | 32.4% |
| High School | 134 | 28.1% |
| College / Undergraduate | 45 | 9.5% |
| Graduate / Professional | 3 | 0.6% |
| Total | 476 | 100.0% |
School Enrollment by Age by Funding Source in Carey
Out of a total of 476 students who are enrolled in schools in Carey, 31 (6.5%) attend a private institution, while the remaining 445 (93.5%) are enrolled in public schools. The age group of 35 years and over has the highest likelihood of being enrolled in private schools, with 26 (92.9% in the age bracket) enrolled. Conversely, the age group of 3 to 4 year olds has the lowest likelihood of being enrolled in a private school, with 52 (100.0% in the age bracket) attending a public institution.
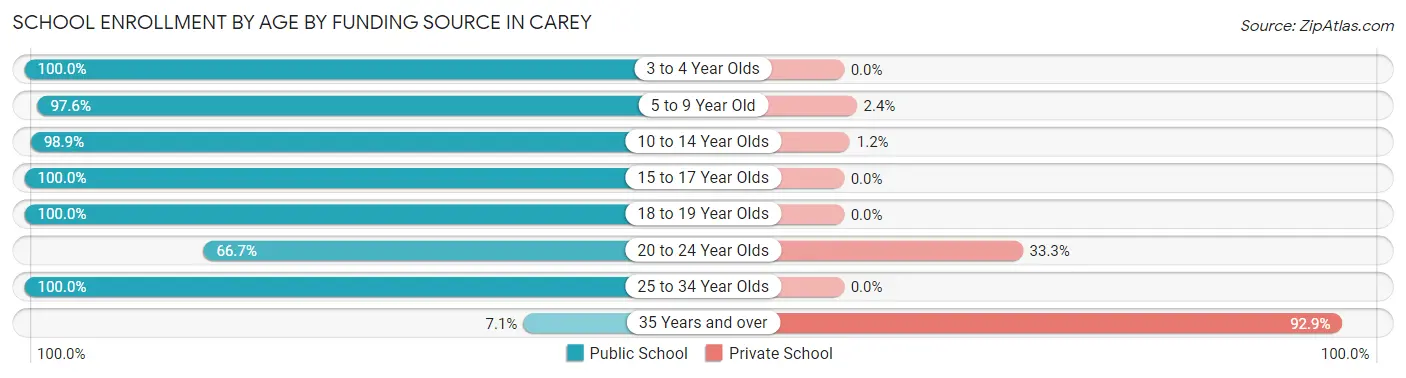
| Age Bracket | Public School | Private School |
| 3 to 4 Year Olds | 52 (100.0%) | 0 (0.0%) |
| 5 to 9 Year Old | 81 (97.6%) | 2 (2.4%) |
| 10 to 14 Year Olds | 172 (98.9%) | 2 (1.1%) |
| 15 to 17 Year Olds | 95 (100.0%) | 0 (0.0%) |
| 18 to 19 Year Olds | 40 (100.0%) | 0 (0.0%) |
| 20 to 24 Year Olds | 2 (66.7%) | 1 (33.3%) |
| 25 to 34 Year Olds | 1 (100.0%) | 0 (0.0%) |
| 35 Years and over | 2 (7.1%) | 26 (92.9%) |
| Total | 445 (93.5%) | 31 (6.5%) |
Educational Attainment by Field of Study in Carey
Science & technology (39 | 36.1%), engineering (18 | 16.7%), arts & humanities (18 | 16.7%), bio, nature & agricultural (10 | 9.3%), and education (9 | 8.3%) are the most common fields of study among 108 individuals in Carey who have obtained a bachelor's degree or higher.
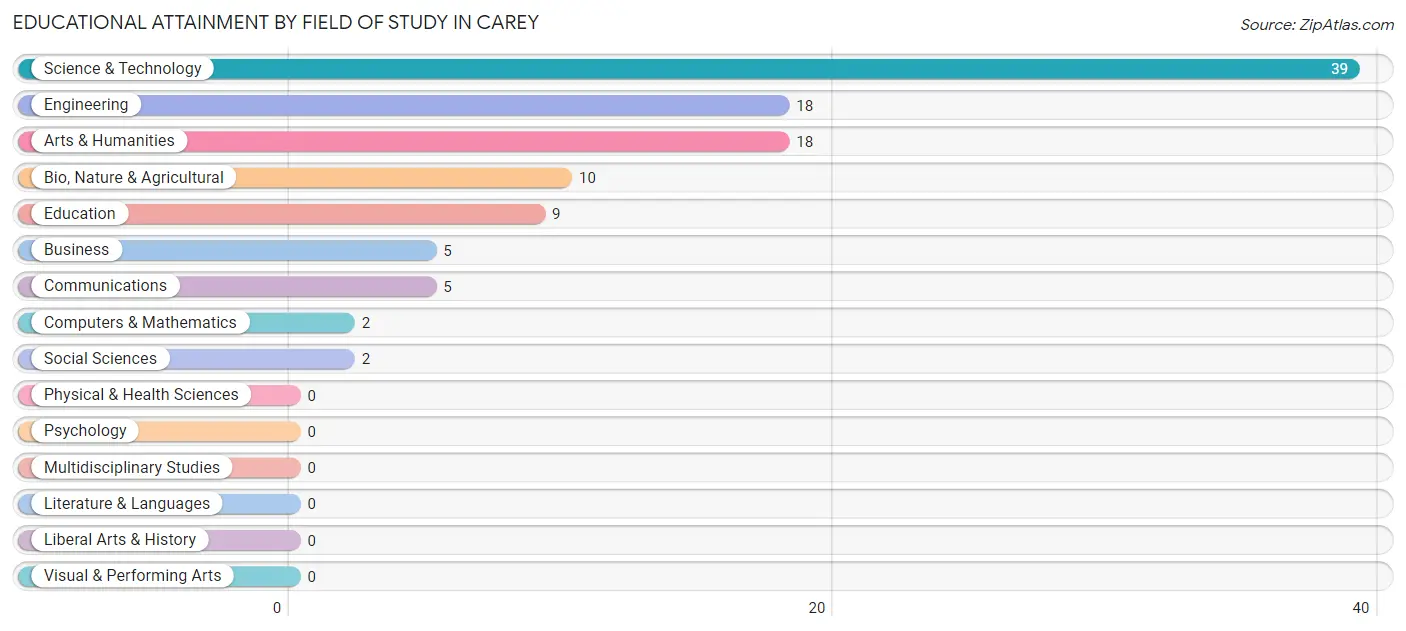
| Field of Study | # Graduates | % Graduates |
| Computers & Mathematics | 2 | 1.8% |
| Bio, Nature & Agricultural | 10 | 9.3% |
| Physical & Health Sciences | 0 | 0.0% |
| Psychology | 0 | 0.0% |
| Social Sciences | 2 | 1.8% |
| Engineering | 18 | 16.7% |
| Multidisciplinary Studies | 0 | 0.0% |
| Science & Technology | 39 | 36.1% |
| Business | 5 | 4.6% |
| Education | 9 | 8.3% |
| Literature & Languages | 0 | 0.0% |
| Liberal Arts & History | 0 | 0.0% |
| Visual & Performing Arts | 0 | 0.0% |
| Communications | 5 | 4.6% |
| Arts & Humanities | 18 | 16.7% |
| Total | 108 | 100.0% |
Transportation & Commute in Carey
Vehicle Availability by Sex in Carey
The most prevalent vehicle ownership categories in Carey are males with 3 vehicles (225, accounting for 60.0%) and females with 3 vehicles (31, making up 161.9%).
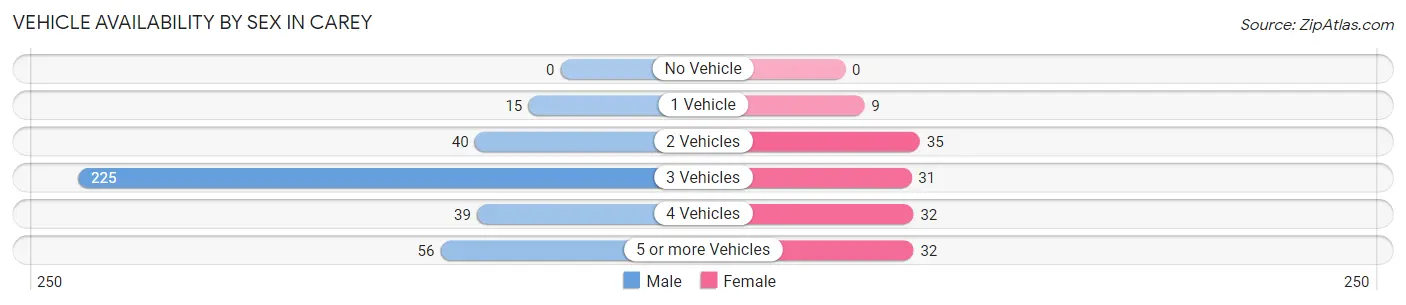
| Vehicles Available | Male | Female |
| No Vehicle | 0 (0.0%) | 0 (0.0%) |
| 1 Vehicle | 15 (4.0%) | 9 (6.5%) |
| 2 Vehicles | 40 (10.7%) | 35 (25.2%) |
| 3 Vehicles | 225 (60.0%) | 31 (22.3%) |
| 4 Vehicles | 39 (10.4%) | 32 (23.0%) |
| 5 or more Vehicles | 56 (14.9%) | 32 (23.0%) |
| Total | 375 (100.0%) | 139 (100.0%) |
Commute Time in Carey
The most frequently occuring commute durations in Carey are 5 to 9 minutes (192 commuters, 39.2%), 60 to 89 minutes (74 commuters, 15.1%), and 45 to 59 minutes (62 commuters, 12.7%).
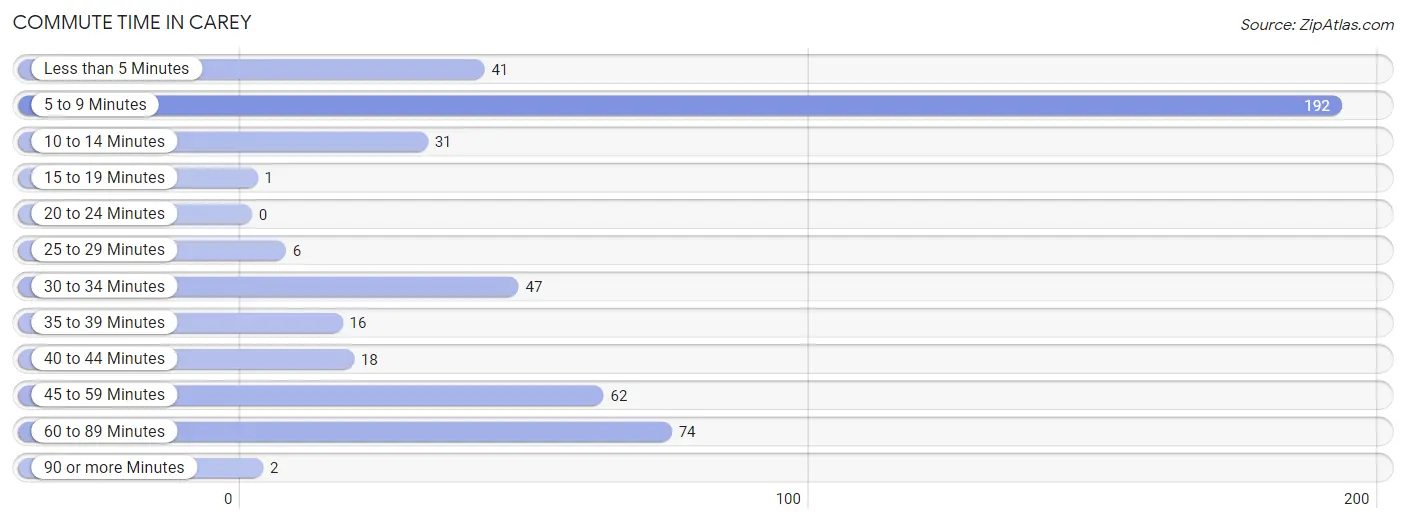
| Commute Time | # Commuters | % Commuters |
| Less than 5 Minutes | 41 | 8.4% |
| 5 to 9 Minutes | 192 | 39.2% |
| 10 to 14 Minutes | 31 | 6.3% |
| 15 to 19 Minutes | 1 | 0.2% |
| 20 to 24 Minutes | 0 | 0.0% |
| 25 to 29 Minutes | 6 | 1.2% |
| 30 to 34 Minutes | 47 | 9.6% |
| 35 to 39 Minutes | 16 | 3.3% |
| 40 to 44 Minutes | 18 | 3.7% |
| 45 to 59 Minutes | 62 | 12.7% |
| 60 to 89 Minutes | 74 | 15.1% |
| 90 or more Minutes | 2 | 0.4% |
Commute Time by Sex in Carey
The most common commute times in Carey are 5 to 9 minutes (187 commuters, 50.9%) for males and 30 to 34 minutes (29 commuters, 23.6%) for females.
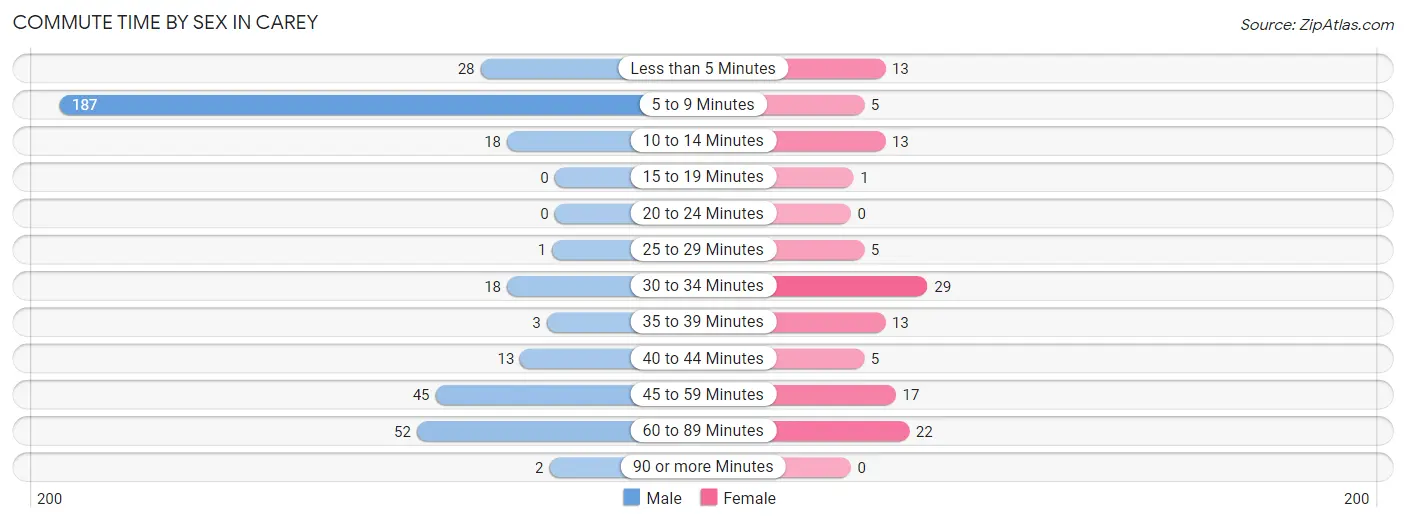
| Commute Time | Male | Female |
| Less than 5 Minutes | 28 (7.6%) | 13 (10.6%) |
| 5 to 9 Minutes | 187 (50.9%) | 5 (4.1%) |
| 10 to 14 Minutes | 18 (4.9%) | 13 (10.6%) |
| 15 to 19 Minutes | 0 (0.0%) | 1 (0.8%) |
| 20 to 24 Minutes | 0 (0.0%) | 0 (0.0%) |
| 25 to 29 Minutes | 1 (0.3%) | 5 (4.1%) |
| 30 to 34 Minutes | 18 (4.9%) | 29 (23.6%) |
| 35 to 39 Minutes | 3 (0.8%) | 13 (10.6%) |
| 40 to 44 Minutes | 13 (3.5%) | 5 (4.1%) |
| 45 to 59 Minutes | 45 (12.3%) | 17 (13.8%) |
| 60 to 89 Minutes | 52 (14.2%) | 22 (17.9%) |
| 90 or more Minutes | 2 (0.5%) | 0 (0.0%) |
Time of Departure to Work by Sex in Carey
The most frequent times of departure to work in Carey are 6:30 AM to 6:59 AM (201, 54.8%) for males and 8:00 AM to 8:29 AM (33, 26.8%) for females.
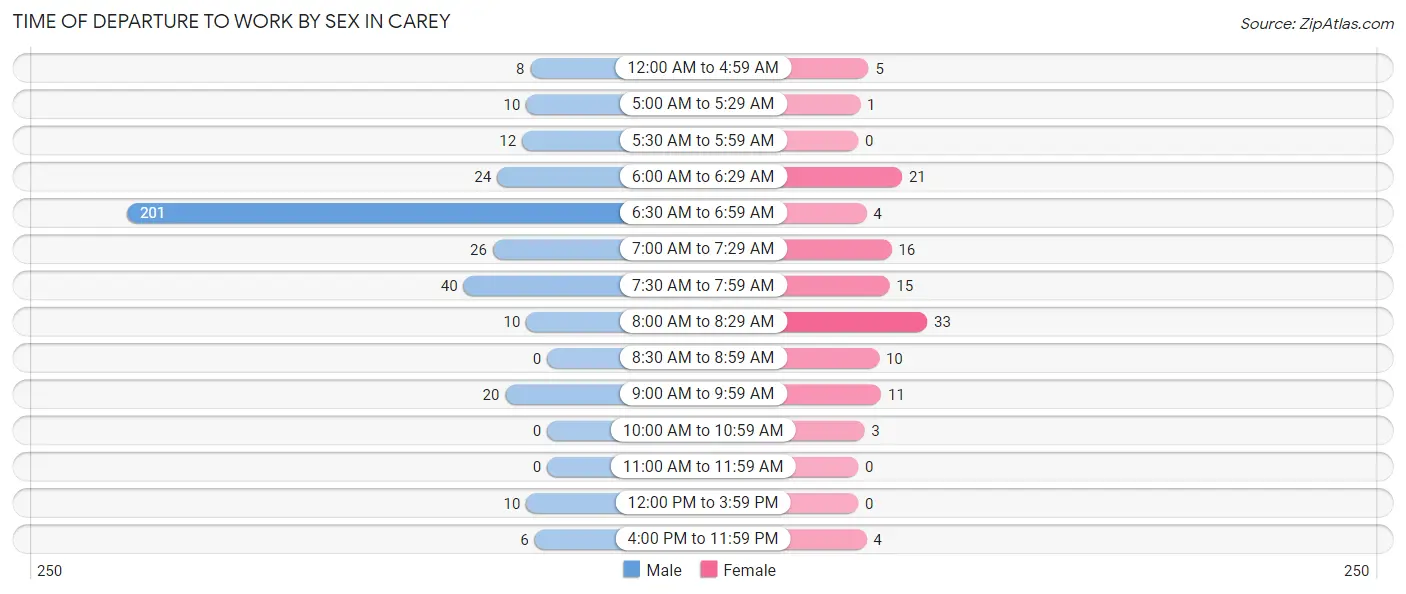
| Time of Departure | Male | Female |
| 12:00 AM to 4:59 AM | 8 (2.2%) | 5 (4.1%) |
| 5:00 AM to 5:29 AM | 10 (2.7%) | 1 (0.8%) |
| 5:30 AM to 5:59 AM | 12 (3.3%) | 0 (0.0%) |
| 6:00 AM to 6:29 AM | 24 (6.5%) | 21 (17.1%) |
| 6:30 AM to 6:59 AM | 201 (54.8%) | 4 (3.3%) |
| 7:00 AM to 7:29 AM | 26 (7.1%) | 16 (13.0%) |
| 7:30 AM to 7:59 AM | 40 (10.9%) | 15 (12.2%) |
| 8:00 AM to 8:29 AM | 10 (2.7%) | 33 (26.8%) |
| 8:30 AM to 8:59 AM | 0 (0.0%) | 10 (8.1%) |
| 9:00 AM to 9:59 AM | 20 (5.4%) | 11 (8.9%) |
| 10:00 AM to 10:59 AM | 0 (0.0%) | 3 (2.4%) |
| 11:00 AM to 11:59 AM | 0 (0.0%) | 0 (0.0%) |
| 12:00 PM to 3:59 PM | 10 (2.7%) | 0 (0.0%) |
| 4:00 PM to 11:59 PM | 6 (1.6%) | 4 (3.3%) |
| Total | 367 (100.0%) | 123 (100.0%) |
Housing Occupancy in Carey
Occupancy by Ownership in Carey
Of the total 264 dwellings in Carey, owner-occupied units account for 221 (83.7%), while renter-occupied units make up 43 (16.3%).
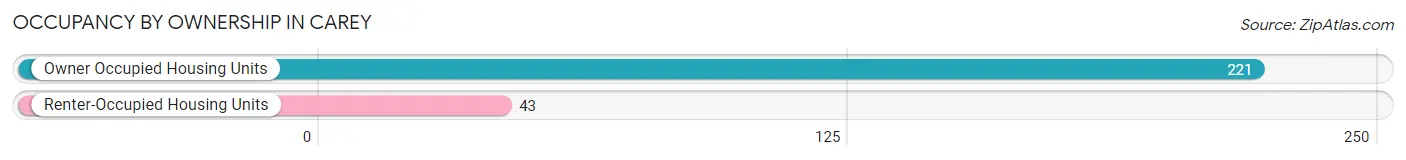
| Occupancy | # Housing Units | % Housing Units |
| Owner Occupied Housing Units | 221 | 83.7% |
| Renter-Occupied Housing Units | 43 | 16.3% |
| Total Occupied Housing Units | 264 | 100.0% |
Occupancy by Household Size in Carey
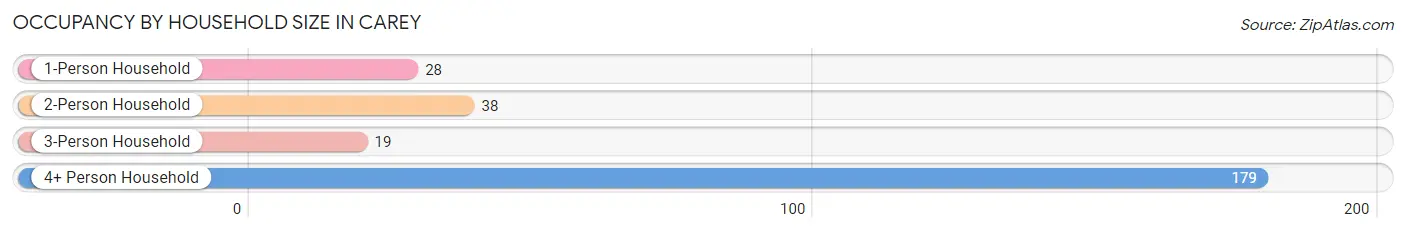
| Household Size | # Housing Units | % Housing Units |
| 1-Person Household | 28 | 10.6% |
| 2-Person Household | 38 | 14.4% |
| 3-Person Household | 19 | 7.2% |
| 4+ Person Household | 179 | 67.8% |
| Total Housing Units | 264 | 100.0% |
Occupancy by Ownership by Household Size in Carey
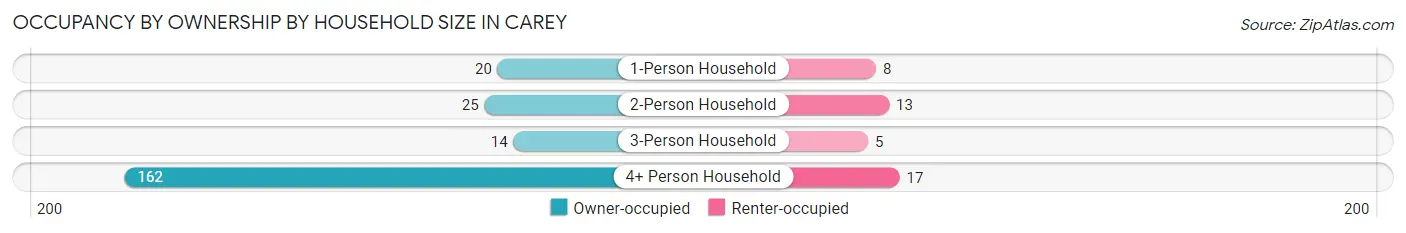
| Household Size | Owner-occupied | Renter-occupied |
| 1-Person Household | 20 (71.4%) | 8 (28.6%) |
| 2-Person Household | 25 (65.8%) | 13 (34.2%) |
| 3-Person Household | 14 (73.7%) | 5 (26.3%) |
| 4+ Person Household | 162 (90.5%) | 17 (9.5%) |
| Total Housing Units | 221 (83.7%) | 43 (16.3%) |
Occupancy by Educational Attainment in Carey
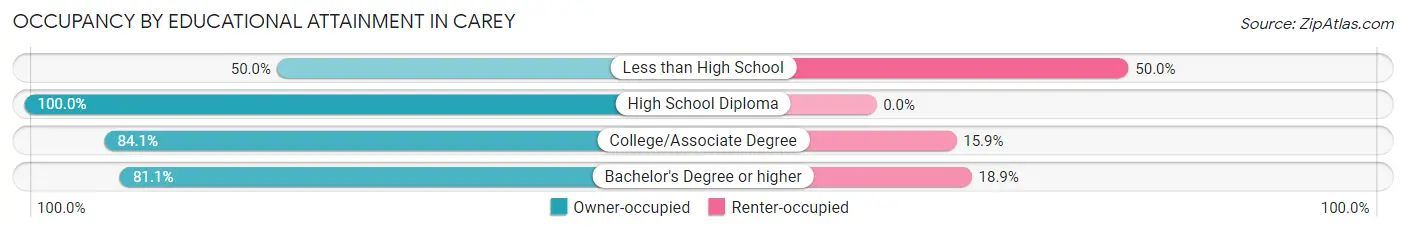
| Household Size | Owner-occupied | Renter-occupied |
| Less than High School | 9 (50.0%) | 9 (50.0%) |
| High School Diploma | 39 (100.0%) | 0 (0.0%) |
| College/Associate Degree | 143 (84.1%) | 27 (15.9%) |
| Bachelor's Degree or higher | 30 (81.1%) | 7 (18.9%) |
Occupancy by Age of Householder in Carey
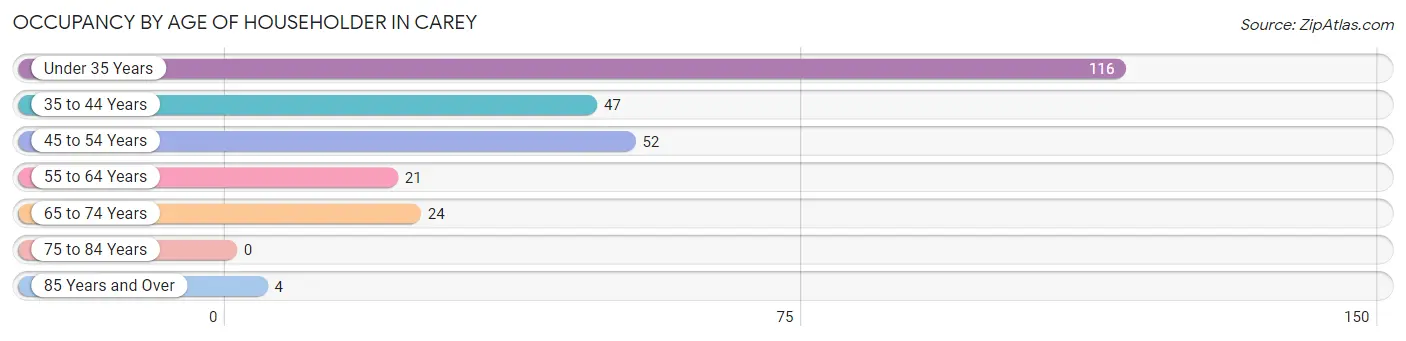
| Age Bracket | # Households | % Households |
| Under 35 Years | 116 | 43.9% |
| 35 to 44 Years | 47 | 17.8% |
| 45 to 54 Years | 52 | 19.7% |
| 55 to 64 Years | 21 | 8.0% |
| 65 to 74 Years | 24 | 9.1% |
| 75 to 84 Years | 0 | 0.0% |
| 85 Years and Over | 4 | 1.5% |
| Total | 264 | 100.0% |
Housing Finances in Carey
Median Income by Occupancy in Carey
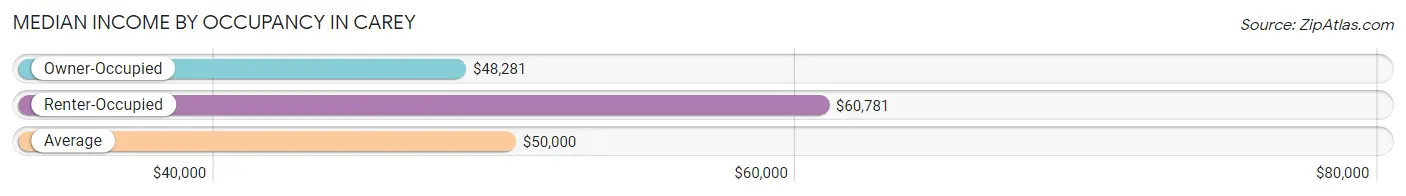
| Occupancy Type | # Households | Median Income |
| Owner-Occupied | 221 (83.7%) | $48,281 |
| Renter-Occupied | 43 (16.3%) | $60,781 |
| Average | 264 (100.0%) | $50,000 |
Occupancy by Householder Income Bracket in Carey
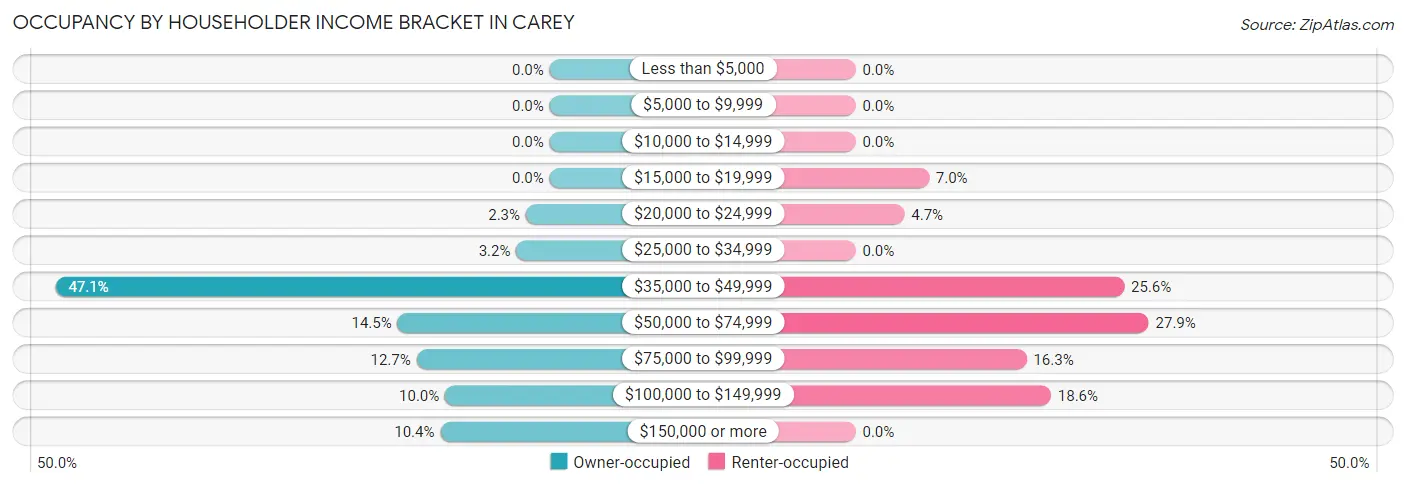
| Income Bracket | Owner-occupied | Renter-occupied |
| Less than $5,000 | 0 (0.0%) | 0 (0.0%) |
| $5,000 to $9,999 | 0 (0.0%) | 0 (0.0%) |
| $10,000 to $14,999 | 0 (0.0%) | 0 (0.0%) |
| $15,000 to $19,999 | 0 (0.0%) | 3 (7.0%) |
| $20,000 to $24,999 | 5 (2.3%) | 2 (4.6%) |
| $25,000 to $34,999 | 7 (3.2%) | 0 (0.0%) |
| $35,000 to $49,999 | 104 (47.1%) | 11 (25.6%) |
| $50,000 to $74,999 | 32 (14.5%) | 12 (27.9%) |
| $75,000 to $99,999 | 28 (12.7%) | 7 (16.3%) |
| $100,000 to $149,999 | 22 (10.0%) | 8 (18.6%) |
| $150,000 or more | 23 (10.4%) | 0 (0.0%) |
| Total | 221 (100.0%) | 43 (100.0%) |
Monthly Housing Cost Tiers in Carey
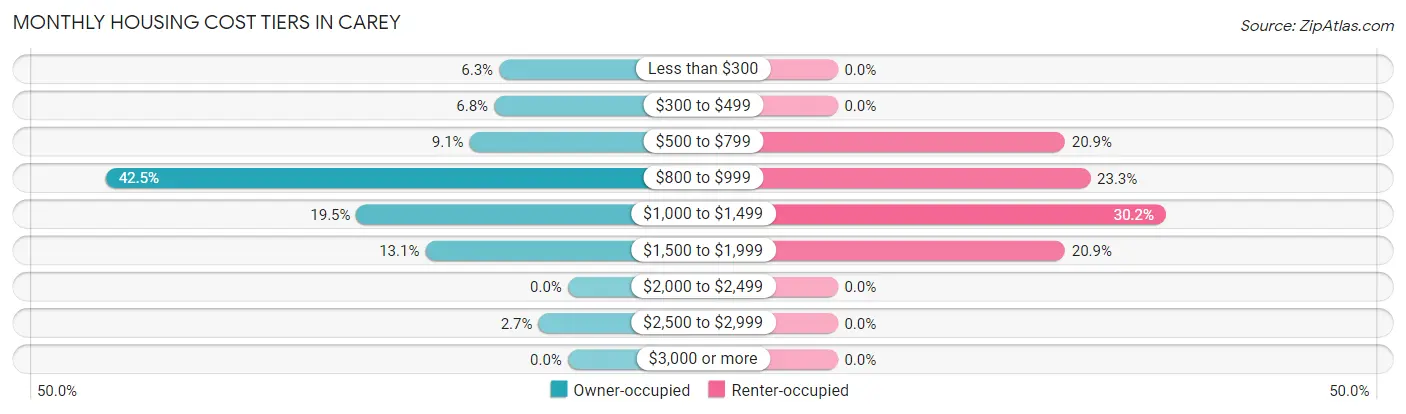
| Monthly Cost | Owner-occupied | Renter-occupied |
| Less than $300 | 14 (6.3%) | 0 (0.0%) |
| $300 to $499 | 15 (6.8%) | 0 (0.0%) |
| $500 to $799 | 20 (9.0%) | 9 (20.9%) |
| $800 to $999 | 94 (42.5%) | 10 (23.3%) |
| $1,000 to $1,499 | 43 (19.5%) | 13 (30.2%) |
| $1,500 to $1,999 | 29 (13.1%) | 9 (20.9%) |
| $2,000 to $2,499 | 0 (0.0%) | 0 (0.0%) |
| $2,500 to $2,999 | 6 (2.7%) | 0 (0.0%) |
| $3,000 or more | 0 (0.0%) | 0 (0.0%) |
| Total | 221 (100.0%) | 43 (100.0%) |
Physical Housing Characteristics in Carey
Housing Structures in Carey
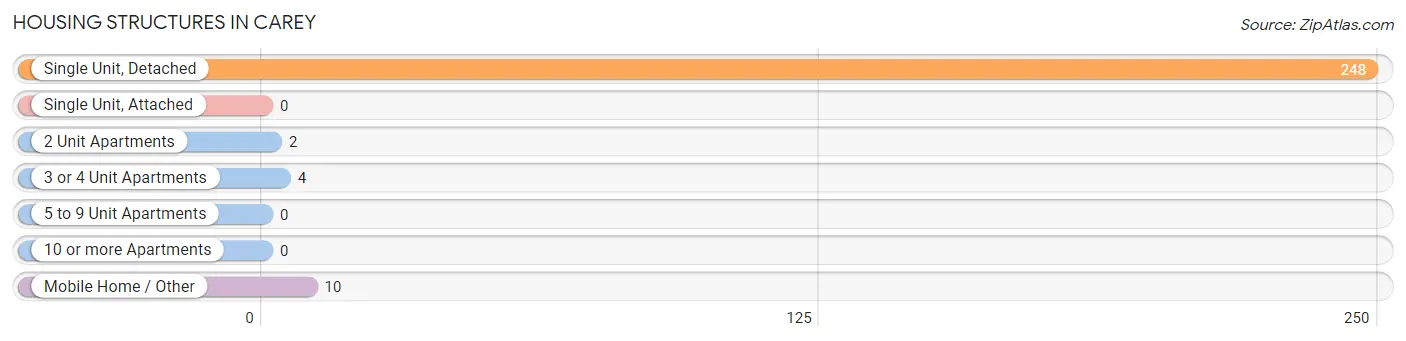
| Structure Type | # Housing Units | % Housing Units |
| Single Unit, Detached | 248 | 93.9% |
| Single Unit, Attached | 0 | 0.0% |
| 2 Unit Apartments | 2 | 0.8% |
| 3 or 4 Unit Apartments | 4 | 1.5% |
| 5 to 9 Unit Apartments | 0 | 0.0% |
| 10 or more Apartments | 0 | 0.0% |
| Mobile Home / Other | 10 | 3.8% |
| Total | 264 | 100.0% |
Housing Structures by Occupancy in Carey
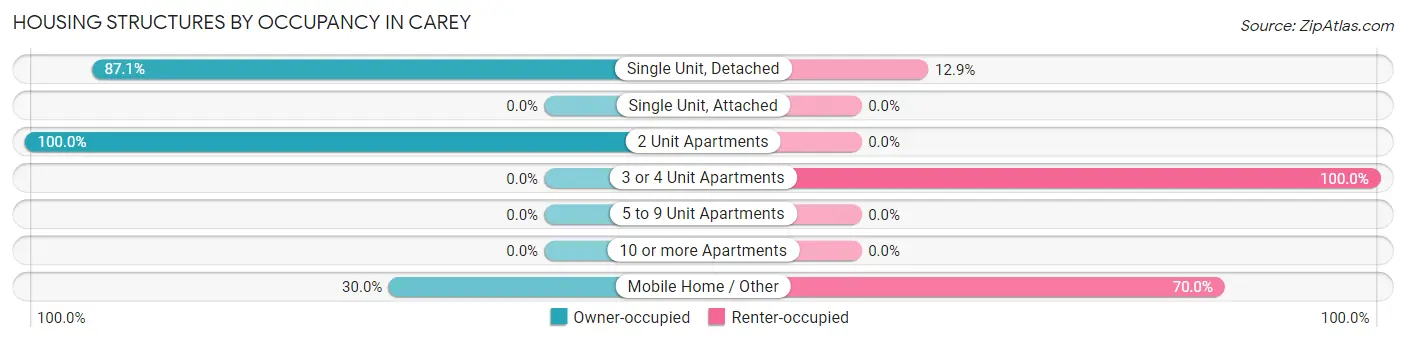
| Structure Type | Owner-occupied | Renter-occupied |
| Single Unit, Detached | 216 (87.1%) | 32 (12.9%) |
| Single Unit, Attached | 0 (0.0%) | 0 (0.0%) |
| 2 Unit Apartments | 2 (100.0%) | 0 (0.0%) |
| 3 or 4 Unit Apartments | 0 (0.0%) | 4 (100.0%) |
| 5 to 9 Unit Apartments | 0 (0.0%) | 0 (0.0%) |
| 10 or more Apartments | 0 (0.0%) | 0 (0.0%) |
| Mobile Home / Other | 3 (30.0%) | 7 (70.0%) |
| Total | 221 (83.7%) | 43 (16.3%) |
Housing Structures by Number of Rooms in Carey
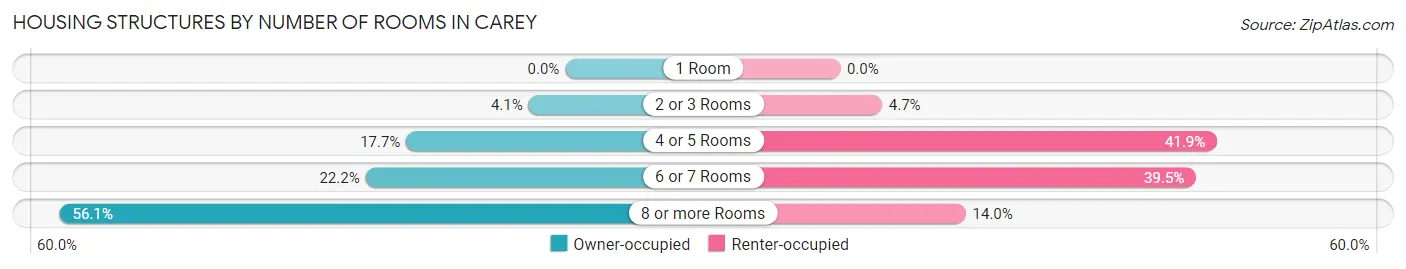
| Number of Rooms | Owner-occupied | Renter-occupied |
| 1 Room | 0 (0.0%) | 0 (0.0%) |
| 2 or 3 Rooms | 9 (4.1%) | 2 (4.6%) |
| 4 or 5 Rooms | 39 (17.6%) | 18 (41.9%) |
| 6 or 7 Rooms | 49 (22.2%) | 17 (39.5%) |
| 8 or more Rooms | 124 (56.1%) | 6 (14.0%) |
| Total | 221 (100.0%) | 43 (100.0%) |
Housing Structure by Heating Type in Carey
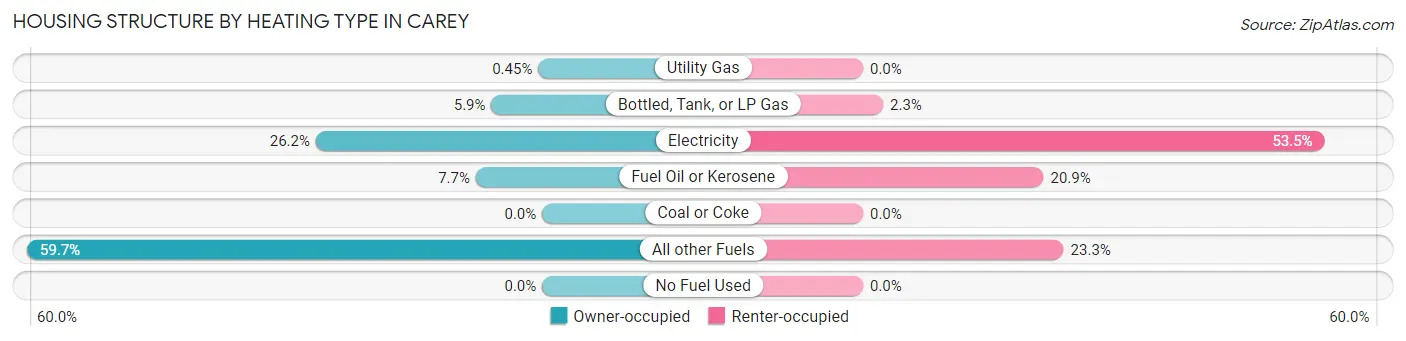
| Heating Type | Owner-occupied | Renter-occupied |
| Utility Gas | 1 (0.4%) | 0 (0.0%) |
| Bottled, Tank, or LP Gas | 13 (5.9%) | 1 (2.3%) |
| Electricity | 58 (26.2%) | 23 (53.5%) |
| Fuel Oil or Kerosene | 17 (7.7%) | 9 (20.9%) |
| Coal or Coke | 0 (0.0%) | 0 (0.0%) |
| All other Fuels | 132 (59.7%) | 10 (23.3%) |
| No Fuel Used | 0 (0.0%) | 0 (0.0%) |
| Total | 221 (100.0%) | 43 (100.0%) |
Household Vehicle Usage in Carey
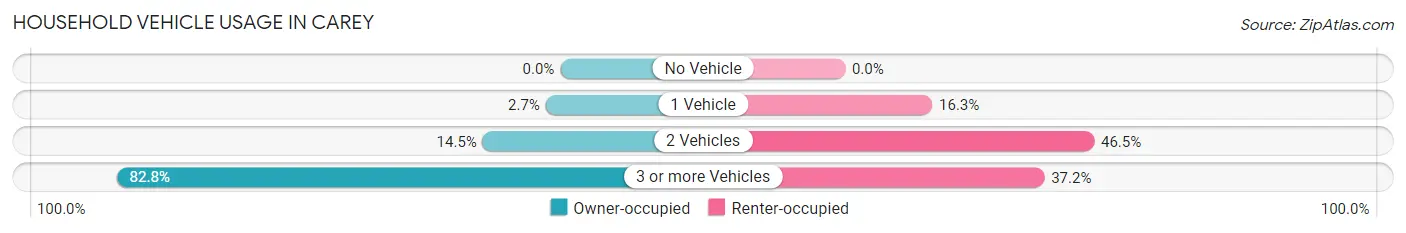
| Vehicles per Household | Owner-occupied | Renter-occupied |
| No Vehicle | 0 (0.0%) | 0 (0.0%) |
| 1 Vehicle | 6 (2.7%) | 7 (16.3%) |
| 2 Vehicles | 32 (14.5%) | 20 (46.5%) |
| 3 or more Vehicles | 183 (82.8%) | 16 (37.2%) |
| Total | 221 (100.0%) | 43 (100.0%) |
Real Estate & Mortgages in Carey
Real Estate and Mortgage Overview in Carey
| Characteristic | Without Mortgage | With Mortgage |
| Housing Units | 41 | 180 |
| Median Property Value | $191,300 | $172,400 |
| Median Household Income | $72,344 | $15 |
| Monthly Housing Costs | $375 | $0 |
| Real Estate Taxes | $930 | $0 |
Property Value by Mortgage Status in Carey
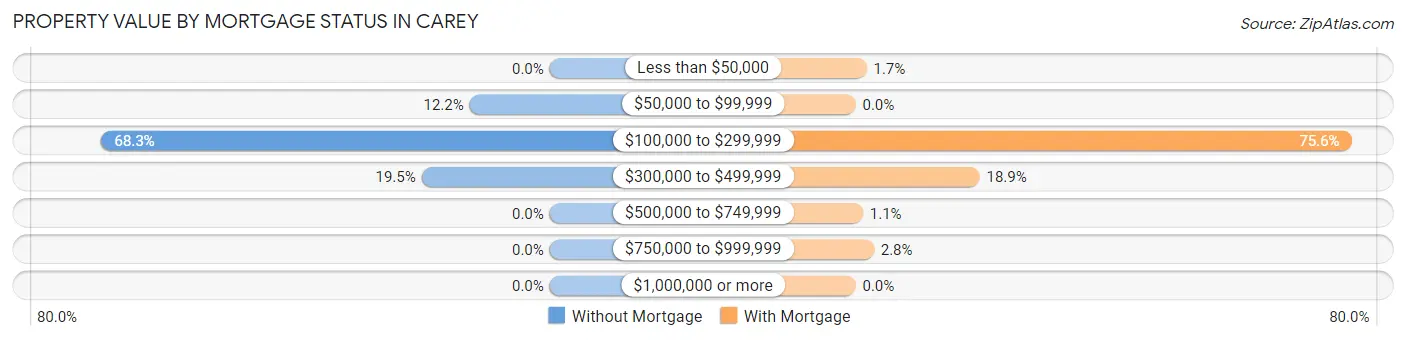
| Property Value | Without Mortgage | With Mortgage |
| Less than $50,000 | 0 (0.0%) | 3 (1.7%) |
| $50,000 to $99,999 | 5 (12.2%) | 0 (0.0%) |
| $100,000 to $299,999 | 28 (68.3%) | 136 (75.6%) |
| $300,000 to $499,999 | 8 (19.5%) | 34 (18.9%) |
| $500,000 to $749,999 | 0 (0.0%) | 2 (1.1%) |
| $750,000 to $999,999 | 0 (0.0%) | 5 (2.8%) |
| $1,000,000 or more | 0 (0.0%) | 0 (0.0%) |
| Total | 41 (100.0%) | 180 (100.0%) |
Household Income by Mortgage Status in Carey
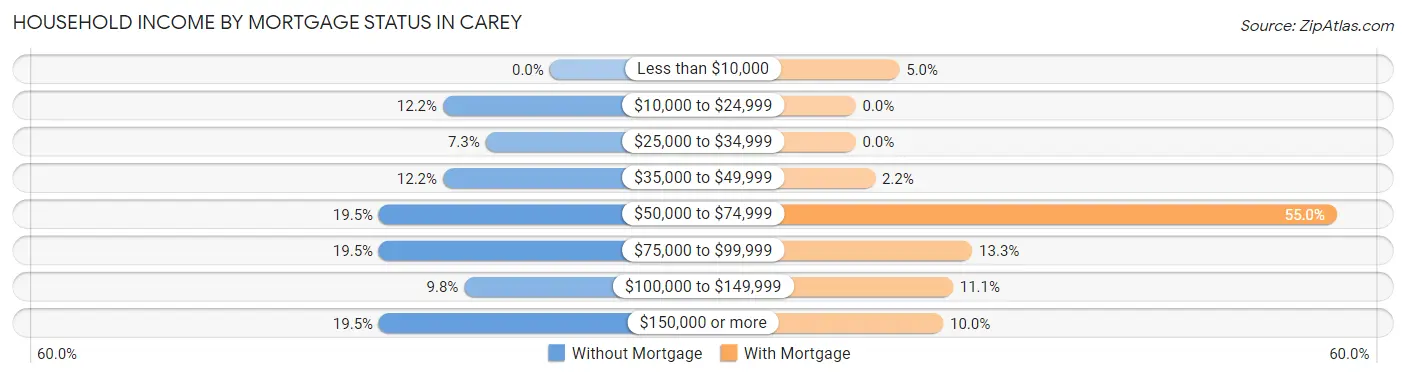
| Household Income | Without Mortgage | With Mortgage |
| Less than $10,000 | 0 (0.0%) | 9 (5.0%) |
| $10,000 to $24,999 | 5 (12.2%) | 0 (0.0%) |
| $25,000 to $34,999 | 3 (7.3%) | 0 (0.0%) |
| $35,000 to $49,999 | 5 (12.2%) | 4 (2.2%) |
| $50,000 to $74,999 | 8 (19.5%) | 99 (55.0%) |
| $75,000 to $99,999 | 8 (19.5%) | 24 (13.3%) |
| $100,000 to $149,999 | 4 (9.8%) | 20 (11.1%) |
| $150,000 or more | 8 (19.5%) | 18 (10.0%) |
| Total | 41 (100.0%) | 180 (100.0%) |
Property Value to Household Income Ratio in Carey
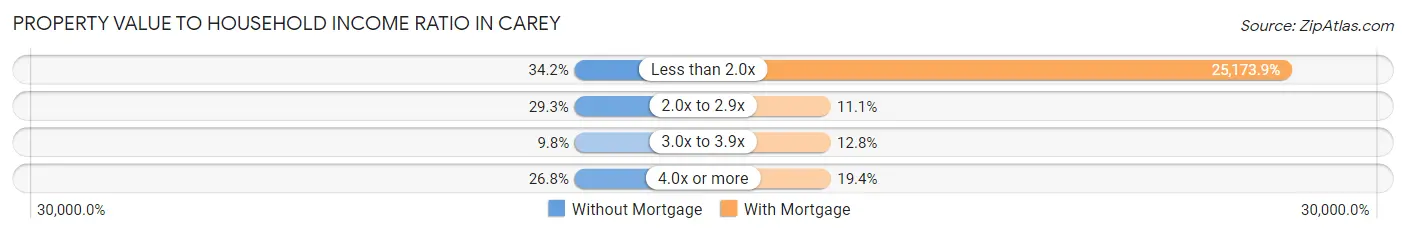
| Value-to-Income Ratio | Without Mortgage | With Mortgage |
| Less than 2.0x | 14 (34.2%) | 45,313 (25,173.9%) |
| 2.0x to 2.9x | 12 (29.3%) | 20 (11.1%) |
| 3.0x to 3.9x | 4 (9.8%) | 23 (12.8%) |
| 4.0x or more | 11 (26.8%) | 35 (19.4%) |
| Total | 41 (100.0%) | 180 (100.0%) |
Real Estate Taxes by Mortgage Status in Carey
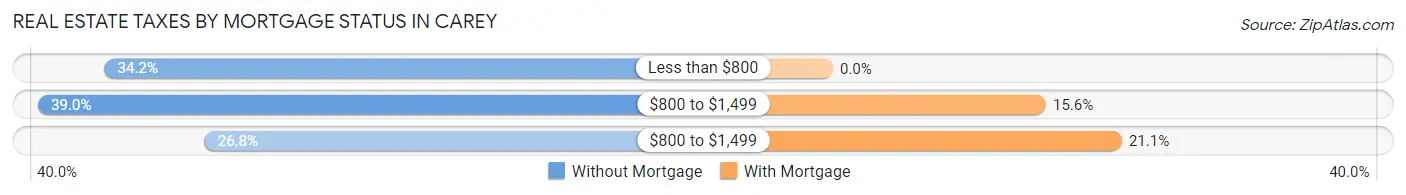
| Property Taxes | Without Mortgage | With Mortgage |
| Less than $800 | 14 (34.2%) | 0 (0.0%) |
| $800 to $1,499 | 16 (39.0%) | 28 (15.6%) |
| $800 to $1,499 | 11 (26.8%) | 38 (21.1%) |
| Total | 41 (100.0%) | 180 (100.0%) |
Health & Disability in Carey
Health Insurance Coverage by Age in Carey
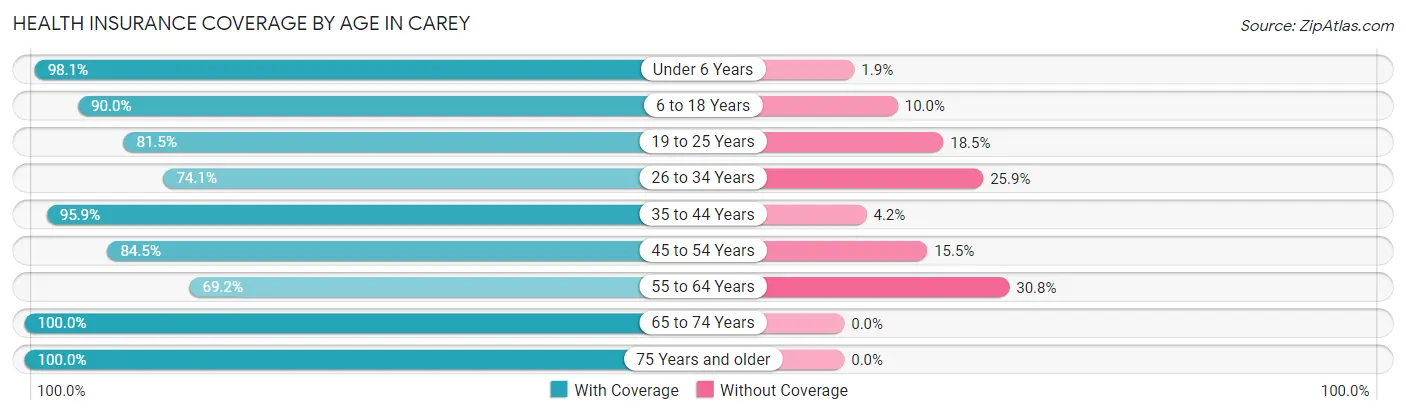
| Age Bracket | With Coverage | Without Coverage |
| Under 6 Years | 104 (98.1%) | 2 (1.9%) |
| 6 to 18 Years | 343 (90.0%) | 38 (10.0%) |
| 19 to 25 Years | 53 (81.5%) | 12 (18.5%) |
| 26 to 34 Years | 143 (74.1%) | 50 (25.9%) |
| 35 to 44 Years | 277 (95.9%) | 12 (4.2%) |
| 45 to 54 Years | 82 (84.5%) | 15 (15.5%) |
| 55 to 64 Years | 36 (69.2%) | 16 (30.8%) |
| 65 to 74 Years | 35 (100.0%) | 0 (0.0%) |
| 75 Years and older | 26 (100.0%) | 0 (0.0%) |
| Total | 1,099 (88.3%) | 145 (11.7%) |
Health Insurance Coverage by Citizenship Status in Carey
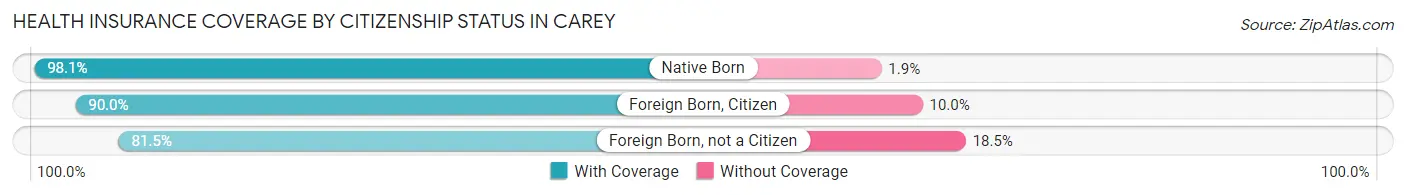
| Citizenship Status | With Coverage | Without Coverage |
| Native Born | 104 (98.1%) | 2 (1.9%) |
| Foreign Born, Citizen | 343 (90.0%) | 38 (10.0%) |
| Foreign Born, not a Citizen | 53 (81.5%) | 12 (18.5%) |
Health Insurance Coverage by Household Income in Carey
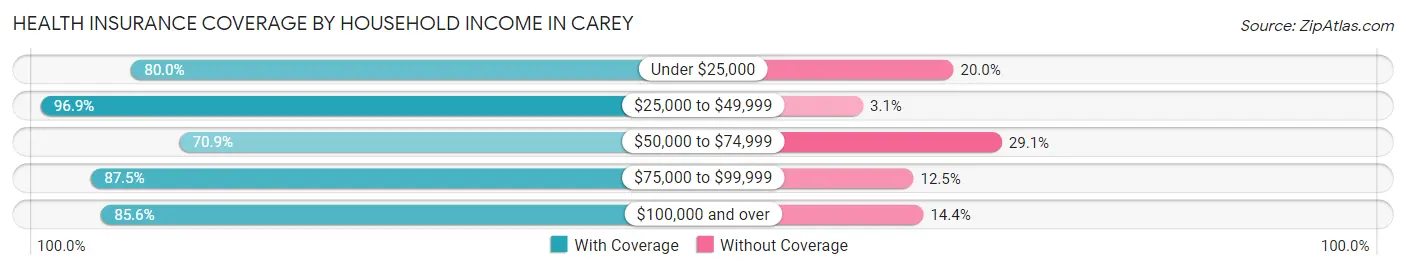
| Household Income | With Coverage | Without Coverage |
| Under $25,000 | 24 (80.0%) | 6 (20.0%) |
| $25,000 to $49,999 | 539 (96.9%) | 17 (3.1%) |
| $50,000 to $74,999 | 144 (70.9%) | 59 (29.1%) |
| $75,000 to $99,999 | 112 (87.5%) | 16 (12.5%) |
| $100,000 and over | 280 (85.6%) | 47 (14.4%) |
Public vs Private Health Insurance Coverage by Age in Carey
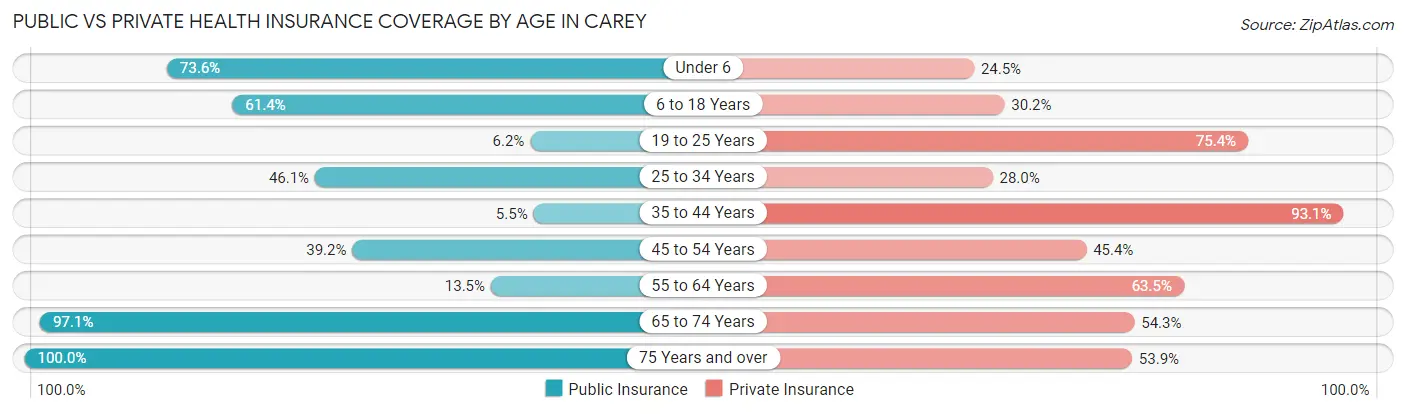
| Age Bracket | Public Insurance | Private Insurance |
| Under 6 | 78 (73.6%) | 26 (24.5%) |
| 6 to 18 Years | 234 (61.4%) | 115 (30.2%) |
| 19 to 25 Years | 4 (6.1%) | 49 (75.4%) |
| 25 to 34 Years | 89 (46.1%) | 54 (28.0%) |
| 35 to 44 Years | 16 (5.5%) | 269 (93.1%) |
| 45 to 54 Years | 38 (39.2%) | 44 (45.4%) |
| 55 to 64 Years | 7 (13.5%) | 33 (63.5%) |
| 65 to 74 Years | 34 (97.1%) | 19 (54.3%) |
| 75 Years and over | 26 (100.0%) | 14 (53.8%) |
| Total | 526 (42.3%) | 623 (50.1%) |
Disability Status by Sex by Age in Carey
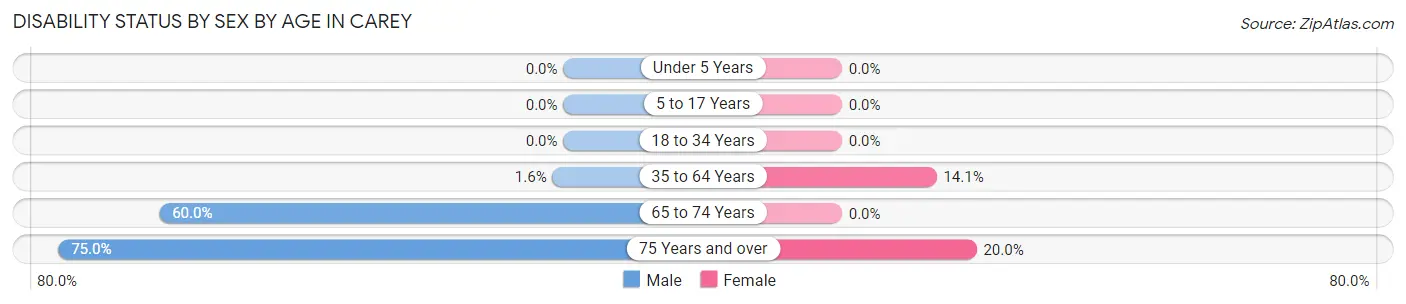
| Age Bracket | Male | Female |
| Under 5 Years | 0 (0.0%) | 0 (0.0%) |
| 5 to 17 Years | 0 (0.0%) | 0 (0.0%) |
| 18 to 34 Years | 0 (0.0%) | 0 (0.0%) |
| 35 to 64 Years | 5 (1.6%) | 18 (14.1%) |
| 65 to 74 Years | 18 (60.0%) | 0 (0.0%) |
| 75 Years and over | 12 (75.0%) | 2 (20.0%) |
Disability Class by Sex by Age in Carey
Disability Class: Hearing Difficulty
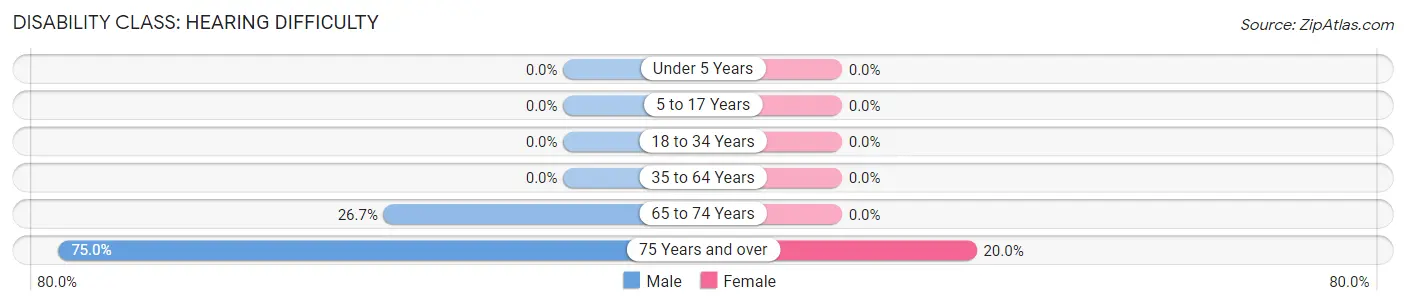
| Age Bracket | Male | Female |
| Under 5 Years | 0 (0.0%) | 0 (0.0%) |
| 5 to 17 Years | 0 (0.0%) | 0 (0.0%) |
| 18 to 34 Years | 0 (0.0%) | 0 (0.0%) |
| 35 to 64 Years | 0 (0.0%) | 0 (0.0%) |
| 65 to 74 Years | 8 (26.7%) | 0 (0.0%) |
| 75 Years and over | 12 (75.0%) | 2 (20.0%) |
Disability Class: Vision Difficulty
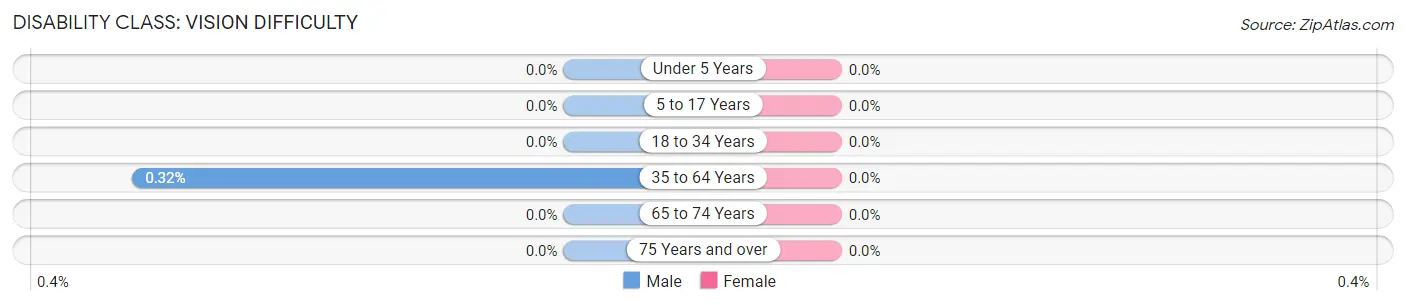
| Age Bracket | Male | Female |
| Under 5 Years | 0 (0.0%) | 0 (0.0%) |
| 5 to 17 Years | 0 (0.0%) | 0 (0.0%) |
| 18 to 34 Years | 0 (0.0%) | 0 (0.0%) |
| 35 to 64 Years | 1 (0.3%) | 0 (0.0%) |
| 65 to 74 Years | 0 (0.0%) | 0 (0.0%) |
| 75 Years and over | 0 (0.0%) | 0 (0.0%) |
Disability Class: Cognitive Difficulty
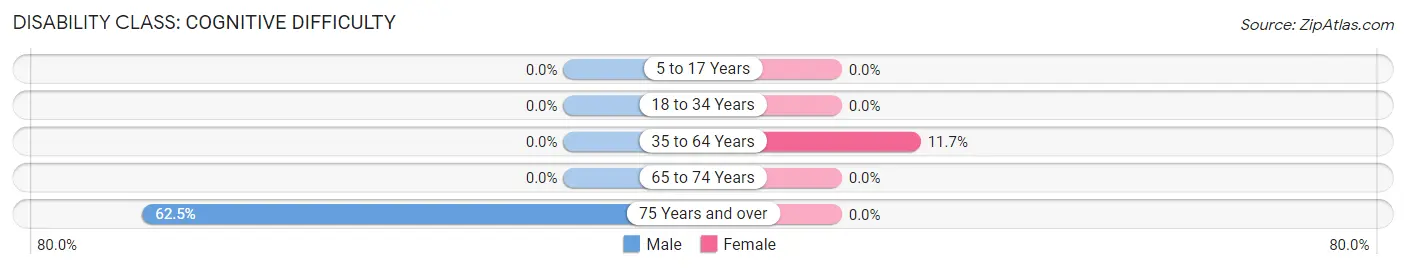
| Age Bracket | Male | Female |
| 5 to 17 Years | 0 (0.0%) | 0 (0.0%) |
| 18 to 34 Years | 0 (0.0%) | 0 (0.0%) |
| 35 to 64 Years | 0 (0.0%) | 15 (11.7%) |
| 65 to 74 Years | 0 (0.0%) | 0 (0.0%) |
| 75 Years and over | 10 (62.5%) | 0 (0.0%) |
Disability Class: Ambulatory Difficulty
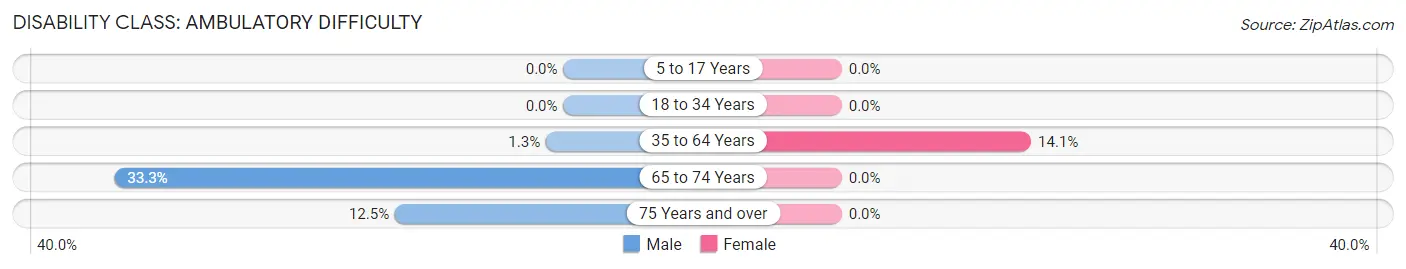
| Age Bracket | Male | Female |
| 5 to 17 Years | 0 (0.0%) | 0 (0.0%) |
| 18 to 34 Years | 0 (0.0%) | 0 (0.0%) |
| 35 to 64 Years | 4 (1.3%) | 18 (14.1%) |
| 65 to 74 Years | 10 (33.3%) | 0 (0.0%) |
| 75 Years and over | 2 (12.5%) | 0 (0.0%) |
Disability Class: Self-Care Difficulty
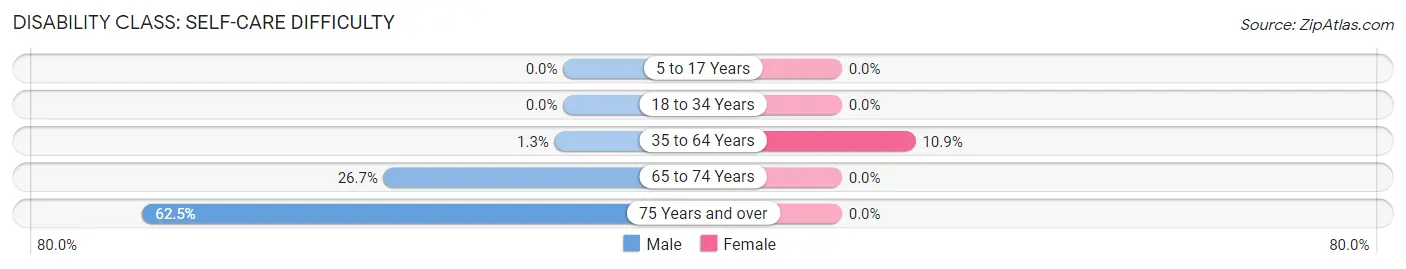
| Age Bracket | Male | Female |
| 5 to 17 Years | 0 (0.0%) | 0 (0.0%) |
| 18 to 34 Years | 0 (0.0%) | 0 (0.0%) |
| 35 to 64 Years | 4 (1.3%) | 14 (10.9%) |
| 65 to 74 Years | 8 (26.7%) | 0 (0.0%) |
| 75 Years and over | 10 (62.5%) | 0 (0.0%) |
Technology Access in Carey
Computing Device Access in Carey
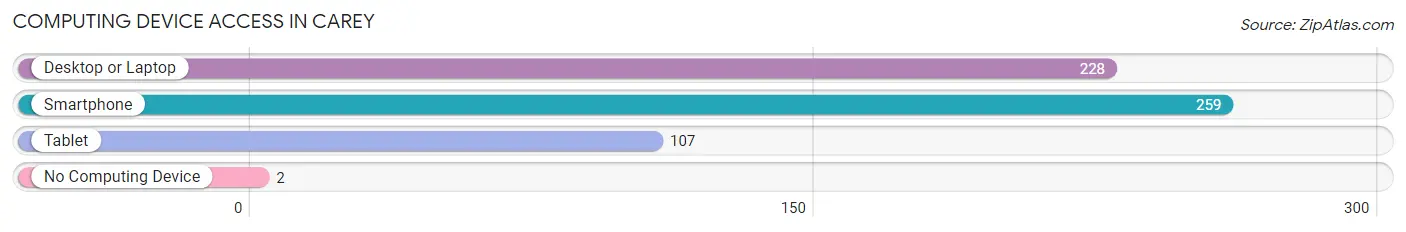
| Device Type | # Households | % Households |
| Desktop or Laptop | 228 | 86.4% |
| Smartphone | 259 | 98.1% |
| Tablet | 107 | 40.5% |
| No Computing Device | 2 | 0.8% |
| Total | 264 | 100.0% |
Internet Access in Carey
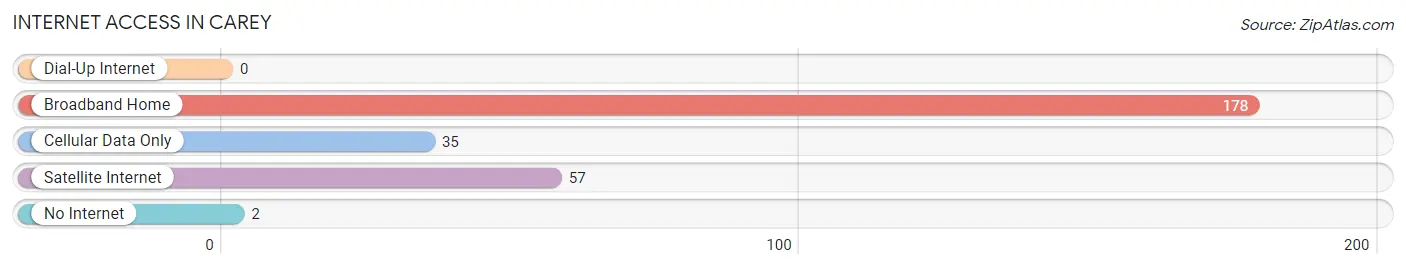
| Internet Type | # Households | % Households |
| Dial-Up Internet | 0 | 0.0% |
| Broadband Home | 178 | 67.4% |
| Cellular Data Only | 35 | 13.3% |
| Satellite Internet | 57 | 21.6% |
| No Internet | 2 | 0.8% |
| Total | 264 | 100.0% |
Carey Summary
Carey, Idaho is a small city located in Blaine County in the south-central part of the state. It is situated in the Wood River Valley, about 20 miles south of the city of Hailey. The city has a population of about 1,000 people and is the county seat of Blaine County.
History
Carey was founded in 1883 by a group of settlers from the nearby town of Hailey. The settlers were looking for a place to settle and farm, and they chose the area around Carey because of its fertile soil and abundant water. The town was named after William Carey, a local rancher who had been instrumental in helping the settlers find the area.
The town grew quickly, and by the early 1900s, it had become a thriving agricultural center. The town was home to several businesses, including a bank, a hotel, a general store, and a post office. The town also had a school, a church, and a newspaper.
In the early 1900s, Carey was also home to a large number of sheep and cattle ranches. The town was a major center for the wool industry, and it was home to several large wool warehouses.
Geography
Carey is located in the Wood River Valley, which is part of the larger Snake River Plain. The city is situated at an elevation of 5,000 feet, and it is surrounded by the Sawtooth Mountains to the east and the White Cloud Mountains to the west. The city is located about 20 miles south of the city of Hailey, and it is about 40 miles north of the city of Twin Falls.
The climate in Carey is semi-arid, with hot summers and cold winters. The average annual temperature is about 50 degrees Fahrenheit, and the average annual precipitation is about 12 inches.
Economy
The economy of Carey is largely based on agriculture. The city is home to several large farms and ranches, and it is a major center for the production of wool and other agricultural products. The city is also home to several businesses, including a bank, a hotel, a general store, and a post office.
Demographics
As of the 2010 census, the population of Carey was 1,000 people. The racial makeup of the city was 95.2% White, 0.7% Native American, 0.3% Asian, 0.1% Pacific Islander, 0.1% from other races, and 3.7% from two or more races. The median household income in Carey was $37,500, and the median family income was $45,000. The per capita income in Carey was $19,000.
Common Questions
What is the Total Population of Carey?
Total Population of Carey is 1,244.
What is the Total Male Population of Carey?
Total Male Population of Carey is 700.
What is the Total Female Population of Carey?
Total Female Population of Carey is 544.
What is the Ratio of Males per 100 Females in Carey?
There are 128.68 Males per 100 Females in Carey.
What is the Ratio of Females per 100 Males in Carey?
There are 77.71 Females per 100 Males in Carey.
What is the Median Population Age in Carey?
Median Population Age in Carey is 30.0 Years.
What is the Average Family Size in Carey
Average Family Size in Carey is 4.8 People.
What is the Average Household Size in Carey
Average Household Size in Carey is 4.7 People.
What is Per Capita Income in Carey?
Per Capita income in Carey is $21,921.
What is the Median Family Income in Carey?
Median Family Income in Carey is $45,469.
What is the Median Household income in Carey?
Median Household Income in Carey is $50,000.
What is Income or Wage Gap in Carey?
Income or Wage Gap in Carey is 9.9%.
Women in Carey earn 90.1 cents for every dollar earned by a man.
What is Family Income Deficit in Carey?
Family Income Deficit in Carey is $5,556.
Families that are below poverty line in Carey earn $5,556 less on average than the poverty threshold level.
What is Inequality or Gini Index in Carey?
Inequality or Gini Index in Carey is 0.35.
How Large is the Labor Force in Carey?
There are 541 People in the Labor Forcein in Carey.
What is the Percentage of People in the Labor Force in Carey?
65.7% of People are in the Labor Force in Carey.
What is the Unemployment Rate in Carey?
Unemployment Rate in Carey is 4.6%.