Grace, ID
Grace Map
Grace Overview
1,413
TOTAL POPULATION
853
MALE POPULATION
560
FEMALE POPULATION
152.32
MALES / 100 FEMALES
65.65
FEMALES / 100 MALES
35.8
MEDIAN AGE
4.2
AVG FAMILY SIZE
3.5
AVG HOUSEHOLD SIZE
$30,410
PER CAPITA INCOME
$76,818
AVG FAMILY INCOME
$69,858
AVG HOUSEHOLD INCOME
66.3%
WAGE / INCOME GAP [ % ]
33.7¢/ $1
WAGE / INCOME GAP [ $ ]
$8,717
FAMILY INCOME DEFICIT
0.33
INEQUALITY / GINI INDEX
705
LABOR FORCE [ PEOPLE ]
64.0%
PERCENT IN LABOR FORCE
2.6%
UNEMPLOYMENT RATE
Grace Zip Codes
Grace Area Codes
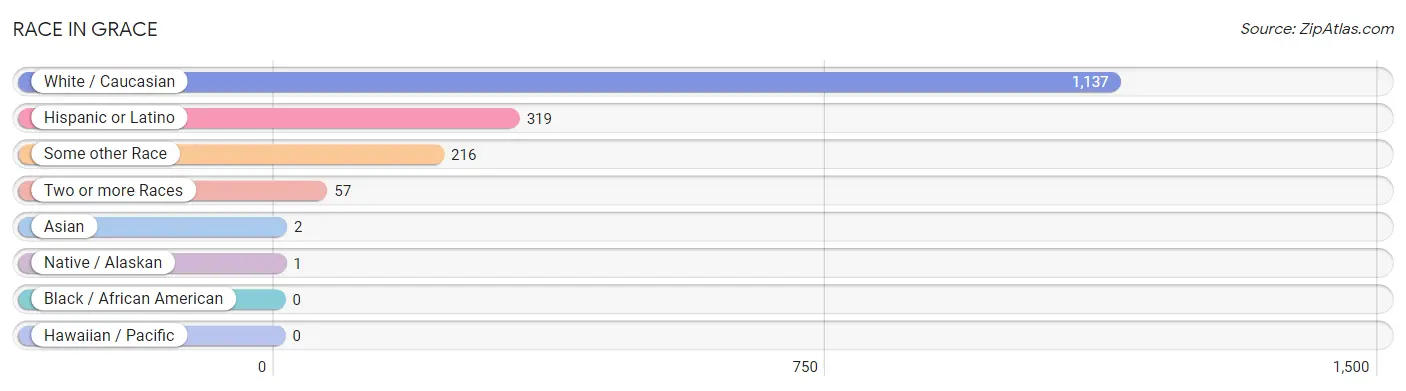
Race in Grace
The most populous races in Grace are White / Caucasian (1,137 | 80.5%), Hispanic or Latino (319 | 22.6%), and Some other Race (216 | 15.3%).
| Race | # Population | % Population |
| Asian | 2 | 0.1% |
| Black / African American | 0 | 0.0% |
| Hawaiian / Pacific | 0 | 0.0% |
| Hispanic or Latino | 319 | 22.6% |
| Native / Alaskan | 1 | 0.1% |
| White / Caucasian | 1,137 | 80.5% |
| Two or more Races | 57 | 4.0% |
| Some other Race | 216 | 15.3% |
| Total | 1,413 | 100.0% |
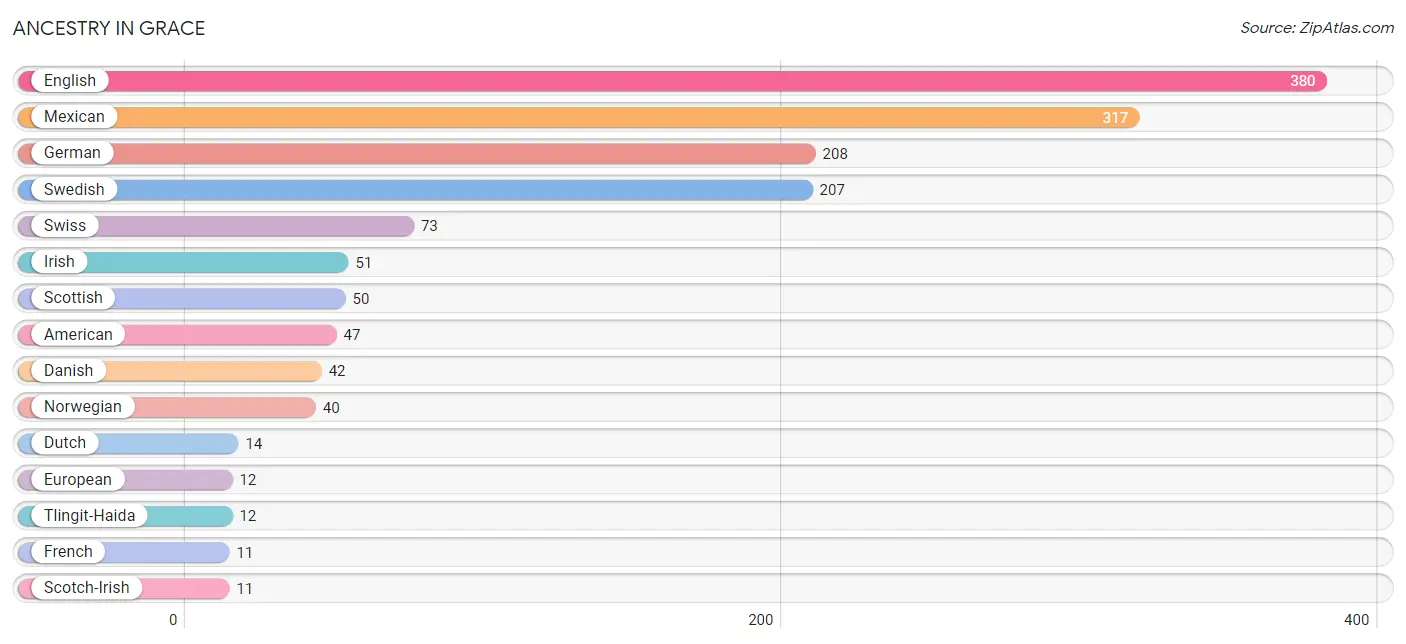
Ancestry in Grace
The most populous ancestries reported in Grace are English (380 | 26.9%), Mexican (317 | 22.4%), German (208 | 14.7%), Swedish (207 | 14.6%), and Swiss (73 | 5.2%), together accounting for 83.9% of all Grace residents.
| Ancestry | # Population | % Population |
| American | 47 | 3.3% |
| Choctaw | 1 | 0.1% |
| Danish | 42 | 3.0% |
| Dutch | 14 | 1.0% |
| Eastern European | 2 | 0.1% |
| English | 380 | 26.9% |
| European | 12 | 0.9% |
| French | 11 | 0.8% |
| German | 208 | 14.7% |
| Irish | 51 | 3.6% |
| Italian | 10 | 0.7% |
| Korean | 2 | 0.1% |
| Mexican | 317 | 22.4% |
| Northern European | 10 | 0.7% |
| Norwegian | 40 | 2.8% |
| Polish | 2 | 0.1% |
| Romanian | 1 | 0.1% |
| Scotch-Irish | 11 | 0.8% |
| Scottish | 50 | 3.5% |
| Swedish | 207 | 14.6% |
| Swiss | 73 | 5.2% |
| Tlingit-Haida | 12 | 0.9% |
| Welsh | 5 | 0.4% | View All 23 Rows |
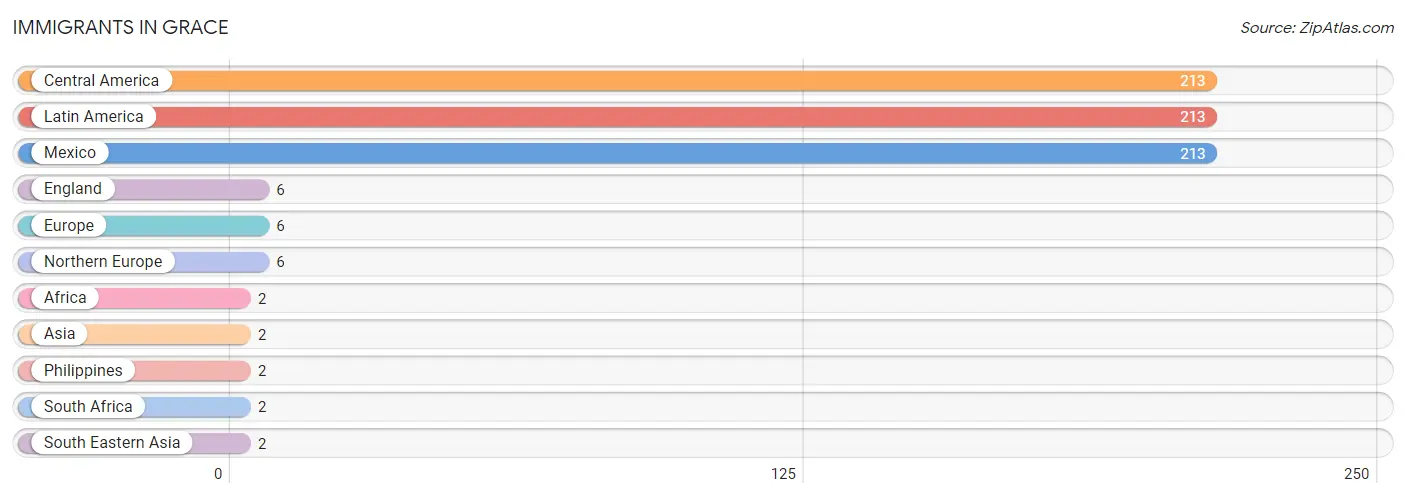
Immigrants in Grace
The most numerous immigrant groups reported in Grace came from Central America (213 | 15.1%), Latin America (213 | 15.1%), Mexico (213 | 15.1%), England (6 | 0.4%), and Europe (6 | 0.4%), together accounting for 46.0% of all Grace residents.
| Immigration Origin | # Population | % Population |
| Africa | 2 | 0.1% |
| Asia | 2 | 0.1% |
| Central America | 213 | 15.1% |
| England | 6 | 0.4% |
| Europe | 6 | 0.4% |
| Latin America | 213 | 15.1% |
| Mexico | 213 | 15.1% |
| Northern Europe | 6 | 0.4% |
| Philippines | 2 | 0.1% |
| South Africa | 2 | 0.1% |
| South Eastern Asia | 2 | 0.1% | View All 11 Rows |
Sex and Age in Grace
Sex and Age in Grace
The most populous age groups in Grace are 15 to 19 Years (171 | 20.1%) for men and 40 to 44 Years (58 | 10.4%) for women.
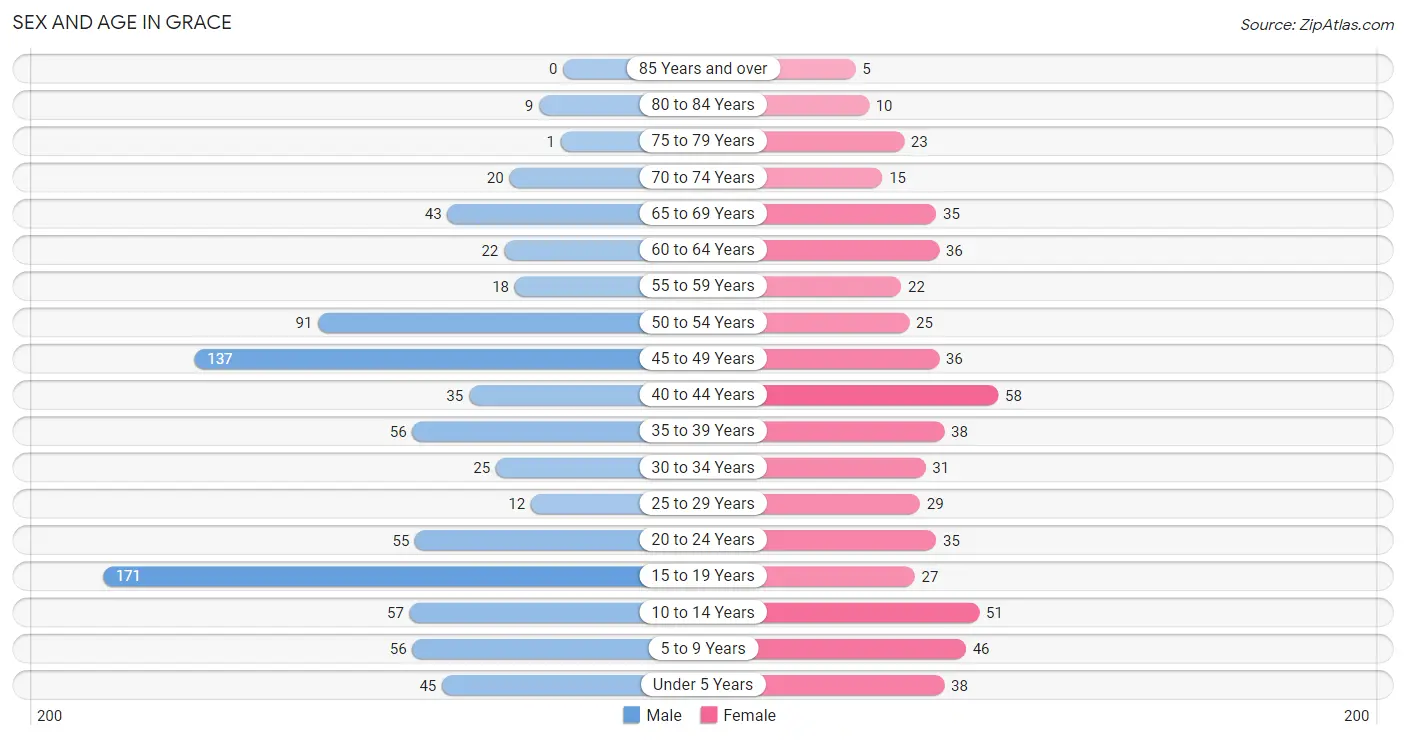
| Age Bracket | Male | Female |
| Under 5 Years | 45 (5.3%) | 38 (6.8%) |
| 5 to 9 Years | 56 (6.6%) | 46 (8.2%) |
| 10 to 14 Years | 57 (6.7%) | 51 (9.1%) |
| 15 to 19 Years | 171 (20.1%) | 27 (4.8%) |
| 20 to 24 Years | 55 (6.5%) | 35 (6.2%) |
| 25 to 29 Years | 12 (1.4%) | 29 (5.2%) |
| 30 to 34 Years | 25 (2.9%) | 31 (5.5%) |
| 35 to 39 Years | 56 (6.6%) | 38 (6.8%) |
| 40 to 44 Years | 35 (4.1%) | 58 (10.4%) |
| 45 to 49 Years | 137 (16.1%) | 36 (6.4%) |
| 50 to 54 Years | 91 (10.7%) | 25 (4.5%) |
| 55 to 59 Years | 18 (2.1%) | 22 (3.9%) |
| 60 to 64 Years | 22 (2.6%) | 36 (6.4%) |
| 65 to 69 Years | 43 (5.0%) | 35 (6.2%) |
| 70 to 74 Years | 20 (2.3%) | 15 (2.7%) |
| 75 to 79 Years | 1 (0.1%) | 23 (4.1%) |
| 80 to 84 Years | 9 (1.1%) | 10 (1.8%) |
| 85 Years and over | 0 (0.0%) | 5 (0.9%) |
| Total | 853 (100.0%) | 560 (100.0%) |
Families and Households in Grace
Median Family Size in Grace
The median family size in Grace is 4.18 persons per family, with single male/father families (7 | 2.3%) accounting for the largest median family size of 5.57 persons per family. On the other hand, single female/mother families (14 | 4.6%) represent the smallest median family size with 2.64 persons per family.
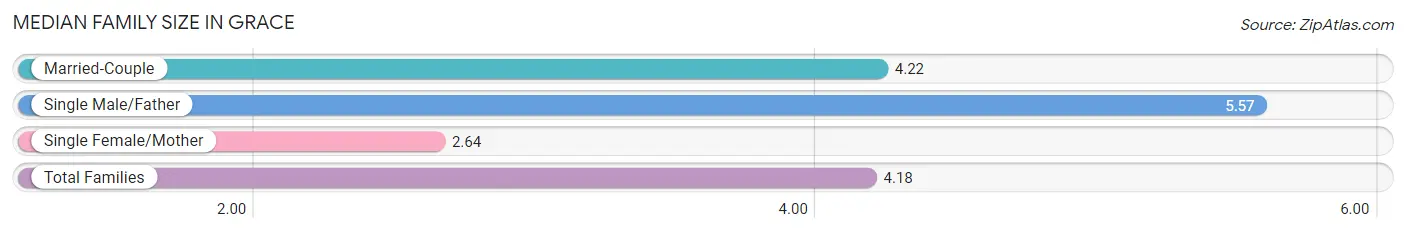
| Family Type | # Families | Family Size |
| Married-Couple | 285 (93.1%) | 4.22 |
| Single Male/Father | 7 (2.3%) | 5.57 |
| Single Female/Mother | 14 (4.6%) | 2.64 |
| Total Families | 306 (100.0%) | 4.18 |
Median Household Size in Grace
The median household size in Grace is 3.47 persons per household, with single male/father households (7 | 1.7%) accounting for the largest median household size of 8.29 persons per household. non-family households (101 | 24.8%) represent the smallest median household size with 1.01 persons per household.
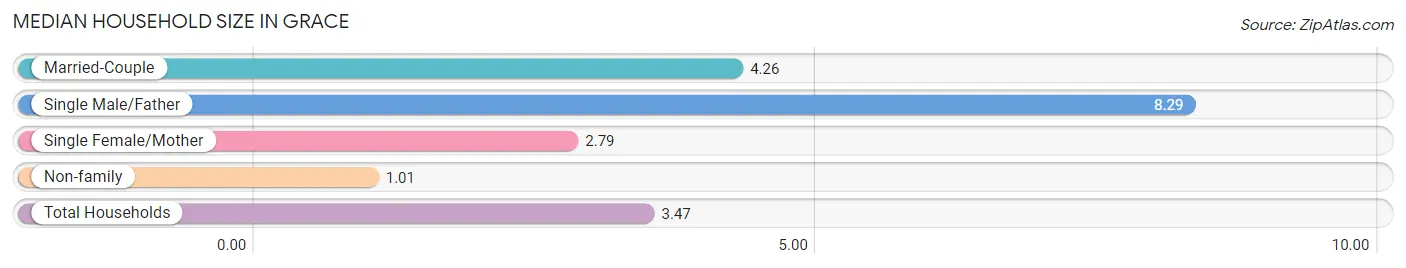
| Household Type | # Households | Household Size |
| Married-Couple | 285 (70.0%) | 4.26 |
| Single Male/Father | 7 (1.7%) | 8.29 |
| Single Female/Mother | 14 (3.4%) | 2.79 |
| Non-family | 101 (24.8%) | 1.01 |
| Total Households | 407 (100.0%) | 3.47 |
Household Size by Marriage Status in Grace
Out of a total of 407 households in Grace, 306 (75.2%) are family households, while 101 (24.8%) are nonfamily households. The most numerous type of family households are 2-person households, comprising 115, and the most common type of nonfamily households are 1-person households, comprising 100.
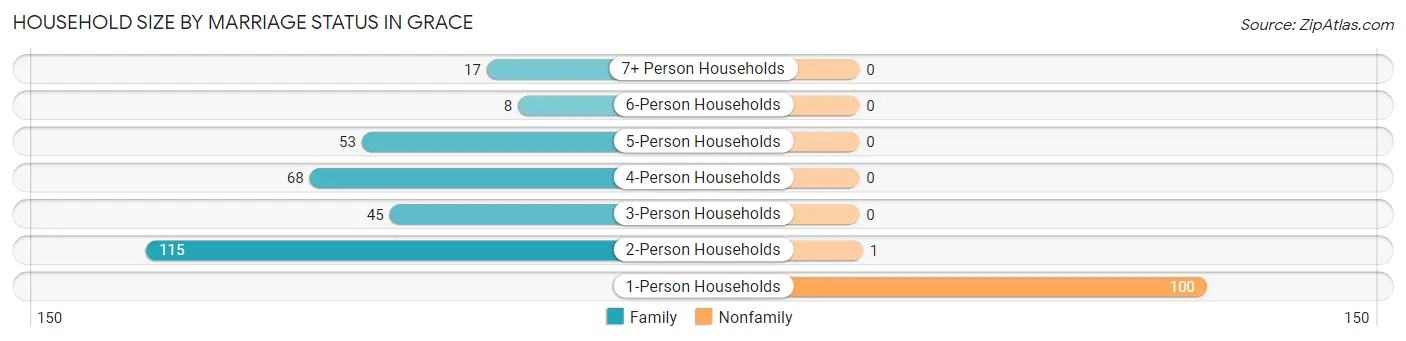
| Household Size | Family Households | Nonfamily Households |
| 1-Person Households | - | 100 (24.6%) |
| 2-Person Households | 115 (28.3%) | 1 (0.3%) |
| 3-Person Households | 45 (11.1%) | 0 (0.0%) |
| 4-Person Households | 68 (16.7%) | 0 (0.0%) |
| 5-Person Households | 53 (13.0%) | 0 (0.0%) |
| 6-Person Households | 8 (2.0%) | 0 (0.0%) |
| 7+ Person Households | 17 (4.2%) | 0 (0.0%) |
| Total | 306 (75.2%) | 101 (24.8%) |
Female Fertility in Grace
Fertility by Age in Grace
Average fertility rate in Grace is 112.0 births per 1,000 women. Women in the age bracket of 20 to 34 years have the highest fertility rate with 242.0 births per 1,000 women. Women in the age bracket of 20 to 34 years acount for 79.3% of all women with births.
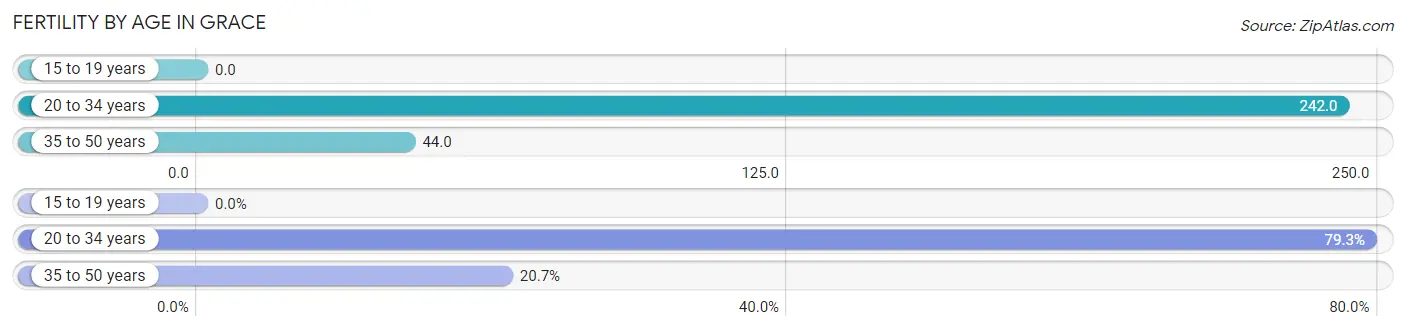
| Age Bracket | Women with Births | Births / 1,000 Women |
| 15 to 19 years | 0 (0.0%) | 0.0 |
| 20 to 34 years | 23 (79.3%) | 242.0 |
| 35 to 50 years | 6 (20.7%) | 44.0 |
| Total | 29 (100.0%) | 112.0 |
Fertility by Age by Marriage Status in Grace
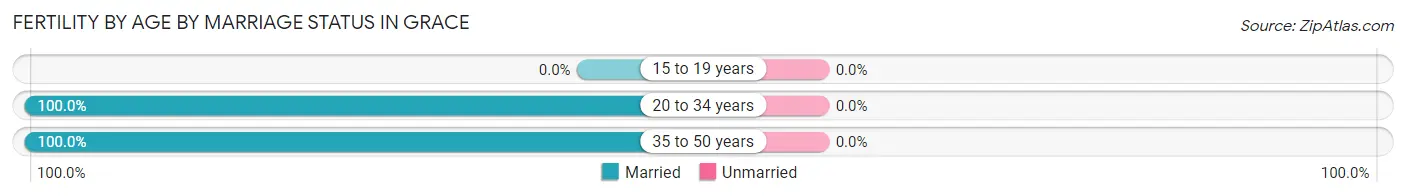
| Age Bracket | Married | Unmarried |
| 15 to 19 years | 0 (0.0%) | 0 (0.0%) |
| 20 to 34 years | 23 (100.0%) | 0 (0.0%) |
| 35 to 50 years | 6 (100.0%) | 0 (0.0%) |
| Total | 29 (100.0%) | 0 (0.0%) |
Fertility by Education in Grace
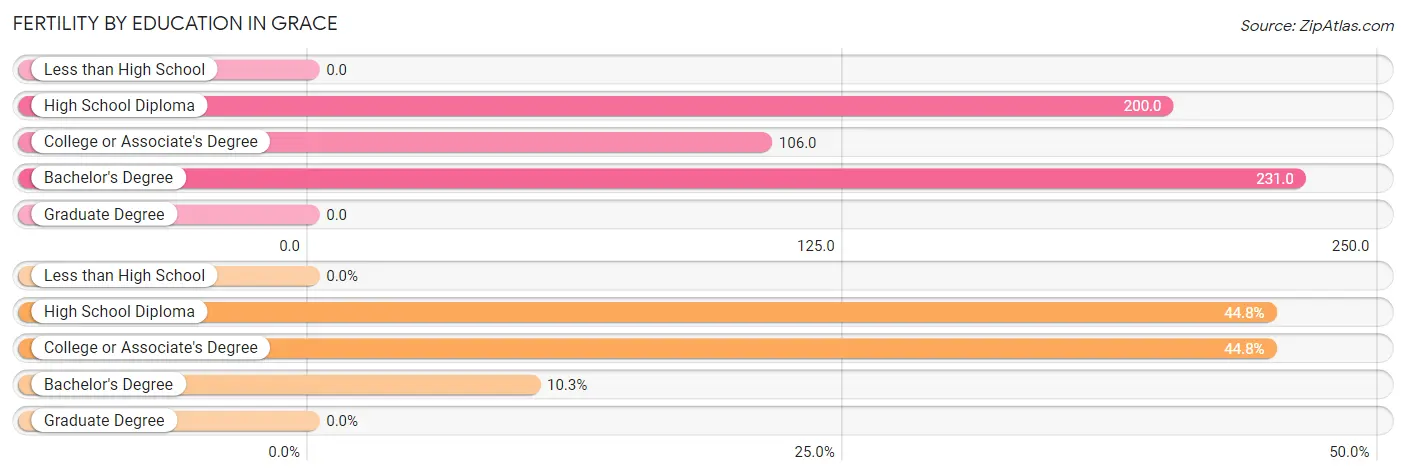
| Educational Attainment | Women with Births | Births / 1,000 Women |
| Less than High School | 0 (0.0%) | 0.0 |
| High School Diploma | 13 (44.8%) | 200.0 |
| College or Associate's Degree | 13 (44.8%) | 106.0 |
| Bachelor's Degree | 3 (10.3%) | 231.0 |
| Graduate Degree | 0 (0.0%) | 0.0 |
| Total | 29 (100.0%) | 112.0 |
Fertility by Education by Marriage Status in Grace
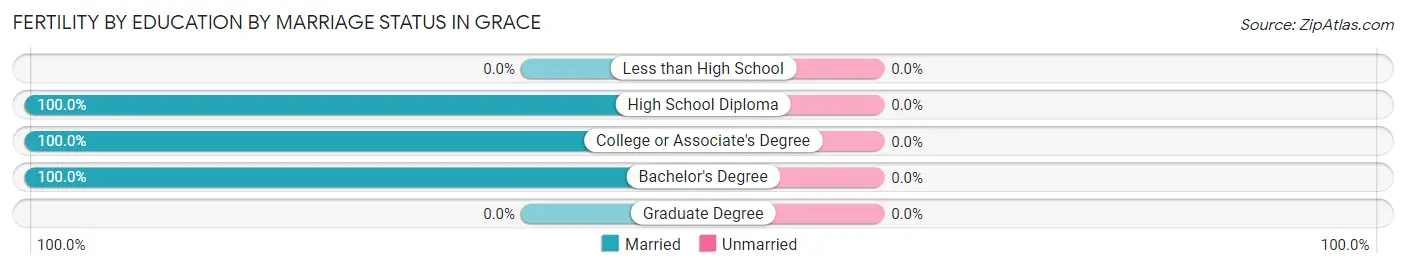
| Educational Attainment | Married | Unmarried |
| Less than High School | 0 (0.0%) | 0 (0.0%) |
| High School Diploma | 13 (100.0%) | 0 (0.0%) |
| College or Associate's Degree | 13 (100.0%) | 0 (0.0%) |
| Bachelor's Degree | 3 (100.0%) | 0 (0.0%) |
| Graduate Degree | 0 (0.0%) | 0 (0.0%) |
| Total | 29 (100.0%) | 0 (0.0%) |
Income in Grace
Income Overview in Grace
Per Capita Income in Grace is $30,410, while median incomes of families and households are $76,818 and $69,858 respectively.
| Characteristic | Number | Measure |
| Per Capita Income | 1,413 | $30,410 |
| Median Family Income | 306 | $76,818 |
| Mean Family Income | 306 | $94,887 |
| Median Household Income | 407 | $69,858 |
| Mean Household Income | 407 | $85,507 |
| Income Deficit | 306 | $8,717 |
| Wage / Income Gap (%) | 1,413 | 66.32% |
| Wage / Income Gap ($) | 1,413 | 33.68¢ per $1 |
| Gini / Inequality Index | 1,413 | 0.33 |
Earnings by Sex in Grace
Average Earnings in Grace are $27,788, $45,526 for men and $15,331 for women, a difference of 66.3%.
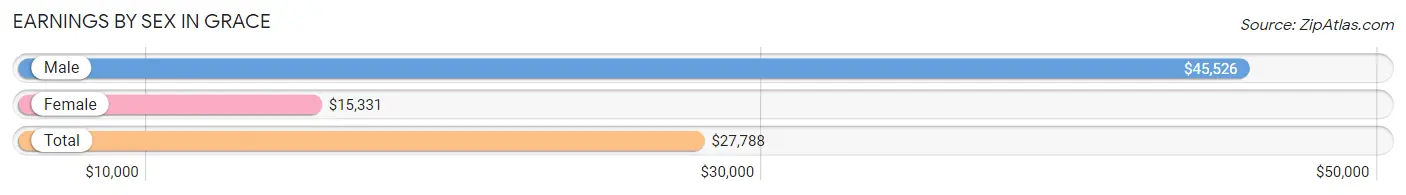
| Sex | Number | Average Earnings |
| Male | 596 (68.3%) | $45,526 |
| Female | 277 (31.7%) | $15,331 |
| Total | 873 (100.0%) | $27,788 |
Earnings by Sex by Income Bracket in Grace
The most common earnings brackets in Grace are $65,000 to $74,999 for men (118 | 19.8%) and $5,000 to $7,499 for women (48 | 17.3%).
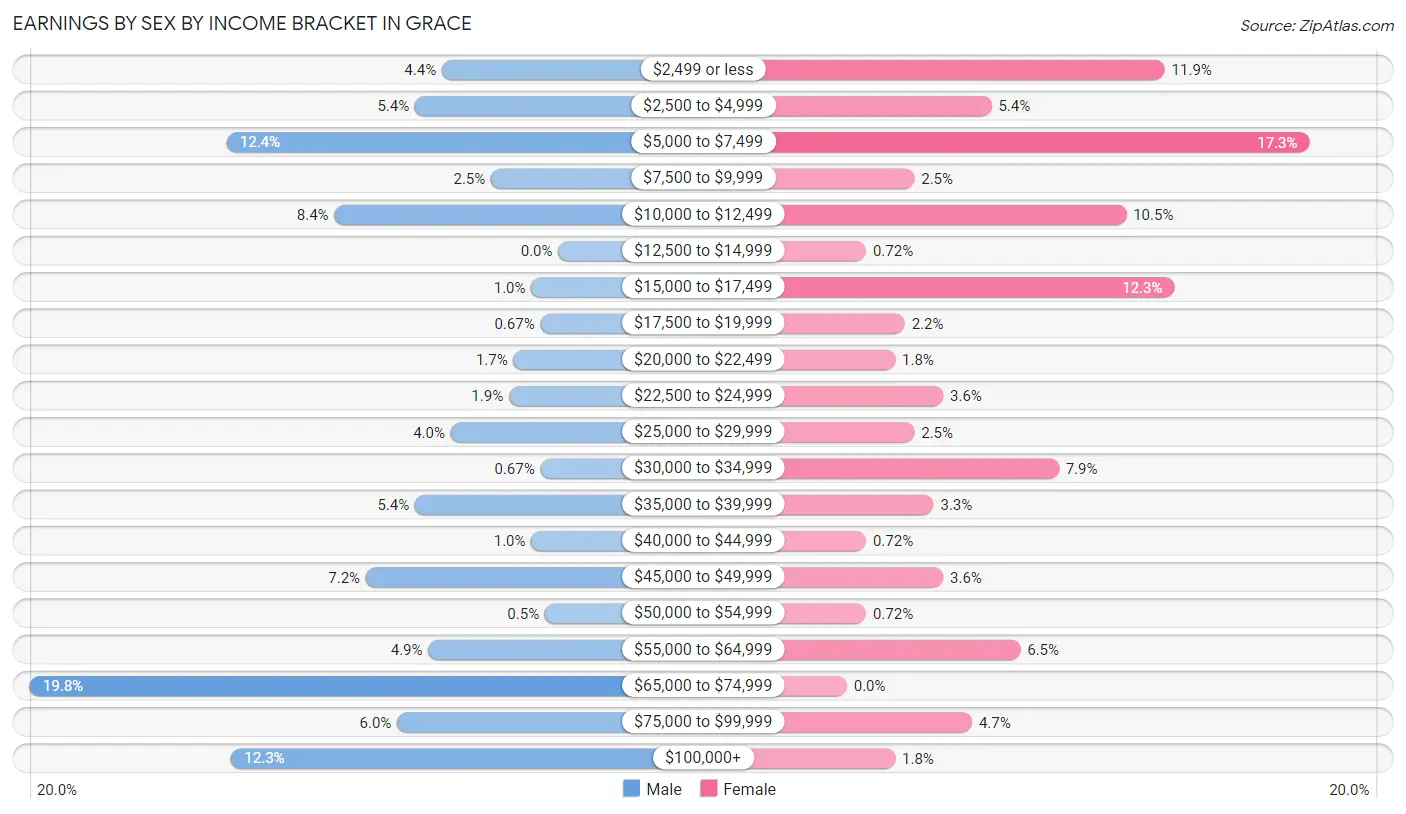
| Income | Male | Female |
| $2,499 or less | 26 (4.4%) | 33 (11.9%) |
| $2,500 to $4,999 | 32 (5.4%) | 15 (5.4%) |
| $5,000 to $7,499 | 74 (12.4%) | 48 (17.3%) |
| $7,500 to $9,999 | 15 (2.5%) | 7 (2.5%) |
| $10,000 to $12,499 | 50 (8.4%) | 29 (10.5%) |
| $12,500 to $14,999 | 0 (0.0%) | 2 (0.7%) |
| $15,000 to $17,499 | 6 (1.0%) | 34 (12.3%) |
| $17,500 to $19,999 | 4 (0.7%) | 6 (2.2%) |
| $20,000 to $22,499 | 10 (1.7%) | 5 (1.8%) |
| $22,500 to $24,999 | 11 (1.8%) | 10 (3.6%) |
| $25,000 to $29,999 | 24 (4.0%) | 7 (2.5%) |
| $30,000 to $34,999 | 4 (0.7%) | 22 (7.9%) |
| $35,000 to $39,999 | 32 (5.4%) | 9 (3.3%) |
| $40,000 to $44,999 | 6 (1.0%) | 2 (0.7%) |
| $45,000 to $49,999 | 43 (7.2%) | 10 (3.6%) |
| $50,000 to $54,999 | 3 (0.5%) | 2 (0.7%) |
| $55,000 to $64,999 | 29 (4.9%) | 18 (6.5%) |
| $65,000 to $74,999 | 118 (19.8%) | 0 (0.0%) |
| $75,000 to $99,999 | 36 (6.0%) | 13 (4.7%) |
| $100,000+ | 73 (12.2%) | 5 (1.8%) |
| Total | 596 (100.0%) | 277 (100.0%) |
Earnings by Sex by Educational Attainment in Grace
Average earnings in Grace are $67,844 for men and $16,801 for women, a difference of 75.2%. Men with an educational attainment of high school diploma enjoy the highest average annual earnings of $68,681, while those with college or associate's degree education earn the least with $46,346. Women with an educational attainment of bachelor's degree earn the most with the average annual earnings of $24,375, while those with less than high school education have the smallest earnings of $2,499.
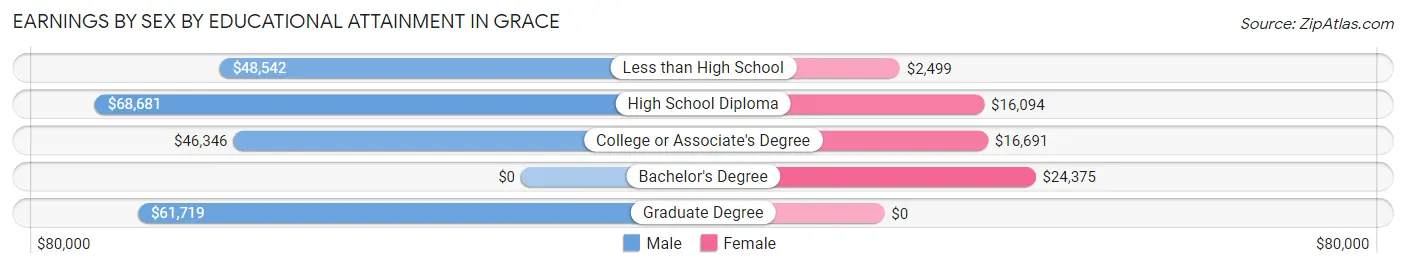
| Educational Attainment | Male Income | Female Income |
| Less than High School | $48,542 | $2,499 |
| High School Diploma | $68,681 | $16,094 |
| College or Associate's Degree | $46,346 | $16,691 |
| Bachelor's Degree | - | - |
| Graduate Degree | $61,719 | $0 |
| Total | $67,844 | $16,801 |
Family Income in Grace
Family Income Brackets in Grace
According to the Grace family income data, there are 92 families falling into the $50,000 to $74,999 income range, which is the most common income bracket and makes up 30.1% of all families.

| Income Bracket | # Families | % Families |
| Less than $10,000 | 1 | 0.3% |
| $10,000 to $14,999 | 1 | 0.3% |
| $15,000 to $24,999 | 0 | 0.0% |
| $25,000 to $34,999 | 17 | 5.6% |
| $35,000 to $49,999 | 34 | 11.1% |
| $50,000 to $74,999 | 92 | 30.1% |
| $75,000 to $99,999 | 48 | 15.7% |
| $100,000 to $149,999 | 82 | 26.8% |
| $150,000 to $199,999 | 23 | 7.5% |
| $200,000+ | 8 | 2.6% |
Family Income by Famaliy Size in Grace
7+ person families (12 | 3.9%) account for the highest median family income in Grace with $197,857 per family, while 2-person families (121 | 39.5%) have the highest median income of $36,875 per family member.
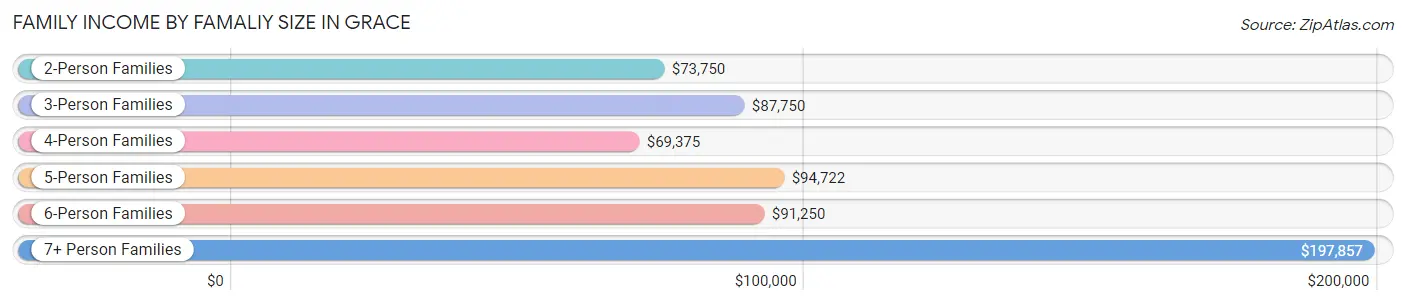
| Income Bracket | # Families | Median Income |
| 2-Person Families | 121 (39.5%) | $73,750 |
| 3-Person Families | 39 (12.8%) | $87,750 |
| 4-Person Families | 68 (22.2%) | $69,375 |
| 5-Person Families | 58 (19.0%) | $94,722 |
| 6-Person Families | 8 (2.6%) | $91,250 |
| 7+ Person Families | 12 (3.9%) | $197,857 |
| Total | 306 (100.0%) | $76,818 |
Family Income by Number of Earners in Grace
The median family income in Grace is $76,818, with families comprising 3+ earners (91) having the highest median family income of $93,750, while families with no earners (32) have the lowest median family income of $66,250, accounting for 29.7% and 10.5% of families, respectively.
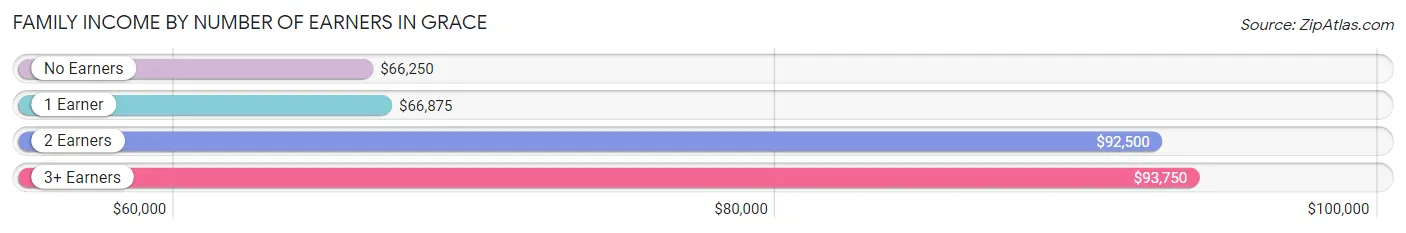
| Number of Earners | # Families | Median Income |
| No Earners | 32 (10.5%) | $66,250 |
| 1 Earner | 75 (24.5%) | $66,875 |
| 2 Earners | 108 (35.3%) | $92,500 |
| 3+ Earners | 91 (29.7%) | $93,750 |
| Total | 306 (100.0%) | $76,818 |
Household Income in Grace
Household Income Brackets in Grace
With 115 households falling in the category, the $50,000 to $74,999 income range is the most frequent in Grace, accounting for 28.3% of all households. In contrast, only 6 households (1.5%) fall into the $15,000 to $24,999 income bracket, making it the least populous group.
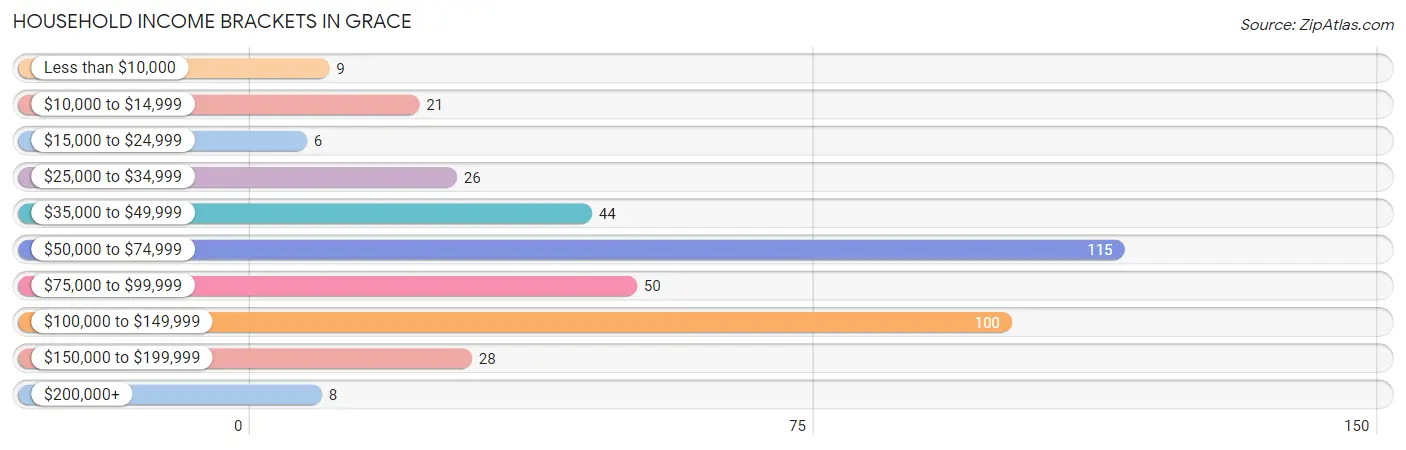
| Income Bracket | # Households | % Households |
| Less than $10,000 | 9 | 2.2% |
| $10,000 to $14,999 | 21 | 5.2% |
| $15,000 to $24,999 | 6 | 1.5% |
| $25,000 to $34,999 | 26 | 6.4% |
| $35,000 to $49,999 | 44 | 10.8% |
| $50,000 to $74,999 | 115 | 28.3% |
| $75,000 to $99,999 | 50 | 12.3% |
| $100,000 to $149,999 | 100 | 24.6% |
| $150,000 to $199,999 | 28 | 6.9% |
| $200,000+ | 8 | 2.0% |
Household Income by Householder Age in Grace
The median household income in Grace is $69,858, with the highest median household income of $146,250 found in the 15 to 24 years age bracket for the primary householder. A total of 10 households (2.5%) fall into this category. Meanwhile, the 65+ years age bracket for the primary householder has the lowest median household income of $65,333, with 102 households (25.1%) in this group.
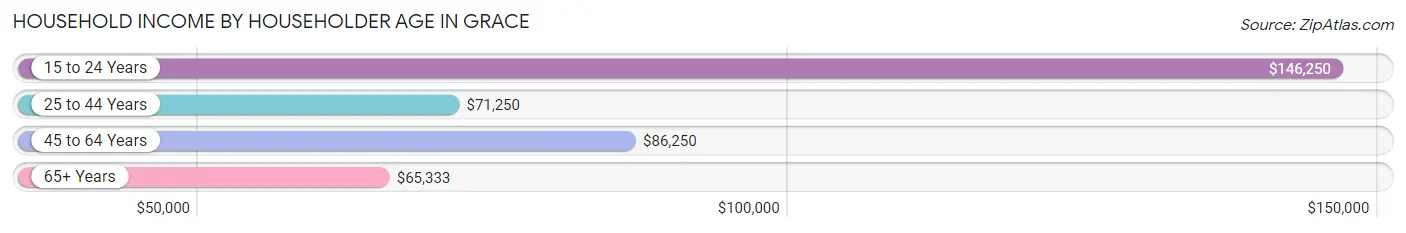
| Income Bracket | # Households | Median Income |
| 15 to 24 Years | 10 (2.5%) | $146,250 |
| 25 to 44 Years | 137 (33.7%) | $71,250 |
| 45 to 64 Years | 158 (38.8%) | $86,250 |
| 65+ Years | 102 (25.1%) | $65,333 |
| Total | 407 (100.0%) | $69,858 |
Poverty in Grace
Income Below Poverty by Sex and Age in Grace
With 3.3% poverty level for males and 5.3% for females among the residents of Grace, 18 to 24 year old males and 25 to 34 year old females are the most vulnerable to poverty, with 10 males (12.2%) and 14 females (23.3%) in their respective age groups living below the poverty level.
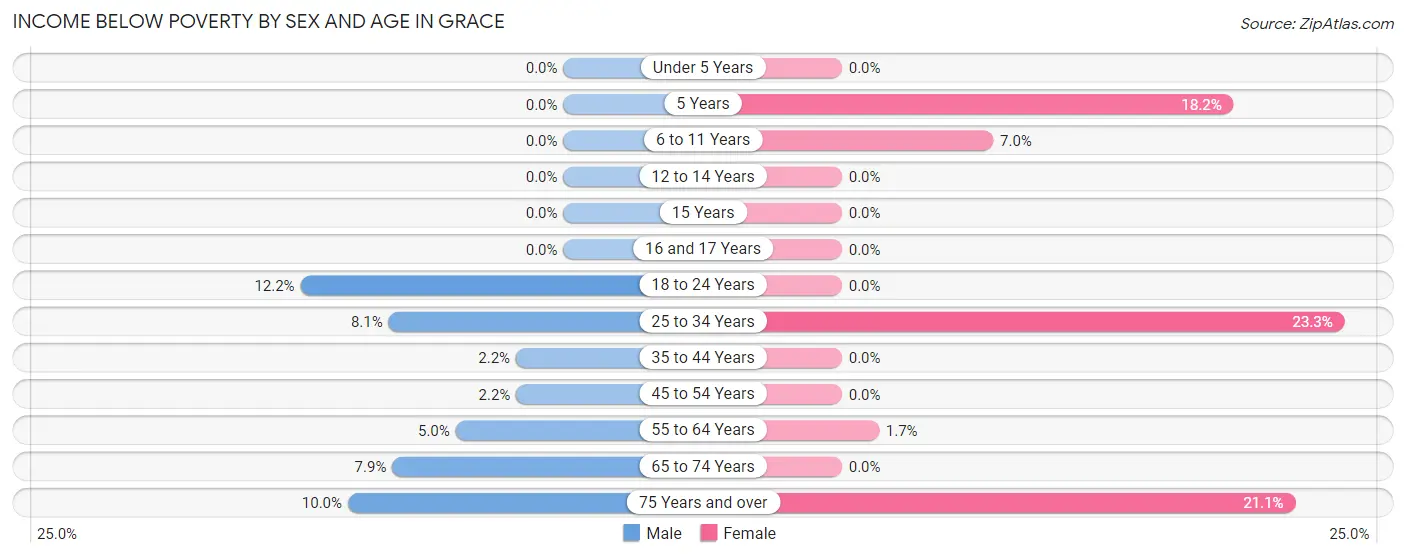
| Age Bracket | Male | Female |
| Under 5 Years | 0 (0.0%) | 0 (0.0%) |
| 5 Years | 0 (0.0%) | 2 (18.2%) |
| 6 to 11 Years | 0 (0.0%) | 4 (7.0%) |
| 12 to 14 Years | 0 (0.0%) | 0 (0.0%) |
| 15 Years | 0 (0.0%) | 0 (0.0%) |
| 16 and 17 Years | 0 (0.0%) | 0 (0.0%) |
| 18 to 24 Years | 10 (12.2%) | 0 (0.0%) |
| 25 to 34 Years | 3 (8.1%) | 14 (23.3%) |
| 35 to 44 Years | 2 (2.2%) | 0 (0.0%) |
| 45 to 54 Years | 5 (2.2%) | 0 (0.0%) |
| 55 to 64 Years | 2 (5.0%) | 1 (1.7%) |
| 65 to 74 Years | 5 (7.9%) | 0 (0.0%) |
| 75 Years and over | 1 (10.0%) | 8 (21.0%) |
| Total | 28 (3.3%) | 29 (5.3%) |
Income Above Poverty by Sex and Age in Grace
According to the poverty statistics in Grace, males aged under 5 years and females aged under 5 years are the age groups that are most secure financially, with 100.0% of males and 100.0% of females in these age groups living above the poverty line.
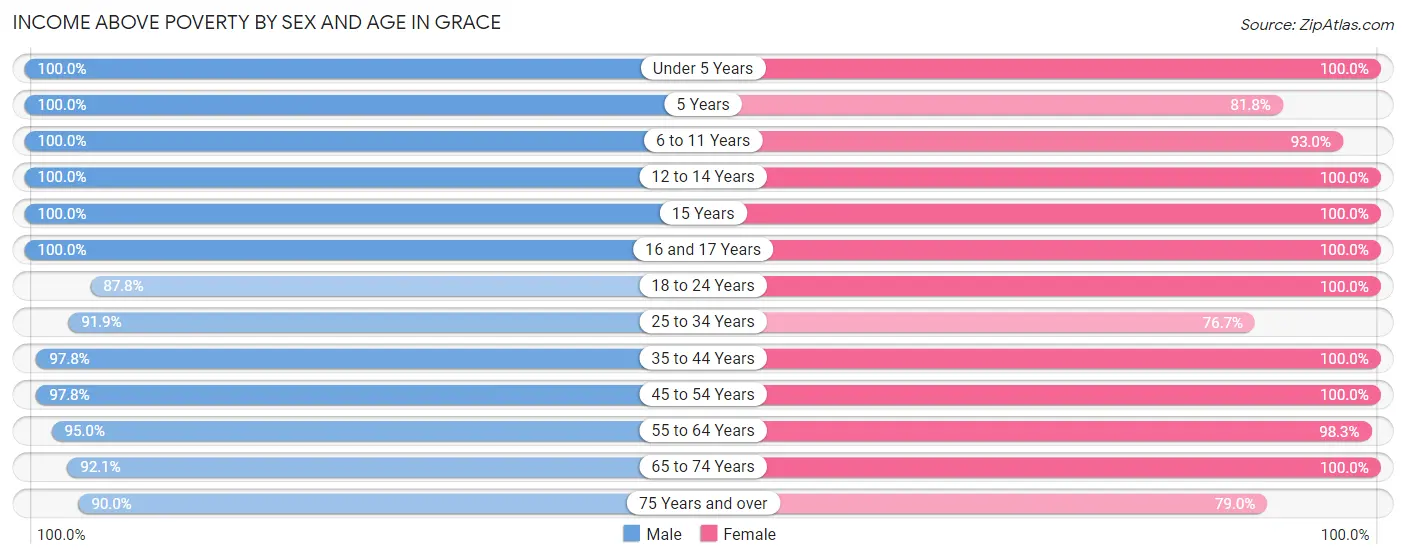
| Age Bracket | Male | Female |
| Under 5 Years | 45 (100.0%) | 32 (100.0%) |
| 5 Years | 20 (100.0%) | 9 (81.8%) |
| 6 to 11 Years | 49 (100.0%) | 53 (93.0%) |
| 12 to 14 Years | 44 (100.0%) | 22 (100.0%) |
| 15 Years | 9 (100.0%) | 9 (100.0%) |
| 16 and 17 Years | 135 (100.0%) | 15 (100.0%) |
| 18 to 24 Years | 72 (87.8%) | 38 (100.0%) |
| 25 to 34 Years | 34 (91.9%) | 46 (76.7%) |
| 35 to 44 Years | 89 (97.8%) | 96 (100.0%) |
| 45 to 54 Years | 223 (97.8%) | 61 (100.0%) |
| 55 to 64 Years | 38 (95.0%) | 57 (98.3%) |
| 65 to 74 Years | 58 (92.1%) | 50 (100.0%) |
| 75 Years and over | 9 (90.0%) | 30 (78.9%) |
| Total | 825 (96.7%) | 518 (94.7%) |
Income Below Poverty Among Married-Couple Families in Grace
The poverty statistics for married-couple families in Grace show that 2.1% or 6 of the total 285 families live below the poverty line. Families with 3 or 4 children have the highest poverty rate of 6.1%, comprising of 4 families. On the other hand, families with 1 or 2 children have the lowest poverty rate of 0.0%, which includes 0 families.
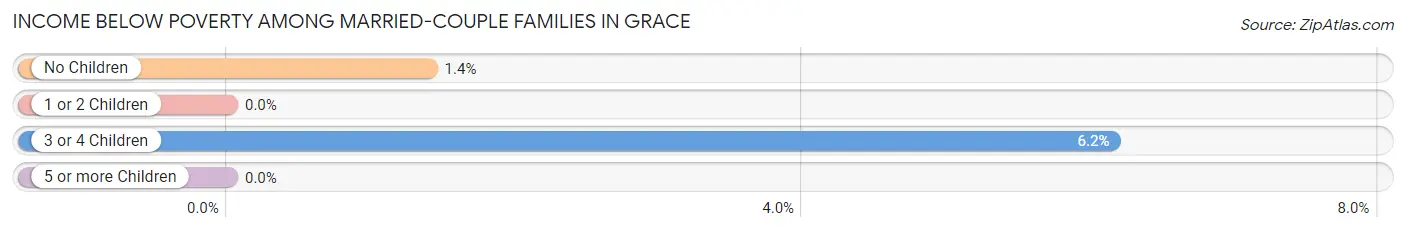
| Children | Above Poverty | Below Poverty |
| No Children | 142 (98.6%) | 2 (1.4%) |
| 1 or 2 Children | 73 (100.0%) | 0 (0.0%) |
| 3 or 4 Children | 61 (93.9%) | 4 (6.1%) |
| 5 or more Children | 3 (100.0%) | 0 (0.0%) |
| Total | 279 (97.9%) | 6 (2.1%) |
Income Below Poverty Among Single-Parent Households in Grace
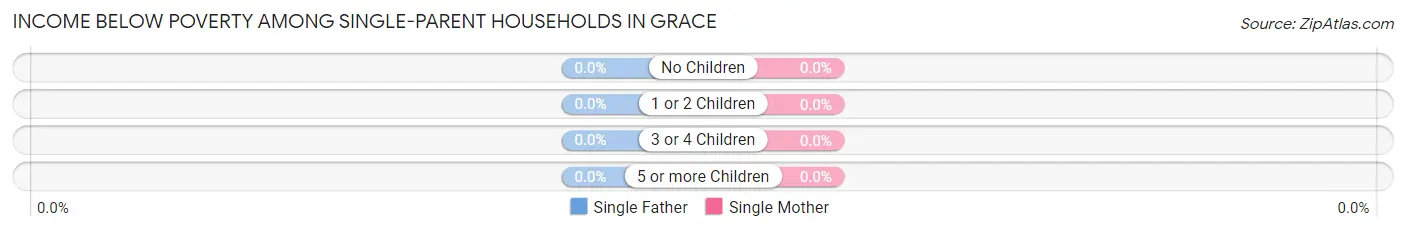
| Children | Single Father | Single Mother |
| No Children | 0 (0.0%) | 0 (0.0%) |
| 1 or 2 Children | 0 (0.0%) | 0 (0.0%) |
| 3 or 4 Children | 0 (0.0%) | 0 (0.0%) |
| 5 or more Children | 0 (0.0%) | 0 (0.0%) |
| Total | 0 (0.0%) | 0 (0.0%) |
Income Below Poverty Among Married-Couple vs Single-Parent Households in Grace
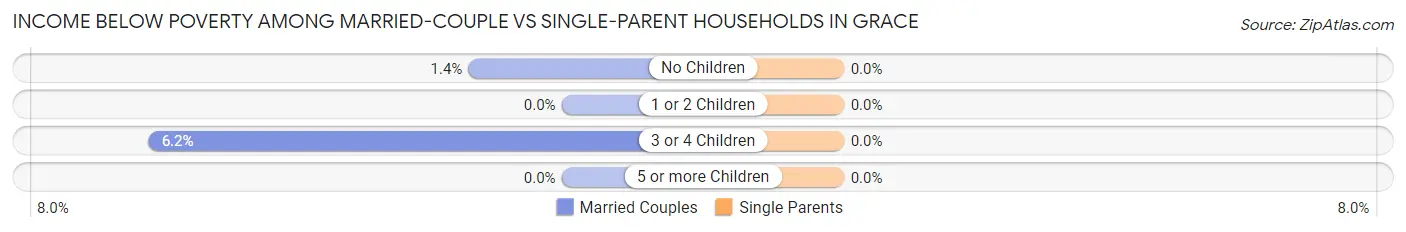
| Children | Married-Couple Families | Single-Parent Households |
| No Children | 2 (1.4%) | 0 (0.0%) |
| 1 or 2 Children | 0 (0.0%) | 0 (0.0%) |
| 3 or 4 Children | 4 (6.1%) | 0 (0.0%) |
| 5 or more Children | 0 (0.0%) | 0 (0.0%) |
| Total | 6 (2.1%) | 0 (0.0%) |
Employment Characteristics in Grace
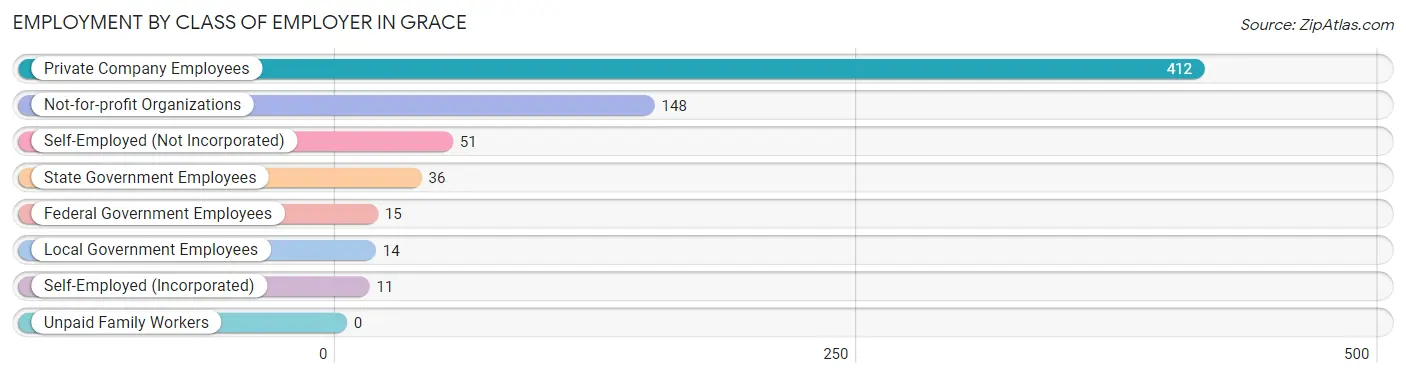
Employment by Class of Employer in Grace
Among the 687 employed individuals in Grace, private company employees (412 | 60.0%), not-for-profit organizations (148 | 21.5%), and self-employed (not incorporated) (51 | 7.4%) make up the most common classes of employment.
| Employer Class | # Employees | % Employees |
| Private Company Employees | 412 | 60.0% |
| Self-Employed (Incorporated) | 11 | 1.6% |
| Self-Employed (Not Incorporated) | 51 | 7.4% |
| Not-for-profit Organizations | 148 | 21.5% |
| Local Government Employees | 14 | 2.0% |
| State Government Employees | 36 | 5.2% |
| Federal Government Employees | 15 | 2.2% |
| Unpaid Family Workers | 0 | 0.0% |
| Total | 687 | 100.0% |
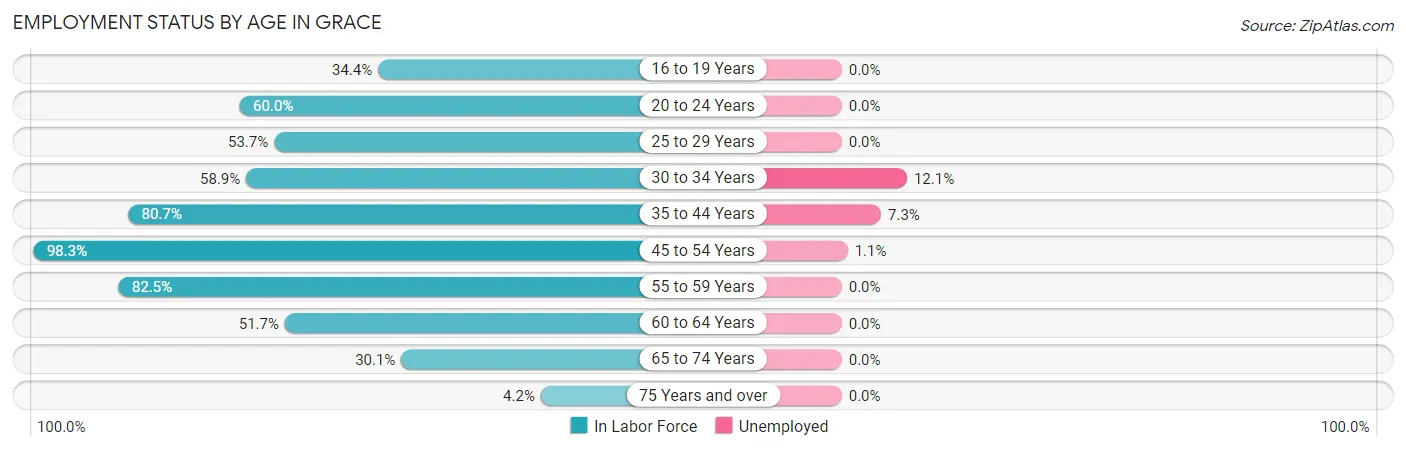
Employment Status by Age in Grace
According to the labor force statistics for Grace, out of the total population over 16 years of age (1,102), 64.0% or 705 individuals are in the labor force, with 2.6% or 18 of them unemployed. The age group with the highest labor force participation rate is 45 to 54 years, with 98.3% or 284 individuals in the labor force. Within the labor force, the 30 to 34 years age range has the highest percentage of unemployed individuals, with 12.1% or 4 of them being unemployed.
| Age Bracket | In Labor Force | Unemployed |
| 16 to 19 Years | 62 (34.4%) | 0 (0.0%) |
| 20 to 24 Years | 54 (60.0%) | 0 (0.0%) |
| 25 to 29 Years | 22 (53.7%) | 0 (0.0%) |
| 30 to 34 Years | 33 (58.9%) | 4 (12.1%) |
| 35 to 44 Years | 151 (80.7%) | 11 (7.3%) |
| 45 to 54 Years | 284 (98.3%) | 3 (1.1%) |
| 55 to 59 Years | 33 (82.5%) | 0 (0.0%) |
| 60 to 64 Years | 30 (51.7%) | 0 (0.0%) |
| 65 to 74 Years | 34 (30.1%) | 0 (0.0%) |
| 75 Years and over | 2 (4.2%) | 0 (0.0%) |
| Total | 705 (64.0%) | 18 (2.6%) |
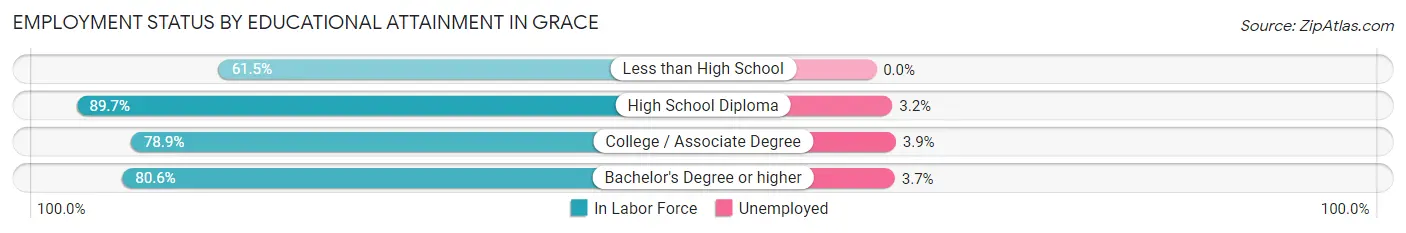
Employment Status by Educational Attainment in Grace
According to labor force statistics for Grace, 82.4% of individuals (553) out of the total population between 25 and 64 years of age (671) are in the labor force, with 3.3% or 18 of them being unemployed. The group with the highest labor force participation rate are those with the educational attainment of high school diploma, with 89.7% or 279 individuals in the labor force. Within the labor force, individuals with college / associate degree education have the highest percentage of unemployment, with 3.9% or 7 of them being unemployed.
| Educational Attainment | In Labor Force | Unemployed |
| Less than High School | 40 (61.5%) | 0 (0.0%) |
| High School Diploma | 279 (89.7%) | 10 (3.2%) |
| College / Associate Degree | 180 (78.9%) | 9 (3.9%) |
| Bachelor's Degree or higher | 54 (80.6%) | 2 (3.7%) |
| Total | 553 (82.4%) | 22 (3.3%) |
Employment Occupations by Sex in Grace
Management, Business, Science and Arts Occupations
The most common Management, Business, Science and Arts occupations in Grace are Management (58 | 8.4%), Community & Social Service (43 | 6.3%), Education Instruction & Library (41 | 6.0%), Health Diagnosing & Treating (35 | 5.1%), and Business & Financial (19 | 2.8%).
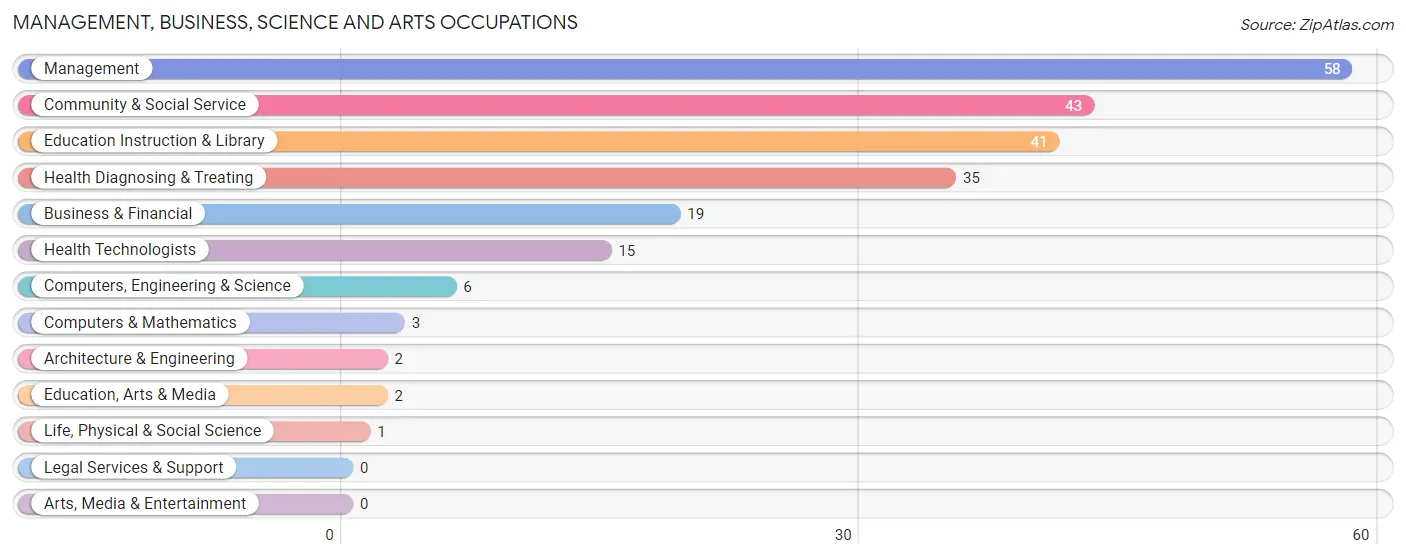
Management, Business, Science and Arts Occupations by Sex
Within the Management, Business, Science and Arts occupations in Grace, the most male-oriented occupations are Architecture & Engineering (100.0%), Education, Arts & Media (100.0%), and Management (79.3%), while the most female-oriented occupations are Computers & Mathematics (100.0%), Life, Physical & Social Science (100.0%), and Health Diagnosing & Treating (100.0%).
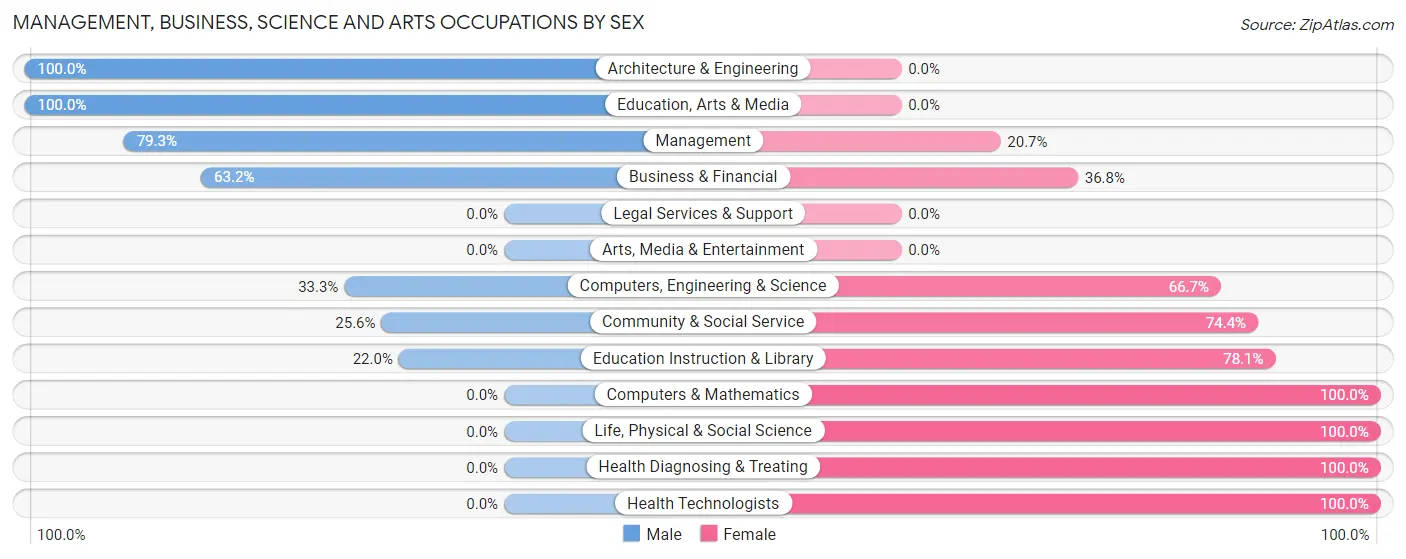
| Occupation | Male | Female |
| Management | 46 (79.3%) | 12 (20.7%) |
| Business & Financial | 12 (63.2%) | 7 (36.8%) |
| Computers, Engineering & Science | 2 (33.3%) | 4 (66.7%) |
| Computers & Mathematics | 0 (0.0%) | 3 (100.0%) |
| Architecture & Engineering | 2 (100.0%) | 0 (0.0%) |
| Life, Physical & Social Science | 0 (0.0%) | 1 (100.0%) |
| Community & Social Service | 11 (25.6%) | 32 (74.4%) |
| Education, Arts & Media | 2 (100.0%) | 0 (0.0%) |
| Legal Services & Support | 0 (0.0%) | 0 (0.0%) |
| Education Instruction & Library | 9 (22.0%) | 32 (78.0%) |
| Arts, Media & Entertainment | 0 (0.0%) | 0 (0.0%) |
| Health Diagnosing & Treating | 0 (0.0%) | 35 (100.0%) |
| Health Technologists | 0 (0.0%) | 15 (100.0%) |
| Total (Category) | 71 (44.1%) | 90 (55.9%) |
| Total (Overall) | 462 (67.2%) | 225 (32.8%) |
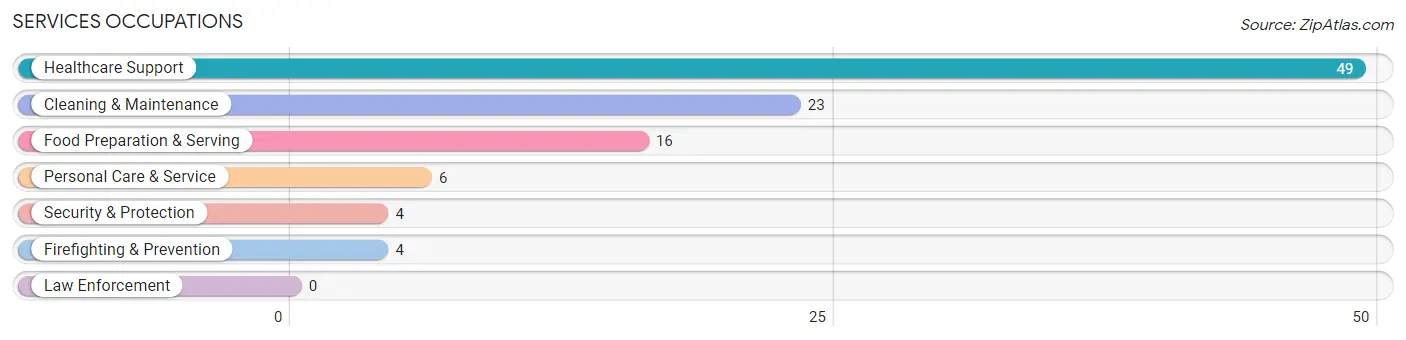
Services Occupations
The most common Services occupations in Grace are Healthcare Support (49 | 7.1%), Cleaning & Maintenance (23 | 3.4%), Food Preparation & Serving (16 | 2.3%), Personal Care & Service (6 | 0.9%), and Security & Protection (4 | 0.6%).
Services Occupations by Sex
Within the Services occupations in Grace, the most male-oriented occupations are Cleaning & Maintenance (95.7%), and Healthcare Support (4.1%), while the most female-oriented occupations are Security & Protection (100.0%), Firefighting & Prevention (100.0%), and Food Preparation & Serving (100.0%).
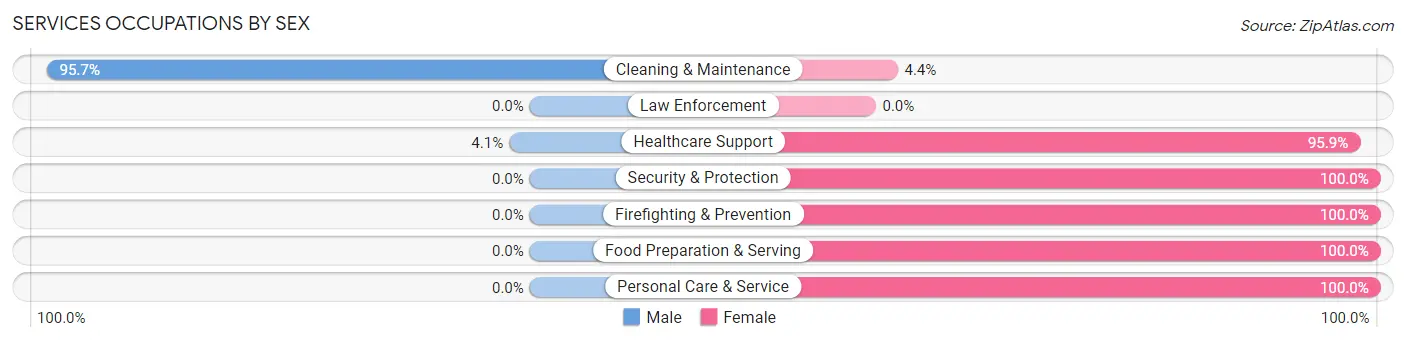
| Occupation | Male | Female |
| Healthcare Support | 2 (4.1%) | 47 (95.9%) |
| Security & Protection | 0 (0.0%) | 4 (100.0%) |
| Firefighting & Prevention | 0 (0.0%) | 4 (100.0%) |
| Law Enforcement | 0 (0.0%) | 0 (0.0%) |
| Food Preparation & Serving | 0 (0.0%) | 16 (100.0%) |
| Cleaning & Maintenance | 22 (95.7%) | 1 (4.3%) |
| Personal Care & Service | 0 (0.0%) | 6 (100.0%) |
| Total (Category) | 24 (24.5%) | 74 (75.5%) |
| Total (Overall) | 462 (67.2%) | 225 (32.8%) |
Sales and Office Occupations
The most common Sales and Office occupations in Grace are Office & Administration (45 | 6.6%), and Sales & Related (28 | 4.1%).

Sales and Office Occupations by Sex
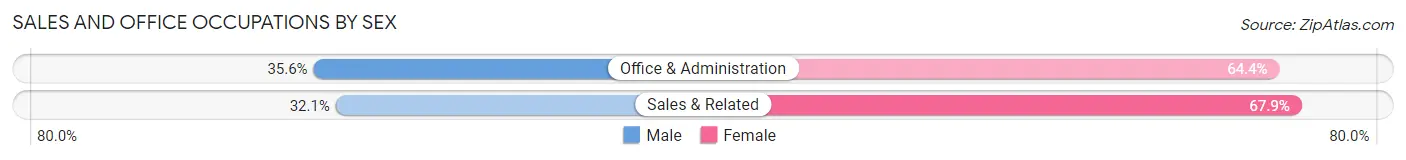
| Occupation | Male | Female |
| Sales & Related | 9 (32.1%) | 19 (67.9%) |
| Office & Administration | 16 (35.6%) | 29 (64.4%) |
| Total (Category) | 25 (34.3%) | 48 (65.7%) |
| Total (Overall) | 462 (67.2%) | 225 (32.8%) |
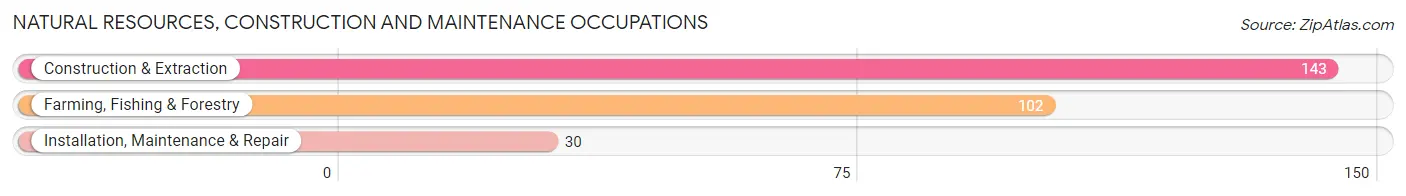
Natural Resources, Construction and Maintenance Occupations
The most common Natural Resources, Construction and Maintenance occupations in Grace are Construction & Extraction (143 | 20.8%), Farming, Fishing & Forestry (102 | 14.8%), and Installation, Maintenance & Repair (30 | 4.4%).
Natural Resources, Construction and Maintenance Occupations by Sex
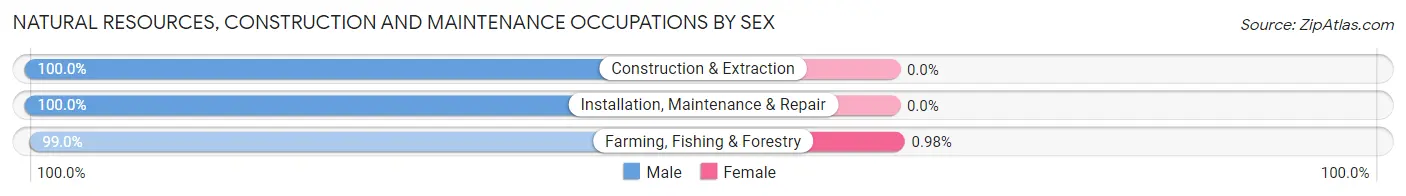
| Occupation | Male | Female |
| Farming, Fishing & Forestry | 101 (99.0%) | 1 (1.0%) |
| Construction & Extraction | 143 (100.0%) | 0 (0.0%) |
| Installation, Maintenance & Repair | 30 (100.0%) | 0 (0.0%) |
| Total (Category) | 274 (99.6%) | 1 (0.4%) |
| Total (Overall) | 462 (67.2%) | 225 (32.8%) |
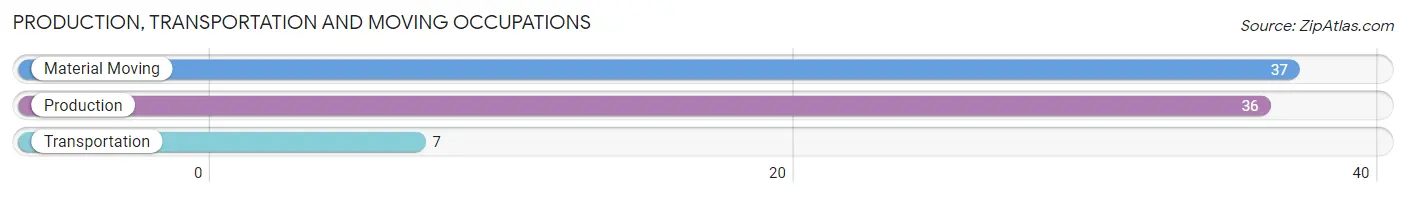
Production, Transportation and Moving Occupations
The most common Production, Transportation and Moving occupations in Grace are Material Moving (37 | 5.4%), Production (36 | 5.2%), and Transportation (7 | 1.0%).
Production, Transportation and Moving Occupations by Sex
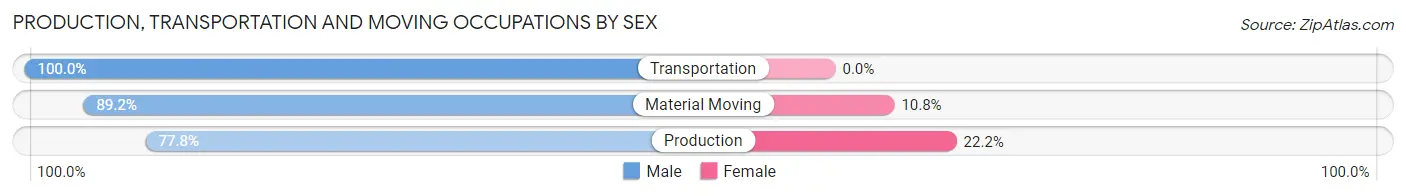
| Occupation | Male | Female |
| Production | 28 (77.8%) | 8 (22.2%) |
| Transportation | 7 (100.0%) | 0 (0.0%) |
| Material Moving | 33 (89.2%) | 4 (10.8%) |
| Total (Category) | 68 (85.0%) | 12 (15.0%) |
| Total (Overall) | 462 (67.2%) | 225 (32.8%) |
Employment Industries by Sex in Grace
Employment Industries in Grace
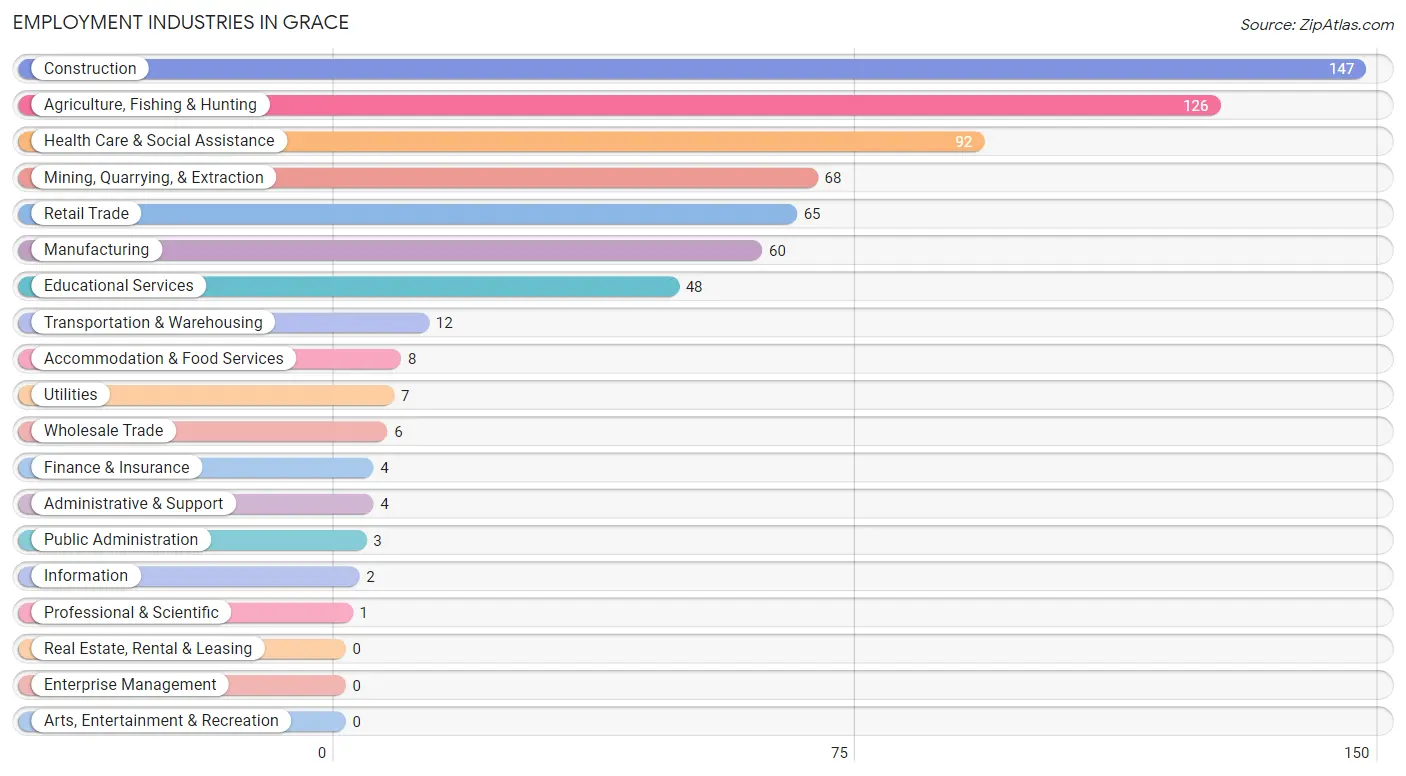
The major employment industries in Grace include Construction (147 | 21.4%), Agriculture, Fishing & Hunting (126 | 18.3%), Health Care & Social Assistance (92 | 13.4%), Mining, Quarrying, & Extraction (68 | 9.9%), and Retail Trade (65 | 9.5%).
Employment Industries by Sex in Grace
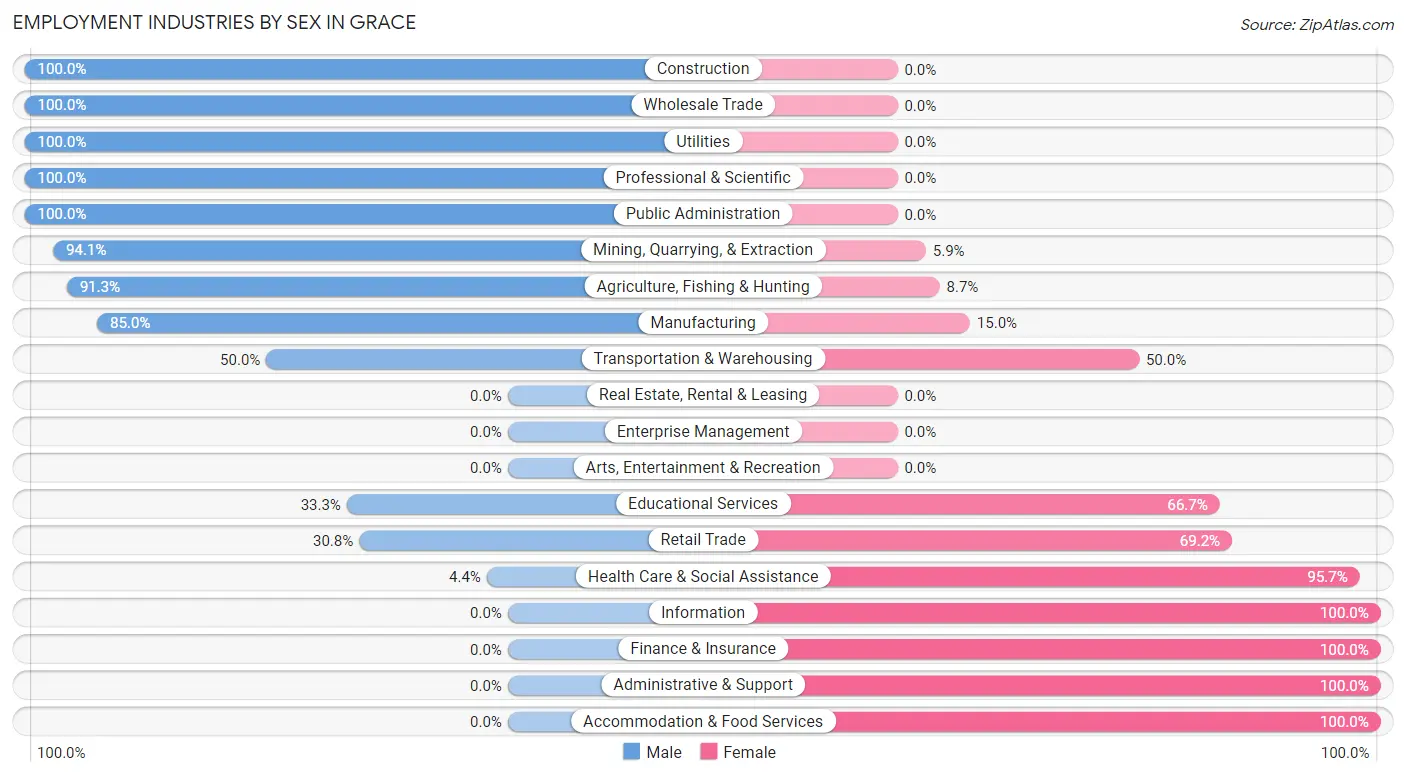
The Grace industries that see more men than women are Construction (100.0%), Wholesale Trade (100.0%), and Utilities (100.0%), whereas the industries that tend to have a higher number of women are Information (100.0%), Finance & Insurance (100.0%), and Administrative & Support (100.0%).
| Industry | Male | Female |
| Agriculture, Fishing & Hunting | 115 (91.3%) | 11 (8.7%) |
| Mining, Quarrying, & Extraction | 64 (94.1%) | 4 (5.9%) |
| Construction | 147 (100.0%) | 0 (0.0%) |
| Manufacturing | 51 (85.0%) | 9 (15.0%) |
| Wholesale Trade | 6 (100.0%) | 0 (0.0%) |
| Retail Trade | 20 (30.8%) | 45 (69.2%) |
| Transportation & Warehousing | 6 (50.0%) | 6 (50.0%) |
| Utilities | 7 (100.0%) | 0 (0.0%) |
| Information | 0 (0.0%) | 2 (100.0%) |
| Finance & Insurance | 0 (0.0%) | 4 (100.0%) |
| Real Estate, Rental & Leasing | 0 (0.0%) | 0 (0.0%) |
| Professional & Scientific | 1 (100.0%) | 0 (0.0%) |
| Enterprise Management | 0 (0.0%) | 0 (0.0%) |
| Administrative & Support | 0 (0.0%) | 4 (100.0%) |
| Educational Services | 16 (33.3%) | 32 (66.7%) |
| Health Care & Social Assistance | 4 (4.3%) | 88 (95.7%) |
| Arts, Entertainment & Recreation | 0 (0.0%) | 0 (0.0%) |
| Accommodation & Food Services | 0 (0.0%) | 8 (100.0%) |
| Public Administration | 3 (100.0%) | 0 (0.0%) |
| Total | 462 (67.2%) | 225 (32.8%) |
Education in Grace
School Enrollment in Grace
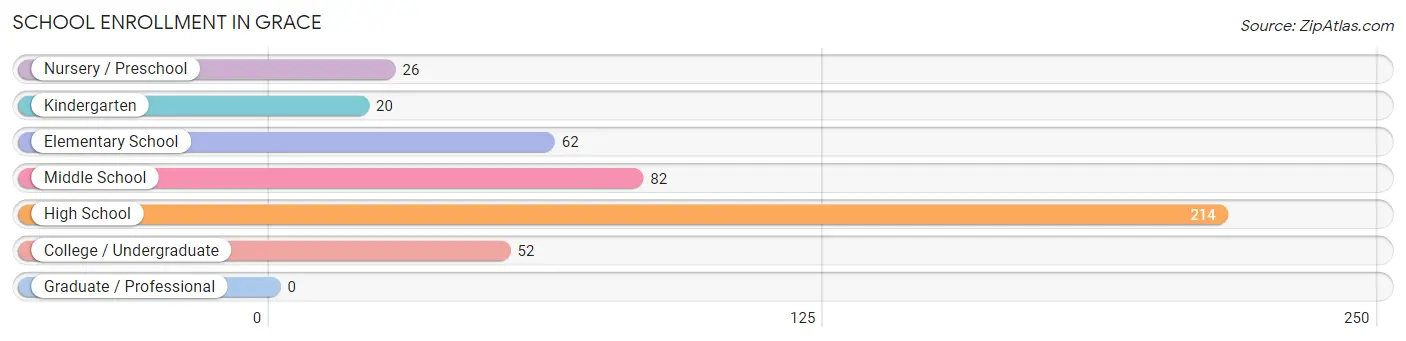
The most common levels of schooling among the 456 students in Grace are high school (214 | 46.9%), middle school (82 | 18.0%), and elementary school (62 | 13.6%).
| School Level | # Students | % Students |
| Nursery / Preschool | 26 | 5.7% |
| Kindergarten | 20 | 4.4% |
| Elementary School | 62 | 13.6% |
| Middle School | 82 | 18.0% |
| High School | 214 | 46.9% |
| College / Undergraduate | 52 | 11.4% |
| Graduate / Professional | 0 | 0.0% |
| Total | 456 | 100.0% |
School Enrollment by Age by Funding Source in Grace
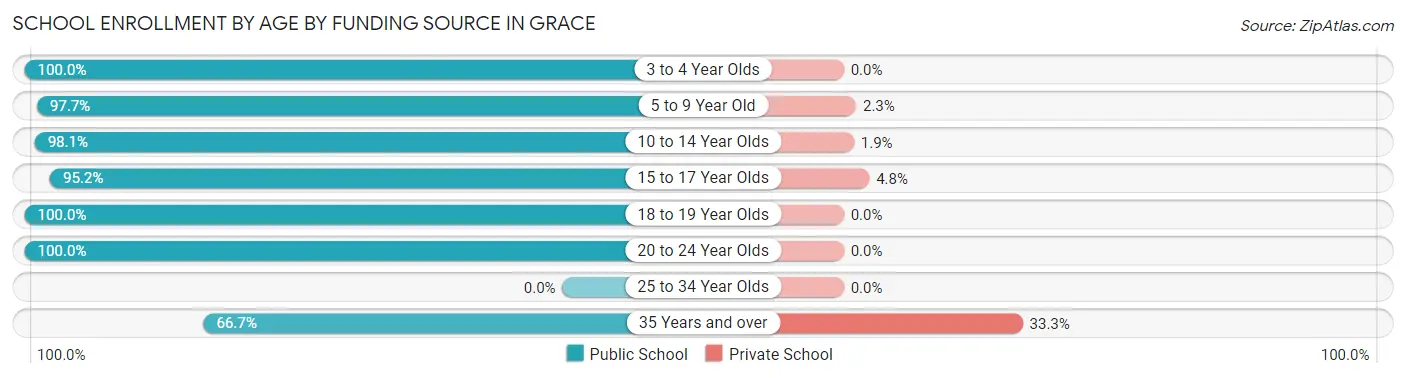
Out of a total of 456 students who are enrolled in schools in Grace, 16 (3.5%) attend a private institution, while the remaining 440 (96.5%) are enrolled in public schools. The age group of 35 years and over has the highest likelihood of being enrolled in private schools, with 4 (33.3% in the age bracket) enrolled. Conversely, the age group of 3 to 4 year olds has the lowest likelihood of being enrolled in a private school, with 16 (100.0% in the age bracket) attending a public institution.
| Age Bracket | Public School | Private School |
| 3 to 4 Year Olds | 16 (100.0%) | 0 (0.0%) |
| 5 to 9 Year Old | 85 (97.7%) | 2 (2.3%) |
| 10 to 14 Year Olds | 104 (98.1%) | 2 (1.9%) |
| 15 to 17 Year Olds | 160 (95.2%) | 8 (4.8%) |
| 18 to 19 Year Olds | 27 (100.0%) | 0 (0.0%) |
| 20 to 24 Year Olds | 40 (100.0%) | 0 (0.0%) |
| 25 to 34 Year Olds | 0 (0.0%) | 0 (0.0%) |
| 35 Years and over | 8 (66.7%) | 4 (33.3%) |
| Total | 440 (96.5%) | 16 (3.5%) |
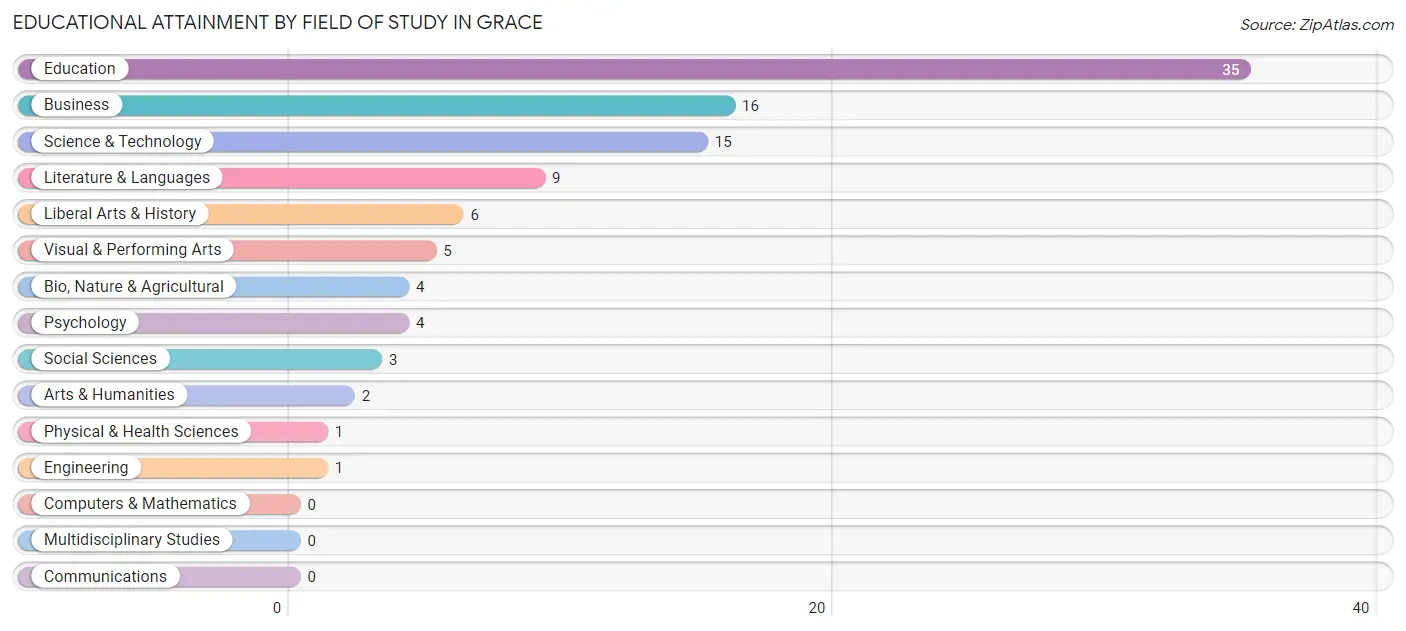
Educational Attainment by Field of Study in Grace
Education (35 | 34.6%), business (16 | 15.8%), science & technology (15 | 14.8%), literature & languages (9 | 8.9%), and liberal arts & history (6 | 5.9%) are the most common fields of study among 101 individuals in Grace who have obtained a bachelor's degree or higher.
| Field of Study | # Graduates | % Graduates |
| Computers & Mathematics | 0 | 0.0% |
| Bio, Nature & Agricultural | 4 | 4.0% |
| Physical & Health Sciences | 1 | 1.0% |
| Psychology | 4 | 4.0% |
| Social Sciences | 3 | 3.0% |
| Engineering | 1 | 1.0% |
| Multidisciplinary Studies | 0 | 0.0% |
| Science & Technology | 15 | 14.8% |
| Business | 16 | 15.8% |
| Education | 35 | 34.6% |
| Literature & Languages | 9 | 8.9% |
| Liberal Arts & History | 6 | 5.9% |
| Visual & Performing Arts | 5 | 5.0% |
| Communications | 0 | 0.0% |
| Arts & Humanities | 2 | 2.0% |
| Total | 101 | 100.0% |
Transportation & Commute in Grace
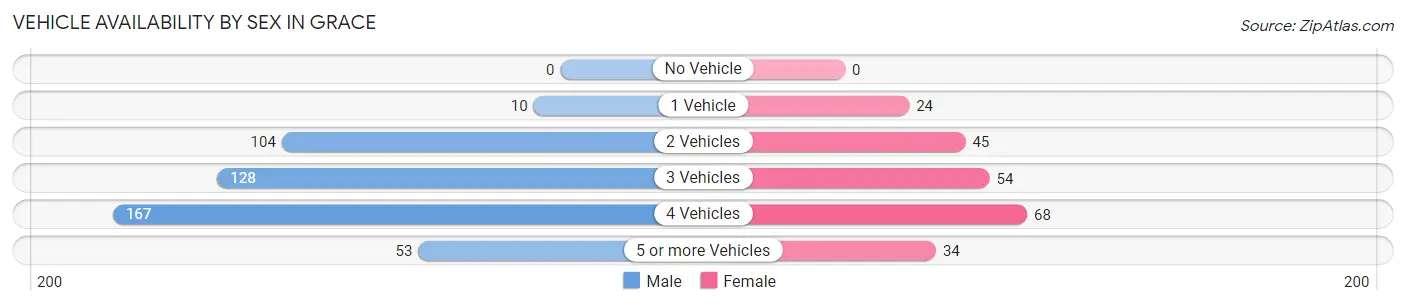
Vehicle Availability by Sex in Grace
The most prevalent vehicle ownership categories in Grace are males with 4 vehicles (167, accounting for 36.1%) and females with 4 vehicles (68, making up 74.2%).
| Vehicles Available | Male | Female |
| No Vehicle | 0 (0.0%) | 0 (0.0%) |
| 1 Vehicle | 10 (2.2%) | 24 (10.7%) |
| 2 Vehicles | 104 (22.5%) | 45 (20.0%) |
| 3 Vehicles | 128 (27.7%) | 54 (24.0%) |
| 4 Vehicles | 167 (36.1%) | 68 (30.2%) |
| 5 or more Vehicles | 53 (11.5%) | 34 (15.1%) |
| Total | 462 (100.0%) | 225 (100.0%) |
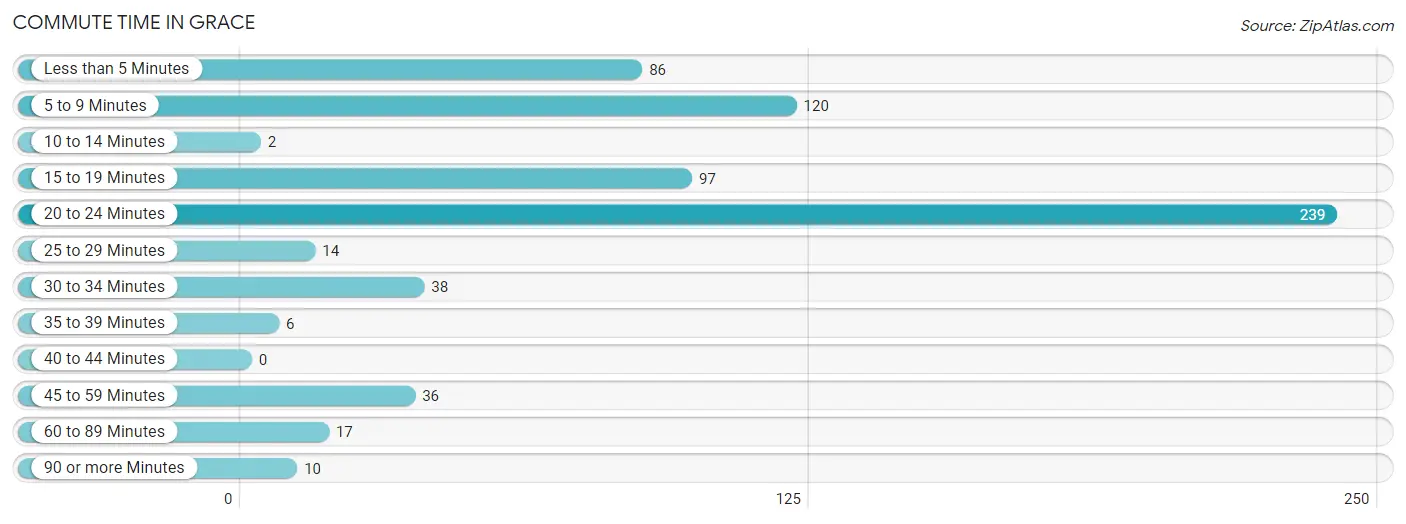
Commute Time in Grace
The most frequently occuring commute durations in Grace are 20 to 24 minutes (239 commuters, 35.9%), 5 to 9 minutes (120 commuters, 18.0%), and 15 to 19 minutes (97 commuters, 14.6%).
| Commute Time | # Commuters | % Commuters |
| Less than 5 Minutes | 86 | 12.9% |
| 5 to 9 Minutes | 120 | 18.0% |
| 10 to 14 Minutes | 2 | 0.3% |
| 15 to 19 Minutes | 97 | 14.6% |
| 20 to 24 Minutes | 239 | 35.9% |
| 25 to 29 Minutes | 14 | 2.1% |
| 30 to 34 Minutes | 38 | 5.7% |
| 35 to 39 Minutes | 6 | 0.9% |
| 40 to 44 Minutes | 0 | 0.0% |
| 45 to 59 Minutes | 36 | 5.4% |
| 60 to 89 Minutes | 17 | 2.6% |
| 90 or more Minutes | 10 | 1.5% |
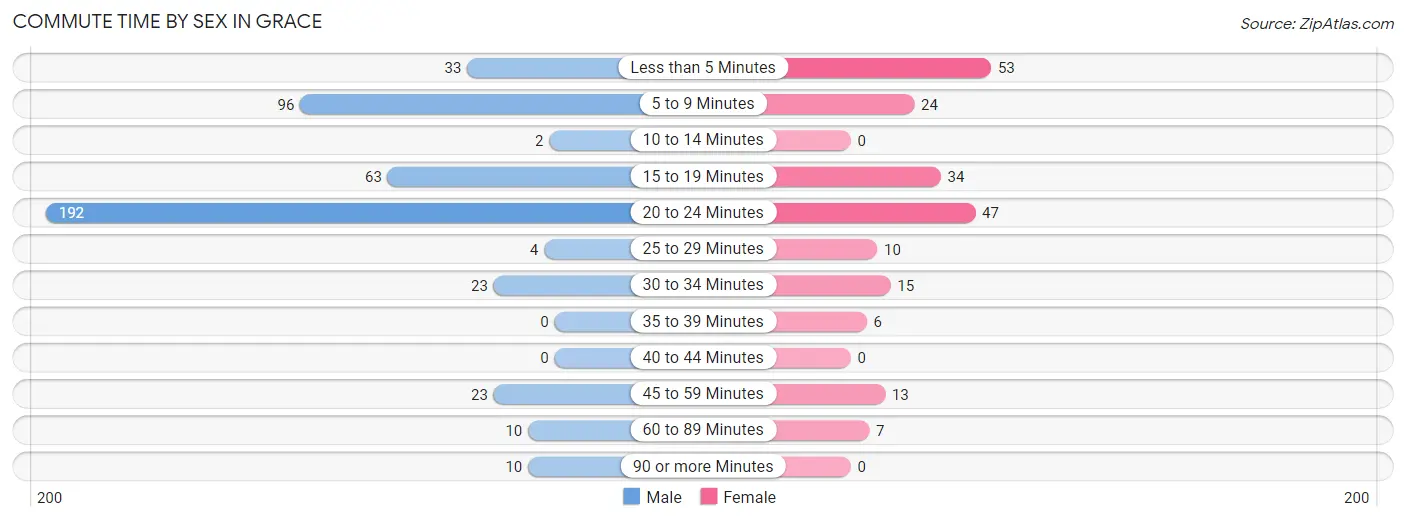
Commute Time by Sex in Grace
The most common commute times in Grace are 20 to 24 minutes (192 commuters, 42.1%) for males and less than 5 minutes (53 commuters, 25.4%) for females.
| Commute Time | Male | Female |
| Less than 5 Minutes | 33 (7.2%) | 53 (25.4%) |
| 5 to 9 Minutes | 96 (21.0%) | 24 (11.5%) |
| 10 to 14 Minutes | 2 (0.4%) | 0 (0.0%) |
| 15 to 19 Minutes | 63 (13.8%) | 34 (16.3%) |
| 20 to 24 Minutes | 192 (42.1%) | 47 (22.5%) |
| 25 to 29 Minutes | 4 (0.9%) | 10 (4.8%) |
| 30 to 34 Minutes | 23 (5.0%) | 15 (7.2%) |
| 35 to 39 Minutes | 0 (0.0%) | 6 (2.9%) |
| 40 to 44 Minutes | 0 (0.0%) | 0 (0.0%) |
| 45 to 59 Minutes | 23 (5.0%) | 13 (6.2%) |
| 60 to 89 Minutes | 10 (2.2%) | 7 (3.4%) |
| 90 or more Minutes | 10 (2.2%) | 0 (0.0%) |
Time of Departure to Work by Sex in Grace
The most frequent times of departure to work in Grace are 6:00 AM to 6:29 AM (126, 27.6%) for males and 12:00 PM to 3:59 PM (42, 20.1%) for females.
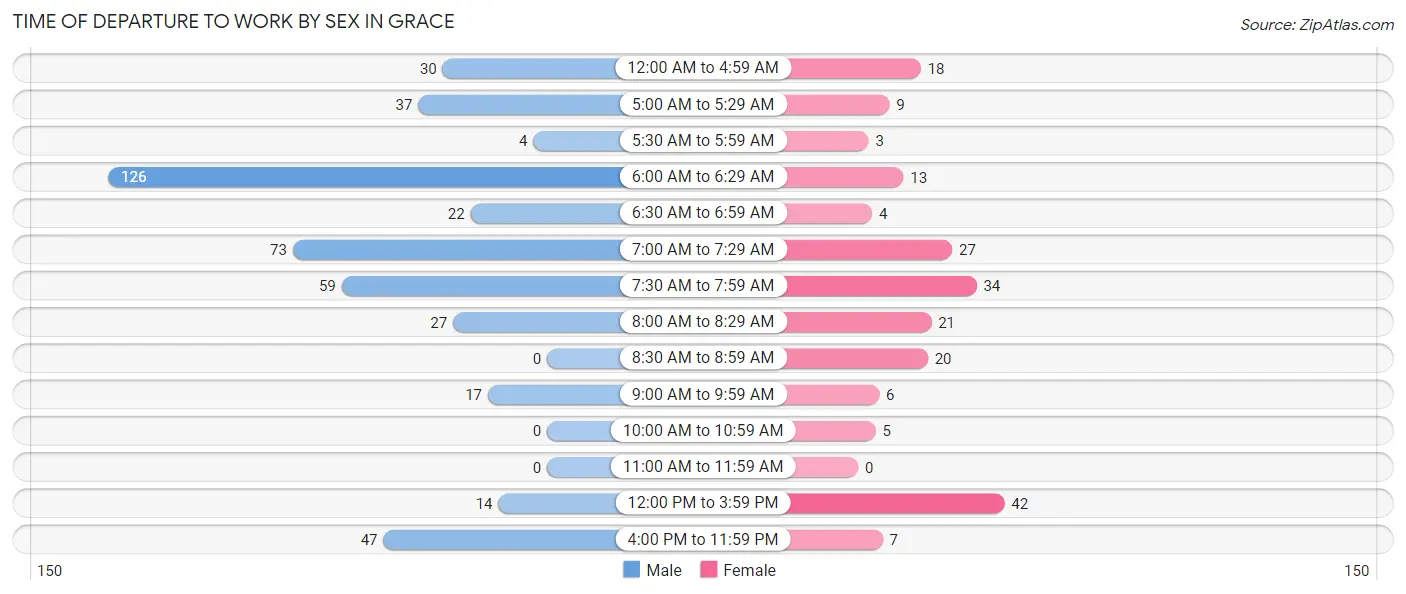
| Time of Departure | Male | Female |
| 12:00 AM to 4:59 AM | 30 (6.6%) | 18 (8.6%) |
| 5:00 AM to 5:29 AM | 37 (8.1%) | 9 (4.3%) |
| 5:30 AM to 5:59 AM | 4 (0.9%) | 3 (1.4%) |
| 6:00 AM to 6:29 AM | 126 (27.6%) | 13 (6.2%) |
| 6:30 AM to 6:59 AM | 22 (4.8%) | 4 (1.9%) |
| 7:00 AM to 7:29 AM | 73 (16.0%) | 27 (12.9%) |
| 7:30 AM to 7:59 AM | 59 (12.9%) | 34 (16.3%) |
| 8:00 AM to 8:29 AM | 27 (5.9%) | 21 (10.1%) |
| 8:30 AM to 8:59 AM | 0 (0.0%) | 20 (9.6%) |
| 9:00 AM to 9:59 AM | 17 (3.7%) | 6 (2.9%) |
| 10:00 AM to 10:59 AM | 0 (0.0%) | 5 (2.4%) |
| 11:00 AM to 11:59 AM | 0 (0.0%) | 0 (0.0%) |
| 12:00 PM to 3:59 PM | 14 (3.1%) | 42 (20.1%) |
| 4:00 PM to 11:59 PM | 47 (10.3%) | 7 (3.4%) |
| Total | 456 (100.0%) | 209 (100.0%) |
Housing Occupancy in Grace
Occupancy by Ownership in Grace
Of the total 407 dwellings in Grace, owner-occupied units account for 346 (85.0%), while renter-occupied units make up 61 (15.0%).
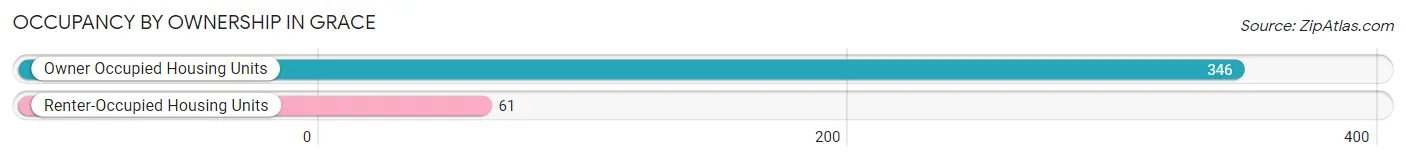
| Occupancy | # Housing Units | % Housing Units |
| Owner Occupied Housing Units | 346 | 85.0% |
| Renter-Occupied Housing Units | 61 | 15.0% |
| Total Occupied Housing Units | 407 | 100.0% |
Occupancy by Household Size in Grace
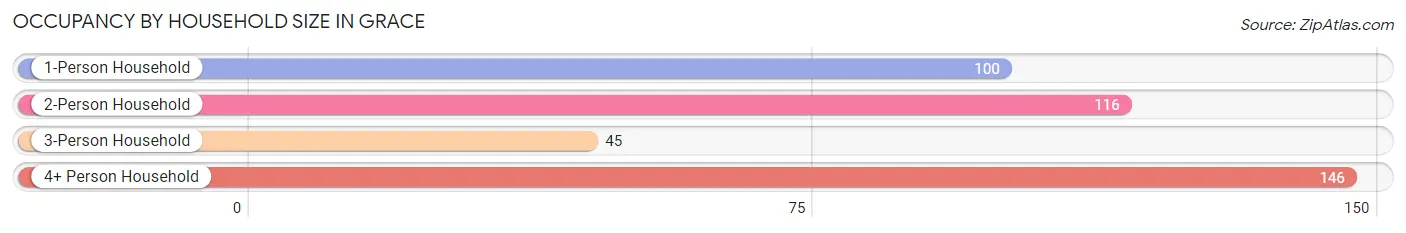
| Household Size | # Housing Units | % Housing Units |
| 1-Person Household | 100 | 24.6% |
| 2-Person Household | 116 | 28.5% |
| 3-Person Household | 45 | 11.1% |
| 4+ Person Household | 146 | 35.9% |
| Total Housing Units | 407 | 100.0% |
Occupancy by Ownership by Household Size in Grace
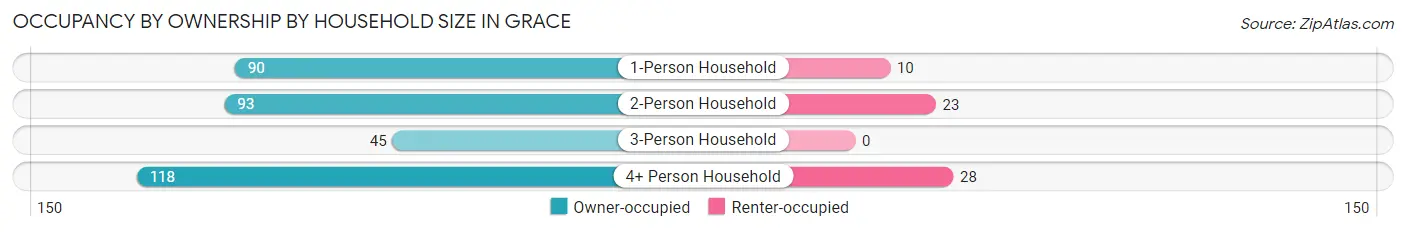
| Household Size | Owner-occupied | Renter-occupied |
| 1-Person Household | 90 (90.0%) | 10 (10.0%) |
| 2-Person Household | 93 (80.2%) | 23 (19.8%) |
| 3-Person Household | 45 (100.0%) | 0 (0.0%) |
| 4+ Person Household | 118 (80.8%) | 28 (19.2%) |
| Total Housing Units | 346 (85.0%) | 61 (15.0%) |
Occupancy by Educational Attainment in Grace
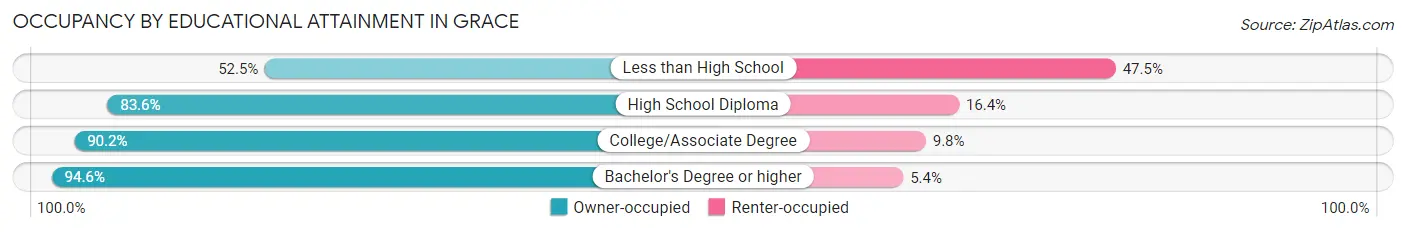
| Household Size | Owner-occupied | Renter-occupied |
| Less than High School | 21 (52.5%) | 19 (47.5%) |
| High School Diploma | 107 (83.6%) | 21 (16.4%) |
| College/Associate Degree | 165 (90.2%) | 18 (9.8%) |
| Bachelor's Degree or higher | 53 (94.6%) | 3 (5.4%) |
Occupancy by Age of Householder in Grace
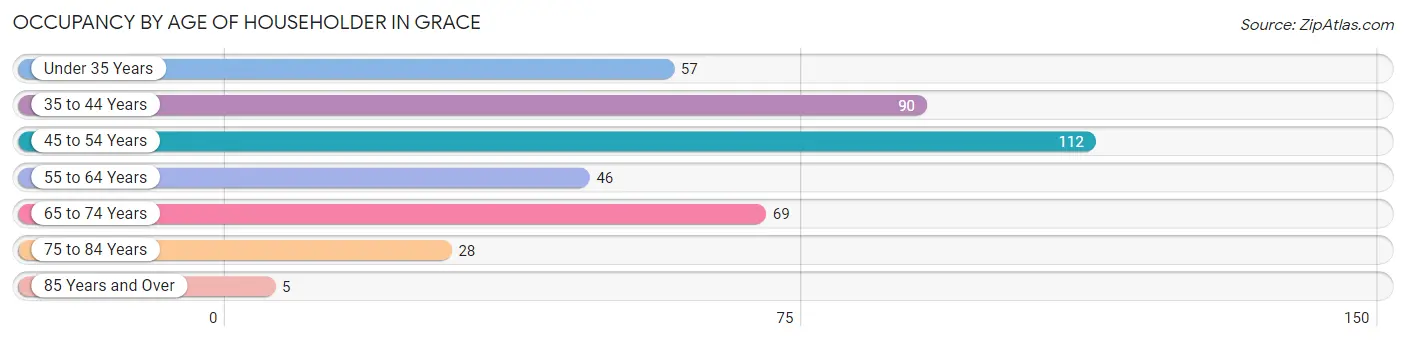
| Age Bracket | # Households | % Households |
| Under 35 Years | 57 | 14.0% |
| 35 to 44 Years | 90 | 22.1% |
| 45 to 54 Years | 112 | 27.5% |
| 55 to 64 Years | 46 | 11.3% |
| 65 to 74 Years | 69 | 17.0% |
| 75 to 84 Years | 28 | 6.9% |
| 85 Years and Over | 5 | 1.2% |
| Total | 407 | 100.0% |
Housing Finances in Grace
Median Income by Occupancy in Grace
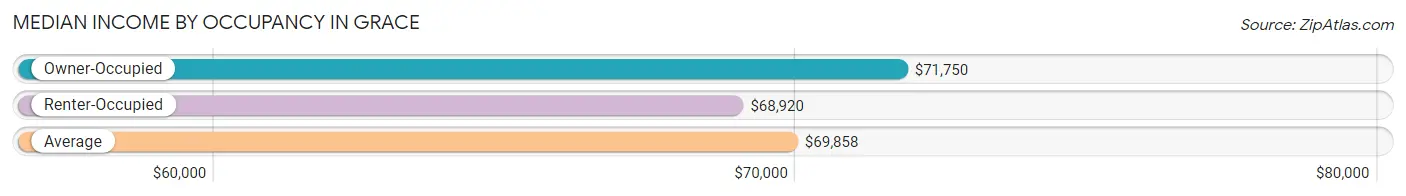
| Occupancy Type | # Households | Median Income |
| Owner-Occupied | 346 (85.0%) | $71,750 |
| Renter-Occupied | 61 (15.0%) | $68,920 |
| Average | 407 (100.0%) | $69,858 |
Occupancy by Householder Income Bracket in Grace
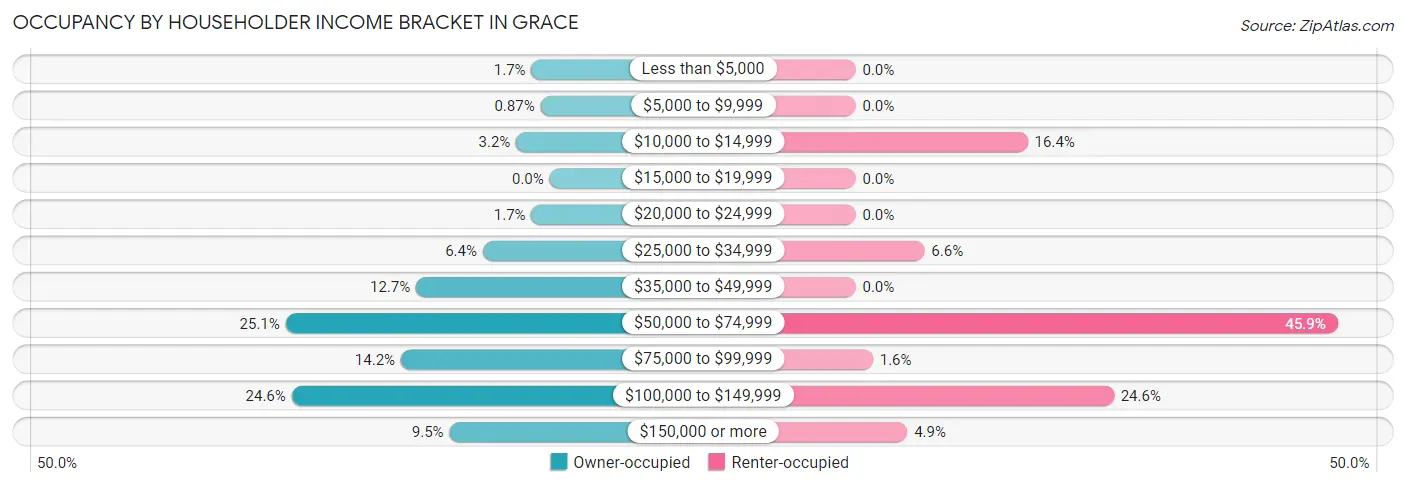
| Income Bracket | Owner-occupied | Renter-occupied |
| Less than $5,000 | 6 (1.7%) | 0 (0.0%) |
| $5,000 to $9,999 | 3 (0.9%) | 0 (0.0%) |
| $10,000 to $14,999 | 11 (3.2%) | 10 (16.4%) |
| $15,000 to $19,999 | 0 (0.0%) | 0 (0.0%) |
| $20,000 to $24,999 | 6 (1.7%) | 0 (0.0%) |
| $25,000 to $34,999 | 22 (6.4%) | 4 (6.6%) |
| $35,000 to $49,999 | 44 (12.7%) | 0 (0.0%) |
| $50,000 to $74,999 | 87 (25.1%) | 28 (45.9%) |
| $75,000 to $99,999 | 49 (14.2%) | 1 (1.6%) |
| $100,000 to $149,999 | 85 (24.6%) | 15 (24.6%) |
| $150,000 or more | 33 (9.5%) | 3 (4.9%) |
| Total | 346 (100.0%) | 61 (100.0%) |
Monthly Housing Cost Tiers in Grace
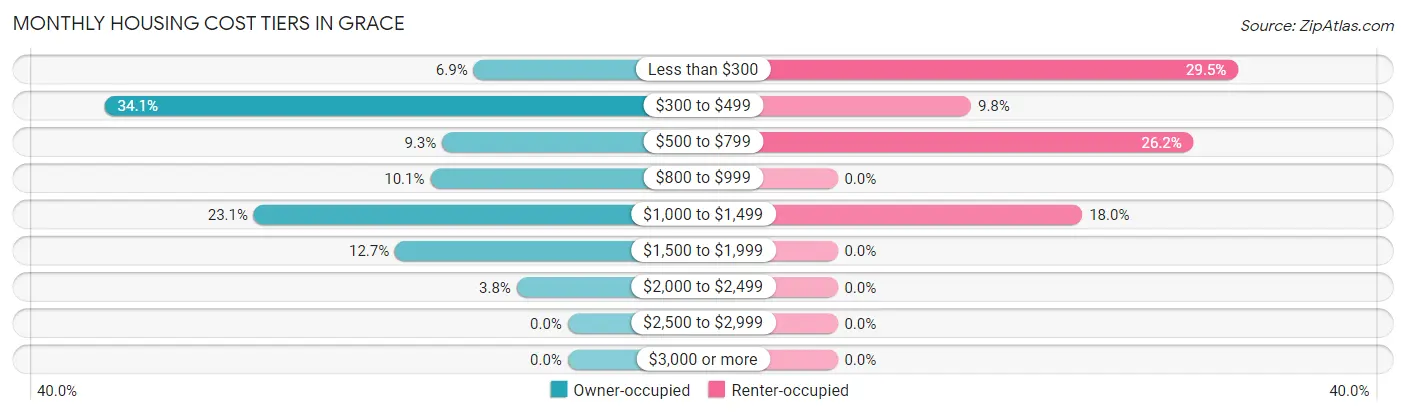
| Monthly Cost | Owner-occupied | Renter-occupied |
| Less than $300 | 24 (6.9%) | 18 (29.5%) |
| $300 to $499 | 118 (34.1%) | 6 (9.8%) |
| $500 to $799 | 32 (9.2%) | 16 (26.2%) |
| $800 to $999 | 35 (10.1%) | 0 (0.0%) |
| $1,000 to $1,499 | 80 (23.1%) | 11 (18.0%) |
| $1,500 to $1,999 | 44 (12.7%) | 0 (0.0%) |
| $2,000 to $2,499 | 13 (3.8%) | 0 (0.0%) |
| $2,500 to $2,999 | 0 (0.0%) | 0 (0.0%) |
| $3,000 or more | 0 (0.0%) | 0 (0.0%) |
| Total | 346 (100.0%) | 61 (100.0%) |
Physical Housing Characteristics in Grace
Housing Structures in Grace
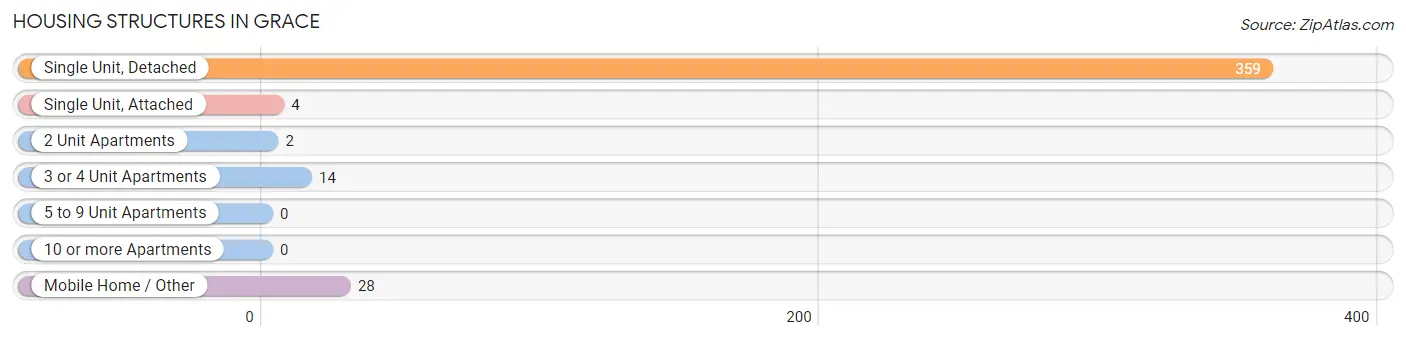
| Structure Type | # Housing Units | % Housing Units |
| Single Unit, Detached | 359 | 88.2% |
| Single Unit, Attached | 4 | 1.0% |
| 2 Unit Apartments | 2 | 0.5% |
| 3 or 4 Unit Apartments | 14 | 3.4% |
| 5 to 9 Unit Apartments | 0 | 0.0% |
| 10 or more Apartments | 0 | 0.0% |
| Mobile Home / Other | 28 | 6.9% |
| Total | 407 | 100.0% |
Housing Structures by Occupancy in Grace
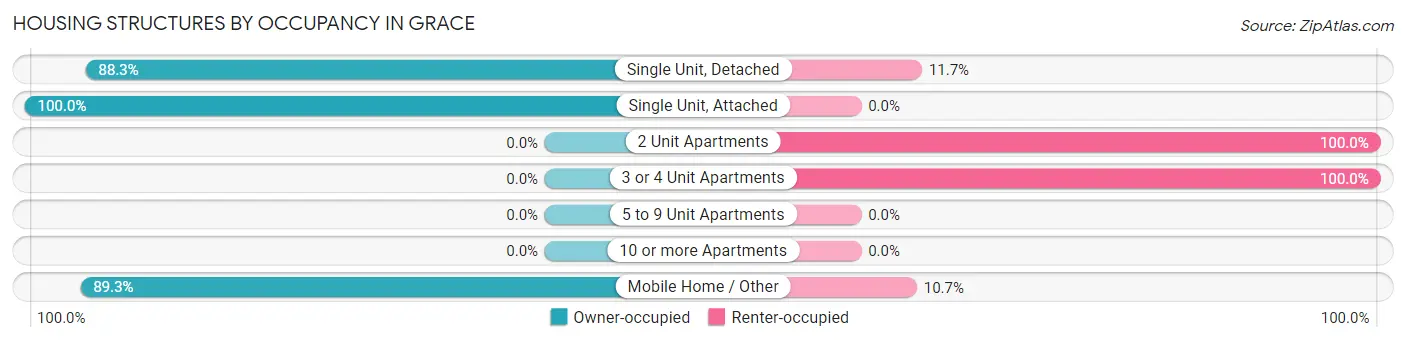
| Structure Type | Owner-occupied | Renter-occupied |
| Single Unit, Detached | 317 (88.3%) | 42 (11.7%) |
| Single Unit, Attached | 4 (100.0%) | 0 (0.0%) |
| 2 Unit Apartments | 0 (0.0%) | 2 (100.0%) |
| 3 or 4 Unit Apartments | 0 (0.0%) | 14 (100.0%) |
| 5 to 9 Unit Apartments | 0 (0.0%) | 0 (0.0%) |
| 10 or more Apartments | 0 (0.0%) | 0 (0.0%) |
| Mobile Home / Other | 25 (89.3%) | 3 (10.7%) |
| Total | 346 (85.0%) | 61 (15.0%) |
Housing Structures by Number of Rooms in Grace
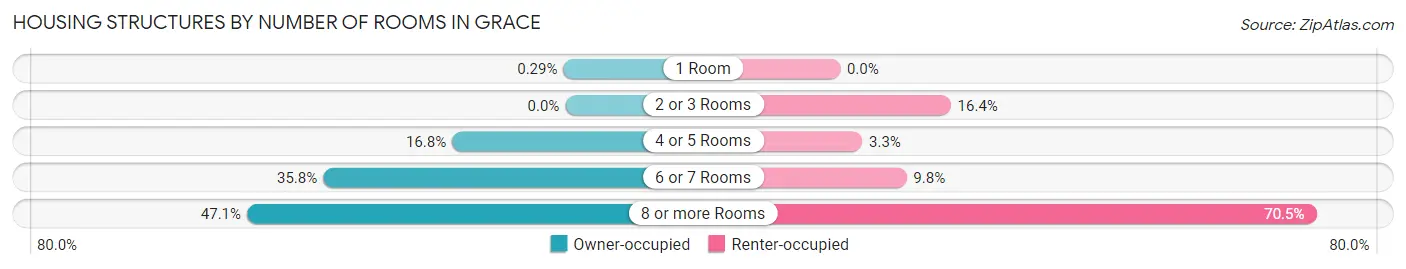
| Number of Rooms | Owner-occupied | Renter-occupied |
| 1 Room | 1 (0.3%) | 0 (0.0%) |
| 2 or 3 Rooms | 0 (0.0%) | 10 (16.4%) |
| 4 or 5 Rooms | 58 (16.8%) | 2 (3.3%) |
| 6 or 7 Rooms | 124 (35.8%) | 6 (9.8%) |
| 8 or more Rooms | 163 (47.1%) | 43 (70.5%) |
| Total | 346 (100.0%) | 61 (100.0%) |
Housing Structure by Heating Type in Grace
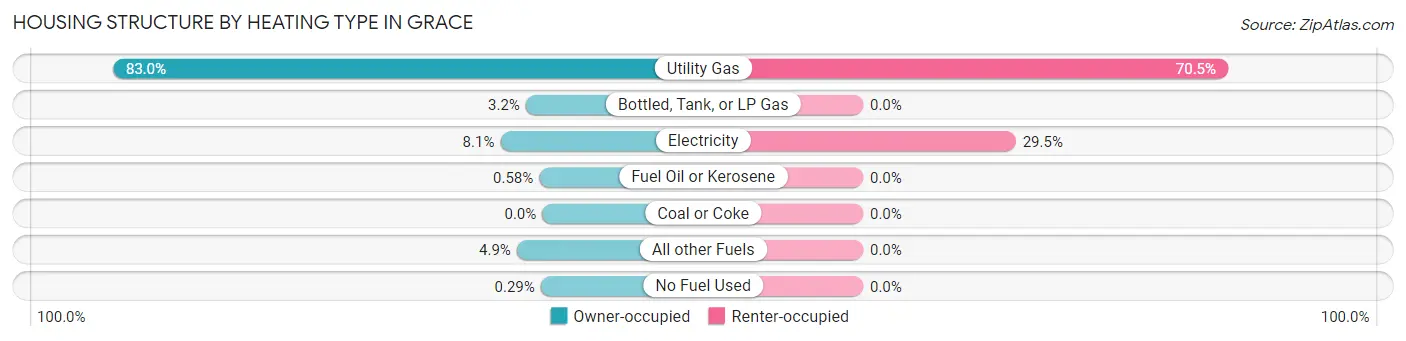
| Heating Type | Owner-occupied | Renter-occupied |
| Utility Gas | 287 (83.0%) | 43 (70.5%) |
| Bottled, Tank, or LP Gas | 11 (3.2%) | 0 (0.0%) |
| Electricity | 28 (8.1%) | 18 (29.5%) |
| Fuel Oil or Kerosene | 2 (0.6%) | 0 (0.0%) |
| Coal or Coke | 0 (0.0%) | 0 (0.0%) |
| All other Fuels | 17 (4.9%) | 0 (0.0%) |
| No Fuel Used | 1 (0.3%) | 0 (0.0%) |
| Total | 346 (100.0%) | 61 (100.0%) |
Household Vehicle Usage in Grace
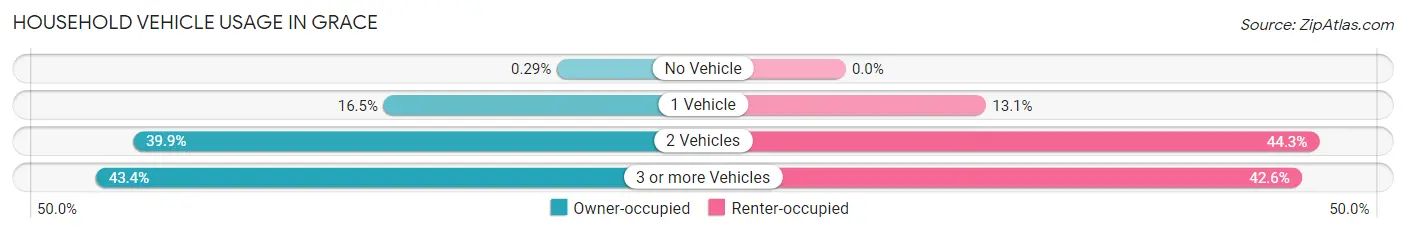
| Vehicles per Household | Owner-occupied | Renter-occupied |
| No Vehicle | 1 (0.3%) | 0 (0.0%) |
| 1 Vehicle | 57 (16.5%) | 8 (13.1%) |
| 2 Vehicles | 138 (39.9%) | 27 (44.3%) |
| 3 or more Vehicles | 150 (43.3%) | 26 (42.6%) |
| Total | 346 (100.0%) | 61 (100.0%) |
Real Estate & Mortgages in Grace
Real Estate and Mortgage Overview in Grace
| Characteristic | Without Mortgage | With Mortgage |
| Housing Units | 151 | 195 |
| Median Property Value | $168,500 | $152,100 |
| Median Household Income | $65,221 | $25 |
| Monthly Housing Costs | $347 | $0 |
| Real Estate Taxes | $1,313 | $10 |
Property Value by Mortgage Status in Grace
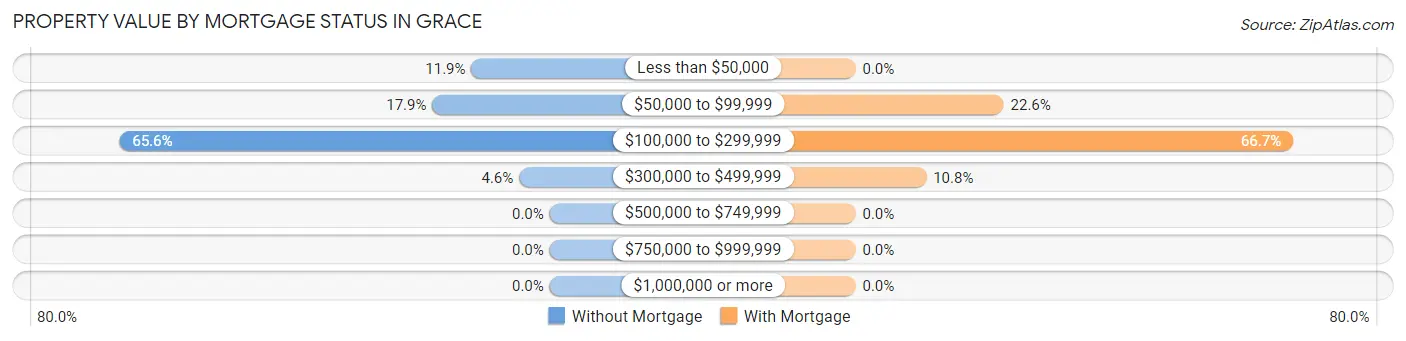
| Property Value | Without Mortgage | With Mortgage |
| Less than $50,000 | 18 (11.9%) | 0 (0.0%) |
| $50,000 to $99,999 | 27 (17.9%) | 44 (22.6%) |
| $100,000 to $299,999 | 99 (65.6%) | 130 (66.7%) |
| $300,000 to $499,999 | 7 (4.6%) | 21 (10.8%) |
| $500,000 to $749,999 | 0 (0.0%) | 0 (0.0%) |
| $750,000 to $999,999 | 0 (0.0%) | 0 (0.0%) |
| $1,000,000 or more | 0 (0.0%) | 0 (0.0%) |
| Total | 151 (100.0%) | 195 (100.0%) |
Household Income by Mortgage Status in Grace
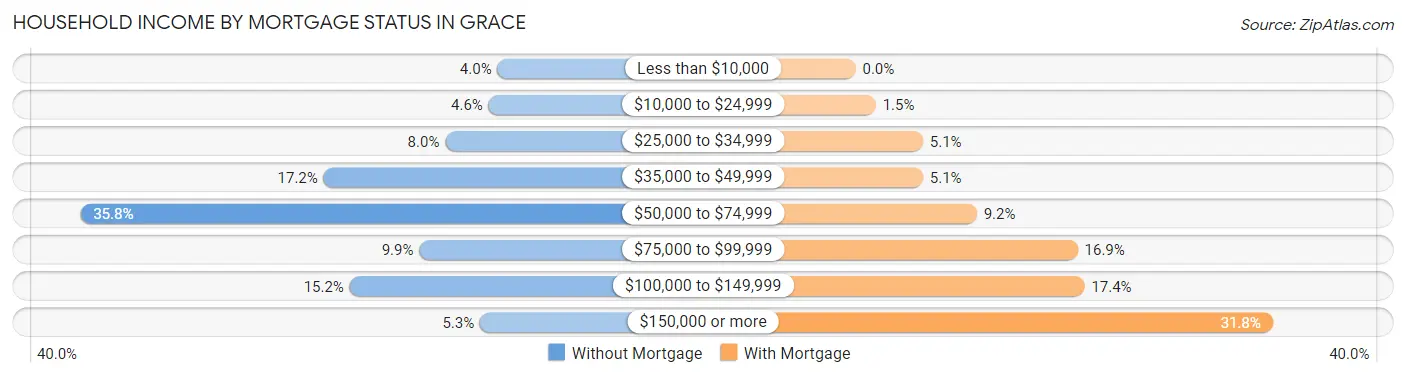
| Household Income | Without Mortgage | With Mortgage |
| Less than $10,000 | 6 (4.0%) | 0 (0.0%) |
| $10,000 to $24,999 | 7 (4.6%) | 3 (1.5%) |
| $25,000 to $34,999 | 12 (8.0%) | 10 (5.1%) |
| $35,000 to $49,999 | 26 (17.2%) | 10 (5.1%) |
| $50,000 to $74,999 | 54 (35.8%) | 18 (9.2%) |
| $75,000 to $99,999 | 15 (9.9%) | 33 (16.9%) |
| $100,000 to $149,999 | 23 (15.2%) | 34 (17.4%) |
| $150,000 or more | 8 (5.3%) | 62 (31.8%) |
| Total | 151 (100.0%) | 195 (100.0%) |
Property Value to Household Income Ratio in Grace
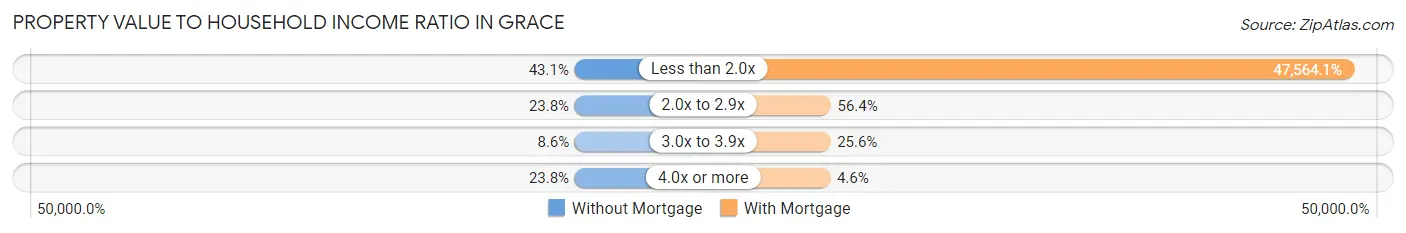
| Value-to-Income Ratio | Without Mortgage | With Mortgage |
| Less than 2.0x | 65 (43.0%) | 92,750 (47,564.1%) |
| 2.0x to 2.9x | 36 (23.8%) | 110 (56.4%) |
| 3.0x to 3.9x | 13 (8.6%) | 50 (25.6%) |
| 4.0x or more | 36 (23.8%) | 9 (4.6%) |
| Total | 151 (100.0%) | 195 (100.0%) |
Real Estate Taxes by Mortgage Status in Grace
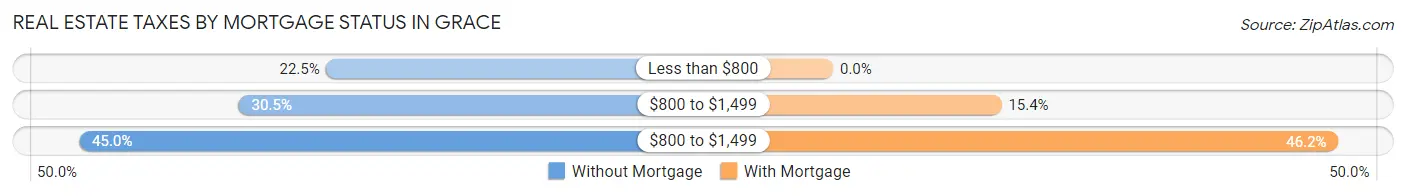
| Property Taxes | Without Mortgage | With Mortgage |
| Less than $800 | 34 (22.5%) | 0 (0.0%) |
| $800 to $1,499 | 46 (30.5%) | 30 (15.4%) |
| $800 to $1,499 | 68 (45.0%) | 90 (46.2%) |
| Total | 151 (100.0%) | 195 (100.0%) |
Health & Disability in Grace
Health Insurance Coverage by Age in Grace
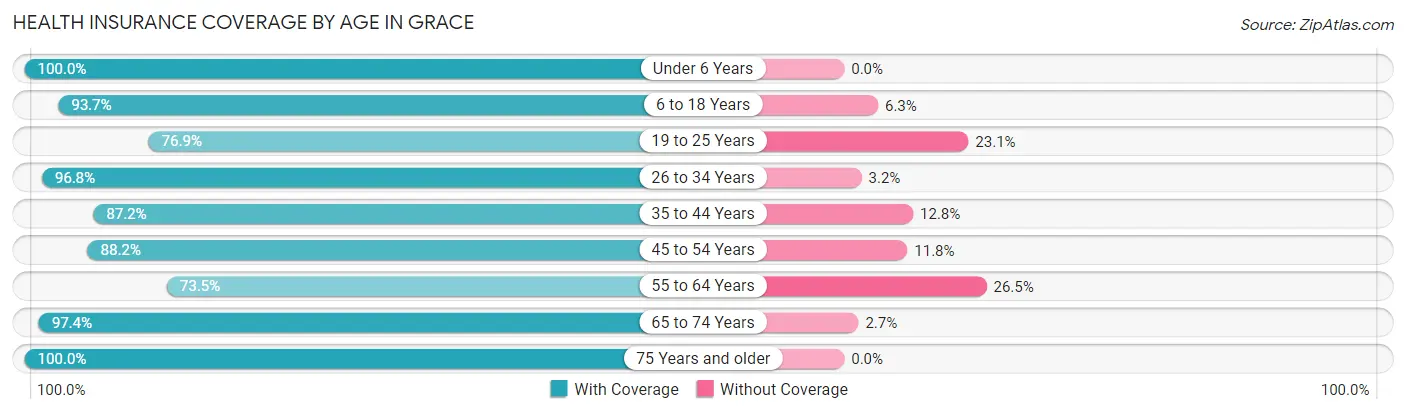
| Age Bracket | With Coverage | Without Coverage |
| Under 6 Years | 114 (100.0%) | 0 (0.0%) |
| 6 to 18 Years | 328 (93.7%) | 22 (6.3%) |
| 19 to 25 Years | 93 (76.9%) | 28 (23.1%) |
| 26 to 34 Years | 90 (96.8%) | 3 (3.2%) |
| 35 to 44 Years | 163 (87.2%) | 24 (12.8%) |
| 45 to 54 Years | 255 (88.2%) | 34 (11.8%) |
| 55 to 64 Years | 72 (73.5%) | 26 (26.5%) |
| 65 to 74 Years | 110 (97.4%) | 3 (2.6%) |
| 75 Years and older | 48 (100.0%) | 0 (0.0%) |
| Total | 1,273 (90.1%) | 140 (9.9%) |
Health Insurance Coverage by Citizenship Status in Grace
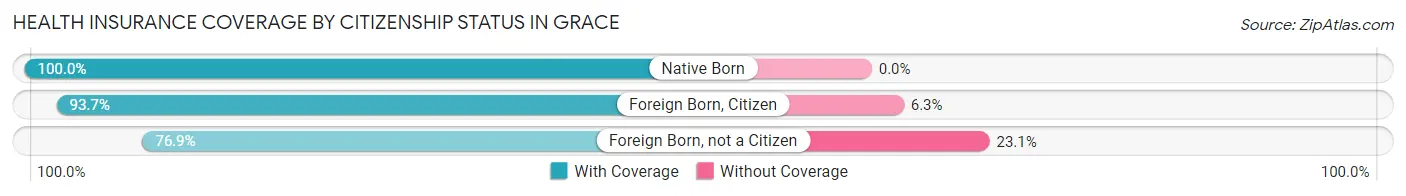
| Citizenship Status | With Coverage | Without Coverage |
| Native Born | 114 (100.0%) | 0 (0.0%) |
| Foreign Born, Citizen | 328 (93.7%) | 22 (6.3%) |
| Foreign Born, not a Citizen | 93 (76.9%) | 28 (23.1%) |
Health Insurance Coverage by Household Income in Grace
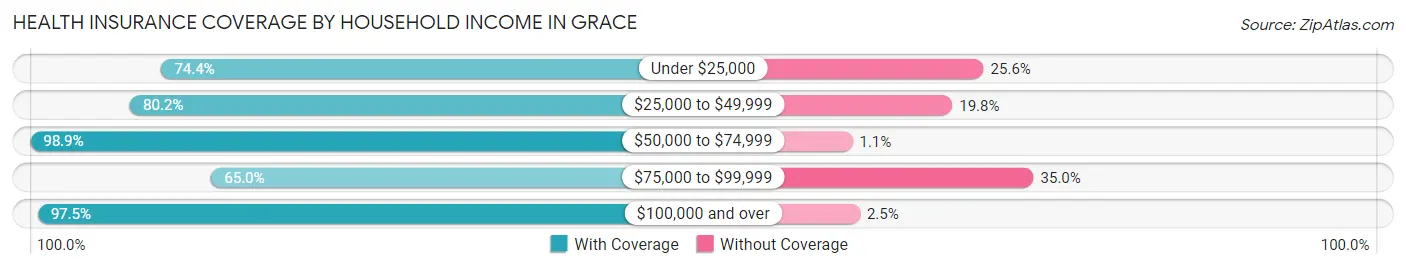
| Household Income | With Coverage | Without Coverage |
| Under $25,000 | 29 (74.4%) | 10 (25.6%) |
| $25,000 to $49,999 | 138 (80.2%) | 34 (19.8%) |
| $50,000 to $74,999 | 369 (98.9%) | 4 (1.1%) |
| $75,000 to $99,999 | 143 (65.0%) | 77 (35.0%) |
| $100,000 and over | 594 (97.5%) | 15 (2.5%) |
Public vs Private Health Insurance Coverage by Age in Grace
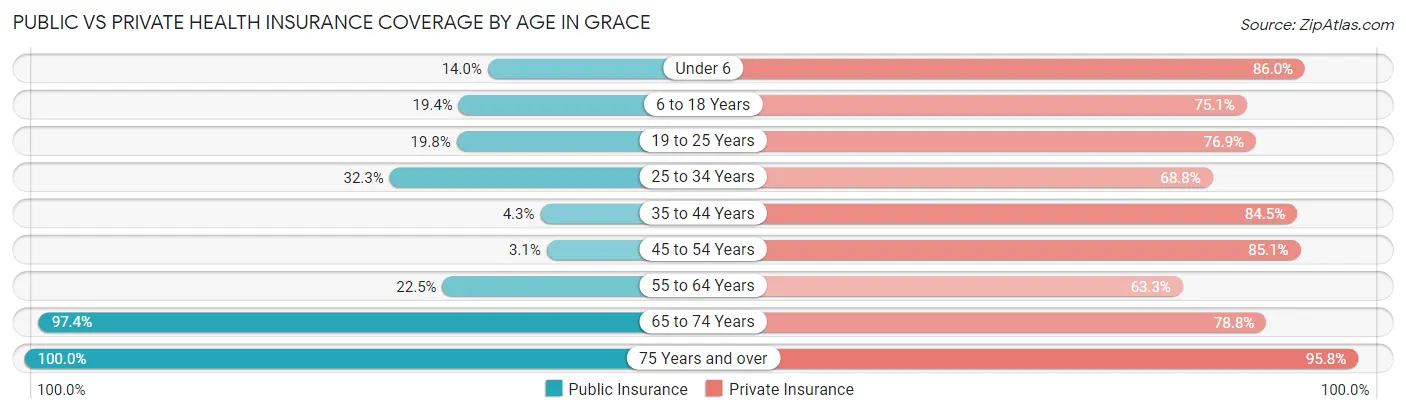
| Age Bracket | Public Insurance | Private Insurance |
| Under 6 | 16 (14.0%) | 98 (86.0%) |
| 6 to 18 Years | 68 (19.4%) | 263 (75.1%) |
| 19 to 25 Years | 24 (19.8%) | 93 (76.9%) |
| 25 to 34 Years | 30 (32.3%) | 64 (68.8%) |
| 35 to 44 Years | 8 (4.3%) | 158 (84.5%) |
| 45 to 54 Years | 9 (3.1%) | 246 (85.1%) |
| 55 to 64 Years | 22 (22.5%) | 62 (63.3%) |
| 65 to 74 Years | 110 (97.4%) | 89 (78.8%) |
| 75 Years and over | 48 (100.0%) | 46 (95.8%) |
| Total | 335 (23.7%) | 1,119 (79.2%) |
Disability Status by Sex by Age in Grace
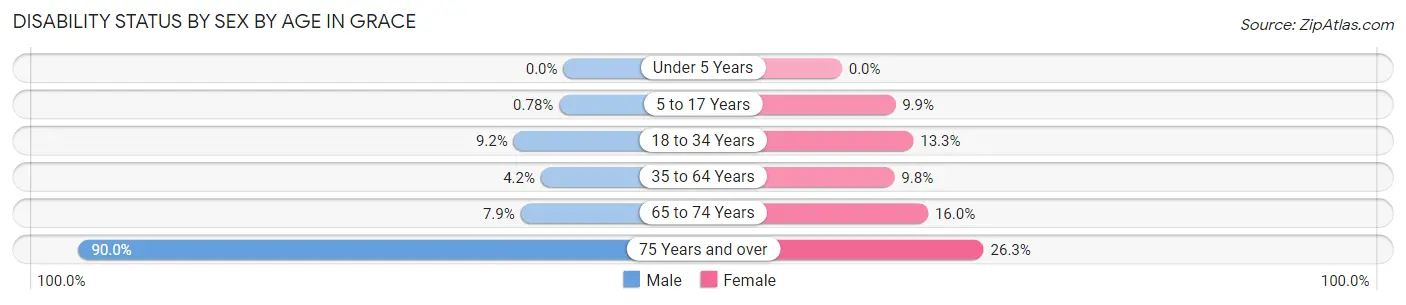
| Age Bracket | Male | Female |
| Under 5 Years | 0 (0.0%) | 0 (0.0%) |
| 5 to 17 Years | 2 (0.8%) | 12 (9.9%) |
| 18 to 34 Years | 11 (9.2%) | 13 (13.3%) |
| 35 to 64 Years | 15 (4.2%) | 21 (9.8%) |
| 65 to 74 Years | 5 (7.9%) | 8 (16.0%) |
| 75 Years and over | 9 (90.0%) | 10 (26.3%) |
Disability Class by Sex by Age in Grace
Disability Class: Hearing Difficulty
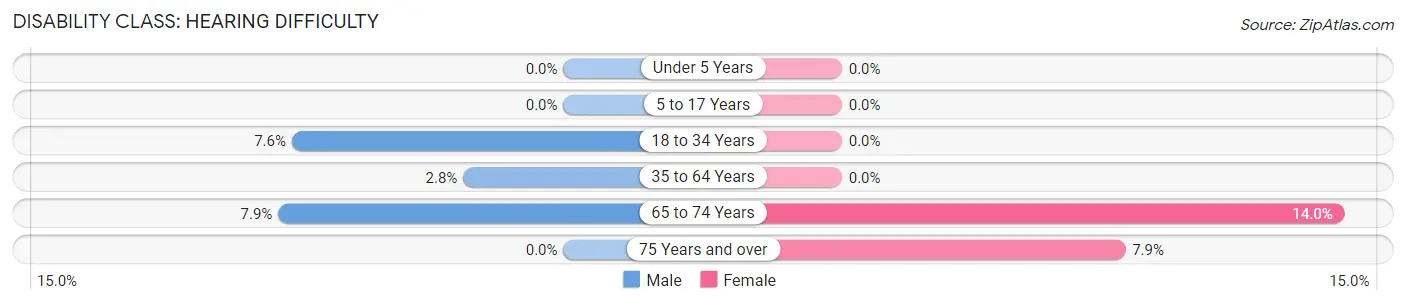
| Age Bracket | Male | Female |
| Under 5 Years | 0 (0.0%) | 0 (0.0%) |
| 5 to 17 Years | 0 (0.0%) | 0 (0.0%) |
| 18 to 34 Years | 9 (7.6%) | 0 (0.0%) |
| 35 to 64 Years | 10 (2.8%) | 0 (0.0%) |
| 65 to 74 Years | 5 (7.9%) | 7 (14.0%) |
| 75 Years and over | 0 (0.0%) | 3 (7.9%) |
Disability Class: Vision Difficulty
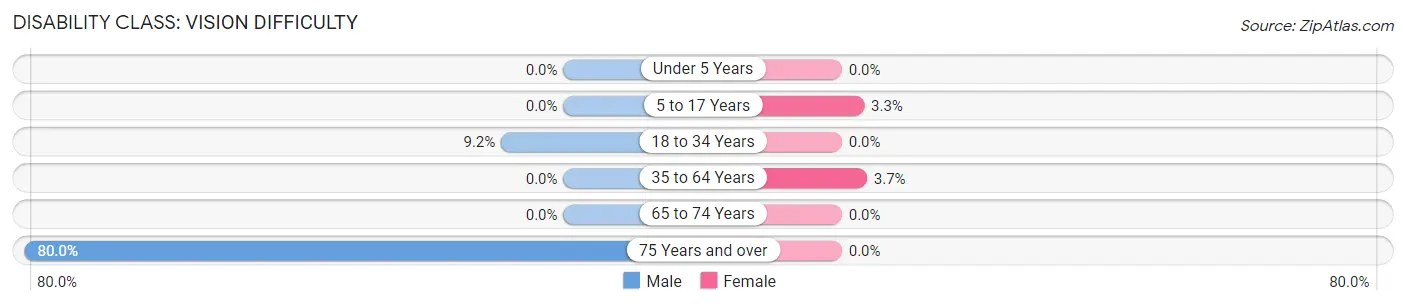
| Age Bracket | Male | Female |
| Under 5 Years | 0 (0.0%) | 0 (0.0%) |
| 5 to 17 Years | 0 (0.0%) | 4 (3.3%) |
| 18 to 34 Years | 11 (9.2%) | 0 (0.0%) |
| 35 to 64 Years | 0 (0.0%) | 8 (3.7%) |
| 65 to 74 Years | 0 (0.0%) | 0 (0.0%) |
| 75 Years and over | 8 (80.0%) | 0 (0.0%) |
Disability Class: Cognitive Difficulty
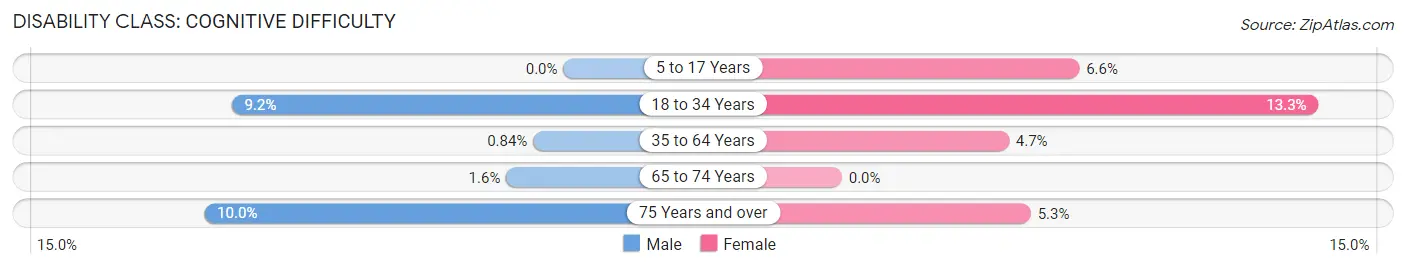
| Age Bracket | Male | Female |
| 5 to 17 Years | 0 (0.0%) | 8 (6.6%) |
| 18 to 34 Years | 11 (9.2%) | 13 (13.3%) |
| 35 to 64 Years | 3 (0.8%) | 10 (4.6%) |
| 65 to 74 Years | 1 (1.6%) | 0 (0.0%) |
| 75 Years and over | 1 (10.0%) | 2 (5.3%) |
Disability Class: Ambulatory Difficulty
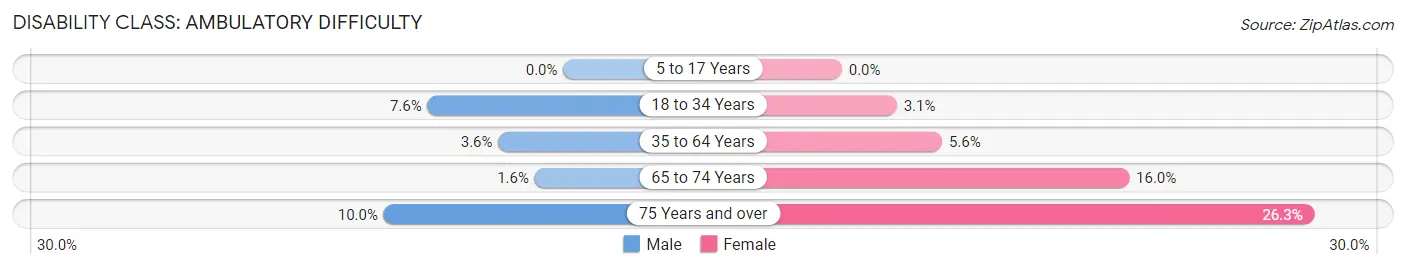
| Age Bracket | Male | Female |
| 5 to 17 Years | 0 (0.0%) | 0 (0.0%) |
| 18 to 34 Years | 9 (7.6%) | 3 (3.1%) |
| 35 to 64 Years | 13 (3.6%) | 12 (5.6%) |
| 65 to 74 Years | 1 (1.6%) | 8 (16.0%) |
| 75 Years and over | 1 (10.0%) | 10 (26.3%) |
Disability Class: Self-Care Difficulty
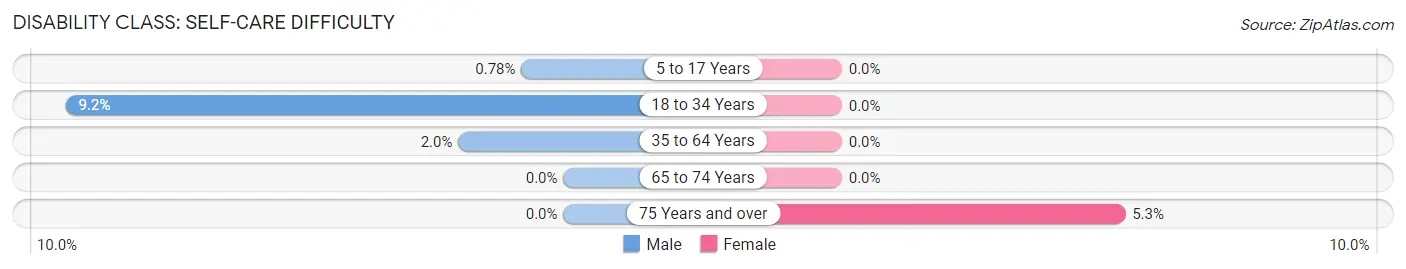
| Age Bracket | Male | Female |
| 5 to 17 Years | 2 (0.8%) | 0 (0.0%) |
| 18 to 34 Years | 11 (9.2%) | 0 (0.0%) |
| 35 to 64 Years | 7 (1.9%) | 0 (0.0%) |
| 65 to 74 Years | 0 (0.0%) | 0 (0.0%) |
| 75 Years and over | 0 (0.0%) | 2 (5.3%) |
Technology Access in Grace
Computing Device Access in Grace
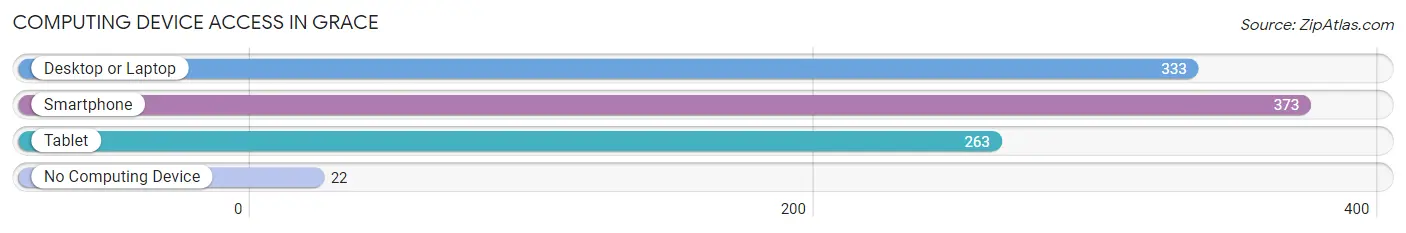
| Device Type | # Households | % Households |
| Desktop or Laptop | 333 | 81.8% |
| Smartphone | 373 | 91.6% |
| Tablet | 263 | 64.6% |
| No Computing Device | 22 | 5.4% |
| Total | 407 | 100.0% |
Internet Access in Grace
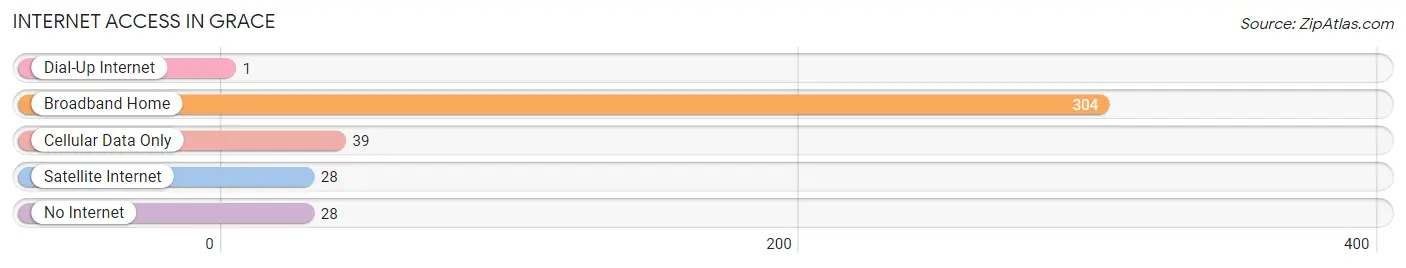
| Internet Type | # Households | % Households |
| Dial-Up Internet | 1 | 0.3% |
| Broadband Home | 304 | 74.7% |
| Cellular Data Only | 39 | 9.6% |
| Satellite Internet | 28 | 6.9% |
| No Internet | 28 | 6.9% |
| Total | 407 | 100.0% |
Grace Summary
History
Grace is a small city located in the state of Idaho in the United States. It was founded in 1883 by a group of Mormon settlers who were looking for a place to settle and practice their faith. The city was named after the daughter of one of the settlers, Grace Smith.
The city of Grace has a rich history that dates back to the early days of the Mormon settlement. In 1884, the first school was established in the city and the first church was built in 1885. The city was incorporated in 1887 and the first mayor was elected in 1888.
The city of Grace has seen many changes over the years. In the early 1900s, the city was a major agricultural center and was home to many dairy farms. In the 1950s, the city began to experience a population boom as many people moved to the area to take advantage of the booming economy.
Today, Grace is a thriving city with a population of over 5,000 people. The city is home to a variety of businesses, including a large number of retail stores, restaurants, and other services.
Geography
Grace is located in the northern part of Idaho, in the Snake River Valley. The city is situated on the banks of the Snake River, which is the largest river in the state. The city is surrounded by rolling hills and mountains, and is located near the Idaho-Oregon border.
The climate in Grace is generally mild, with temperatures ranging from the low 30s in the winter to the high 80s in the summer. The city receives an average of 18 inches of precipitation each year, with most of it falling in the form of snow during the winter months.
Economy
The economy of Grace is largely based on agriculture and tourism. The city is home to a number of dairy farms, as well as a variety of other agricultural businesses. The city is also home to a number of retail stores, restaurants, and other services.
The city is also home to a number of tourist attractions, including the Snake River Canyon, the Snake River National Wildlife Refuge, and the Snake River State Park. These attractions draw visitors from all over the country, and help to boost the local economy.
Demographics
As of the 2010 census, the population of Grace was 5,093. The racial makeup of the city was 95.3% White, 0.7% African American, 0.4% Native American, 0.3% Asian, 0.1% Pacific Islander, 1.2% from other races, and 2.1% from two or more races. Hispanic or Latino of any race were 3.2% of the population.
The median income for a household in Grace was $37,917, and the median income for a family was $45,938. The per capita income for the city was $18,945. About 11.2% of families and 14.2% of the population were below the poverty line, including 18.2% of those under age 18 and 8.2% of those age 65 or over.
Common Questions
What is the Total Population of Grace?
Total Population of Grace is 1,413.
What is the Total Male Population of Grace?
Total Male Population of Grace is 853.
What is the Total Female Population of Grace?
Total Female Population of Grace is 560.
What is the Ratio of Males per 100 Females in Grace?
There are 152.32 Males per 100 Females in Grace.
What is the Ratio of Females per 100 Males in Grace?
There are 65.65 Females per 100 Males in Grace.
What is the Median Population Age in Grace?
Median Population Age in Grace is 35.8 Years.
What is the Average Family Size in Grace
Average Family Size in Grace is 4.2 People.
What is the Average Household Size in Grace
Average Household Size in Grace is 3.5 People.
What is Per Capita Income in Grace?
Per Capita income in Grace is $30,410.
What is the Median Family Income in Grace?
Median Family Income in Grace is $76,818.
What is the Median Household income in Grace?
Median Household Income in Grace is $69,858.
What is Income or Wage Gap in Grace?
Income or Wage Gap in Grace is 66.3%.
Women in Grace earn 33.7 cents for every dollar earned by a man.
What is Family Income Deficit in Grace?
Family Income Deficit in Grace is $8,717.
Families that are below poverty line in Grace earn $8,717 less on average than the poverty threshold level.
What is Inequality or Gini Index in Grace?
Inequality or Gini Index in Grace is 0.33.
How Large is the Labor Force in Grace?
There are 705 People in the Labor Forcein in Grace.
What is the Percentage of People in the Labor Force in Grace?
64.0% of People are in the Labor Force in Grace.
What is the Unemployment Rate in Grace?
Unemployment Rate in Grace is 2.6%.