Cities with the Highest Percentage of Greek Population in Idaho

RELATED REPORTS & OPTIONS

Greek
Population
Families and Households
Female Fertility
Female Fertility (Unmarried)
Race (Community Size)
Race (Percentage)
Ancestry (Community Size)
AfghanAfricanAlaska NativeAlaskan AthabascanAlbanianAleutAlsatianAmericanApacheArabArapahoArgentineanArmenianAssyrian / Chaldean / SyriacAustralianAustrianBahamianBangladeshiBarbadianBasqueBelgianBelizeanBermudanBhutaneseBlackfeetBolivianBrazilianBritishBritish West IndianBulgarianBurmeseCajunCambodianCanadianCape VerdeanCarpatho RusynCelticCentral AmericanCentral American IndianCherokeeCheyenneChickasawChileanChineseChippewaChoctawColombianColvilleComancheCosta RicanCreeCreekCroatianCrowCubanCypriotCzechCzechoslovakianDanishDelawareDominicanDutchDutch West IndianEastern EuropeanEcuadorianEgyptianEnglishEstonianEthiopianEuropeanFijianFilipinoFinnishFrenchFrench American IndianFrench CanadianGermanGerman RussianGhanaianGreekGuamanian / ChamorroGuatemalanGuyaneseHaitianHmongHonduranHopiHoumaHungarianIcelanderIndian (Asian)IndonesianInupiatIranianIraqiIrishIroquoisIsraeliItalianJamaicanJapaneseJordanianKenyanKiowaKoreanLaotianLatvianLebaneseLiberianLithuanianLumbeeLuxembourgerMacedonianMalaysianMalteseMarshalleseMenomineeMexicanMexican American IndianMongolianMoroccanNative HawaiianNavajoNepaleseNew ZealanderNicaraguanNigerianNorthern EuropeanNorwegianOkinawanOsageOttawaPaiutePakistaniPalestinianPanamanianParaguayanPennsylvania GermanPeruvianPimaPolishPortuguesePotawatomiPuebloPuerto RicanPuget Sound SalishRomanianRussianSalvadoranSamoanScandinavianScotch-IrishScottishSeminoleSenegaleseSerbianShoshoneSierra LeoneanSiouxSlavicSlovakSloveneSomaliSouth AfricanSouth AmericanSouth American IndianSoviet UnionSpaniardSpanishSpanish AmericanSpanish American IndianSri LankanSubsaharan AfricanSudaneseSwedishSwissSyrianTaiwaneseThaiTlingit-HaidaTohono O'OdhamTonganTrinidadian and TobagonianTsimshianTurkishU.S. Virgin IslanderUgandanUkrainianUruguayanUteVenezuelanVietnameseWelshWest IndianYakamaYaquiYugoslavianYumanYup'ikZimbabwean
Ancestry (Percentage)
AfghanAfricanAlaska NativeAlaskan AthabascanAlbanianAleutAlsatianAmericanApacheArabArapahoArgentineanArmenianAssyrian / Chaldean / SyriacAustralianAustrianBahamianBangladeshiBarbadianBasqueBelgianBelizeanBermudanBhutaneseBlackfeetBolivianBrazilianBritishBritish West IndianBulgarianBurmeseCajunCambodianCanadianCape VerdeanCarpatho RusynCelticCentral AmericanCentral American IndianCherokeeCheyenneChickasawChileanChineseChippewaChoctawColombianColvilleComancheCosta RicanCreeCreekCroatianCrowCubanCypriotCzechCzechoslovakianDanishDelawareDominicanDutchDutch West IndianEastern EuropeanEcuadorianEgyptianEnglishEstonianEthiopianEuropeanFijianFilipinoFinnishFrenchFrench American IndianFrench CanadianGermanGerman RussianGhanaianGreekGuamanian / ChamorroGuatemalanGuyaneseHaitianHmongHonduranHopiHoumaHungarianIcelanderIndian (Asian)IndonesianInupiatIranianIraqiIrishIroquoisIsraeliItalianJamaicanJapaneseJordanianKenyanKiowaKoreanLaotianLatvianLebaneseLiberianLithuanianLumbeeLuxembourgerMacedonianMalaysianMalteseMarshalleseMenomineeMexicanMexican American IndianMongolianMoroccanNative HawaiianNavajoNepaleseNew ZealanderNicaraguanNigerianNorthern EuropeanNorwegianOkinawanOsageOttawaPaiutePakistaniPalestinianPanamanianParaguayanPennsylvania GermanPeruvianPimaPolishPortuguesePotawatomiPuebloPuerto RicanPuget Sound SalishRomanianRussianSalvadoranSamoanScandinavianScotch-IrishScottishSeminoleSenegaleseSerbianShoshoneSierra LeoneanSiouxSlavicSlovakSloveneSomaliSouth AfricanSouth AmericanSouth American IndianSoviet UnionSpaniardSpanishSpanish AmericanSpanish American IndianSri LankanSubsaharan AfricanSudaneseSwedishSwissSyrianTaiwaneseThaiTlingit-HaidaTohono O'OdhamTonganTrinidadian and TobagonianTsimshianTurkishU.S. Virgin IslanderUgandanUkrainianUruguayanUteVenezuelanVietnameseWelshWest IndianYakamaYaquiYugoslavianYumanYup'ikZimbabwean
Immigrant Origin (Total)
AfghanistanAfricaAlbaniaArgentinaArmeniaAsiaAustraliaAustriaAzoresBahamasBangladeshBarbadosBelarusBelgiumBelizeBoliviaBosnia and HerzegovinaBrazilBulgariaBurma / MyanmarCabo VerdeCambodiaCameroonCanadaCaribbeanCentral AmericaChileChinaColombiaCongoCosta RicaCroatiaCubaCzechoslovakiaDenmarkDominicaDominican RepublicEastern AfricaEastern AsiaEastern EuropeEcuadorEgyptEl SalvadorEnglandEritreaEthiopiaEuropeFijiFranceGermanyGhanaGreeceGrenadaGuatemalaGuyanaHaitiHondurasHong KongHungaryIndiaIndonesiaIranIraqIrelandIsraelItalyJamaicaJapanJordanKazakhstanKenyaKoreaKuwaitLaosLatin AmericaLatviaLebanonLiberiaLithuaniaMalaysiaMexicoMicronesiaMiddle AfricaMoldovaMoroccoNepalNetherlandsNicaraguaNigeriaNorth MacedoniaNorthern AfricaNorthern EuropeNorwayOceaniaPakistanPanamaPeruPhilippinesPolandPortugalRomaniaRussiaSaudi ArabiaScotlandSenegalSerbiaSierra LeoneSingaporeSomaliaSouth AfricaSouth AmericaSouth Central AsiaSouth Eastern AsiaSouthern EuropeSpainSri LankaSt. Vincent and the GrenadinesSudanSwedenSwitzerlandSyriaTaiwanThailandTrinidad and TobagoTurkeyUgandaUkraineUruguayUzbekistanVenezuelaVietnamWest IndiesWestern AfricaWestern AsiaWestern EuropeYemenZaireZimbabwe
Immigrant Origin (Percentage)
AfghanistanAfricaAlbaniaArgentinaArmeniaAsiaAustraliaAustriaAzoresBahamasBangladeshBarbadosBelarusBelgiumBelizeBoliviaBosnia and HerzegovinaBrazilBulgariaBurma / MyanmarCabo VerdeCambodiaCameroonCanadaCaribbeanCentral AmericaChileChinaColombiaCongoCosta RicaCroatiaCubaCzechoslovakiaDenmarkDominicaDominican RepublicEastern AfricaEastern AsiaEastern EuropeEcuadorEgyptEl SalvadorEnglandEritreaEthiopiaEuropeFijiFranceGermanyGhanaGreeceGrenadaGuatemalaGuyanaHaitiHondurasHong KongHungaryIndiaIndonesiaIranIraqIrelandIsraelItalyJamaicaJapanJordanKazakhstanKenyaKoreaKuwaitLaosLatin AmericaLatviaLebanonLiberiaLithuaniaMalaysiaMexicoMicronesiaMiddle AfricaMoldovaMoroccoNepalNetherlandsNicaraguaNigeriaNorth MacedoniaNorthern AfricaNorthern EuropeNorwayOceaniaPakistanPanamaPeruPhilippinesPolandPortugalRomaniaRussiaSaudi ArabiaScotlandSenegalSerbiaSierra LeoneSingaporeSomaliaSouth AfricaSouth AmericaSouth Central AsiaSouth Eastern AsiaSouthern EuropeSpainSri LankaSt. Vincent and the GrenadinesSudanSwedenSwitzerlandSyriaTaiwanThailandTrinidad and TobagoTurkeyUgandaUkraineUruguayUzbekistanVenezuelaVietnamWest IndiesWestern AfricaWestern AsiaWestern EuropeYemenZaireZimbabwe
Income
Income (Families)
Income (Households)
Poverty
Poverty (Families)
Unemployment
Employment Occupations
Employment Industries
Employer Class
Commute Time
Commute Means
School Enrollment
Education by Degree Field
Occupancy
Finances
Physical Characteristics
Idaho
Compare Cities
Comparison Subject

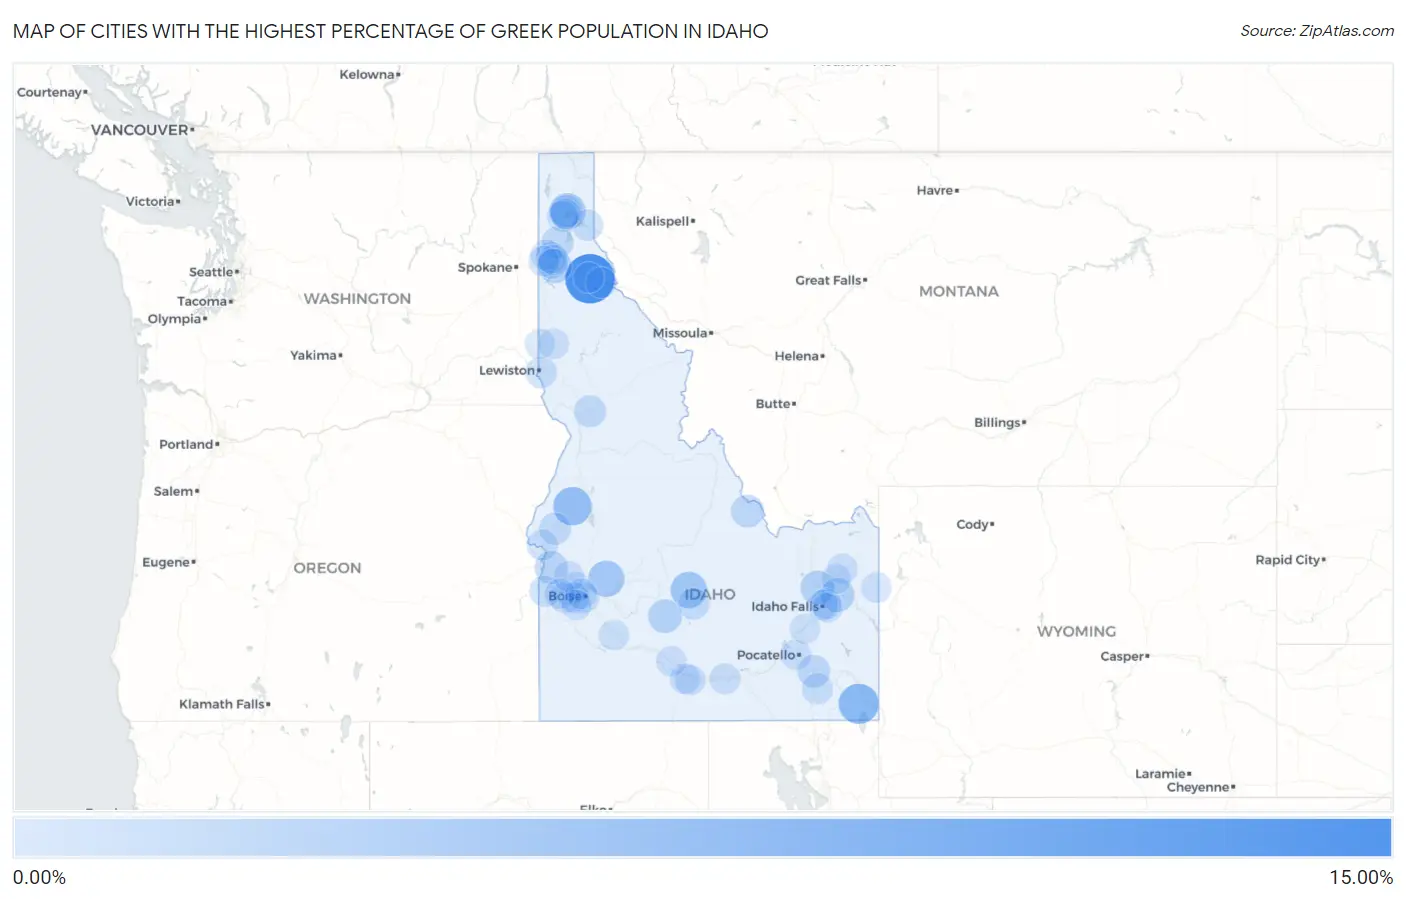
Map of Cities with the Highest Percentage of Greek Population in Idaho

0.00%
15.00%
Cities with the Highest Percentage of Greek Population in Idaho Map

Cities with the Highest Percentage of Greek Population in Idaho

City Greek vs State vs National
1.Wardner11.82%0.26%(+11.6)#10.37%(+11.4)#32
2.Paris5.91%0.26%(+5.65)#20.37%(+5.54)#123
3.Council4.89%0.26%(+4.62)#30.37%(+4.51)#195
4.Ketchum3.70%0.26%(+3.43)#40.37%(+3.32)#311
5.Idaho City3.57%0.26%(+3.30)#50.37%(+3.19)#334
6.Kootenai3.47%0.26%(+3.21)#60.37%(+3.10)#349
7.Fernan Lake Village2.22%0.26%(+1.96)#70.37%(+1.85)#728
8.Roberts2.17%0.26%(+1.91)#80.37%(+1.80)#751
9.Fairfield2.16%0.26%(+1.90)#90.37%(+1.79)#757
10.Ririe2.12%0.26%(+1.86)#100.37%(+1.75)#782
11.New Plymouth1.58%0.26%(+1.32)#110.37%(+1.21)#1,213
12.Leadore1.52%0.26%(+1.25)#120.37%(+1.14)#1,292
13.Mccammon1.38%0.26%(+1.11)#130.37%(+1.01)#1,472
14.Ponderay1.24%0.26%(+0.978)#140.37%(+0.870)#1,678
15.Midvale1.10%0.26%(+0.835)#150.37%(+0.727)#1,919
16.Grangeville1.07%0.26%(+0.805)#160.37%(+0.697)#1,983
17.Athol1.01%0.26%(+0.749)#170.37%(+0.641)#2,101
18.Hayden0.81%0.26%(+0.545)#180.37%(+0.437)#2,679
19.Hailey0.77%0.26%(+0.505)#190.37%(+0.397)#2,844
20.Clark Fork0.73%0.26%(+0.463)#200.37%(+0.355)#2,985
21.Lewiston0.72%0.26%(+0.454)#210.37%(+0.346)#3,020
22.Wilder0.66%0.26%(+0.394)#220.37%(+0.286)#3,227
23.Downey0.62%0.26%(+0.356)#230.37%(+0.249)#3,395
24.Weiser0.56%0.26%(+0.300)#240.37%(+0.192)#3,705
25.Dover0.56%0.26%(+0.292)#250.37%(+0.184)#3,752
26.Eagle0.49%0.26%(+0.222)#260.37%(+0.115)#4,172
27.Heyburn0.47%0.26%(+0.203)#270.37%(+0.095)#4,307
28.Nampa0.46%0.26%(+0.199)#280.37%(+0.091)#4,329
29.Rathdrum0.41%0.26%(+0.144)#290.37%(+0.037)#4,773
30.Wallace0.37%0.26%(+0.105)#300.37%(-0.002)#5,081
31.Boise City0.36%0.26%(+0.100)#310.37%(-0.008)#5,129
32.Kimberly0.34%0.26%(+0.077)#320.37%(-0.031)#5,301
33.Post Falls0.33%0.26%(+0.068)#330.37%(-0.039)#5,384
34.Meridian0.33%0.26%(+0.061)#340.37%(-0.046)#5,461
35.Emmett0.32%0.26%(+0.061)#350.37%(-0.047)#5,465
36.Troy0.32%0.26%(+0.053)#360.37%(-0.054)#5,530
37.Kellogg0.31%0.26%(+0.041)#370.37%(-0.066)#5,656
38.Lincoln0.30%0.26%(+0.038)#380.37%(-0.069)#5,685
39.Garden City0.29%0.26%(+0.029)#390.37%(-0.079)#5,782
40.Twin Falls0.28%0.26%(+0.011)#400.37%(-0.096)#5,974
41.Pocatello0.26%0.26%(-0.008)#410.37%(-0.115)#6,192
42.Wendell0.24%0.26%(-0.023)#420.37%(-0.130)#6,373
43.Dalton Gardens0.20%0.26%(-0.065)#430.37%(-0.172)#6,880
44.Caldwell0.20%0.26%(-0.068)#440.37%(-0.176)#6,919
45.St Anthony0.19%0.26%(-0.076)#450.37%(-0.184)#7,043
46.Kuna0.18%0.26%(-0.087)#460.37%(-0.194)#7,180
47.Sandpoint0.17%0.26%(-0.095)#470.37%(-0.203)#7,286
48.Driggs0.16%0.26%(-0.107)#480.37%(-0.215)#7,436
49.Idaho Falls0.15%0.26%(-0.113)#490.37%(-0.221)#7,513
50.Mountain Home0.15%0.26%(-0.114)#500.37%(-0.222)#7,523
51.Coeur D Alene0.13%0.26%(-0.134)#510.37%(-0.242)#7,750
52.Blackfoot0.13%0.26%(-0.134)#520.37%(-0.242)#7,752
53.Ammon0.11%0.26%(-0.158)#530.37%(-0.266)#8,031
54.Moscow0.059%0.26%(-0.205)#540.37%(-0.313)#8,506
55.Rexburg0.046%0.26%(-0.218)#550.37%(-0.325)#8,616

Common Questions

What are the Top 10 Cities with the Highest Percentage of Greek Population in Idaho?
Top 10 Cities with the Highest Percentage of Greek Population in Idaho are:
#1
11.82%
#2
5.91%
#3
4.89%
#4
3.70%
#5
3.57%
#6
3.47%
#7
2.22%
#8
2.17%
#9
2.16%
#10
2.12%
What city has the Highest Percentage of Greek Population in Idaho?
Wardner has the Highest Percentage of Greek Population in Idaho with 11.82%.
What is the Percentage of Greek Population in the State of Idaho?
Percentage of Greek Population in Idaho is 0.26%.
What is the Percentage of Greek Population in the United States?
Percentage of Greek Population in the United States is 0.37%.