Fairfield, ID
Fairfield Map
Fairfield Overview
463
TOTAL POPULATION
182
MALE POPULATION
281
FEMALE POPULATION
64.77
MALES / 100 FEMALES
154.40
FEMALES / 100 MALES
35.7
MEDIAN AGE
5.5
AVG FAMILY SIZE
3.6
AVG HOUSEHOLD SIZE
$38,473
PER CAPITA INCOME
$79,732
AVG FAMILY INCOME
$77,083
AVG HOUSEHOLD INCOME
0.44
INEQUALITY / GINI INDEX
205
LABOR FORCE [ PEOPLE ]
56.3%
PERCENT IN LABOR FORCE
12.7%
UNEMPLOYMENT RATE
Fairfield Zip Codes
Fairfield Area Codes
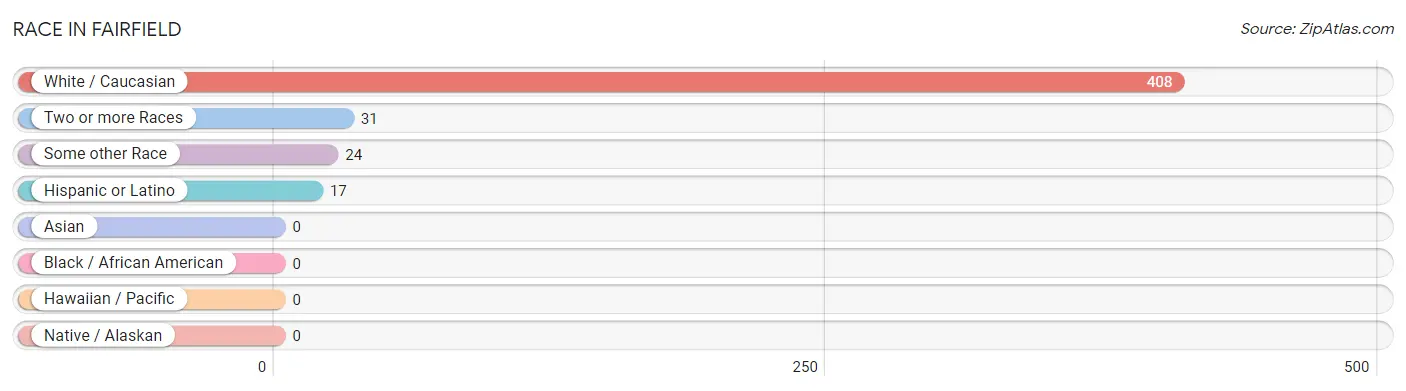
Race in Fairfield
The most populous races in Fairfield are White / Caucasian (408 | 88.1%), Two or more Races (31 | 6.7%), and Some other Race (24 | 5.2%).
| Race | # Population | % Population |
| Asian | 0 | 0.0% |
| Black / African American | 0 | 0.0% |
| Hawaiian / Pacific | 0 | 0.0% |
| Hispanic or Latino | 17 | 3.7% |
| Native / Alaskan | 0 | 0.0% |
| White / Caucasian | 408 | 88.1% |
| Two or more Races | 31 | 6.7% |
| Some other Race | 24 | 5.2% |
| Total | 463 | 100.0% |
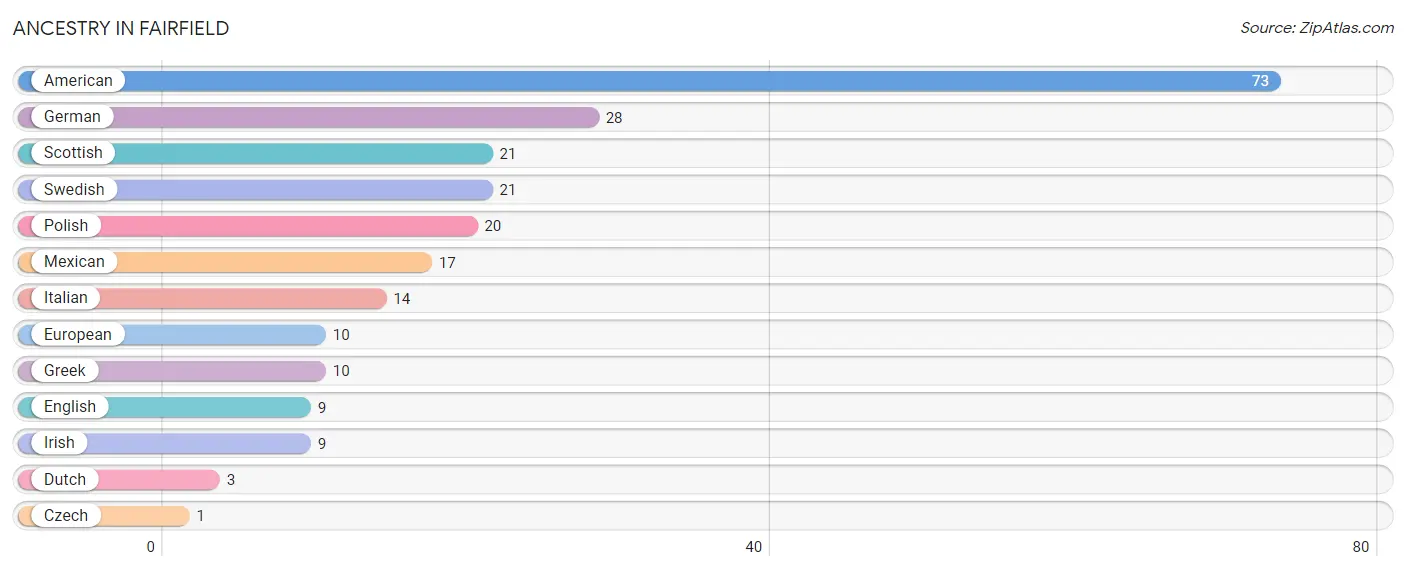
Ancestry in Fairfield
The most populous ancestries reported in Fairfield are American (73 | 15.8%), German (28 | 6.0%), Scottish (21 | 4.5%), Swedish (21 | 4.5%), and Polish (20 | 4.3%), together accounting for 35.2% of all Fairfield residents.
| Ancestry | # Population | % Population |
| American | 73 | 15.8% |
| Czech | 1 | 0.2% |
| Dutch | 3 | 0.6% |
| English | 9 | 1.9% |
| European | 10 | 2.2% |
| German | 28 | 6.0% |
| Greek | 10 | 2.2% |
| Irish | 9 | 1.9% |
| Italian | 14 | 3.0% |
| Mexican | 17 | 3.7% |
| Polish | 20 | 4.3% |
| Scottish | 21 | 4.5% |
| Swedish | 21 | 4.5% | View All 13 Rows |
Immigrants in Fairfield

| Immigration Origin | # Population | % Population | View All 0 Rows |
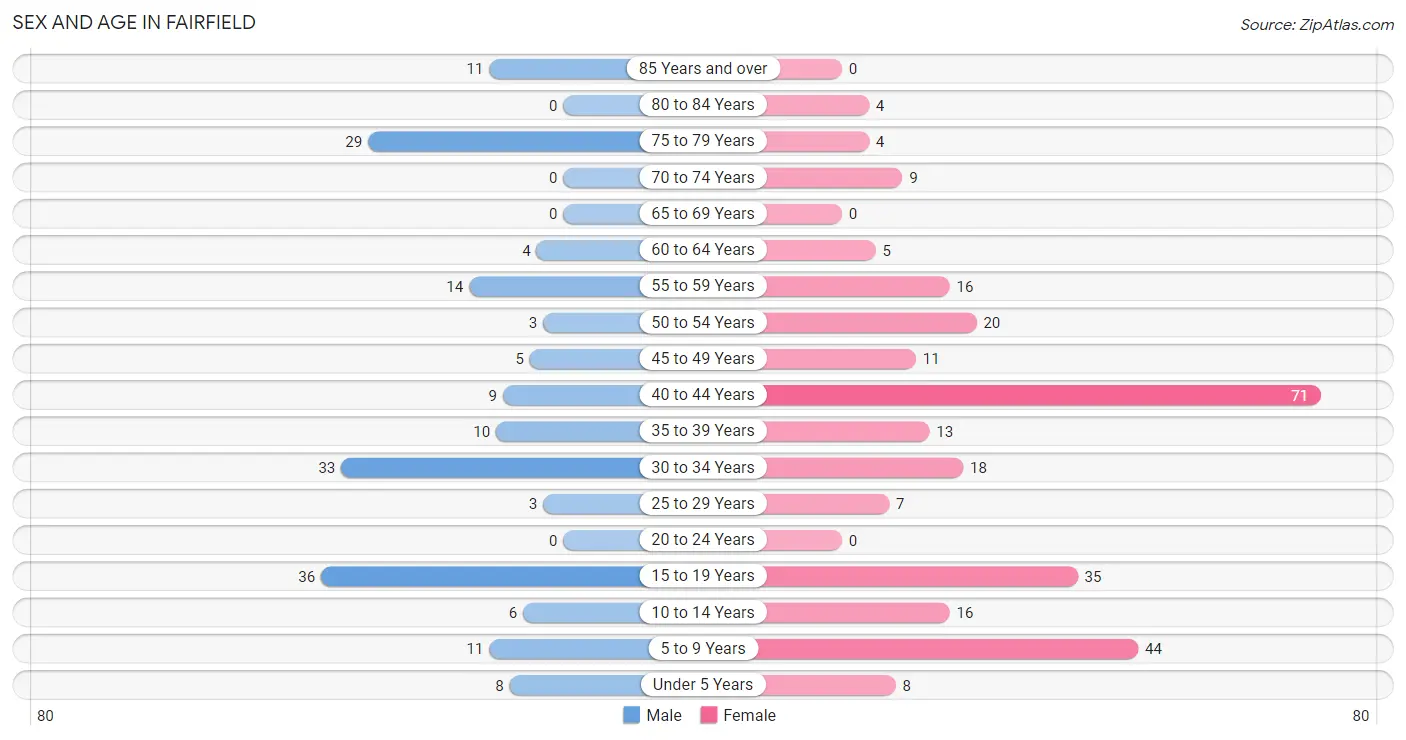
Sex and Age in Fairfield
Sex and Age in Fairfield
The most populous age groups in Fairfield are 15 to 19 Years (36 | 19.8%) for men and 40 to 44 Years (71 | 25.3%) for women.
| Age Bracket | Male | Female |
| Under 5 Years | 8 (4.4%) | 8 (2.9%) |
| 5 to 9 Years | 11 (6.0%) | 44 (15.7%) |
| 10 to 14 Years | 6 (3.3%) | 16 (5.7%) |
| 15 to 19 Years | 36 (19.8%) | 35 (12.5%) |
| 20 to 24 Years | 0 (0.0%) | 0 (0.0%) |
| 25 to 29 Years | 3 (1.7%) | 7 (2.5%) |
| 30 to 34 Years | 33 (18.1%) | 18 (6.4%) |
| 35 to 39 Years | 10 (5.5%) | 13 (4.6%) |
| 40 to 44 Years | 9 (5.0%) | 71 (25.3%) |
| 45 to 49 Years | 5 (2.8%) | 11 (3.9%) |
| 50 to 54 Years | 3 (1.7%) | 20 (7.1%) |
| 55 to 59 Years | 14 (7.7%) | 16 (5.7%) |
| 60 to 64 Years | 4 (2.2%) | 5 (1.8%) |
| 65 to 69 Years | 0 (0.0%) | 0 (0.0%) |
| 70 to 74 Years | 0 (0.0%) | 9 (3.2%) |
| 75 to 79 Years | 29 (15.9%) | 4 (1.4%) |
| 80 to 84 Years | 0 (0.0%) | 4 (1.4%) |
| 85 Years and over | 11 (6.0%) | 0 (0.0%) |
| Total | 182 (100.0%) | 281 (100.0%) |
Families and Households in Fairfield
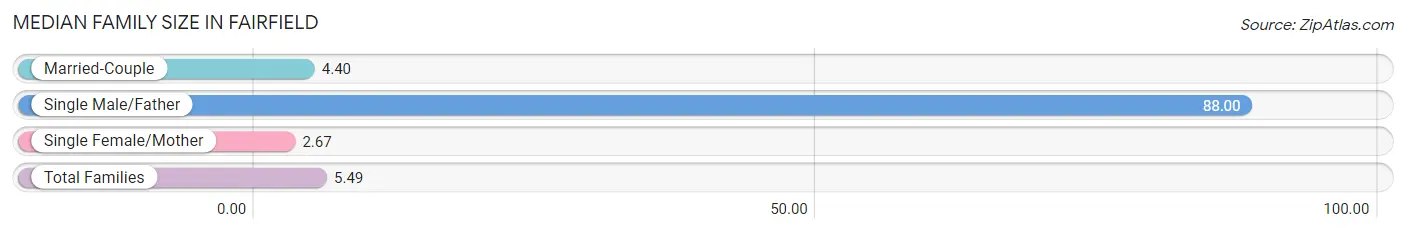
Median Family Size in Fairfield
The median family size in Fairfield is 5.49 persons per family, with single male/father families (1 | 1.5%) accounting for the largest median family size of 88 persons per family. On the other hand, single female/mother families (6 | 9.0%) represent the smallest median family size with 2.67 persons per family.
| Family Type | # Families | Family Size |
| Married-Couple | 60 (89.5%) | 4.40 |
| Single Male/Father | 1 (1.5%) | 88.00 |
| Single Female/Mother | 6 (9.0%) | 2.67 |
| Total Families | 67 (100.0%) | 5.49 |
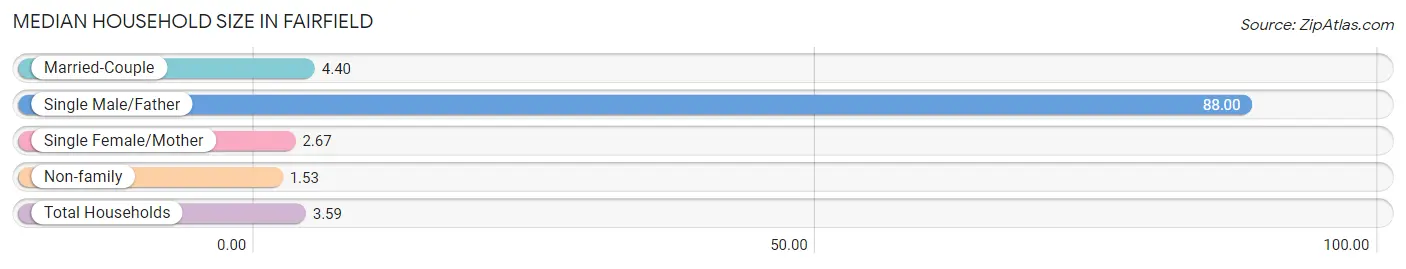
Median Household Size in Fairfield
The median household size in Fairfield is 3.59 persons per household, with single male/father households (1 | 0.8%) accounting for the largest median household size of 88 persons per household. non-family households (62 | 48.1%) represent the smallest median household size with 1.53 persons per household.
| Household Type | # Households | Household Size |
| Married-Couple | 60 (46.5%) | 4.40 |
| Single Male/Father | 1 (0.8%) | 88.00 |
| Single Female/Mother | 6 (4.6%) | 2.67 |
| Non-family | 62 (48.1%) | 1.53 |
| Total Households | 129 (100.0%) | 3.59 |
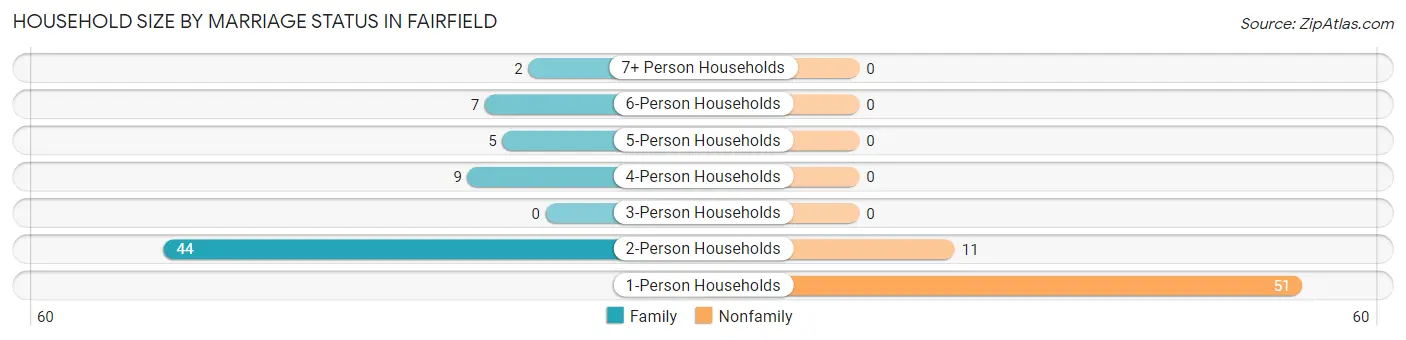
Household Size by Marriage Status in Fairfield
Out of a total of 129 households in Fairfield, 67 (51.9%) are family households, while 62 (48.1%) are nonfamily households. The most numerous type of family households are 2-person households, comprising 44, and the most common type of nonfamily households are 1-person households, comprising 51.
| Household Size | Family Households | Nonfamily Households |
| 1-Person Households | - | 51 (39.5%) |
| 2-Person Households | 44 (34.1%) | 11 (8.5%) |
| 3-Person Households | 0 (0.0%) | 0 (0.0%) |
| 4-Person Households | 9 (7.0%) | 0 (0.0%) |
| 5-Person Households | 5 (3.9%) | 0 (0.0%) |
| 6-Person Households | 7 (5.4%) | 0 (0.0%) |
| 7+ Person Households | 2 (1.5%) | 0 (0.0%) |
| Total | 67 (51.9%) | 62 (48.1%) |
Female Fertility in Fairfield
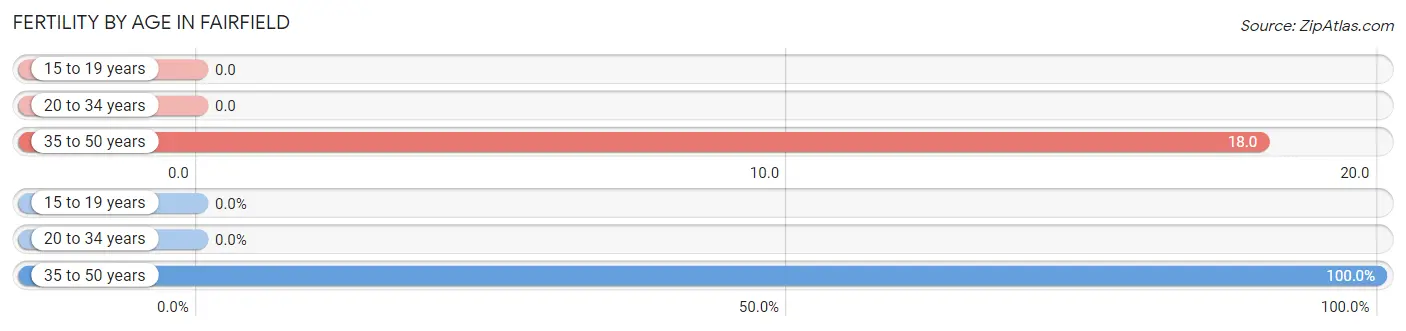
Fertility by Age in Fairfield
Average fertility rate in Fairfield is 12.0 births per 1,000 women. Women in the age bracket of 35 to 50 years have the highest fertility rate with 18.0 births per 1,000 women. Women in the age bracket of 35 to 50 years acount for 100.0% of all women with births.
| Age Bracket | Women with Births | Births / 1,000 Women |
| 15 to 19 years | 0 (0.0%) | 0.0 |
| 20 to 34 years | 0 (0.0%) | 0.0 |
| 35 to 50 years | 2 (100.0%) | 18.0 |
| Total | 2 (100.0%) | 12.0 |
Fertility by Age by Marriage Status in Fairfield
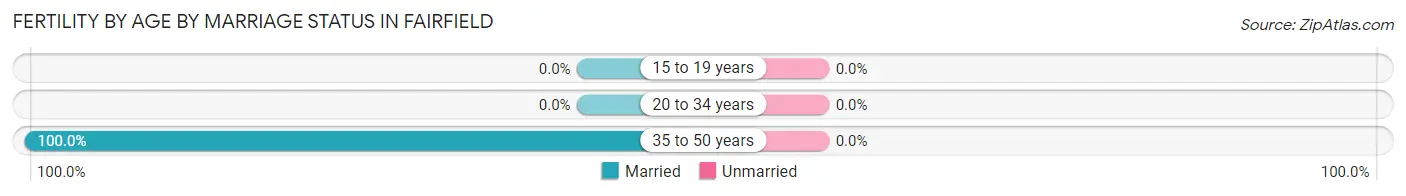
| Age Bracket | Married | Unmarried |
| 15 to 19 years | 0 (0.0%) | 0 (0.0%) |
| 20 to 34 years | 0 (0.0%) | 0 (0.0%) |
| 35 to 50 years | 2 (100.0%) | 0 (0.0%) |
| Total | 2 (100.0%) | 0 (0.0%) |
Fertility by Education in Fairfield
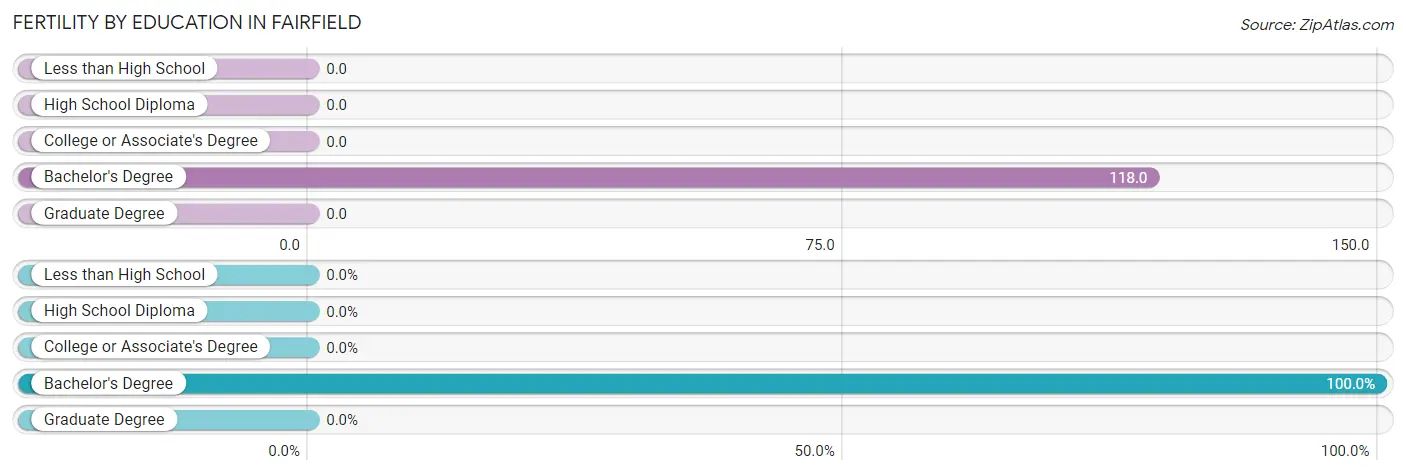
| Educational Attainment | Women with Births | Births / 1,000 Women |
| Less than High School | 0 (0.0%) | 0.0 |
| High School Diploma | 0 (0.0%) | 0.0 |
| College or Associate's Degree | 0 (0.0%) | 0.0 |
| Bachelor's Degree | 2 (100.0%) | 118.0 |
| Graduate Degree | 0 (0.0%) | 0.0 |
| Total | 2 (100.0%) | 12.0 |
Fertility by Education by Marriage Status in Fairfield
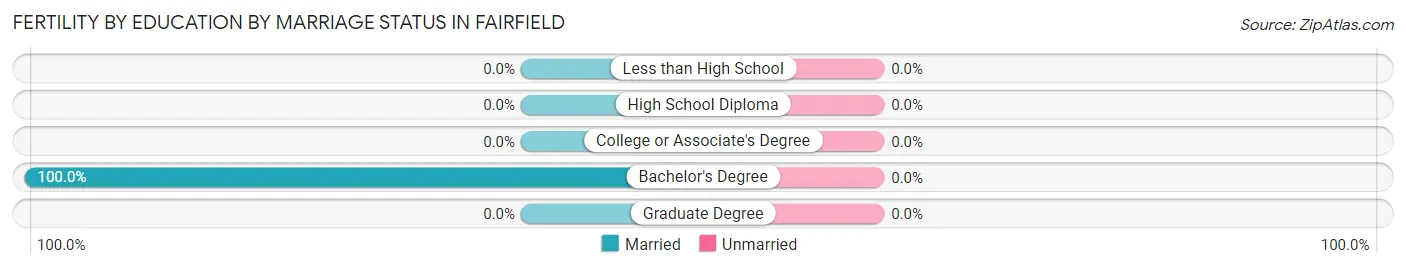
| Educational Attainment | Married | Unmarried |
| Less than High School | 0 (0.0%) | 0 (0.0%) |
| High School Diploma | 0 (0.0%) | 0 (0.0%) |
| College or Associate's Degree | 0 (0.0%) | 0 (0.0%) |
| Bachelor's Degree | 2 (100.0%) | 0 (0.0%) |
| Graduate Degree | 0 (0.0%) | 0 (0.0%) |
| Total | 2 (100.0%) | 0 (0.0%) |
Income in Fairfield
Income Overview in Fairfield
Per Capita Income in Fairfield is $38,473, while median incomes of families and households are $79,732 and $77,083 respectively.
| Characteristic | Number | Measure |
| Per Capita Income | 463 | $38,473 |
| Median Family Income | 67 | $79,732 |
| Mean Family Income | 67 | $111,472 |
| Median Household Income | 129 | $77,083 |
| Mean Household Income | 129 | $100,078 |
| Income Deficit | 67 | $0 |
| Wage / Income Gap (%) | 463 | 0.00% |
| Wage / Income Gap ($) | 463 | 100.00¢ per $1 |
| Gini / Inequality Index | 463 | 0.44 |
Earnings by Sex in Fairfield
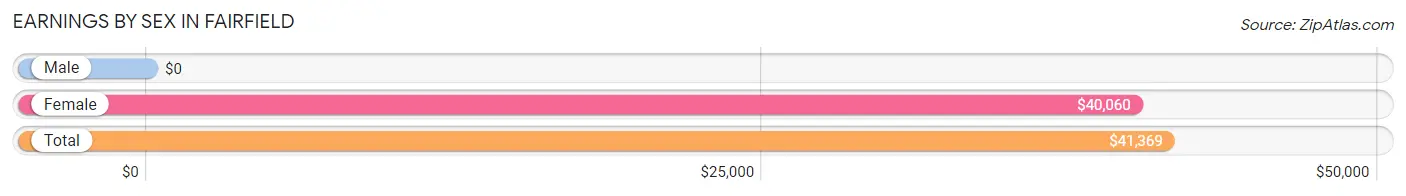
| Sex | Number | Average Earnings |
| Male | 90 (44.3%) | $0 |
| Female | 113 (55.7%) | $40,060 |
| Total | 203 (100.0%) | $41,369 |
Earnings by Sex by Income Bracket in Fairfield
The most common earnings brackets in Fairfield are $100,000+ for men (37 | 41.1%) and $45,000 to $49,999 for women (24 | 21.2%).
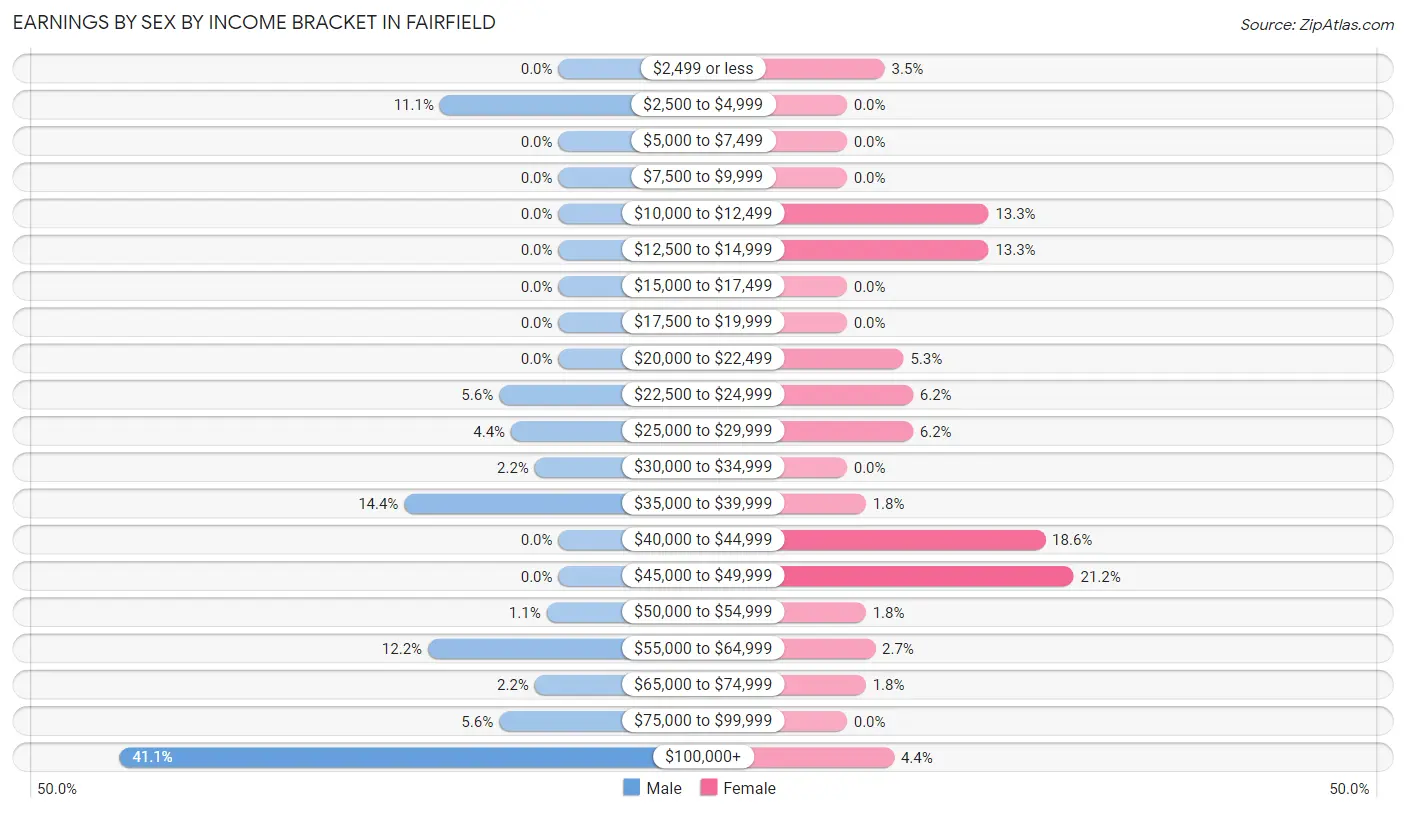
| Income | Male | Female |
| $2,499 or less | 0 (0.0%) | 4 (3.5%) |
| $2,500 to $4,999 | 10 (11.1%) | 0 (0.0%) |
| $5,000 to $7,499 | 0 (0.0%) | 0 (0.0%) |
| $7,500 to $9,999 | 0 (0.0%) | 0 (0.0%) |
| $10,000 to $12,499 | 0 (0.0%) | 15 (13.3%) |
| $12,500 to $14,999 | 0 (0.0%) | 15 (13.3%) |
| $15,000 to $17,499 | 0 (0.0%) | 0 (0.0%) |
| $17,500 to $19,999 | 0 (0.0%) | 0 (0.0%) |
| $20,000 to $22,499 | 0 (0.0%) | 6 (5.3%) |
| $22,500 to $24,999 | 5 (5.6%) | 7 (6.2%) |
| $25,000 to $29,999 | 4 (4.4%) | 7 (6.2%) |
| $30,000 to $34,999 | 2 (2.2%) | 0 (0.0%) |
| $35,000 to $39,999 | 13 (14.4%) | 2 (1.8%) |
| $40,000 to $44,999 | 0 (0.0%) | 21 (18.6%) |
| $45,000 to $49,999 | 0 (0.0%) | 24 (21.2%) |
| $50,000 to $54,999 | 1 (1.1%) | 2 (1.8%) |
| $55,000 to $64,999 | 11 (12.2%) | 3 (2.6%) |
| $65,000 to $74,999 | 2 (2.2%) | 2 (1.8%) |
| $75,000 to $99,999 | 5 (5.6%) | 0 (0.0%) |
| $100,000+ | 37 (41.1%) | 5 (4.4%) |
| Total | 90 (100.0%) | 113 (100.0%) |
Earnings by Sex by Educational Attainment in Fairfield
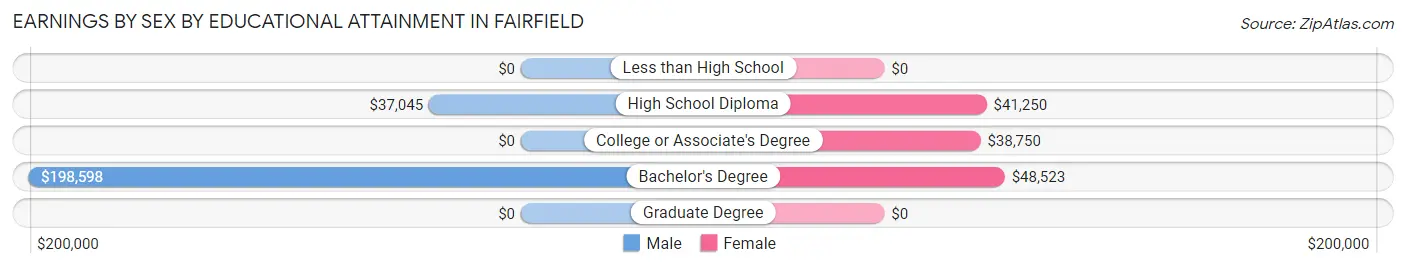
| Educational Attainment | Male Income | Female Income |
| Less than High School | - | - |
| High School Diploma | $37,045 | $41,250 |
| College or Associate's Degree | - | - |
| Bachelor's Degree | $198,598 | $48,523 |
| Graduate Degree | - | - |
| Total | - | - |
Family Income in Fairfield
Family Income Brackets in Fairfield
According to the Fairfield family income data, there are 24 families falling into the $75,000 to $99,999 income range, which is the most common income bracket and makes up 35.8% of all families.
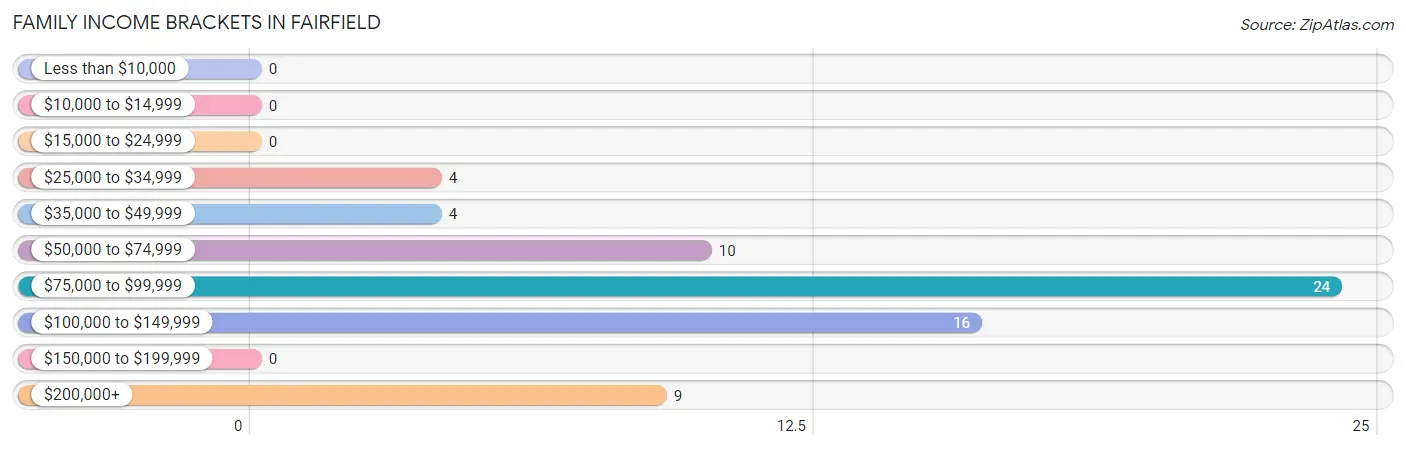
| Income Bracket | # Families | % Families |
| Less than $10,000 | 0 | 0.0% |
| $10,000 to $14,999 | 0 | 0.0% |
| $15,000 to $24,999 | 0 | 0.0% |
| $25,000 to $34,999 | 4 | 6.0% |
| $35,000 to $49,999 | 4 | 6.0% |
| $50,000 to $74,999 | 10 | 14.9% |
| $75,000 to $99,999 | 24 | 35.8% |
| $100,000 to $149,999 | 16 | 23.9% |
| $150,000 to $199,999 | 0 | 0.0% |
| $200,000+ | 9 | 13.4% |
Family Income by Famaliy Size in Fairfield
5-person families (5 | 7.5%) account for the highest median family income in Fairfield with $139,375 per family, while 2-person families (44 | 65.7%) have the highest median income of $39,554 per family member.
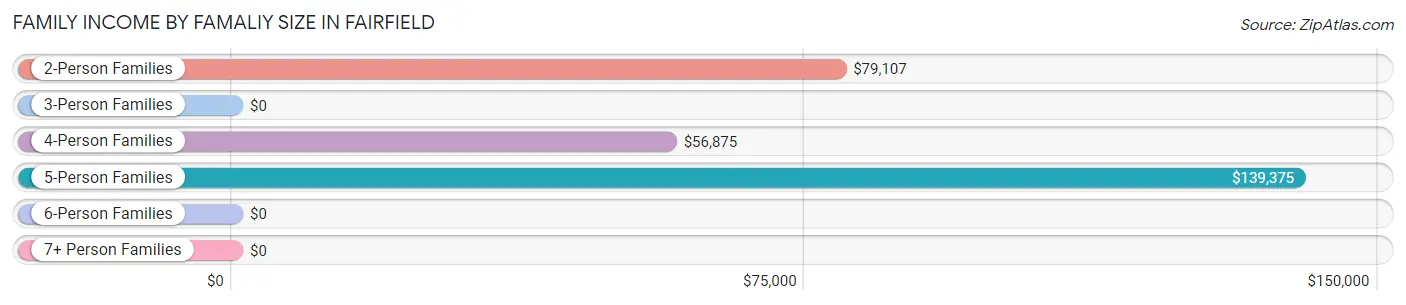
| Income Bracket | # Families | Median Income |
| 2-Person Families | 44 (65.7%) | $79,107 |
| 3-Person Families | 0 (0.0%) | $0 |
| 4-Person Families | 9 (13.4%) | $56,875 |
| 5-Person Families | 5 (7.5%) | $139,375 |
| 6-Person Families | 7 (10.4%) | $0 |
| 7+ Person Families | 2 (3.0%) | $0 |
| Total | 67 (100.0%) | $79,732 |
Family Income by Number of Earners in Fairfield
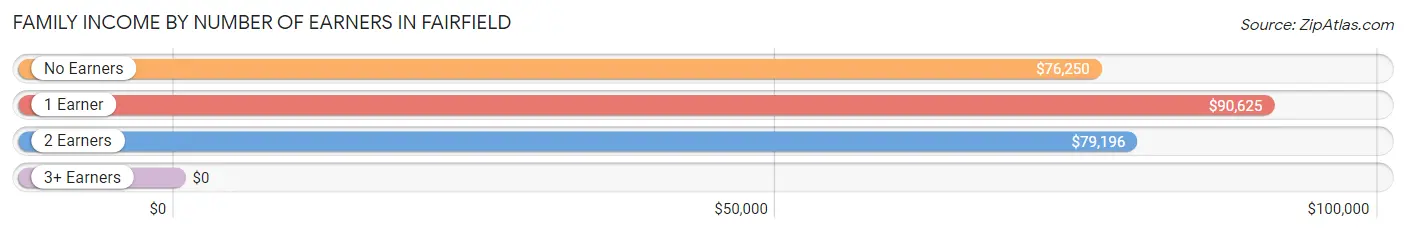
| Number of Earners | # Families | Median Income |
| No Earners | 11 (16.4%) | $76,250 |
| 1 Earner | 20 (29.8%) | $90,625 |
| 2 Earners | 31 (46.3%) | $79,196 |
| 3+ Earners | 5 (7.5%) | $0 |
| Total | 67 (100.0%) | $79,732 |
Household Income in Fairfield
Household Income Brackets in Fairfield
With 38 households falling in the category, the $35,000 to $49,999 income range is the most frequent in Fairfield, accounting for 29.5% of all households.
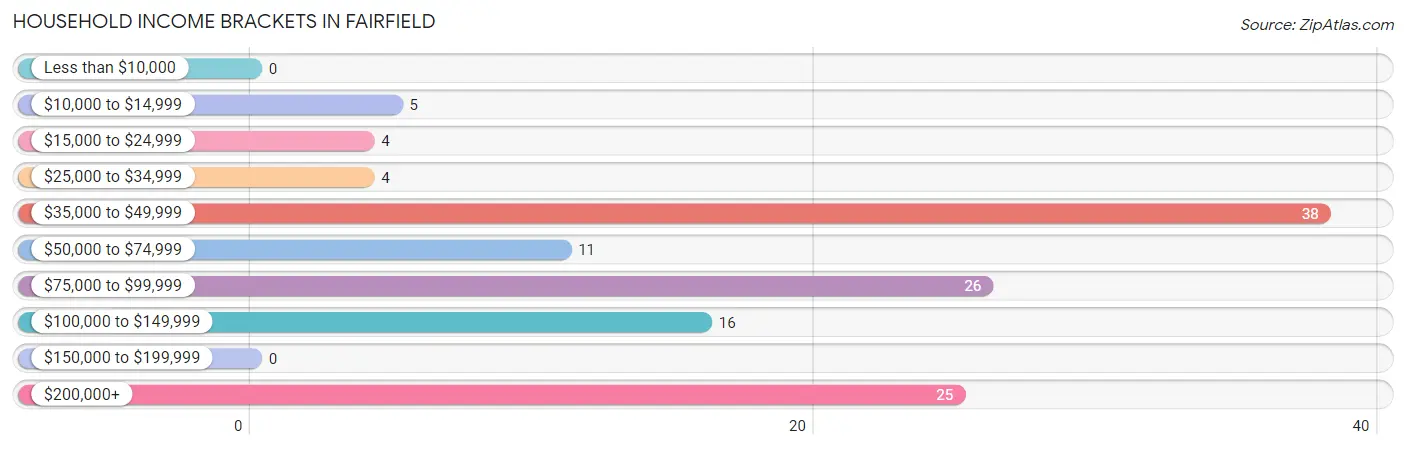
| Income Bracket | # Households | % Households |
| Less than $10,000 | 0 | 0.0% |
| $10,000 to $14,999 | 5 | 3.9% |
| $15,000 to $24,999 | 4 | 3.1% |
| $25,000 to $34,999 | 4 | 3.1% |
| $35,000 to $49,999 | 38 | 29.5% |
| $50,000 to $74,999 | 11 | 8.5% |
| $75,000 to $99,999 | 26 | 20.2% |
| $100,000 to $149,999 | 16 | 12.4% |
| $150,000 to $199,999 | 0 | 0.0% |
| $200,000+ | 25 | 19.4% |
Household Income by Householder Age in Fairfield
The median household income in Fairfield is $77,083, with the highest median household income of $78,203 found in the 45 to 64 years age bracket for the primary householder. A total of 55 households (42.6%) fall into this category.
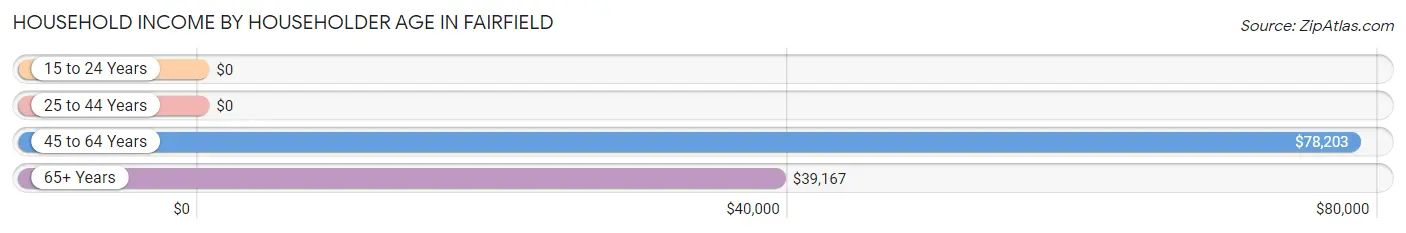
| Income Bracket | # Households | Median Income |
| 15 to 24 Years | 0 (0.0%) | $0 |
| 25 to 44 Years | 36 (27.9%) | $0 |
| 45 to 64 Years | 55 (42.6%) | $78,203 |
| 65+ Years | 38 (29.5%) | $39,167 |
| Total | 129 (100.0%) | $77,083 |
Poverty in Fairfield
Income Below Poverty by Sex and Age in Fairfield
With 3.8% poverty level for males and 4.6% for females among the residents of Fairfield, under 5 year old males and 65 to 74 year old females are the most vulnerable to poverty, with 3 males (37.5%) and 5 females (55.6%) in their respective age groups living below the poverty level.
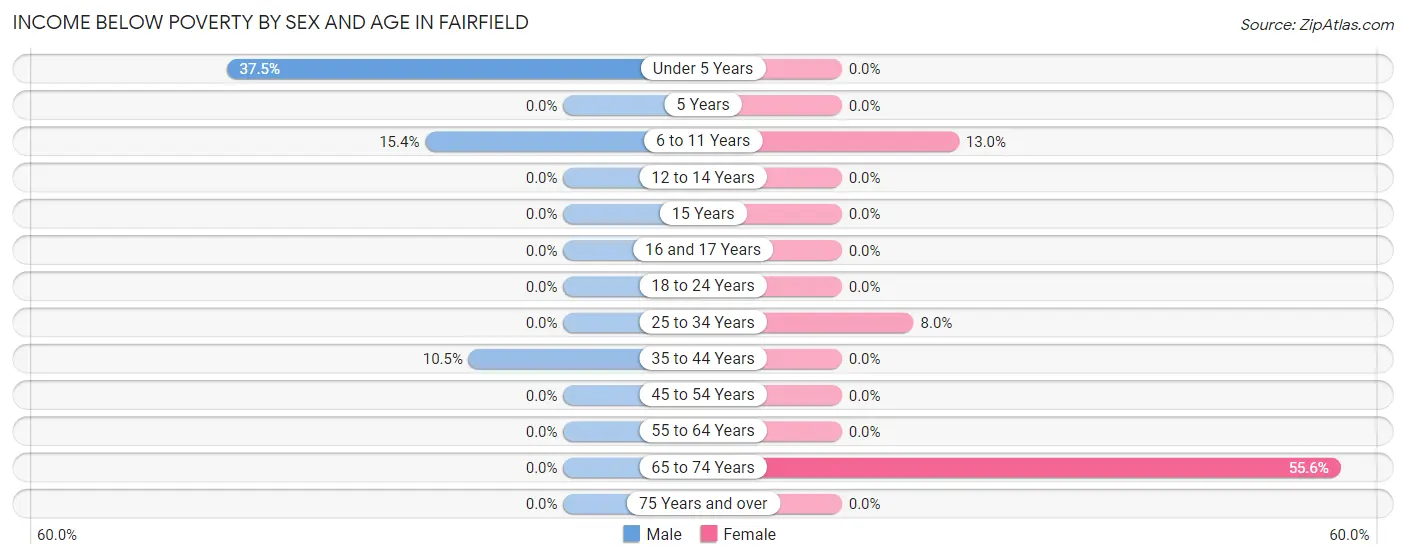
| Age Bracket | Male | Female |
| Under 5 Years | 3 (37.5%) | 0 (0.0%) |
| 5 Years | 0 (0.0%) | 0 (0.0%) |
| 6 to 11 Years | 2 (15.4%) | 6 (13.0%) |
| 12 to 14 Years | 0 (0.0%) | 0 (0.0%) |
| 15 Years | 0 (0.0%) | 0 (0.0%) |
| 16 and 17 Years | 0 (0.0%) | 0 (0.0%) |
| 18 to 24 Years | 0 (0.0%) | 0 (0.0%) |
| 25 to 34 Years | 0 (0.0%) | 2 (8.0%) |
| 35 to 44 Years | 2 (10.5%) | 0 (0.0%) |
| 45 to 54 Years | 0 (0.0%) | 0 (0.0%) |
| 55 to 64 Years | 0 (0.0%) | 0 (0.0%) |
| 65 to 74 Years | 0 (0.0%) | 5 (55.6%) |
| 75 Years and over | 0 (0.0%) | 0 (0.0%) |
| Total | 7 (3.8%) | 13 (4.6%) |
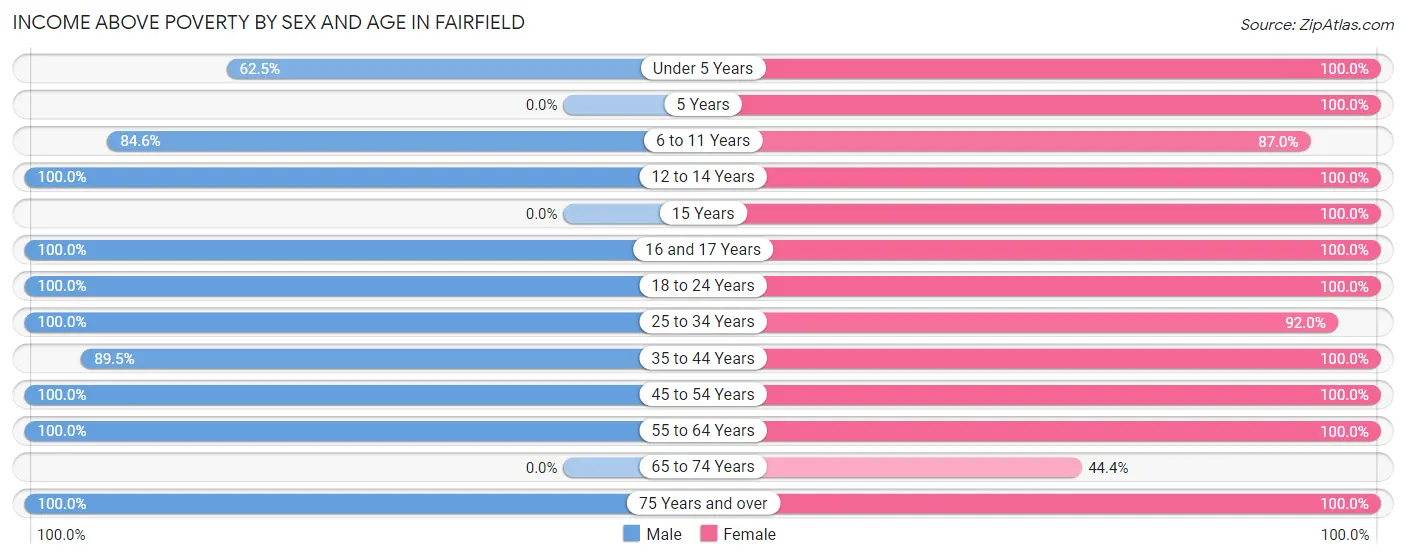
Income Above Poverty by Sex and Age in Fairfield
According to the poverty statistics in Fairfield, males aged 12 to 14 years and females aged under 5 years are the age groups that are most secure financially, with 100.0% of males and 100.0% of females in these age groups living above the poverty line.
| Age Bracket | Male | Female |
| Under 5 Years | 5 (62.5%) | 8 (100.0%) |
| 5 Years | 0 (0.0%) | 5 (100.0%) |
| 6 to 11 Years | 11 (84.6%) | 40 (87.0%) |
| 12 to 14 Years | 4 (100.0%) | 9 (100.0%) |
| 15 Years | 0 (0.0%) | 6 (100.0%) |
| 16 and 17 Years | 10 (100.0%) | 19 (100.0%) |
| 18 to 24 Years | 26 (100.0%) | 10 (100.0%) |
| 25 to 34 Years | 36 (100.0%) | 23 (92.0%) |
| 35 to 44 Years | 17 (89.5%) | 84 (100.0%) |
| 45 to 54 Years | 8 (100.0%) | 31 (100.0%) |
| 55 to 64 Years | 18 (100.0%) | 21 (100.0%) |
| 65 to 74 Years | 0 (0.0%) | 4 (44.4%) |
| 75 Years and over | 40 (100.0%) | 8 (100.0%) |
| Total | 175 (96.2%) | 268 (95.4%) |
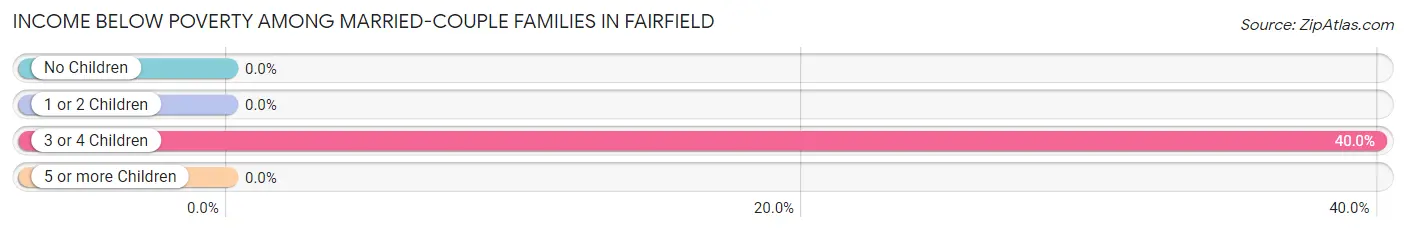
Income Below Poverty Among Married-Couple Families in Fairfield
The poverty statistics for married-couple families in Fairfield show that 3.3% or 2 of the total 60 families live below the poverty line. Families with 3 or 4 children have the highest poverty rate of 40.0%, comprising of 2 families. On the other hand, families with no children have the lowest poverty rate of 0.0%, which includes 0 families.
| Children | Above Poverty | Below Poverty |
| No Children | 38 (100.0%) | 0 (0.0%) |
| 1 or 2 Children | 15 (100.0%) | 0 (0.0%) |
| 3 or 4 Children | 3 (60.0%) | 2 (40.0%) |
| 5 or more Children | 2 (100.0%) | 0 (0.0%) |
| Total | 58 (96.7%) | 2 (3.3%) |
Income Below Poverty Among Single-Parent Households in Fairfield
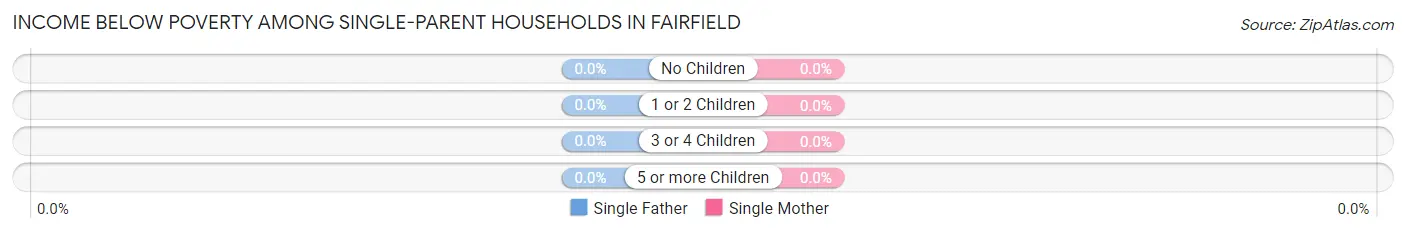
| Children | Single Father | Single Mother |
| No Children | 0 (0.0%) | 0 (0.0%) |
| 1 or 2 Children | 0 (0.0%) | 0 (0.0%) |
| 3 or 4 Children | 0 (0.0%) | 0 (0.0%) |
| 5 or more Children | 0 (0.0%) | 0 (0.0%) |
| Total | 0 (0.0%) | 0 (0.0%) |
Income Below Poverty Among Married-Couple vs Single-Parent Households in Fairfield
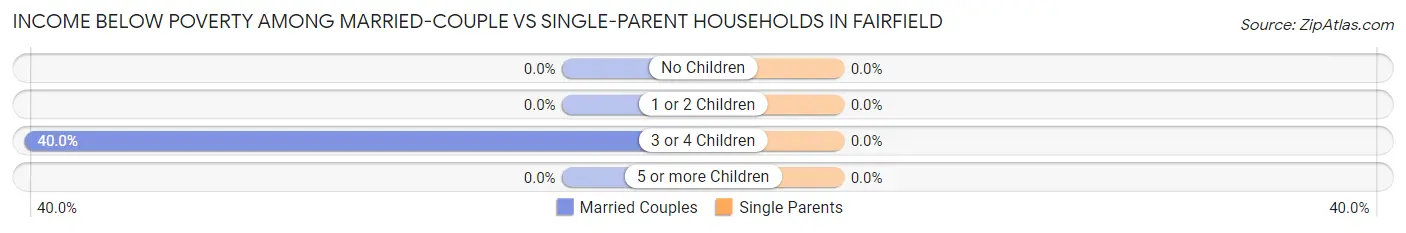
| Children | Married-Couple Families | Single-Parent Households |
| No Children | 0 (0.0%) | 0 (0.0%) |
| 1 or 2 Children | 0 (0.0%) | 0 (0.0%) |
| 3 or 4 Children | 2 (40.0%) | 0 (0.0%) |
| 5 or more Children | 0 (0.0%) | 0 (0.0%) |
| Total | 2 (3.3%) | 0 (0.0%) |
Employment Characteristics in Fairfield
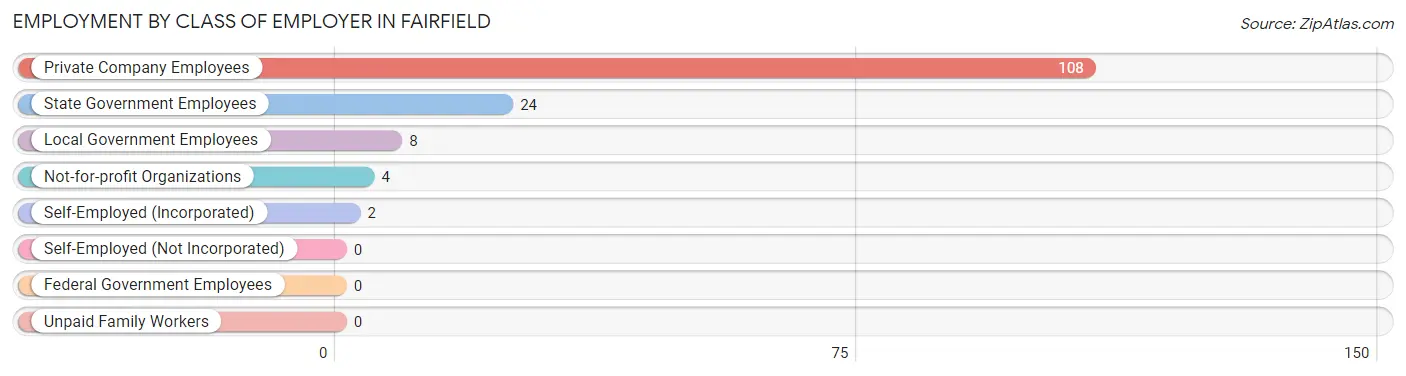
Employment by Class of Employer in Fairfield
Among the 146 employed individuals in Fairfield, private company employees (108 | 74.0%), state government employees (24 | 16.4%), and local government employees (8 | 5.5%) make up the most common classes of employment.
| Employer Class | # Employees | % Employees |
| Private Company Employees | 108 | 74.0% |
| Self-Employed (Incorporated) | 2 | 1.4% |
| Self-Employed (Not Incorporated) | 0 | 0.0% |
| Not-for-profit Organizations | 4 | 2.7% |
| Local Government Employees | 8 | 5.5% |
| State Government Employees | 24 | 16.4% |
| Federal Government Employees | 0 | 0.0% |
| Unpaid Family Workers | 0 | 0.0% |
| Total | 146 | 100.0% |
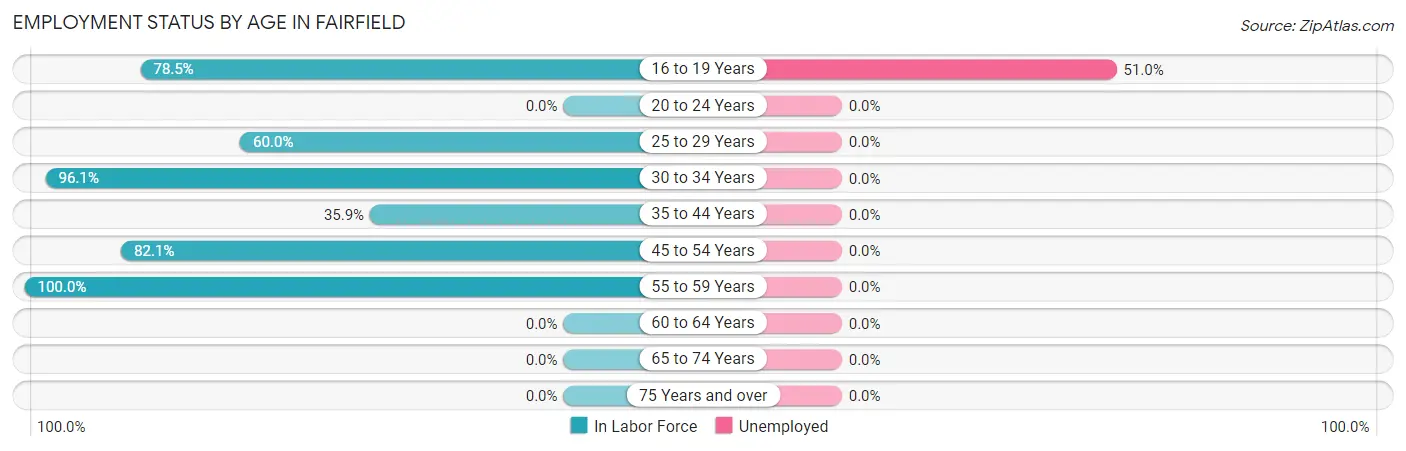
Employment Status by Age in Fairfield
According to the labor force statistics for Fairfield, out of the total population over 16 years of age (364), 56.3% or 205 individuals are in the labor force, with 12.7% or 26 of them unemployed. The age group with the highest labor force participation rate is 55 to 59 years, with 100.0% or 30 individuals in the labor force. Within the labor force, the 16 to 19 years age range has the highest percentage of unemployed individuals, with 51.0% or 26 of them being unemployed.
| Age Bracket | In Labor Force | Unemployed |
| 16 to 19 Years | 51 (78.5%) | 26 (51.0%) |
| 20 to 24 Years | 0 (0.0%) | 0 (0.0%) |
| 25 to 29 Years | 6 (60.0%) | 0 (0.0%) |
| 30 to 34 Years | 49 (96.1%) | 0 (0.0%) |
| 35 to 44 Years | 37 (35.9%) | 0 (0.0%) |
| 45 to 54 Years | 32 (82.1%) | 0 (0.0%) |
| 55 to 59 Years | 30 (100.0%) | 0 (0.0%) |
| 60 to 64 Years | 0 (0.0%) | 0 (0.0%) |
| 65 to 74 Years | 0 (0.0%) | 0 (0.0%) |
| 75 Years and over | 0 (0.0%) | 0 (0.0%) |
| Total | 205 (56.3%) | 26 (12.7%) |
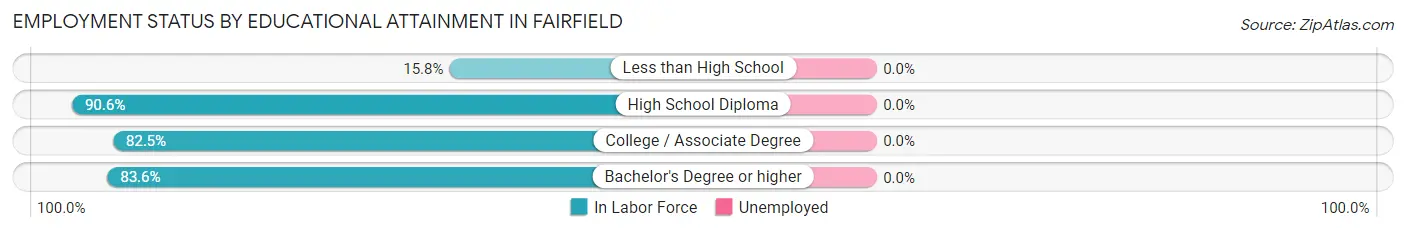
Employment Status by Educational Attainment in Fairfield
| Educational Attainment | In Labor Force | Unemployed |
| Less than High School | 12 (15.8%) | 0 (0.0%) |
| High School Diploma | 48 (90.6%) | 0 (0.0%) |
| College / Associate Degree | 33 (82.5%) | 0 (0.0%) |
| Bachelor's Degree or higher | 61 (83.6%) | 0 (0.0%) |
| Total | 154 (63.6%) | 0 (0.0%) |
Employment Occupations by Sex in Fairfield
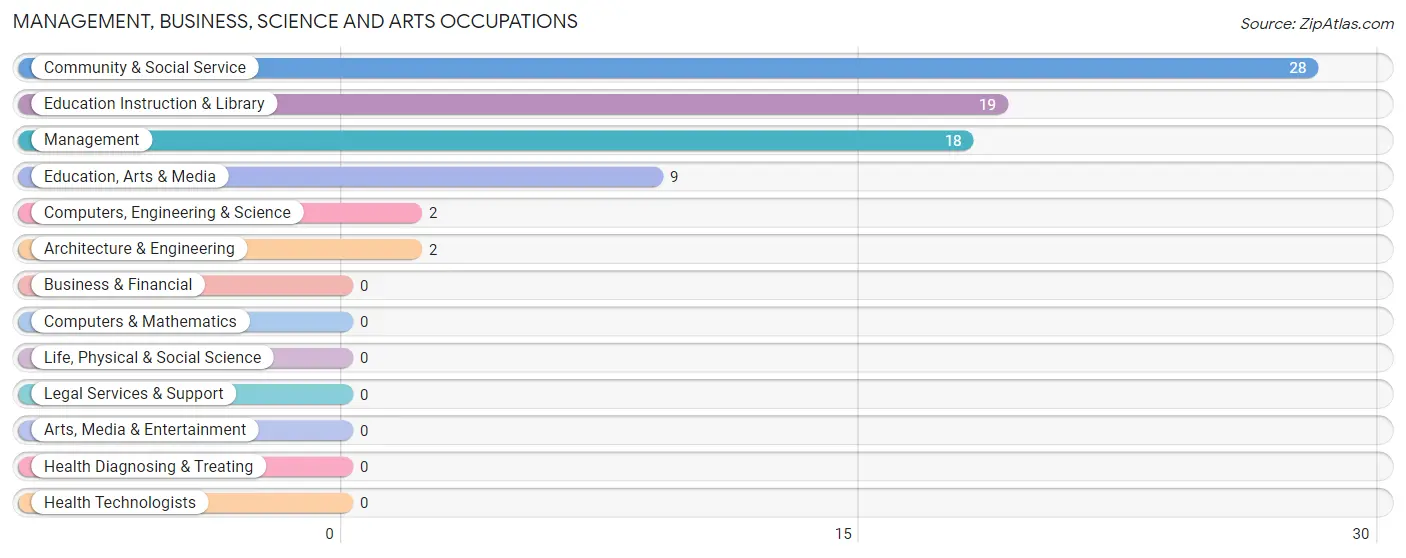
Management, Business, Science and Arts Occupations
The most common Management, Business, Science and Arts occupations in Fairfield are Community & Social Service (28 | 15.6%), Education Instruction & Library (19 | 10.6%), Management (18 | 10.1%), Education, Arts & Media (9 | 5.0%), and Computers, Engineering & Science (2 | 1.1%).
Management, Business, Science and Arts Occupations by Sex
Within the Management, Business, Science and Arts occupations in Fairfield, the most male-oriented occupations are Computers, Engineering & Science (100.0%), Architecture & Engineering (100.0%), and Education, Arts & Media (22.2%), while the most female-oriented occupations are Education Instruction & Library (89.5%), Management (88.9%), and Community & Social Service (85.7%).
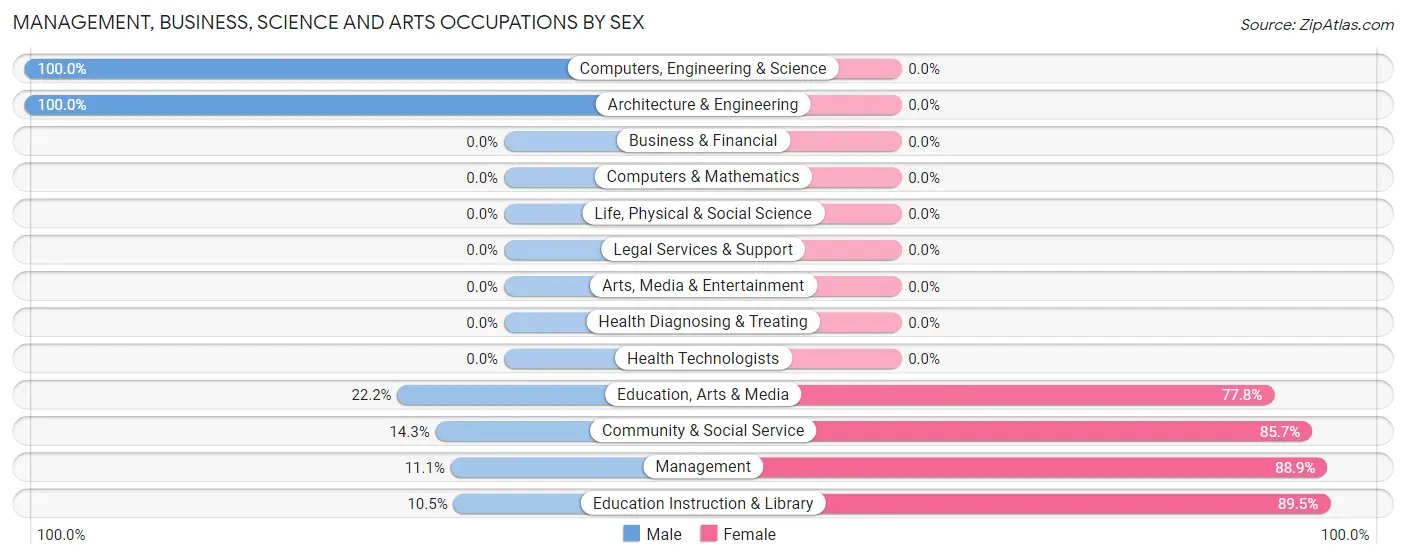
| Occupation | Male | Female |
| Management | 2 (11.1%) | 16 (88.9%) |
| Business & Financial | 0 (0.0%) | 0 (0.0%) |
| Computers, Engineering & Science | 2 (100.0%) | 0 (0.0%) |
| Computers & Mathematics | 0 (0.0%) | 0 (0.0%) |
| Architecture & Engineering | 2 (100.0%) | 0 (0.0%) |
| Life, Physical & Social Science | 0 (0.0%) | 0 (0.0%) |
| Community & Social Service | 4 (14.3%) | 24 (85.7%) |
| Education, Arts & Media | 2 (22.2%) | 7 (77.8%) |
| Legal Services & Support | 0 (0.0%) | 0 (0.0%) |
| Education Instruction & Library | 2 (10.5%) | 17 (89.5%) |
| Arts, Media & Entertainment | 0 (0.0%) | 0 (0.0%) |
| Health Diagnosing & Treating | 0 (0.0%) | 0 (0.0%) |
| Health Technologists | 0 (0.0%) | 0 (0.0%) |
| Total (Category) | 8 (16.7%) | 40 (83.3%) |
| Total (Overall) | 72 (40.2%) | 107 (59.8%) |
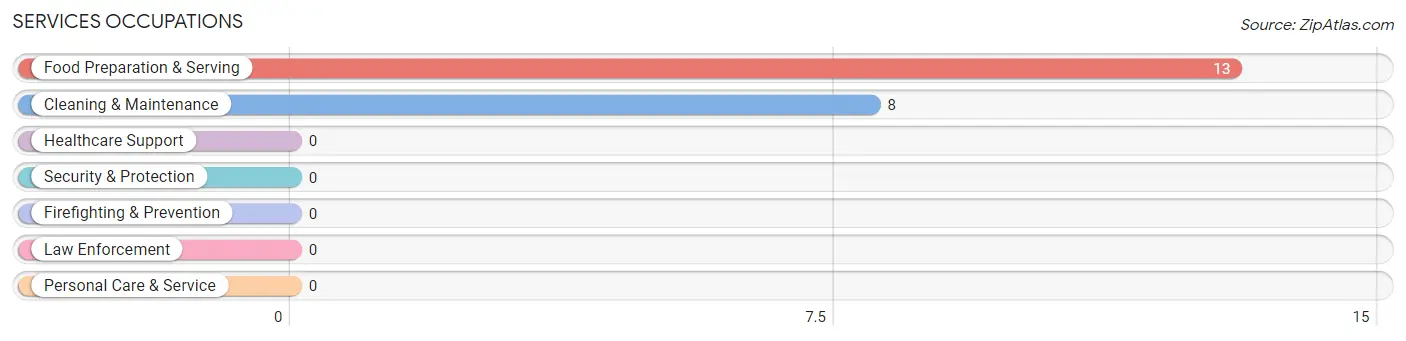
Services Occupations
The most common Services occupations in Fairfield are Food Preparation & Serving (13 | 7.3%), and Cleaning & Maintenance (8 | 4.5%).
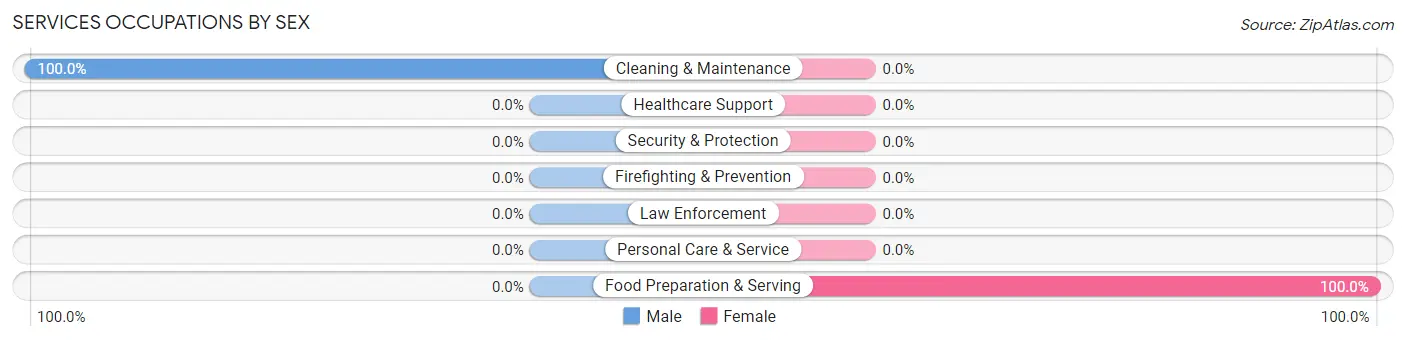
Services Occupations by Sex
| Occupation | Male | Female |
| Healthcare Support | 0 (0.0%) | 0 (0.0%) |
| Security & Protection | 0 (0.0%) | 0 (0.0%) |
| Firefighting & Prevention | 0 (0.0%) | 0 (0.0%) |
| Law Enforcement | 0 (0.0%) | 0 (0.0%) |
| Food Preparation & Serving | 0 (0.0%) | 13 (100.0%) |
| Cleaning & Maintenance | 8 (100.0%) | 0 (0.0%) |
| Personal Care & Service | 0 (0.0%) | 0 (0.0%) |
| Total (Category) | 8 (38.1%) | 13 (61.9%) |
| Total (Overall) | 72 (40.2%) | 107 (59.8%) |
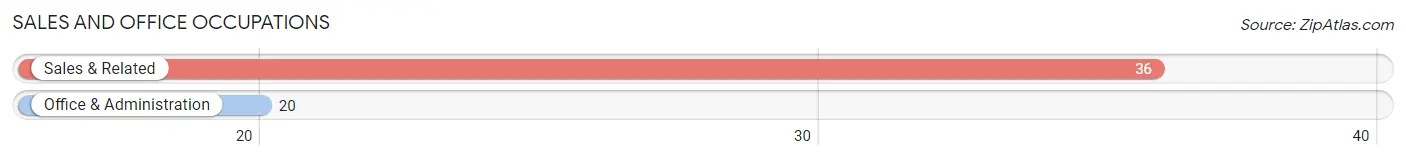
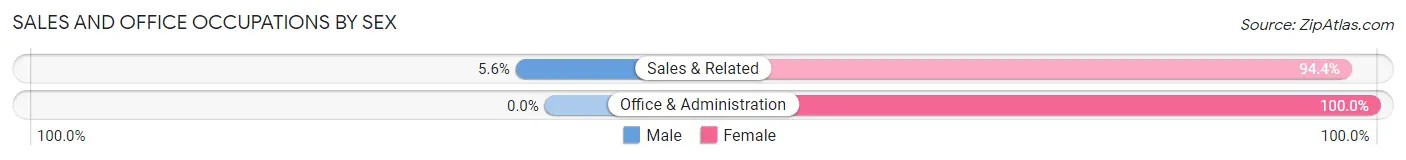
Sales and Office Occupations
The most common Sales and Office occupations in Fairfield are Sales & Related (36 | 20.1%), and Office & Administration (20 | 11.2%).
Sales and Office Occupations by Sex
| Occupation | Male | Female |
| Sales & Related | 2 (5.6%) | 34 (94.4%) |
| Office & Administration | 0 (0.0%) | 20 (100.0%) |
| Total (Category) | 2 (3.6%) | 54 (96.4%) |
| Total (Overall) | 72 (40.2%) | 107 (59.8%) |
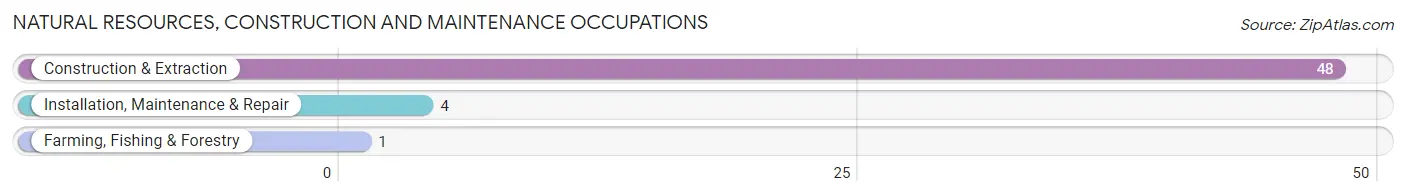
Natural Resources, Construction and Maintenance Occupations
The most common Natural Resources, Construction and Maintenance occupations in Fairfield are Construction & Extraction (48 | 26.8%), Installation, Maintenance & Repair (4 | 2.2%), and Farming, Fishing & Forestry (1 | 0.6%).
Natural Resources, Construction and Maintenance Occupations by Sex
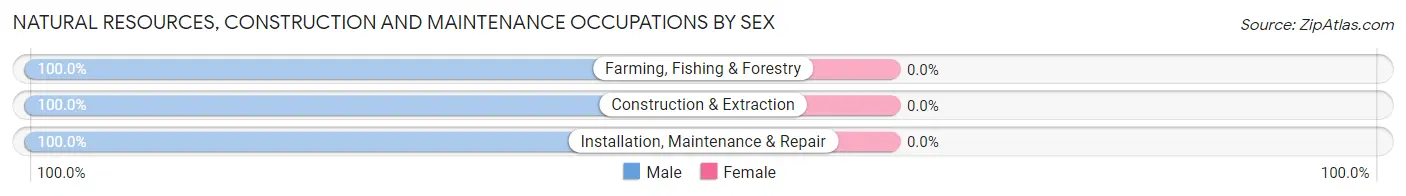
| Occupation | Male | Female |
| Farming, Fishing & Forestry | 1 (100.0%) | 0 (0.0%) |
| Construction & Extraction | 48 (100.0%) | 0 (0.0%) |
| Installation, Maintenance & Repair | 4 (100.0%) | 0 (0.0%) |
| Total (Category) | 53 (100.0%) | 0 (0.0%) |
| Total (Overall) | 72 (40.2%) | 107 (59.8%) |
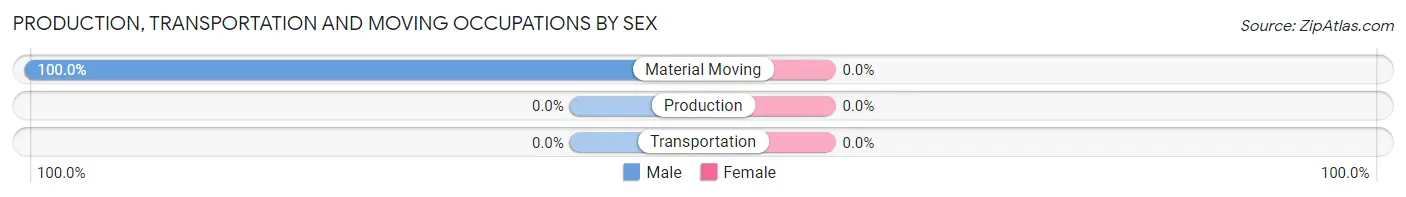
Production, Transportation and Moving Occupations
The most common Production, Transportation and Moving occupations in Fairfield are , and Material Moving (1 | 0.6%).
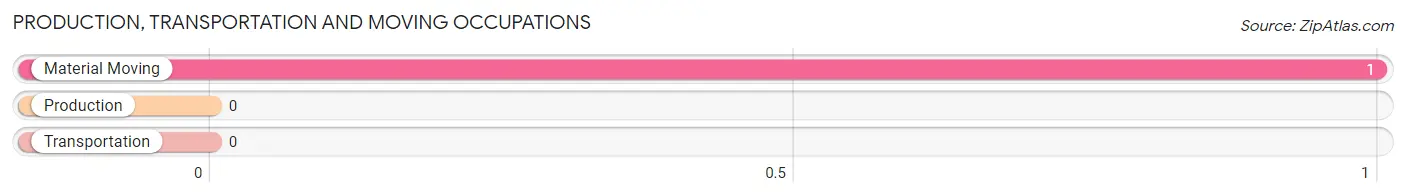
Production, Transportation and Moving Occupations by Sex
| Occupation | Male | Female |
| Production | 0 (0.0%) | 0 (0.0%) |
| Transportation | 0 (0.0%) | 0 (0.0%) |
| Material Moving | 1 (100.0%) | 0 (0.0%) |
| Total (Category) | 1 (100.0%) | 0 (0.0%) |
| Total (Overall) | 72 (40.2%) | 107 (59.8%) |
Employment Industries by Sex in Fairfield
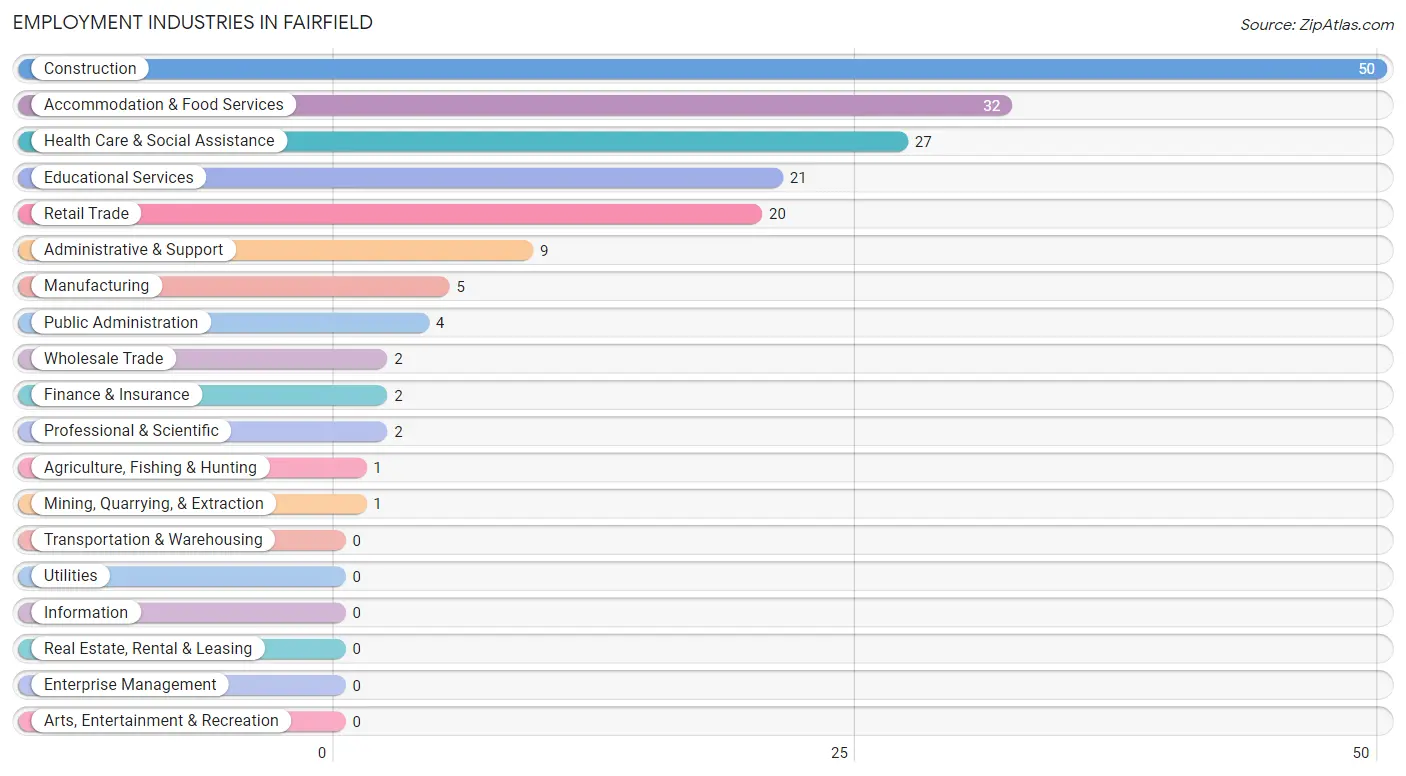
Employment Industries in Fairfield
The major employment industries in Fairfield include Construction (50 | 27.9%), Accommodation & Food Services (32 | 17.9%), Health Care & Social Assistance (27 | 15.1%), Educational Services (21 | 11.7%), and Retail Trade (20 | 11.2%).
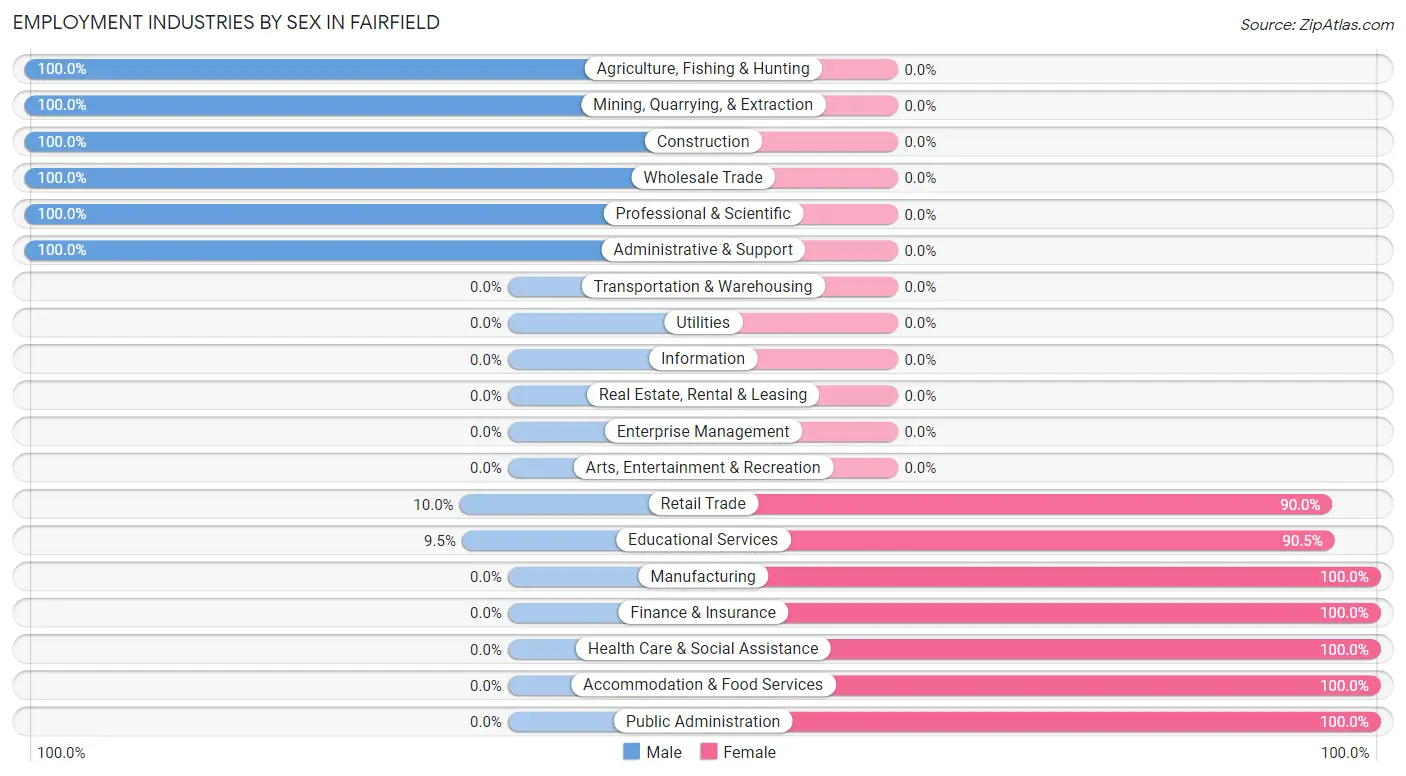
Employment Industries by Sex in Fairfield
The Fairfield industries that see more men than women are Agriculture, Fishing & Hunting (100.0%), Mining, Quarrying, & Extraction (100.0%), and Construction (100.0%), whereas the industries that tend to have a higher number of women are Manufacturing (100.0%), Finance & Insurance (100.0%), and Health Care & Social Assistance (100.0%).
| Industry | Male | Female |
| Agriculture, Fishing & Hunting | 1 (100.0%) | 0 (0.0%) |
| Mining, Quarrying, & Extraction | 1 (100.0%) | 0 (0.0%) |
| Construction | 50 (100.0%) | 0 (0.0%) |
| Manufacturing | 0 (0.0%) | 5 (100.0%) |
| Wholesale Trade | 2 (100.0%) | 0 (0.0%) |
| Retail Trade | 2 (10.0%) | 18 (90.0%) |
| Transportation & Warehousing | 0 (0.0%) | 0 (0.0%) |
| Utilities | 0 (0.0%) | 0 (0.0%) |
| Information | 0 (0.0%) | 0 (0.0%) |
| Finance & Insurance | 0 (0.0%) | 2 (100.0%) |
| Real Estate, Rental & Leasing | 0 (0.0%) | 0 (0.0%) |
| Professional & Scientific | 2 (100.0%) | 0 (0.0%) |
| Enterprise Management | 0 (0.0%) | 0 (0.0%) |
| Administrative & Support | 9 (100.0%) | 0 (0.0%) |
| Educational Services | 2 (9.5%) | 19 (90.5%) |
| Health Care & Social Assistance | 0 (0.0%) | 27 (100.0%) |
| Arts, Entertainment & Recreation | 0 (0.0%) | 0 (0.0%) |
| Accommodation & Food Services | 0 (0.0%) | 32 (100.0%) |
| Public Administration | 0 (0.0%) | 4 (100.0%) |
| Total | 72 (40.2%) | 107 (59.8%) |
Education in Fairfield
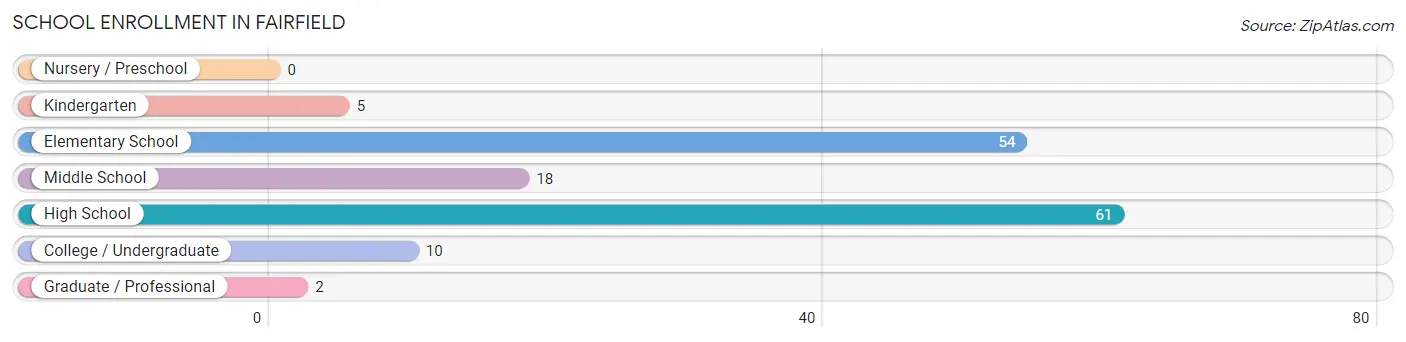
School Enrollment in Fairfield
The most common levels of schooling among the 150 students in Fairfield are high school (61 | 40.7%), elementary school (54 | 36.0%), and middle school (18 | 12.0%).
| School Level | # Students | % Students |
| Nursery / Preschool | 0 | 0.0% |
| Kindergarten | 5 | 3.3% |
| Elementary School | 54 | 36.0% |
| Middle School | 18 | 12.0% |
| High School | 61 | 40.7% |
| College / Undergraduate | 10 | 6.7% |
| Graduate / Professional | 2 | 1.3% |
| Total | 150 | 100.0% |
School Enrollment by Age by Funding Source in Fairfield
Out of a total of 150 students who are enrolled in schools in Fairfield, 8 (5.3%) attend a private institution, while the remaining 142 (94.7%) are enrolled in public schools. The age group of 10 to 14 year olds has the highest likelihood of being enrolled in private schools, with 3 (13.6% in the age bracket) enrolled. Conversely, the age group of 15 to 17 year olds has the lowest likelihood of being enrolled in a private school, with 35 (100.0% in the age bracket) attending a public institution.
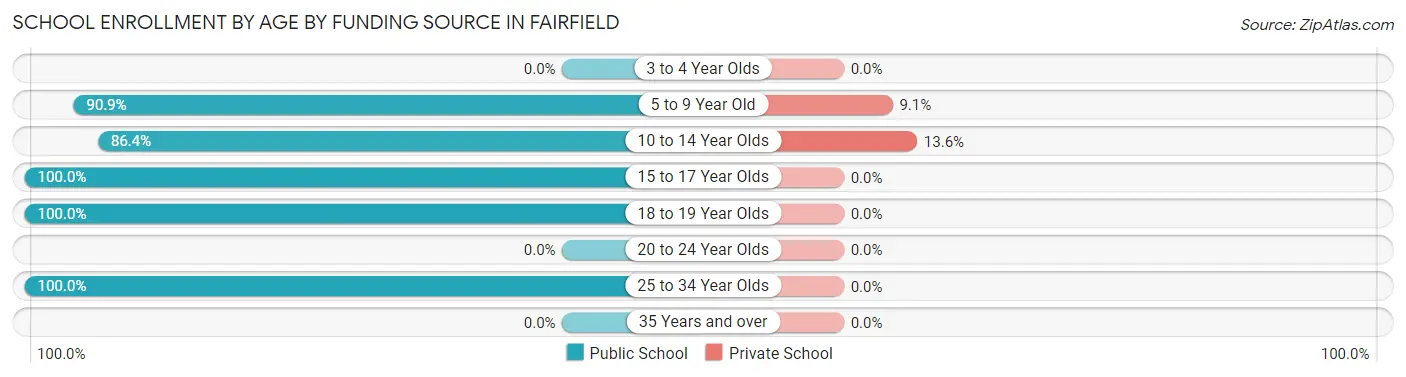
| Age Bracket | Public School | Private School |
| 3 to 4 Year Olds | 0 (0.0%) | 0 (0.0%) |
| 5 to 9 Year Old | 50 (90.9%) | 5 (9.1%) |
| 10 to 14 Year Olds | 19 (86.4%) | 3 (13.6%) |
| 15 to 17 Year Olds | 35 (100.0%) | 0 (0.0%) |
| 18 to 19 Year Olds | 36 (100.0%) | 0 (0.0%) |
| 20 to 24 Year Olds | 0 (0.0%) | 0 (0.0%) |
| 25 to 34 Year Olds | 2 (100.0%) | 0 (0.0%) |
| 35 Years and over | 0 (0.0%) | 0 (0.0%) |
| Total | 142 (94.7%) | 8 (5.3%) |
Educational Attainment by Field of Study in Fairfield
Science & technology (39 | 42.4%), education (20 | 21.7%), physical & health sciences (6 | 6.5%), psychology (6 | 6.5%), and bio, nature & agricultural (5 | 5.4%) are the most common fields of study among 92 individuals in Fairfield who have obtained a bachelor's degree or higher.
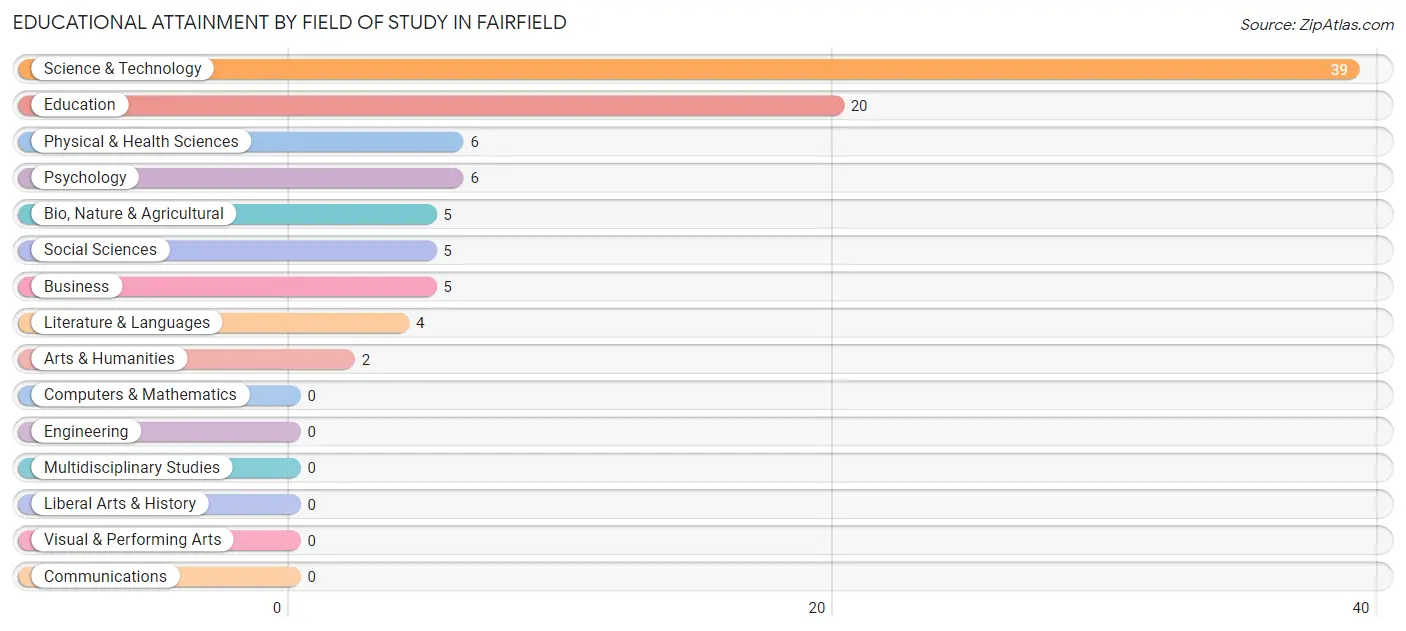
| Field of Study | # Graduates | % Graduates |
| Computers & Mathematics | 0 | 0.0% |
| Bio, Nature & Agricultural | 5 | 5.4% |
| Physical & Health Sciences | 6 | 6.5% |
| Psychology | 6 | 6.5% |
| Social Sciences | 5 | 5.4% |
| Engineering | 0 | 0.0% |
| Multidisciplinary Studies | 0 | 0.0% |
| Science & Technology | 39 | 42.4% |
| Business | 5 | 5.4% |
| Education | 20 | 21.7% |
| Literature & Languages | 4 | 4.3% |
| Liberal Arts & History | 0 | 0.0% |
| Visual & Performing Arts | 0 | 0.0% |
| Communications | 0 | 0.0% |
| Arts & Humanities | 2 | 2.2% |
| Total | 92 | 100.0% |
Transportation & Commute in Fairfield
Vehicle Availability by Sex in Fairfield
The most prevalent vehicle ownership categories in Fairfield are males with 2 vehicles (20, accounting for 51.3%) and females with 2 vehicles (37, making up 18.7%).
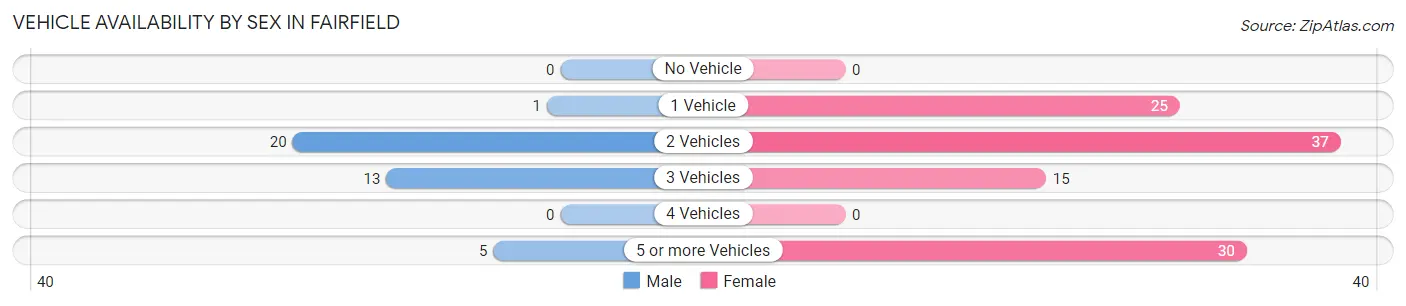
| Vehicles Available | Male | Female |
| No Vehicle | 0 (0.0%) | 0 (0.0%) |
| 1 Vehicle | 1 (2.6%) | 25 (23.4%) |
| 2 Vehicles | 20 (51.3%) | 37 (34.6%) |
| 3 Vehicles | 13 (33.3%) | 15 (14.0%) |
| 4 Vehicles | 0 (0.0%) | 0 (0.0%) |
| 5 or more Vehicles | 5 (12.8%) | 30 (28.0%) |
| Total | 39 (100.0%) | 107 (100.0%) |
Commute Time in Fairfield
The most frequently occuring commute durations in Fairfield are less than 5 minutes (42 commuters, 28.8%), 45 to 59 minutes (41 commuters, 28.1%), and 60 to 89 minutes (28 commuters, 19.2%).
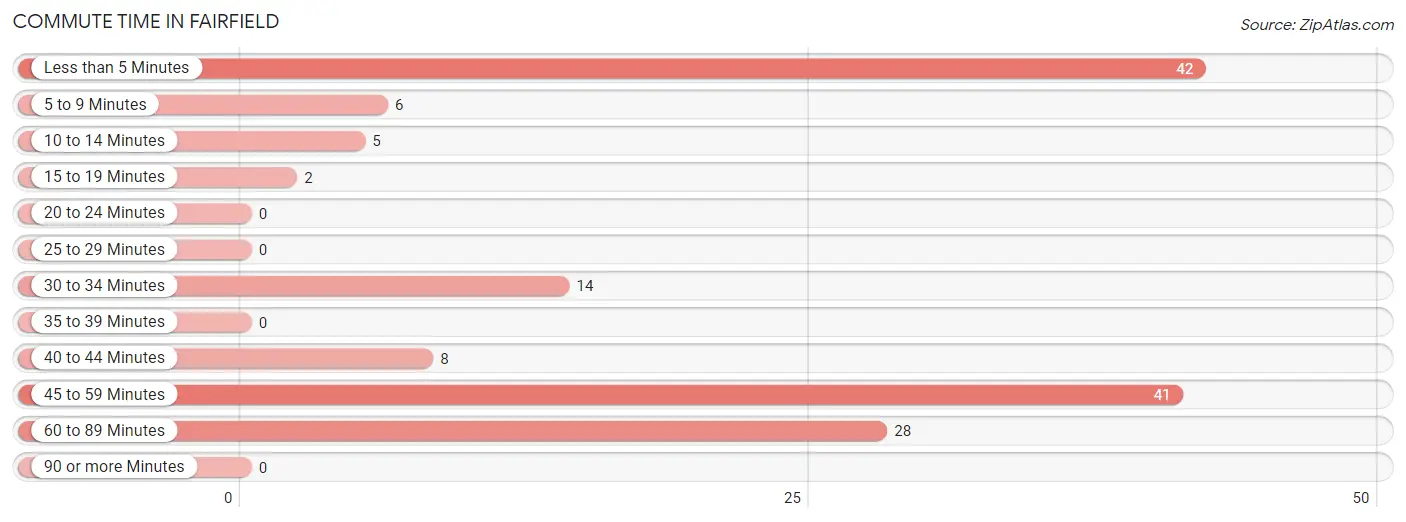
| Commute Time | # Commuters | % Commuters |
| Less than 5 Minutes | 42 | 28.8% |
| 5 to 9 Minutes | 6 | 4.1% |
| 10 to 14 Minutes | 5 | 3.4% |
| 15 to 19 Minutes | 2 | 1.4% |
| 20 to 24 Minutes | 0 | 0.0% |
| 25 to 29 Minutes | 0 | 0.0% |
| 30 to 34 Minutes | 14 | 9.6% |
| 35 to 39 Minutes | 0 | 0.0% |
| 40 to 44 Minutes | 8 | 5.5% |
| 45 to 59 Minutes | 41 | 28.1% |
| 60 to 89 Minutes | 28 | 19.2% |
| 90 or more Minutes | 0 | 0.0% |
Commute Time by Sex in Fairfield
The most common commute times in Fairfield are 30 to 34 minutes (14 commuters, 35.9%) for males and 45 to 59 minutes (37 commuters, 34.6%) for females.
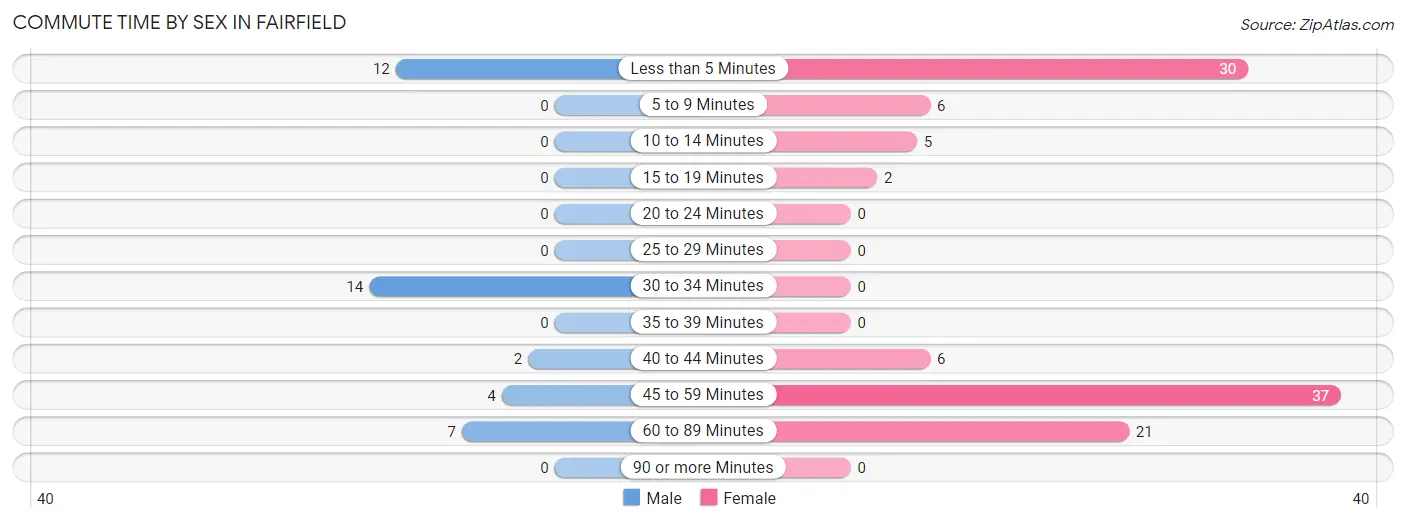
| Commute Time | Male | Female |
| Less than 5 Minutes | 12 (30.8%) | 30 (28.0%) |
| 5 to 9 Minutes | 0 (0.0%) | 6 (5.6%) |
| 10 to 14 Minutes | 0 (0.0%) | 5 (4.7%) |
| 15 to 19 Minutes | 0 (0.0%) | 2 (1.9%) |
| 20 to 24 Minutes | 0 (0.0%) | 0 (0.0%) |
| 25 to 29 Minutes | 0 (0.0%) | 0 (0.0%) |
| 30 to 34 Minutes | 14 (35.9%) | 0 (0.0%) |
| 35 to 39 Minutes | 0 (0.0%) | 0 (0.0%) |
| 40 to 44 Minutes | 2 (5.1%) | 6 (5.6%) |
| 45 to 59 Minutes | 4 (10.3%) | 37 (34.6%) |
| 60 to 89 Minutes | 7 (17.9%) | 21 (19.6%) |
| 90 or more Minutes | 0 (0.0%) | 0 (0.0%) |
Time of Departure to Work by Sex in Fairfield
The most frequent times of departure to work in Fairfield are 7:30 AM to 7:59 AM (20, 51.3%) for males and 7:00 AM to 7:29 AM (20, 18.7%) for females.
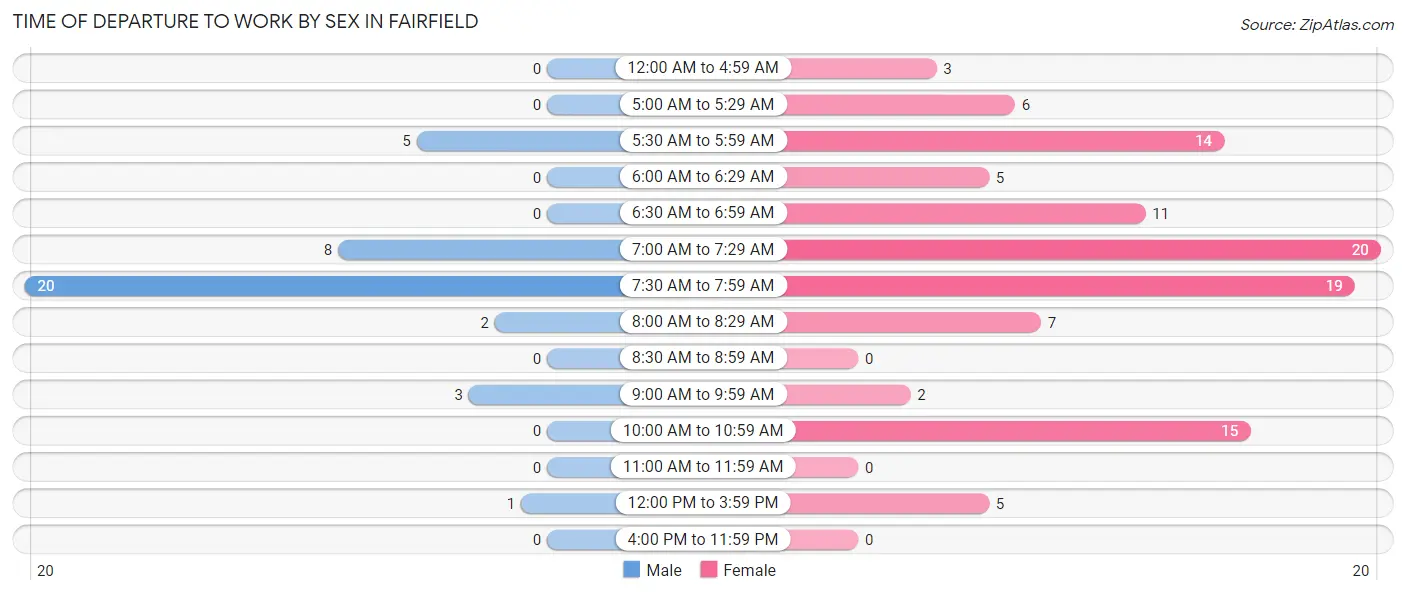
| Time of Departure | Male | Female |
| 12:00 AM to 4:59 AM | 0 (0.0%) | 3 (2.8%) |
| 5:00 AM to 5:29 AM | 0 (0.0%) | 6 (5.6%) |
| 5:30 AM to 5:59 AM | 5 (12.8%) | 14 (13.1%) |
| 6:00 AM to 6:29 AM | 0 (0.0%) | 5 (4.7%) |
| 6:30 AM to 6:59 AM | 0 (0.0%) | 11 (10.3%) |
| 7:00 AM to 7:29 AM | 8 (20.5%) | 20 (18.7%) |
| 7:30 AM to 7:59 AM | 20 (51.3%) | 19 (17.8%) |
| 8:00 AM to 8:29 AM | 2 (5.1%) | 7 (6.5%) |
| 8:30 AM to 8:59 AM | 0 (0.0%) | 0 (0.0%) |
| 9:00 AM to 9:59 AM | 3 (7.7%) | 2 (1.9%) |
| 10:00 AM to 10:59 AM | 0 (0.0%) | 15 (14.0%) |
| 11:00 AM to 11:59 AM | 0 (0.0%) | 0 (0.0%) |
| 12:00 PM to 3:59 PM | 1 (2.6%) | 5 (4.7%) |
| 4:00 PM to 11:59 PM | 0 (0.0%) | 0 (0.0%) |
| Total | 39 (100.0%) | 107 (100.0%) |
Housing Occupancy in Fairfield
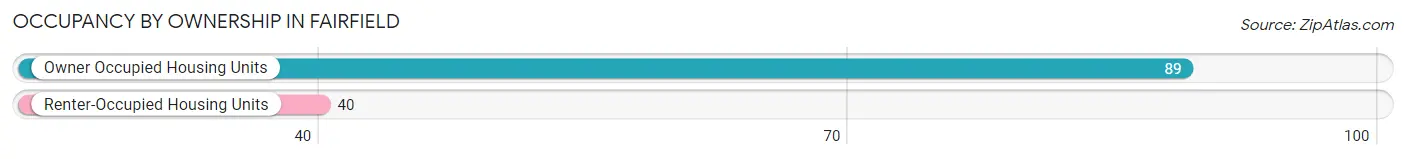
Occupancy by Ownership in Fairfield
Of the total 129 dwellings in Fairfield, owner-occupied units account for 89 (69.0%), while renter-occupied units make up 40 (31.0%).
| Occupancy | # Housing Units | % Housing Units |
| Owner Occupied Housing Units | 89 | 69.0% |
| Renter-Occupied Housing Units | 40 | 31.0% |
| Total Occupied Housing Units | 129 | 100.0% |
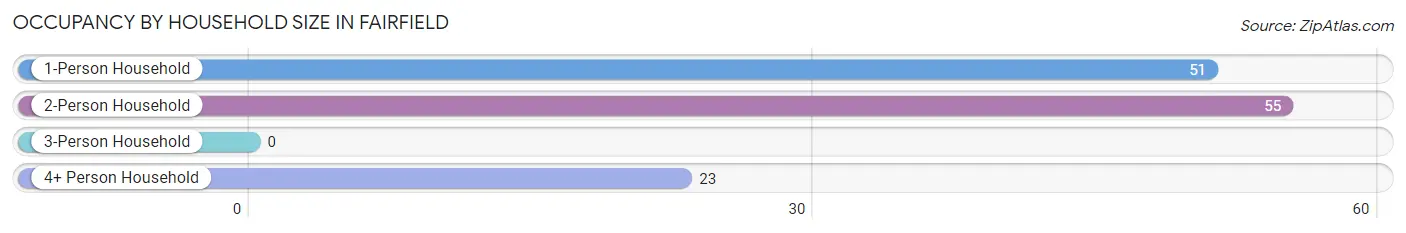
Occupancy by Household Size in Fairfield
| Household Size | # Housing Units | % Housing Units |
| 1-Person Household | 51 | 39.5% |
| 2-Person Household | 55 | 42.6% |
| 3-Person Household | 0 | 0.0% |
| 4+ Person Household | 23 | 17.8% |
| Total Housing Units | 129 | 100.0% |
Occupancy by Ownership by Household Size in Fairfield
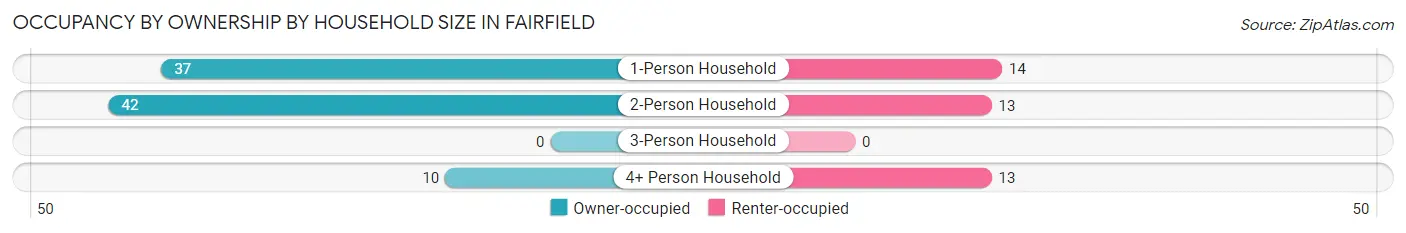
| Household Size | Owner-occupied | Renter-occupied |
| 1-Person Household | 37 (72.6%) | 14 (27.5%) |
| 2-Person Household | 42 (76.4%) | 13 (23.6%) |
| 3-Person Household | 0 (0.0%) | 0 (0.0%) |
| 4+ Person Household | 10 (43.5%) | 13 (56.5%) |
| Total Housing Units | 89 (69.0%) | 40 (31.0%) |
Occupancy by Educational Attainment in Fairfield
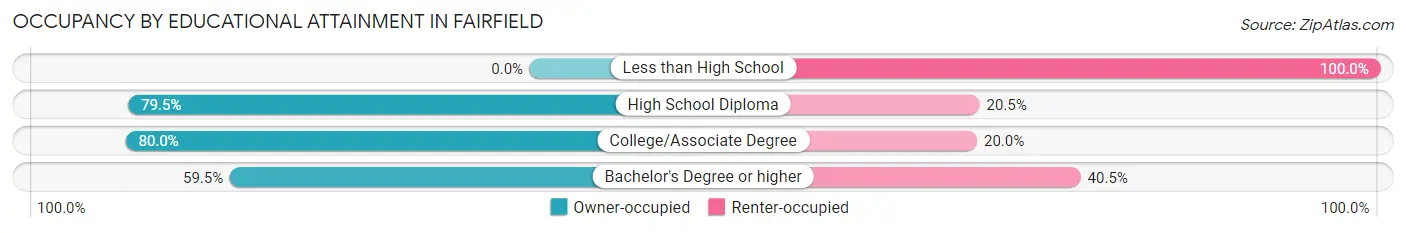
| Household Size | Owner-occupied | Renter-occupied |
| Less than High School | 0 (0.0%) | 8 (100.0%) |
| High School Diploma | 31 (79.5%) | 8 (20.5%) |
| College/Associate Degree | 36 (80.0%) | 9 (20.0%) |
| Bachelor's Degree or higher | 22 (59.5%) | 15 (40.5%) |
Occupancy by Age of Householder in Fairfield
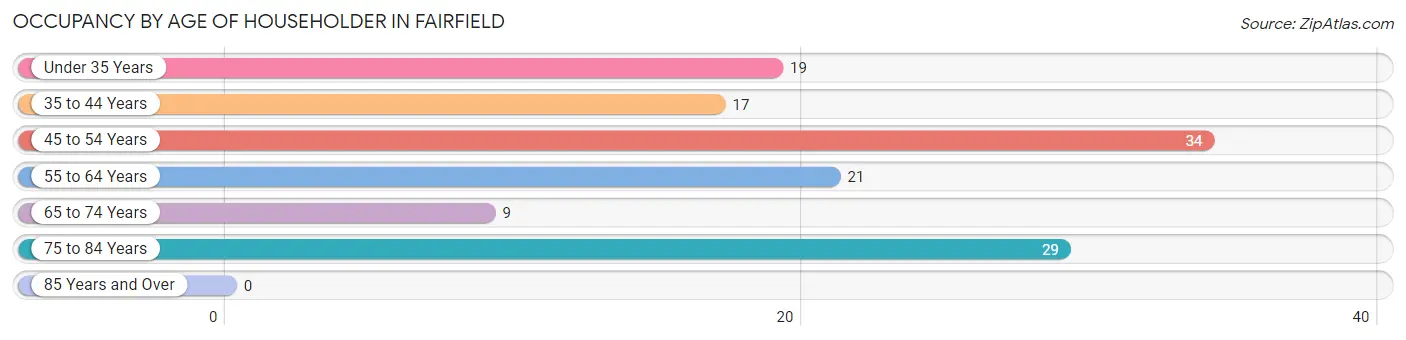
| Age Bracket | # Households | % Households |
| Under 35 Years | 19 | 14.7% |
| 35 to 44 Years | 17 | 13.2% |
| 45 to 54 Years | 34 | 26.4% |
| 55 to 64 Years | 21 | 16.3% |
| 65 to 74 Years | 9 | 7.0% |
| 75 to 84 Years | 29 | 22.5% |
| 85 Years and Over | 0 | 0.0% |
| Total | 129 | 100.0% |
Housing Finances in Fairfield
Median Income by Occupancy in Fairfield
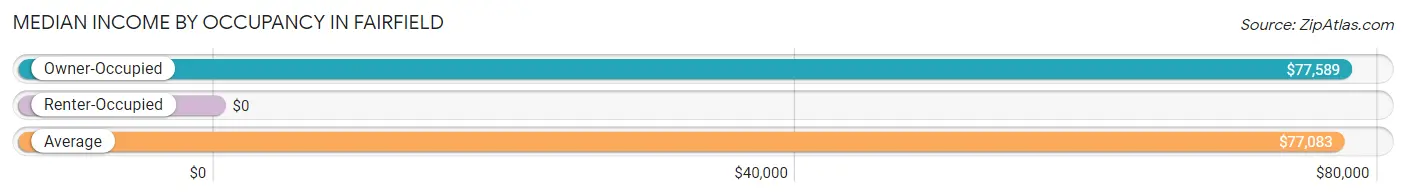
| Occupancy Type | # Households | Median Income |
| Owner-Occupied | 89 (69.0%) | $77,589 |
| Renter-Occupied | 40 (31.0%) | $0 |
| Average | 129 (100.0%) | $77,083 |
Occupancy by Householder Income Bracket in Fairfield
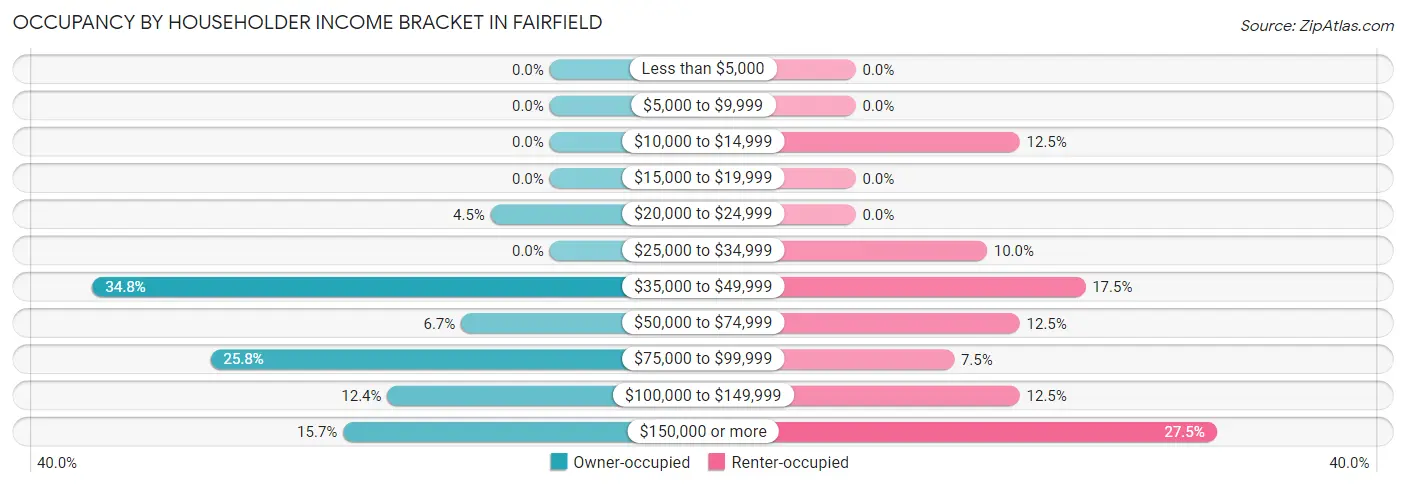
| Income Bracket | Owner-occupied | Renter-occupied |
| Less than $5,000 | 0 (0.0%) | 0 (0.0%) |
| $5,000 to $9,999 | 0 (0.0%) | 0 (0.0%) |
| $10,000 to $14,999 | 0 (0.0%) | 5 (12.5%) |
| $15,000 to $19,999 | 0 (0.0%) | 0 (0.0%) |
| $20,000 to $24,999 | 4 (4.5%) | 0 (0.0%) |
| $25,000 to $34,999 | 0 (0.0%) | 4 (10.0%) |
| $35,000 to $49,999 | 31 (34.8%) | 7 (17.5%) |
| $50,000 to $74,999 | 6 (6.7%) | 5 (12.5%) |
| $75,000 to $99,999 | 23 (25.8%) | 3 (7.5%) |
| $100,000 to $149,999 | 11 (12.4%) | 5 (12.5%) |
| $150,000 or more | 14 (15.7%) | 11 (27.5%) |
| Total | 89 (100.0%) | 40 (100.0%) |
Monthly Housing Cost Tiers in Fairfield
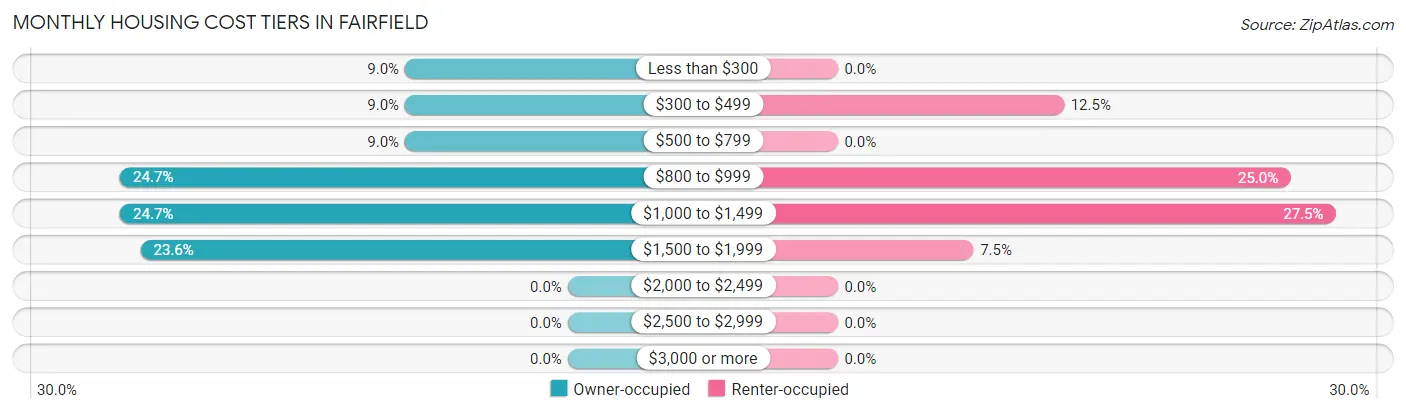
| Monthly Cost | Owner-occupied | Renter-occupied |
| Less than $300 | 8 (9.0%) | 0 (0.0%) |
| $300 to $499 | 8 (9.0%) | 5 (12.5%) |
| $500 to $799 | 8 (9.0%) | 0 (0.0%) |
| $800 to $999 | 22 (24.7%) | 10 (25.0%) |
| $1,000 to $1,499 | 22 (24.7%) | 11 (27.5%) |
| $1,500 to $1,999 | 21 (23.6%) | 3 (7.5%) |
| $2,000 to $2,499 | 0 (0.0%) | 0 (0.0%) |
| $2,500 to $2,999 | 0 (0.0%) | 0 (0.0%) |
| $3,000 or more | 0 (0.0%) | 0 (0.0%) |
| Total | 89 (100.0%) | 40 (100.0%) |
Physical Housing Characteristics in Fairfield
Housing Structures in Fairfield
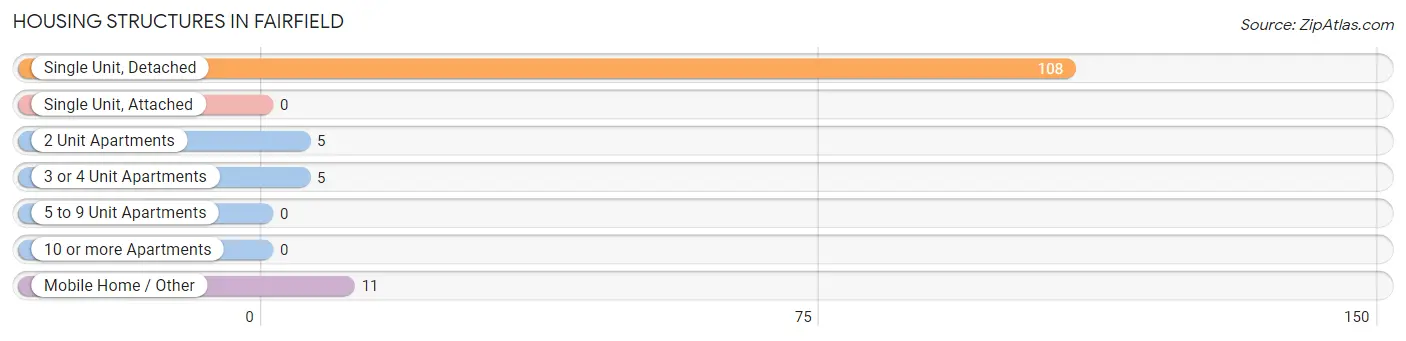
| Structure Type | # Housing Units | % Housing Units |
| Single Unit, Detached | 108 | 83.7% |
| Single Unit, Attached | 0 | 0.0% |
| 2 Unit Apartments | 5 | 3.9% |
| 3 or 4 Unit Apartments | 5 | 3.9% |
| 5 to 9 Unit Apartments | 0 | 0.0% |
| 10 or more Apartments | 0 | 0.0% |
| Mobile Home / Other | 11 | 8.5% |
| Total | 129 | 100.0% |
Housing Structures by Occupancy in Fairfield
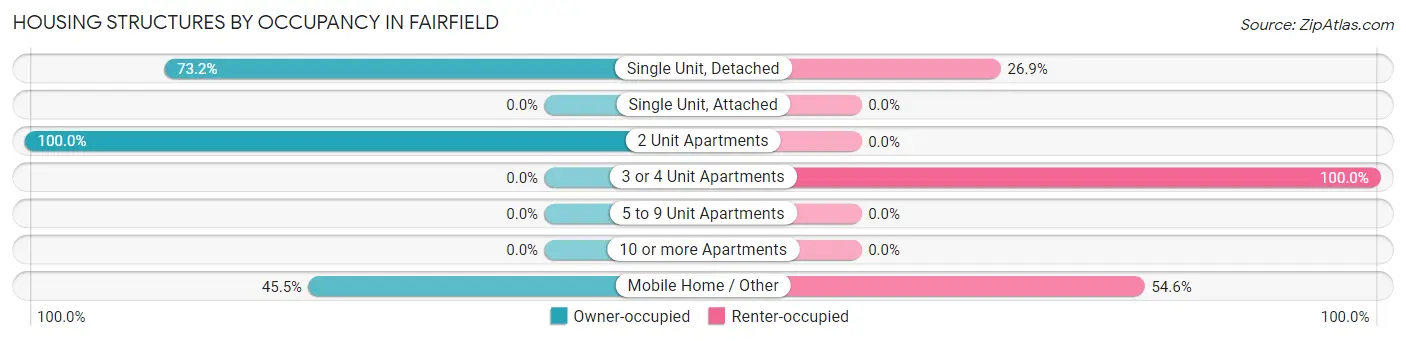
| Structure Type | Owner-occupied | Renter-occupied |
| Single Unit, Detached | 79 (73.2%) | 29 (26.9%) |
| Single Unit, Attached | 0 (0.0%) | 0 (0.0%) |
| 2 Unit Apartments | 5 (100.0%) | 0 (0.0%) |
| 3 or 4 Unit Apartments | 0 (0.0%) | 5 (100.0%) |
| 5 to 9 Unit Apartments | 0 (0.0%) | 0 (0.0%) |
| 10 or more Apartments | 0 (0.0%) | 0 (0.0%) |
| Mobile Home / Other | 5 (45.5%) | 6 (54.5%) |
| Total | 89 (69.0%) | 40 (31.0%) |
Housing Structures by Number of Rooms in Fairfield
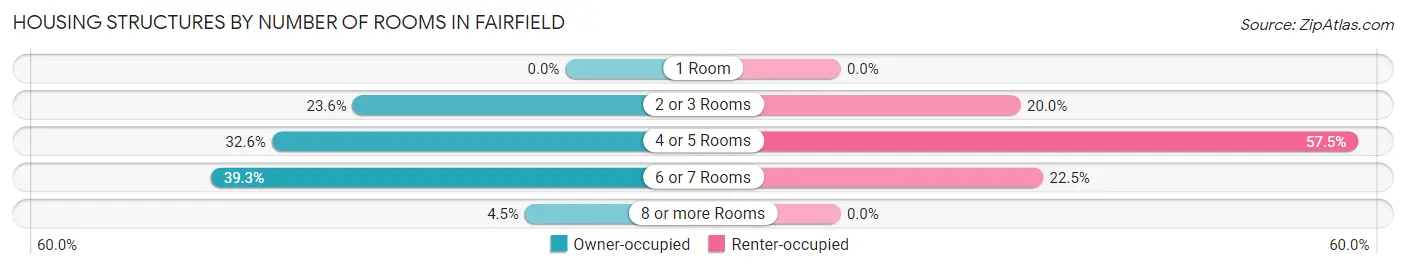
| Number of Rooms | Owner-occupied | Renter-occupied |
| 1 Room | 0 (0.0%) | 0 (0.0%) |
| 2 or 3 Rooms | 21 (23.6%) | 8 (20.0%) |
| 4 or 5 Rooms | 29 (32.6%) | 23 (57.5%) |
| 6 or 7 Rooms | 35 (39.3%) | 9 (22.5%) |
| 8 or more Rooms | 4 (4.5%) | 0 (0.0%) |
| Total | 89 (100.0%) | 40 (100.0%) |
Housing Structure by Heating Type in Fairfield
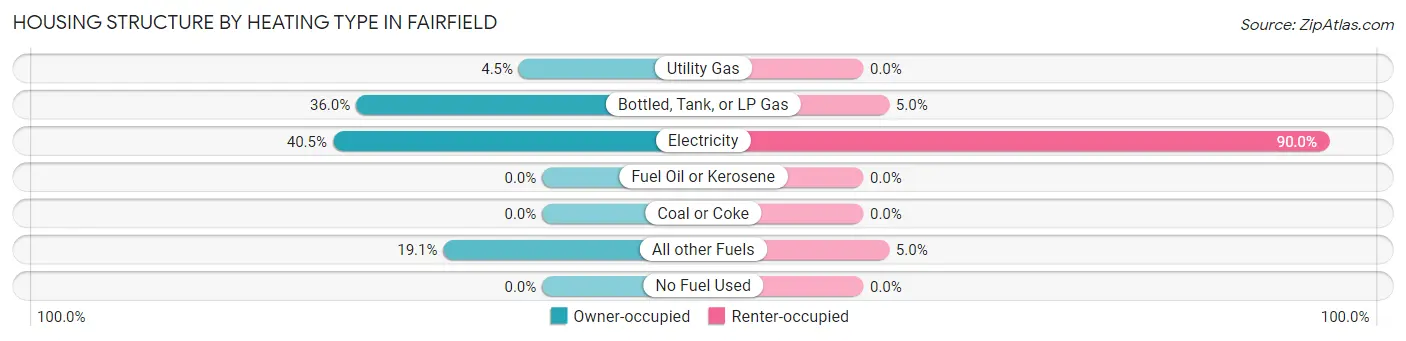
| Heating Type | Owner-occupied | Renter-occupied |
| Utility Gas | 4 (4.5%) | 0 (0.0%) |
| Bottled, Tank, or LP Gas | 32 (36.0%) | 2 (5.0%) |
| Electricity | 36 (40.5%) | 36 (90.0%) |
| Fuel Oil or Kerosene | 0 (0.0%) | 0 (0.0%) |
| Coal or Coke | 0 (0.0%) | 0 (0.0%) |
| All other Fuels | 17 (19.1%) | 2 (5.0%) |
| No Fuel Used | 0 (0.0%) | 0 (0.0%) |
| Total | 89 (100.0%) | 40 (100.0%) |
Household Vehicle Usage in Fairfield
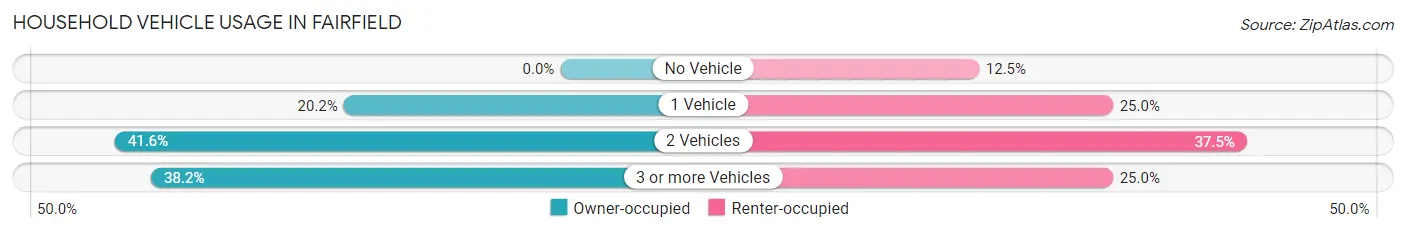
| Vehicles per Household | Owner-occupied | Renter-occupied |
| No Vehicle | 0 (0.0%) | 5 (12.5%) |
| 1 Vehicle | 18 (20.2%) | 10 (25.0%) |
| 2 Vehicles | 37 (41.6%) | 15 (37.5%) |
| 3 or more Vehicles | 34 (38.2%) | 10 (25.0%) |
| Total | 89 (100.0%) | 40 (100.0%) |
Real Estate & Mortgages in Fairfield
Real Estate and Mortgage Overview in Fairfield
| Characteristic | Without Mortgage | With Mortgage |
| Housing Units | 24 | 65 |
| Median Property Value | - | - |
| Median Household Income | $90,625 | $9 |
| Monthly Housing Costs | $375 | $0 |
| Real Estate Taxes | $1,125 | $4 |
Property Value by Mortgage Status in Fairfield
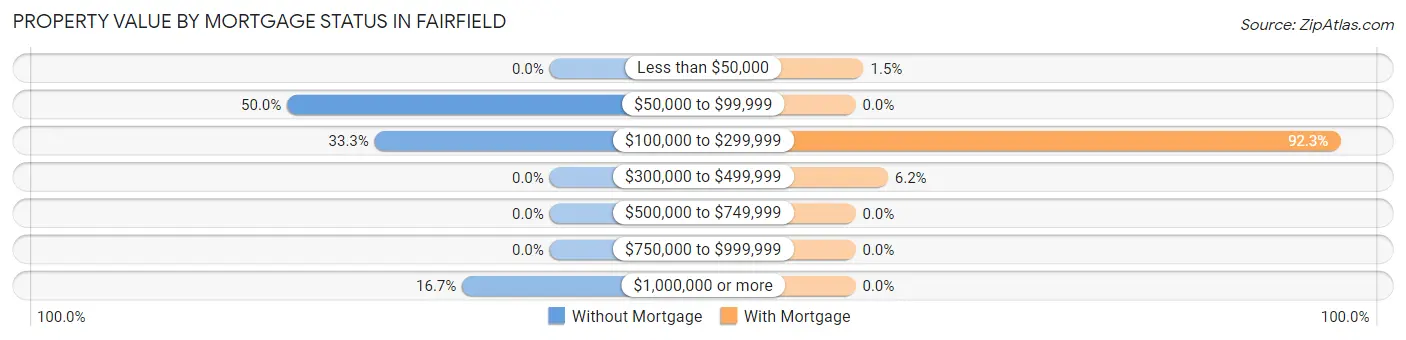
| Property Value | Without Mortgage | With Mortgage |
| Less than $50,000 | 0 (0.0%) | 1 (1.5%) |
| $50,000 to $99,999 | 12 (50.0%) | 0 (0.0%) |
| $100,000 to $299,999 | 8 (33.3%) | 60 (92.3%) |
| $300,000 to $499,999 | 0 (0.0%) | 4 (6.1%) |
| $500,000 to $749,999 | 0 (0.0%) | 0 (0.0%) |
| $750,000 to $999,999 | 0 (0.0%) | 0 (0.0%) |
| $1,000,000 or more | 4 (16.7%) | 0 (0.0%) |
| Total | 24 (100.0%) | 65 (100.0%) |
Household Income by Mortgage Status in Fairfield
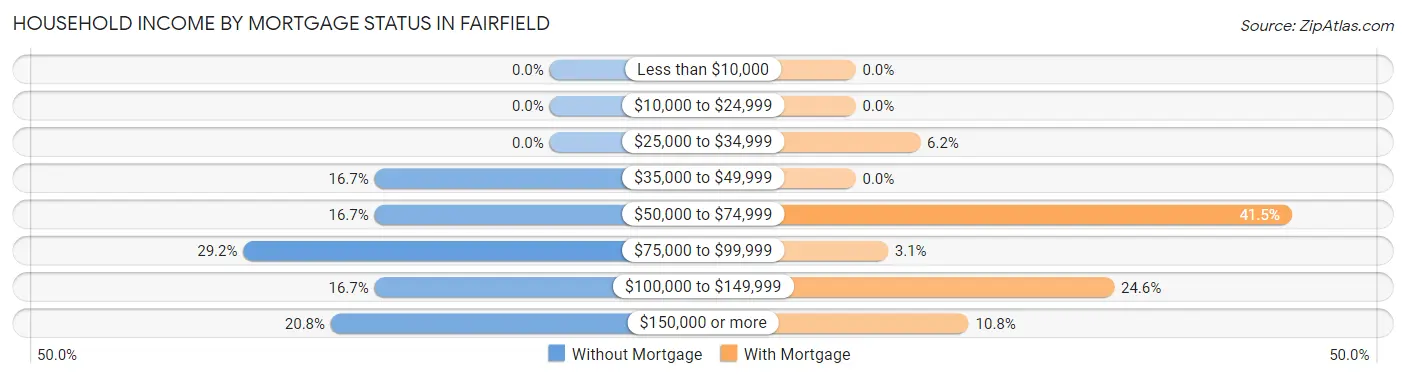
| Household Income | Without Mortgage | With Mortgage |
| Less than $10,000 | 0 (0.0%) | 0 (0.0%) |
| $10,000 to $24,999 | 0 (0.0%) | 0 (0.0%) |
| $25,000 to $34,999 | 0 (0.0%) | 4 (6.1%) |
| $35,000 to $49,999 | 4 (16.7%) | 0 (0.0%) |
| $50,000 to $74,999 | 4 (16.7%) | 27 (41.5%) |
| $75,000 to $99,999 | 7 (29.2%) | 2 (3.1%) |
| $100,000 to $149,999 | 4 (16.7%) | 16 (24.6%) |
| $150,000 or more | 5 (20.8%) | 7 (10.8%) |
| Total | 24 (100.0%) | 65 (100.0%) |
Property Value to Household Income Ratio in Fairfield
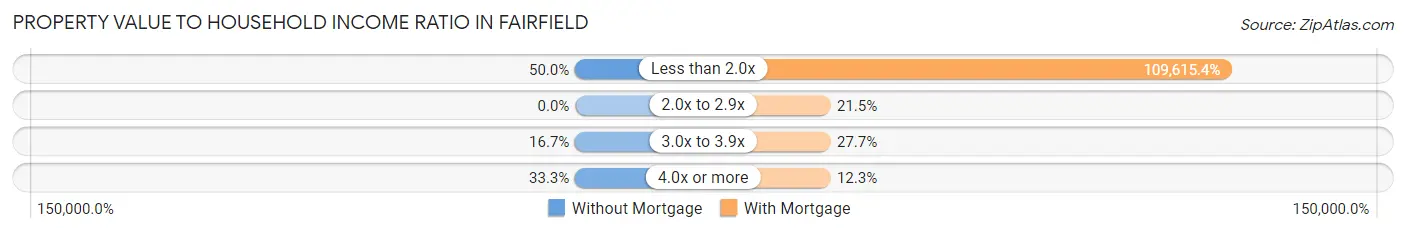
| Value-to-Income Ratio | Without Mortgage | With Mortgage |
| Less than 2.0x | 12 (50.0%) | 71,250 (109,615.4%) |
| 2.0x to 2.9x | 0 (0.0%) | 14 (21.5%) |
| 3.0x to 3.9x | 4 (16.7%) | 18 (27.7%) |
| 4.0x or more | 8 (33.3%) | 8 (12.3%) |
| Total | 24 (100.0%) | 65 (100.0%) |
Real Estate Taxes by Mortgage Status in Fairfield
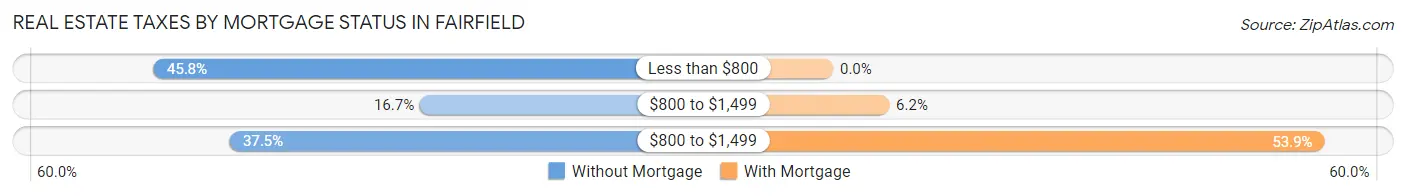
| Property Taxes | Without Mortgage | With Mortgage |
| Less than $800 | 11 (45.8%) | 0 (0.0%) |
| $800 to $1,499 | 4 (16.7%) | 4 (6.1%) |
| $800 to $1,499 | 9 (37.5%) | 35 (53.8%) |
| Total | 24 (100.0%) | 65 (100.0%) |
Health & Disability in Fairfield
Health Insurance Coverage by Age in Fairfield
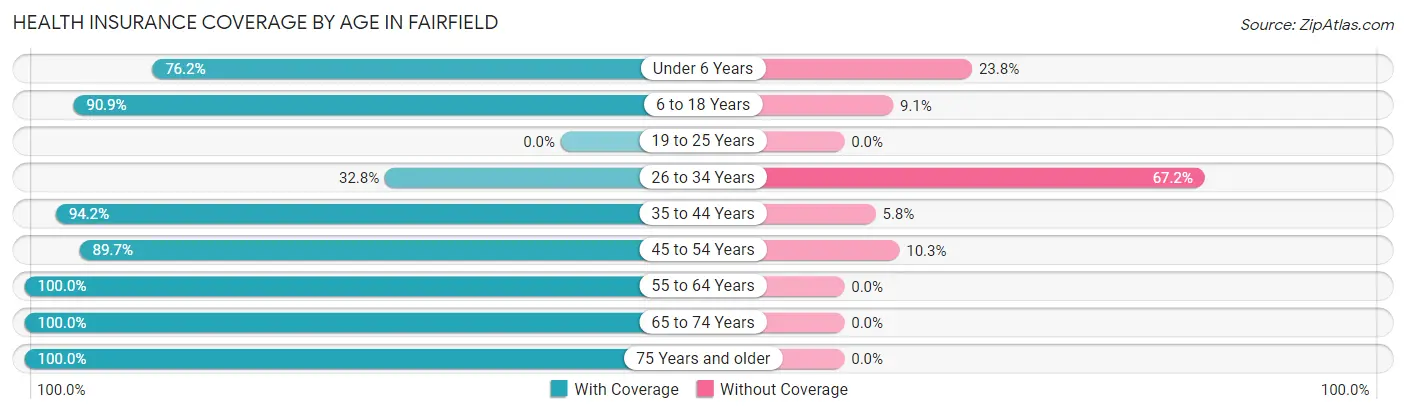
| Age Bracket | With Coverage | Without Coverage |
| Under 6 Years | 16 (76.2%) | 5 (23.8%) |
| 6 to 18 Years | 130 (90.9%) | 13 (9.1%) |
| 19 to 25 Years | 0 (0.0%) | 0 (0.0%) |
| 26 to 34 Years | 20 (32.8%) | 41 (67.2%) |
| 35 to 44 Years | 97 (94.2%) | 6 (5.8%) |
| 45 to 54 Years | 35 (89.7%) | 4 (10.3%) |
| 55 to 64 Years | 39 (100.0%) | 0 (0.0%) |
| 65 to 74 Years | 9 (100.0%) | 0 (0.0%) |
| 75 Years and older | 48 (100.0%) | 0 (0.0%) |
| Total | 394 (85.1%) | 69 (14.9%) |
Health Insurance Coverage by Citizenship Status in Fairfield
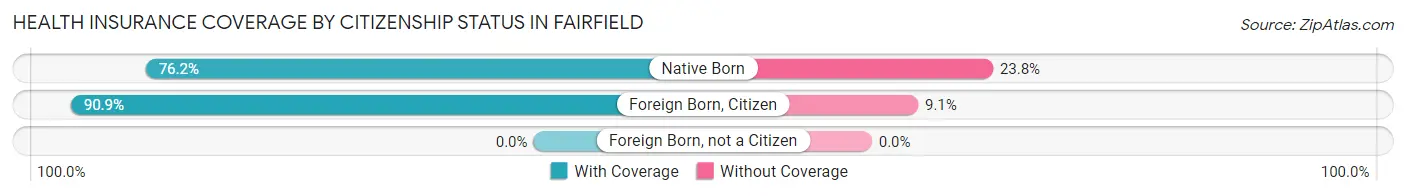
| Citizenship Status | With Coverage | Without Coverage |
| Native Born | 16 (76.2%) | 5 (23.8%) |
| Foreign Born, Citizen | 130 (90.9%) | 13 (9.1%) |
| Foreign Born, not a Citizen | 0 (0.0%) | 0 (0.0%) |
Health Insurance Coverage by Household Income in Fairfield
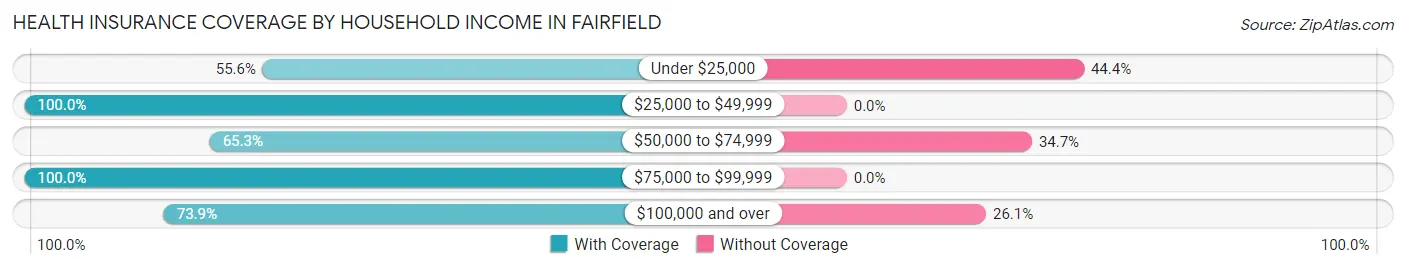
| Household Income | With Coverage | Without Coverage |
| Under $25,000 | 5 (55.6%) | 4 (44.4%) |
| $25,000 to $49,999 | 65 (100.0%) | 0 (0.0%) |
| $50,000 to $74,999 | 32 (65.3%) | 17 (34.7%) |
| $75,000 to $99,999 | 156 (100.0%) | 0 (0.0%) |
| $100,000 and over | 136 (73.9%) | 48 (26.1%) |
Public vs Private Health Insurance Coverage by Age in Fairfield
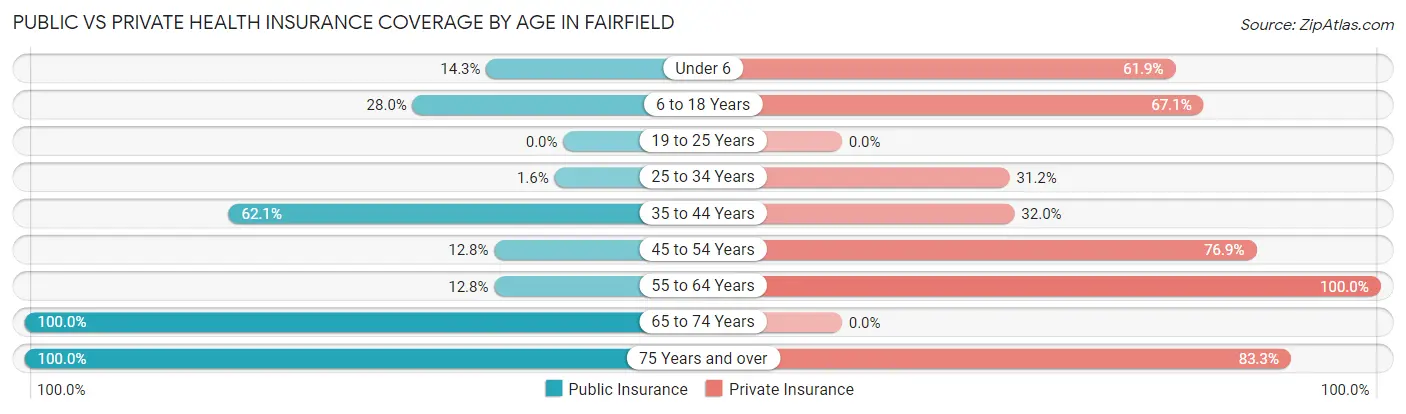
| Age Bracket | Public Insurance | Private Insurance |
| Under 6 | 3 (14.3%) | 13 (61.9%) |
| 6 to 18 Years | 40 (28.0%) | 96 (67.1%) |
| 19 to 25 Years | 0 (0.0%) | 0 (0.0%) |
| 25 to 34 Years | 1 (1.6%) | 19 (31.1%) |
| 35 to 44 Years | 64 (62.1%) | 33 (32.0%) |
| 45 to 54 Years | 5 (12.8%) | 30 (76.9%) |
| 55 to 64 Years | 5 (12.8%) | 39 (100.0%) |
| 65 to 74 Years | 9 (100.0%) | 0 (0.0%) |
| 75 Years and over | 48 (100.0%) | 40 (83.3%) |
| Total | 175 (37.8%) | 270 (58.3%) |
Disability Status by Sex by Age in Fairfield
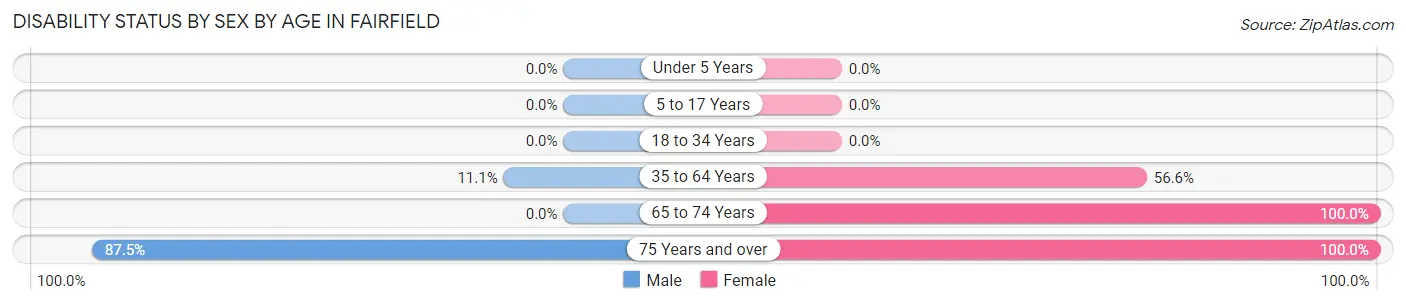
| Age Bracket | Male | Female |
| Under 5 Years | 0 (0.0%) | 0 (0.0%) |
| 5 to 17 Years | 0 (0.0%) | 0 (0.0%) |
| 18 to 34 Years | 0 (0.0%) | 0 (0.0%) |
| 35 to 64 Years | 5 (11.1%) | 77 (56.6%) |
| 65 to 74 Years | 0 (0.0%) | 9 (100.0%) |
| 75 Years and over | 35 (87.5%) | 8 (100.0%) |
Disability Class by Sex by Age in Fairfield
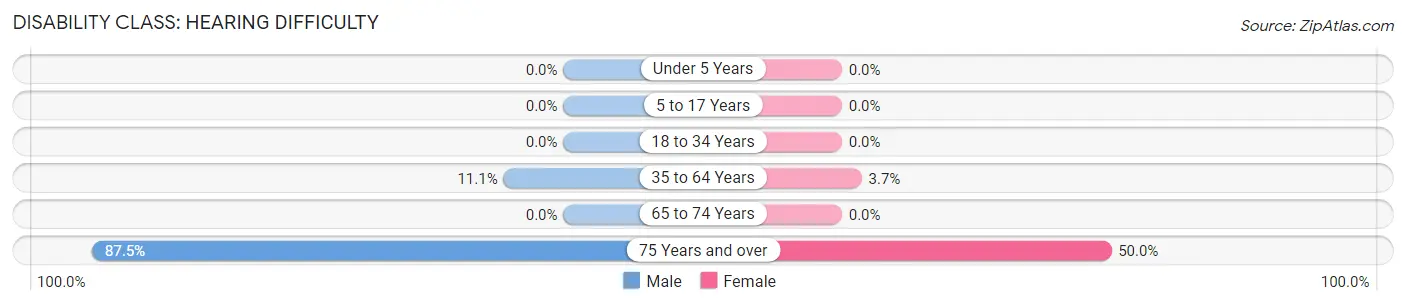
Disability Class: Hearing Difficulty
| Age Bracket | Male | Female |
| Under 5 Years | 0 (0.0%) | 0 (0.0%) |
| 5 to 17 Years | 0 (0.0%) | 0 (0.0%) |
| 18 to 34 Years | 0 (0.0%) | 0 (0.0%) |
| 35 to 64 Years | 5 (11.1%) | 5 (3.7%) |
| 65 to 74 Years | 0 (0.0%) | 0 (0.0%) |
| 75 Years and over | 35 (87.5%) | 4 (50.0%) |
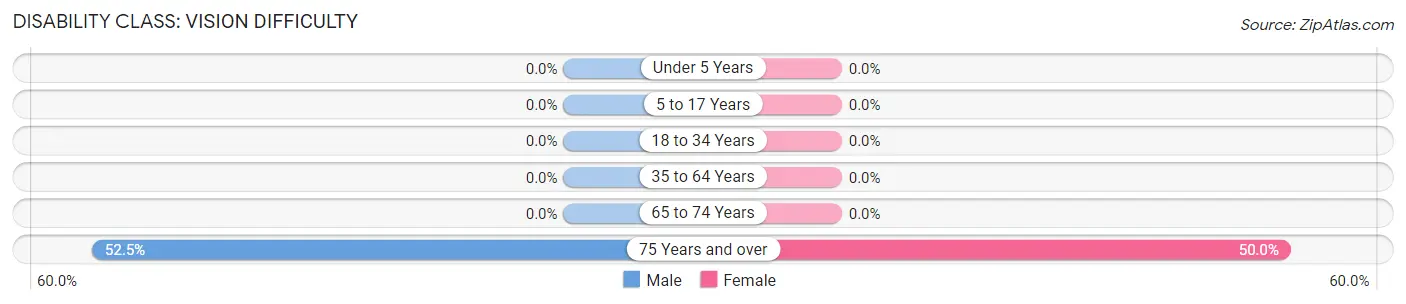
Disability Class: Vision Difficulty
| Age Bracket | Male | Female |
| Under 5 Years | 0 (0.0%) | 0 (0.0%) |
| 5 to 17 Years | 0 (0.0%) | 0 (0.0%) |
| 18 to 34 Years | 0 (0.0%) | 0 (0.0%) |
| 35 to 64 Years | 0 (0.0%) | 0 (0.0%) |
| 65 to 74 Years | 0 (0.0%) | 0 (0.0%) |
| 75 Years and over | 21 (52.5%) | 4 (50.0%) |
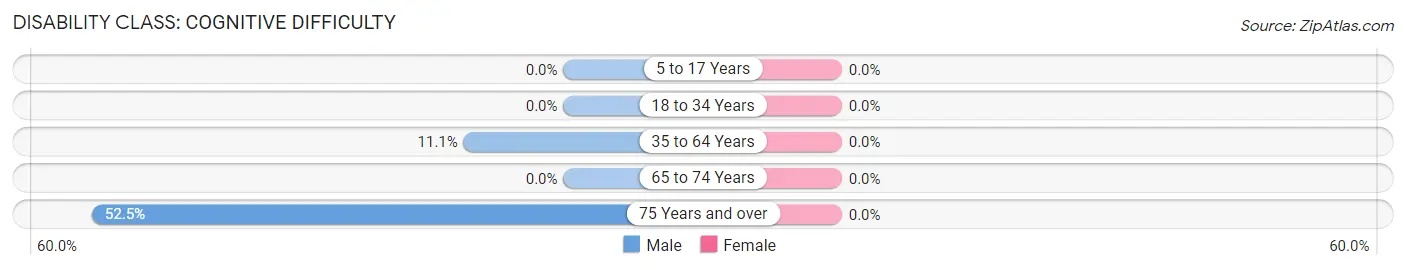
Disability Class: Cognitive Difficulty
| Age Bracket | Male | Female |
| 5 to 17 Years | 0 (0.0%) | 0 (0.0%) |
| 18 to 34 Years | 0 (0.0%) | 0 (0.0%) |
| 35 to 64 Years | 5 (11.1%) | 0 (0.0%) |
| 65 to 74 Years | 0 (0.0%) | 0 (0.0%) |
| 75 Years and over | 21 (52.5%) | 0 (0.0%) |
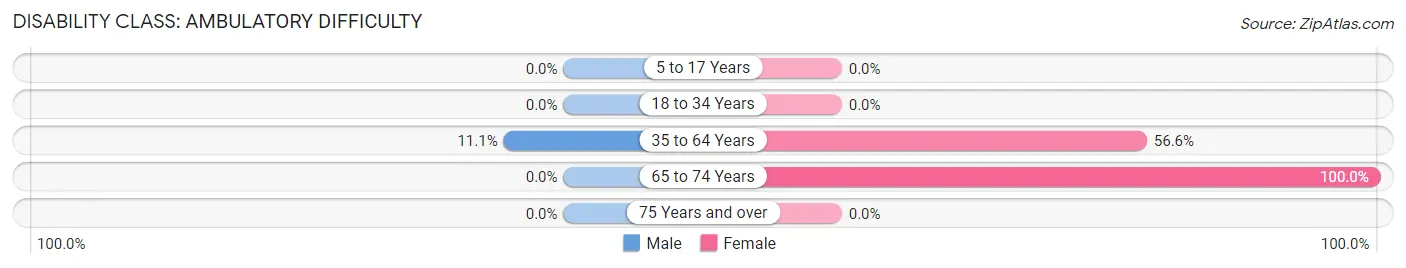
Disability Class: Ambulatory Difficulty
| Age Bracket | Male | Female |
| 5 to 17 Years | 0 (0.0%) | 0 (0.0%) |
| 18 to 34 Years | 0 (0.0%) | 0 (0.0%) |
| 35 to 64 Years | 5 (11.1%) | 77 (56.6%) |
| 65 to 74 Years | 0 (0.0%) | 9 (100.0%) |
| 75 Years and over | 0 (0.0%) | 0 (0.0%) |
Disability Class: Self-Care Difficulty
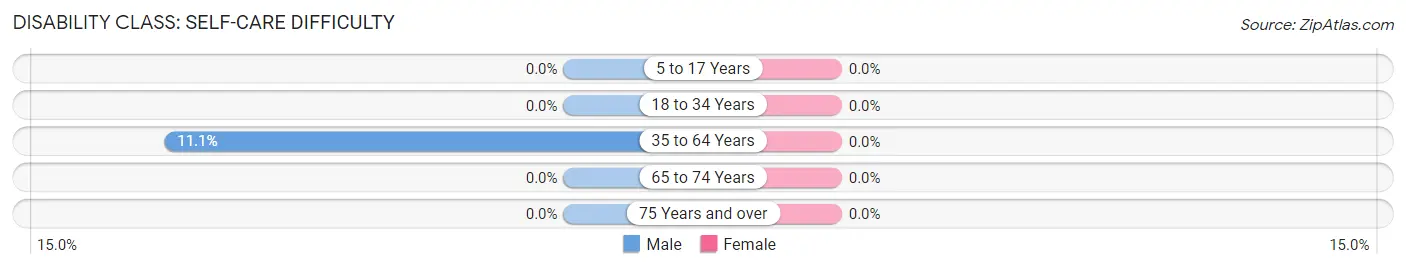
| Age Bracket | Male | Female |
| 5 to 17 Years | 0 (0.0%) | 0 (0.0%) |
| 18 to 34 Years | 0 (0.0%) | 0 (0.0%) |
| 35 to 64 Years | 5 (11.1%) | 0 (0.0%) |
| 65 to 74 Years | 0 (0.0%) | 0 (0.0%) |
| 75 Years and over | 0 (0.0%) | 0 (0.0%) |
Technology Access in Fairfield
Computing Device Access in Fairfield
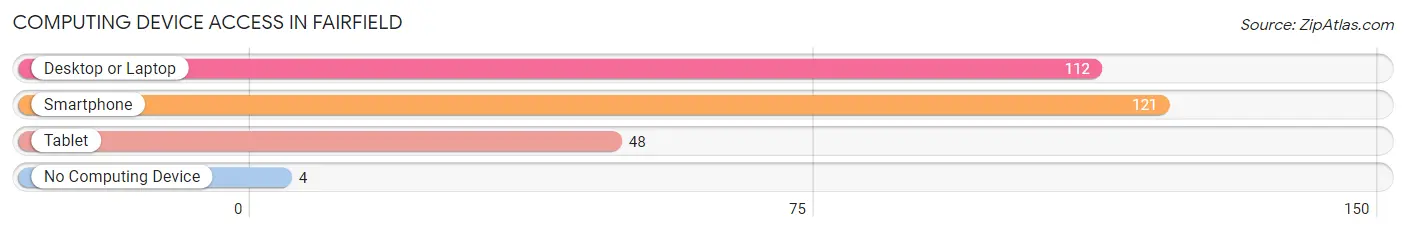
| Device Type | # Households | % Households |
| Desktop or Laptop | 112 | 86.8% |
| Smartphone | 121 | 93.8% |
| Tablet | 48 | 37.2% |
| No Computing Device | 4 | 3.1% |
| Total | 129 | 100.0% |
Internet Access in Fairfield
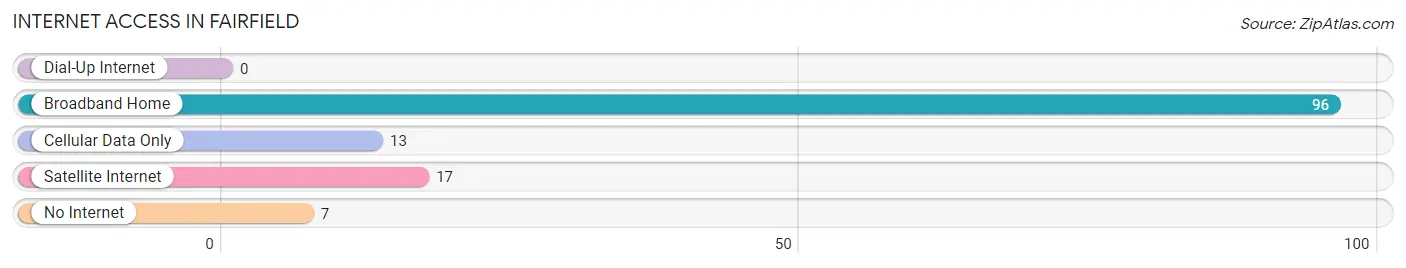
| Internet Type | # Households | % Households |
| Dial-Up Internet | 0 | 0.0% |
| Broadband Home | 96 | 74.4% |
| Cellular Data Only | 13 | 10.1% |
| Satellite Internet | 17 | 13.2% |
| No Internet | 7 | 5.4% |
| Total | 129 | 100.0% |
Fairfield Summary
Fairfield, Idaho is a small city located in the western part of the state, in the foothills of the Rocky Mountains. It is situated in the southeastern corner of Blaine County, and is the county seat. The city has a population of approximately 1,500 people, and is part of the larger Twin Falls metropolitan area.
History
Fairfield was founded in 1883 by a group of settlers from the nearby town of Hailey. The settlers were looking for a place to settle that was closer to the railroad, which had recently been built in the area. The town was named after the nearby Fairfield Creek, which was named after a nearby homesteader. The town quickly grew, and by the early 1900s, it had become a bustling center of commerce and industry.
The town was home to a number of businesses, including a flour mill, a sawmill, a creamery, and a blacksmith shop. The town also had a number of churches, including the First Presbyterian Church, which was founded in 1884.
In the early 1900s, the town was also home to a number of saloons and gambling halls. This led to a period of lawlessness, and the town was known as a “wide open” town. This period of lawlessness ended in the 1920s, when the town was incorporated and a police force was established.
Geography
Fairfield is located in the southeastern corner of Blaine County, in the foothills of the Rocky Mountains. The city is situated at an elevation of 4,890 feet above sea level. The city is surrounded by mountains, including the Sawtooth Range to the north, the White Cloud Mountains to the east, and the Pioneer Mountains to the south.
The city is located in a semi-arid climate, with hot summers and cold winters. The average annual temperature is around 50 degrees Fahrenheit, and the average annual precipitation is around 12 inches.
Economy
The economy of Fairfield is largely based on agriculture and tourism. The city is home to a number of farms, which produce a variety of crops, including potatoes, alfalfa, and wheat. The city is also home to a number of tourist attractions, including the Fairfield Museum and the Fairfield Historical Society.
The city is also home to a number of businesses, including a number of restaurants, retail stores, and service providers. The city is also home to a number of manufacturing companies, including a furniture factory and a woodworking shop.
Demographics
As of the 2010 census, the population of Fairfield was 1,500 people. The racial makeup of the city was 95.3% White, 0.7% African American, 0.7% Native American, 0.3% Asian, 0.3% from other races, and 2.7% from two or more races. The median household income was $37,500, and the median family income was $45,000. The per capita income was $19,000.
Conclusion
Fairfield, Idaho is a small city located in the western part of the state, in the foothills of the Rocky Mountains. It is situated in the southeastern corner of Blaine County, and is the county seat. The city has a population of approximately 1,500 people, and is part of the larger Twin Falls metropolitan area. The economy of Fairfield is largely based on agriculture and tourism, and the city is home to a number of businesses, including a number of restaurants, retail stores, and service providers. The racial makeup of the city is 95.3% White, 0.7% African American, 0.7% Native American, 0.3% Asian, 0.3% from other races, and 2.7% from two or more races. The median household income was $37,500, and the median family income was $45,000. The per capita income was $19,000.
Common Questions
What is the Total Population of Fairfield?
Total Population of Fairfield is 463.
What is the Total Male Population of Fairfield?
Total Male Population of Fairfield is 182.
What is the Total Female Population of Fairfield?
Total Female Population of Fairfield is 281.
What is the Ratio of Males per 100 Females in Fairfield?
There are 64.77 Males per 100 Females in Fairfield.
What is the Ratio of Females per 100 Males in Fairfield?
There are 154.40 Females per 100 Males in Fairfield.
What is the Median Population Age in Fairfield?
Median Population Age in Fairfield is 35.7 Years.
What is the Average Family Size in Fairfield
Average Family Size in Fairfield is 5.5 People.
What is the Average Household Size in Fairfield
Average Household Size in Fairfield is 3.6 People.
What is Per Capita Income in Fairfield?
Per Capita income in Fairfield is $38,473.
What is the Median Family Income in Fairfield?
Median Family Income in Fairfield is $79,732.
What is the Median Household income in Fairfield?
Median Household Income in Fairfield is $77,083.
What is Inequality or Gini Index in Fairfield?
Inequality or Gini Index in Fairfield is 0.44.
How Large is the Labor Force in Fairfield?
There are 205 People in the Labor Forcein in Fairfield.
What is the Percentage of People in the Labor Force in Fairfield?
56.3% of People are in the Labor Force in Fairfield.
What is the Unemployment Rate in Fairfield?
Unemployment Rate in Fairfield is 12.7%.