Sandpoint, ID
Sandpoint Map
Sandpoint Overview
8,899
TOTAL POPULATION
4,367
MALE POPULATION
4,532
FEMALE POPULATION
96.36
MALES / 100 FEMALES
103.78
FEMALES / 100 MALES
42.4
MEDIAN AGE
3.0
AVG FAMILY SIZE
2.4
AVG HOUSEHOLD SIZE
$33,808
PER CAPITA INCOME
$77,429
AVG FAMILY INCOME
$60,208
AVG HOUSEHOLD INCOME
23.2%
WAGE / INCOME GAP [ % ]
76.8¢/ $1
WAGE / INCOME GAP [ $ ]
0.47
INEQUALITY / GINI INDEX
4,329
LABOR FORCE [ PEOPLE ]
60.9%
PERCENT IN LABOR FORCE
2.7%
UNEMPLOYMENT RATE
Sandpoint Zip Codes
Sandpoint Area Codes
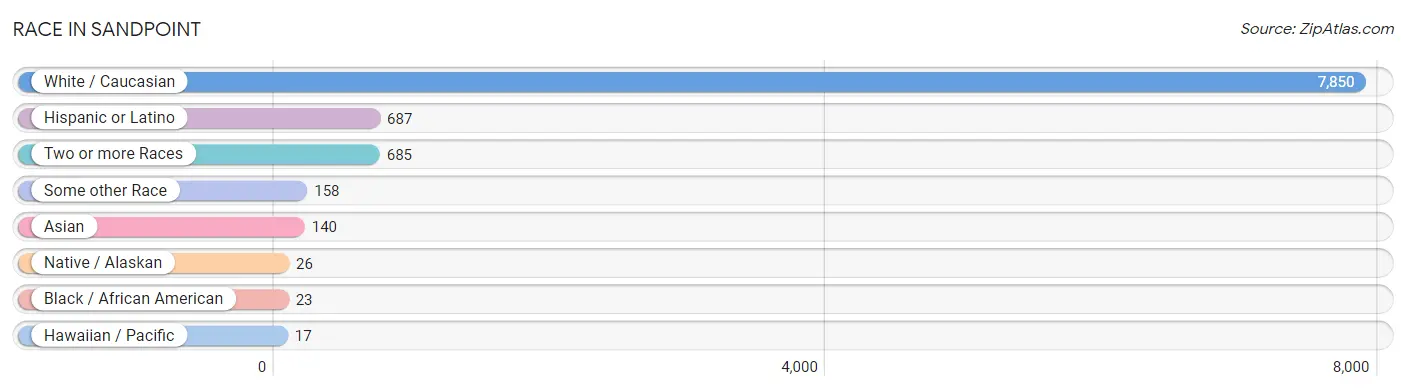
Race in Sandpoint
The most populous races in Sandpoint are White / Caucasian (7,850 | 88.2%), Hispanic or Latino (687 | 7.7%), and Two or more Races (685 | 7.7%).
| Race | # Population | % Population |
| Asian | 140 | 1.6% |
| Black / African American | 23 | 0.3% |
| Hawaiian / Pacific | 17 | 0.2% |
| Hispanic or Latino | 687 | 7.7% |
| Native / Alaskan | 26 | 0.3% |
| White / Caucasian | 7,850 | 88.2% |
| Two or more Races | 685 | 7.7% |
| Some other Race | 158 | 1.8% |
| Total | 8,899 | 100.0% |
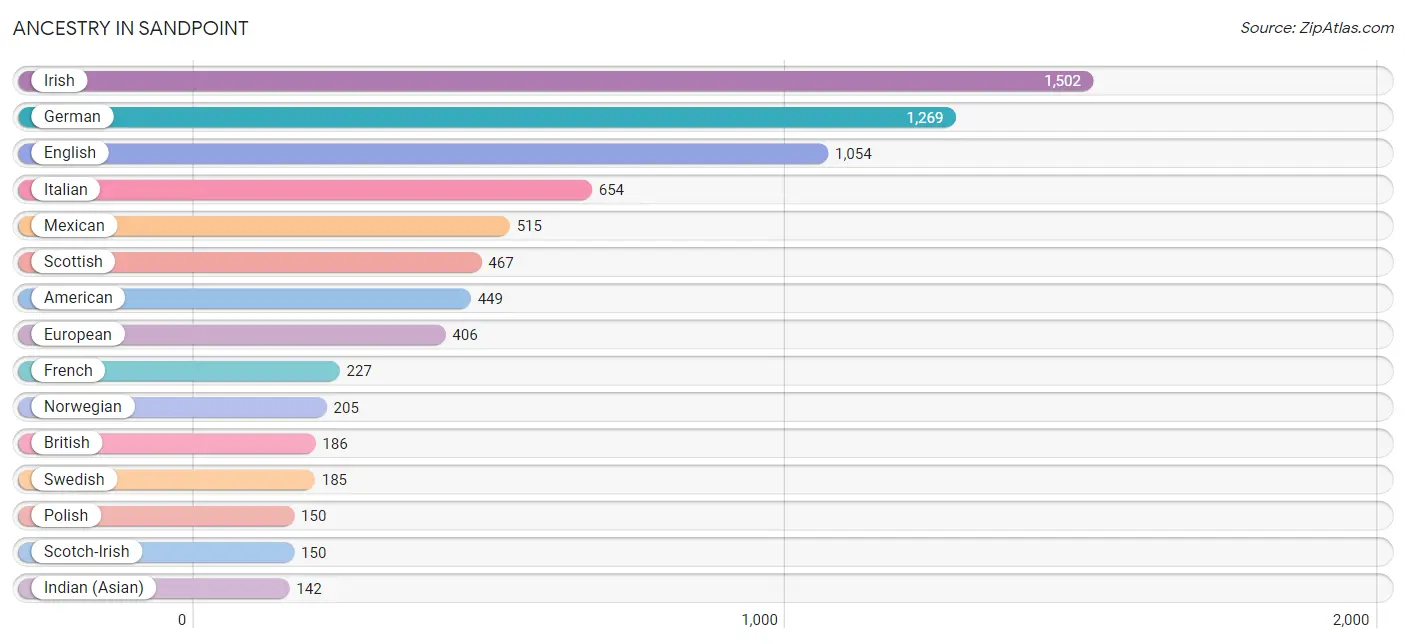
Ancestry in Sandpoint
The most populous ancestries reported in Sandpoint are Irish (1,502 | 16.9%), German (1,269 | 14.3%), English (1,054 | 11.8%), Italian (654 | 7.3%), and Mexican (515 | 5.8%), together accounting for 56.1% of all Sandpoint residents.
| Ancestry | # Population | % Population |
| American | 449 | 5.1% |
| Argentinean | 28 | 0.3% |
| Austrian | 47 | 0.5% |
| Belizean | 5 | 0.1% |
| Bhutanese | 120 | 1.3% |
| British | 186 | 2.1% |
| Burmese | 52 | 0.6% |
| Canadian | 34 | 0.4% |
| Celtic | 11 | 0.1% |
| Central American | 17 | 0.2% |
| Cherokee | 13 | 0.2% |
| Chinese | 1 | 0.0% |
| Chippewa | 4 | 0.0% |
| Colombian | 21 | 0.2% |
| Colville | 5 | 0.1% |
| Croatian | 86 | 1.0% |
| Cuban | 20 | 0.2% |
| Czech | 13 | 0.2% |
| Czechoslovakian | 13 | 0.2% |
| Danish | 53 | 0.6% |
| Dutch | 127 | 1.4% |
| Eastern European | 27 | 0.3% |
| English | 1,054 | 11.8% |
| European | 406 | 4.6% |
| Fijian | 8 | 0.1% |
| Finnish | 42 | 0.5% |
| French | 227 | 2.5% |
| French Canadian | 52 | 0.6% |
| German | 1,269 | 14.3% |
| Greek | 15 | 0.2% |
| Hungarian | 24 | 0.3% |
| Indian (Asian) | 142 | 1.6% |
| Inupiat | 14 | 0.2% |
| Irish | 1,502 | 16.9% |
| Iroquois | 3 | 0.0% |
| Italian | 654 | 7.3% |
| Korean | 25 | 0.3% |
| Lithuanian | 17 | 0.2% |
| Mexican | 515 | 5.8% |
| Native Hawaiian | 21 | 0.2% |
| Northern European | 19 | 0.2% |
| Norwegian | 205 | 2.3% |
| Pakistani | 19 | 0.2% |
| Polish | 150 | 1.7% |
| Portuguese | 95 | 1.1% |
| Puerto Rican | 24 | 0.3% |
| Romanian | 77 | 0.9% |
| Russian | 10 | 0.1% |
| Salvadoran | 17 | 0.2% |
| Scandinavian | 127 | 1.4% |
| Scotch-Irish | 150 | 1.7% |
| Scottish | 467 | 5.2% |
| Shoshone | 11 | 0.1% |
| Slovene | 66 | 0.7% |
| South American | 49 | 0.5% |
| Spanish | 26 | 0.3% |
| Swedish | 185 | 2.1% |
| Swiss | 31 | 0.4% |
| Tongan | 5 | 0.1% |
| Ukrainian | 19 | 0.2% |
| Welsh | 68 | 0.8% | View All 61 Rows |
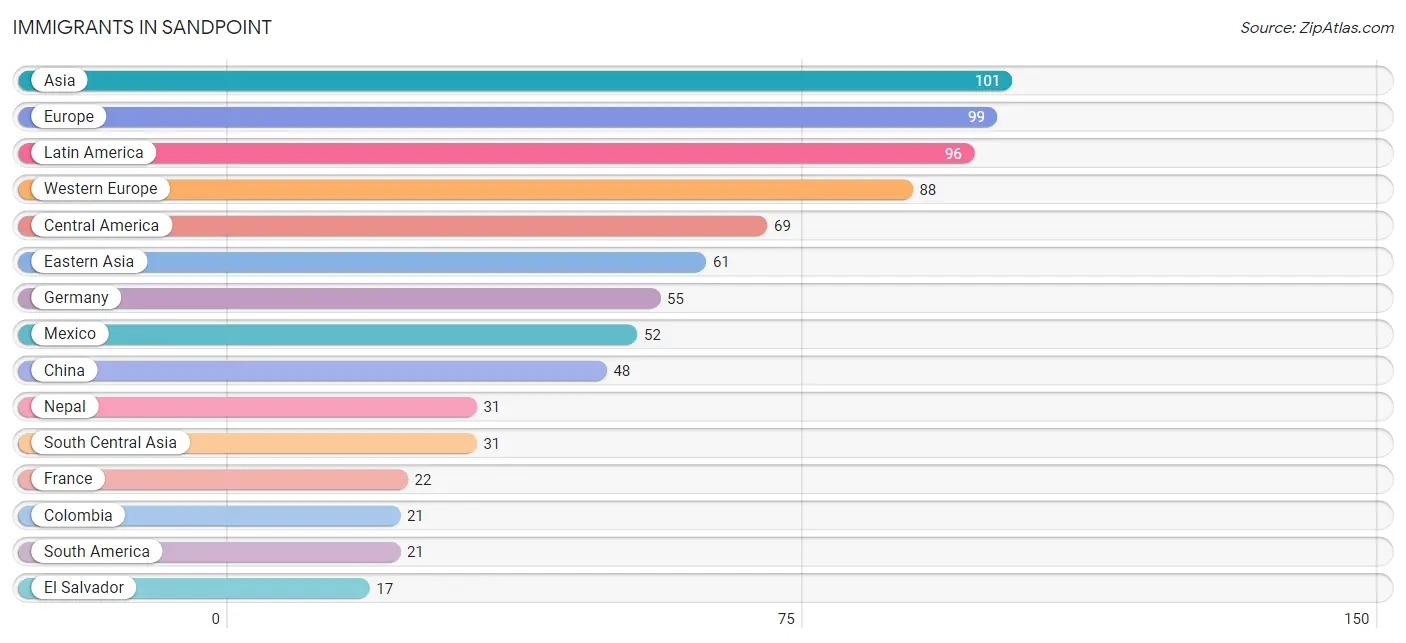
Immigrants in Sandpoint
The most numerous immigrant groups reported in Sandpoint came from Asia (101 | 1.1%), Europe (99 | 1.1%), Latin America (96 | 1.1%), Western Europe (88 | 1.0%), and Central America (69 | 0.8%), together accounting for 5.1% of all Sandpoint residents.
| Immigration Origin | # Population | % Population |
| Asia | 101 | 1.1% |
| Canada | 16 | 0.2% |
| Caribbean | 6 | 0.1% |
| Central America | 69 | 0.8% |
| China | 48 | 0.5% |
| Colombia | 21 | 0.2% |
| Cuba | 6 | 0.1% |
| Eastern Asia | 61 | 0.7% |
| El Salvador | 17 | 0.2% |
| England | 11 | 0.1% |
| Europe | 99 | 1.1% |
| France | 22 | 0.3% |
| Germany | 55 | 0.6% |
| Indonesia | 8 | 0.1% |
| Korea | 13 | 0.2% |
| Latin America | 96 | 1.1% |
| Mexico | 52 | 0.6% |
| Nepal | 31 | 0.4% |
| Netherlands | 11 | 0.1% |
| Northern Europe | 11 | 0.1% |
| South America | 21 | 0.2% |
| South Central Asia | 31 | 0.4% |
| South Eastern Asia | 9 | 0.1% |
| Thailand | 1 | 0.0% |
| Western Europe | 88 | 1.0% | View All 25 Rows |
Sex and Age in Sandpoint
Sex and Age in Sandpoint
The most populous age groups in Sandpoint are 55 to 59 Years (426 | 9.8%) for men and 50 to 54 Years (421 | 9.3%) for women.
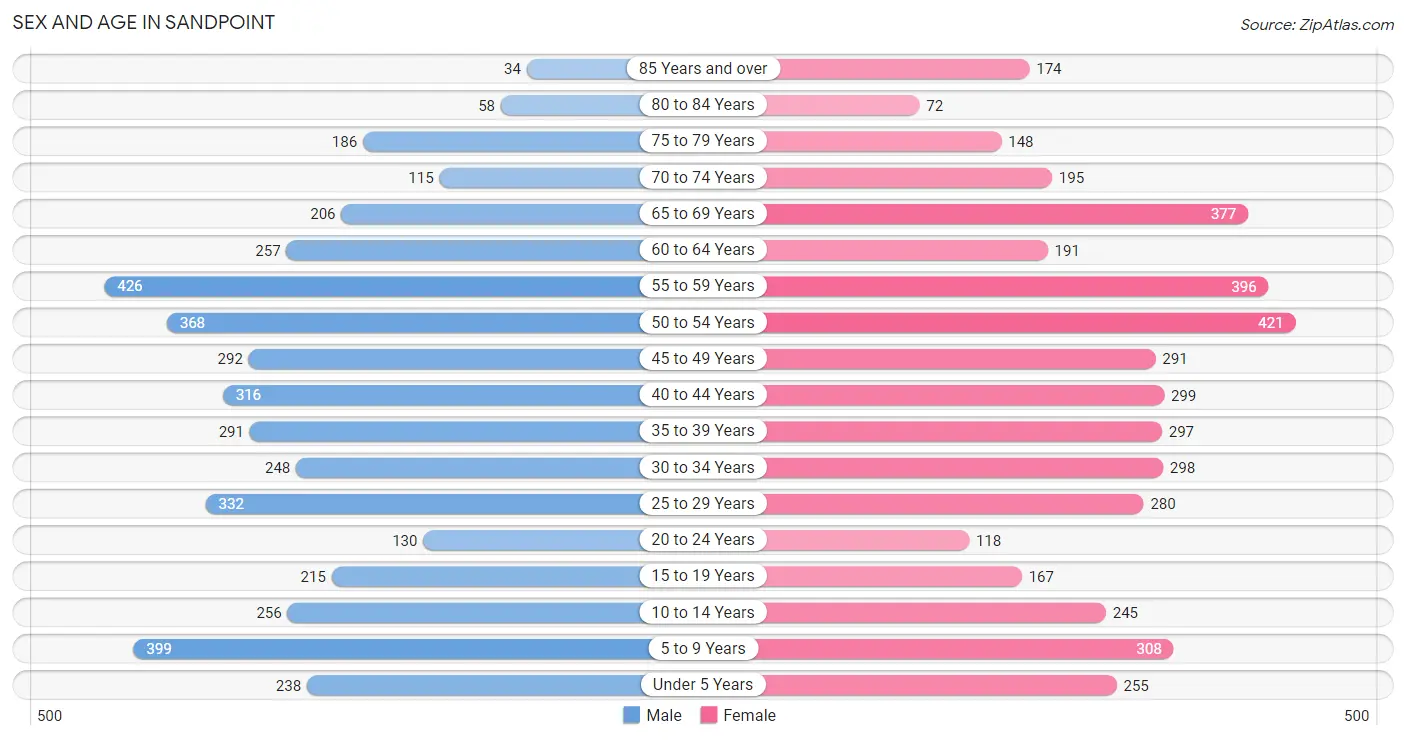
| Age Bracket | Male | Female |
| Under 5 Years | 238 (5.4%) | 255 (5.6%) |
| 5 to 9 Years | 399 (9.1%) | 308 (6.8%) |
| 10 to 14 Years | 256 (5.9%) | 245 (5.4%) |
| 15 to 19 Years | 215 (4.9%) | 167 (3.7%) |
| 20 to 24 Years | 130 (3.0%) | 118 (2.6%) |
| 25 to 29 Years | 332 (7.6%) | 280 (6.2%) |
| 30 to 34 Years | 248 (5.7%) | 298 (6.6%) |
| 35 to 39 Years | 291 (6.7%) | 297 (6.6%) |
| 40 to 44 Years | 316 (7.2%) | 299 (6.6%) |
| 45 to 49 Years | 292 (6.7%) | 291 (6.4%) |
| 50 to 54 Years | 368 (8.4%) | 421 (9.3%) |
| 55 to 59 Years | 426 (9.8%) | 396 (8.7%) |
| 60 to 64 Years | 257 (5.9%) | 191 (4.2%) |
| 65 to 69 Years | 206 (4.7%) | 377 (8.3%) |
| 70 to 74 Years | 115 (2.6%) | 195 (4.3%) |
| 75 to 79 Years | 186 (4.3%) | 148 (3.3%) |
| 80 to 84 Years | 58 (1.3%) | 72 (1.6%) |
| 85 Years and over | 34 (0.8%) | 174 (3.8%) |
| Total | 4,367 (100.0%) | 4,532 (100.0%) |
Families and Households in Sandpoint
Median Family Size in Sandpoint
The median family size in Sandpoint is 2.99 persons per family, with single male/father families (127 | 6.4%) accounting for the largest median family size of 3.83 persons per family. On the other hand, married-couple families (1,545 | 77.3%) represent the smallest median family size with 2.89 persons per family.
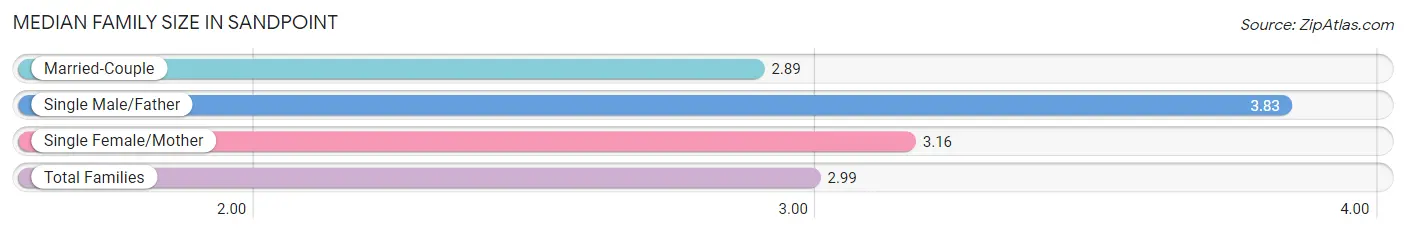
| Family Type | # Families | Family Size |
| Married-Couple | 1,545 (77.3%) | 2.89 |
| Single Male/Father | 127 (6.4%) | 3.83 |
| Single Female/Mother | 326 (16.3%) | 3.16 |
| Total Families | 1,998 (100.0%) | 2.99 |
Median Household Size in Sandpoint
The median household size in Sandpoint is 2.38 persons per household, with single male/father households (127 | 3.6%) accounting for the largest median household size of 3.98 persons per household. non-family households (1,544 | 43.6%) represent the smallest median household size with 1.45 persons per household.
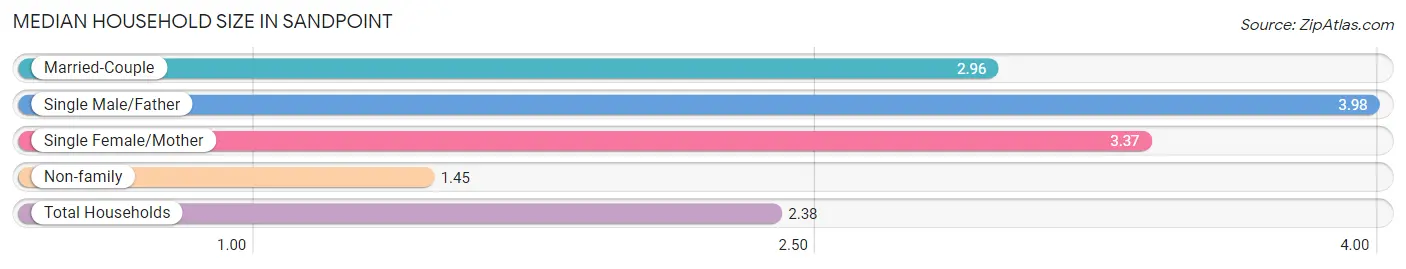
| Household Type | # Households | Household Size |
| Married-Couple | 1,545 (43.6%) | 2.96 |
| Single Male/Father | 127 (3.6%) | 3.98 |
| Single Female/Mother | 326 (9.2%) | 3.37 |
| Non-family | 1,544 (43.6%) | 1.45 |
| Total Households | 3,542 (100.0%) | 2.38 |
Household Size by Marriage Status in Sandpoint
Out of a total of 3,542 households in Sandpoint, 1,998 (56.4%) are family households, while 1,544 (43.6%) are nonfamily households. The most numerous type of family households are 2-person households, comprising 1,029, and the most common type of nonfamily households are 1-person households, comprising 1,199.
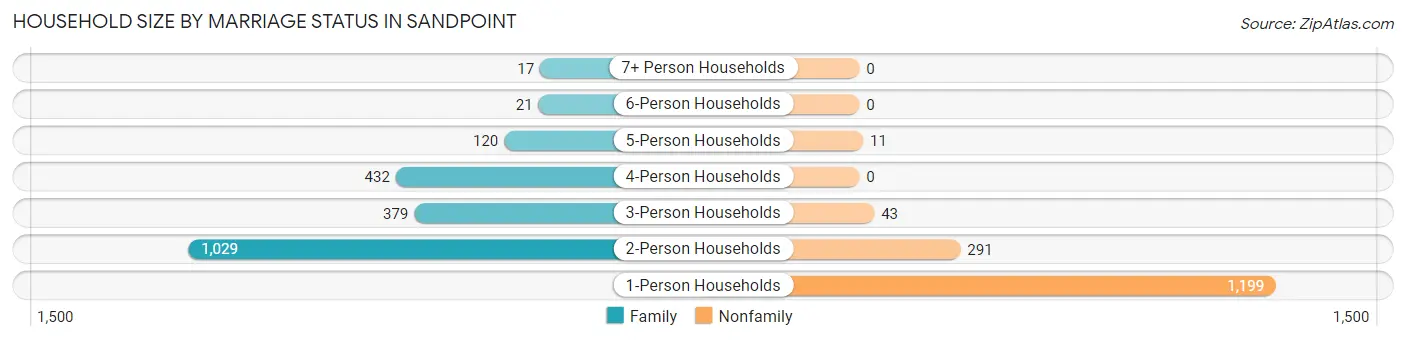
| Household Size | Family Households | Nonfamily Households |
| 1-Person Households | - | 1,199 (33.9%) |
| 2-Person Households | 1,029 (29.0%) | 291 (8.2%) |
| 3-Person Households | 379 (10.7%) | 43 (1.2%) |
| 4-Person Households | 432 (12.2%) | 0 (0.0%) |
| 5-Person Households | 120 (3.4%) | 11 (0.3%) |
| 6-Person Households | 21 (0.6%) | 0 (0.0%) |
| 7+ Person Households | 17 (0.5%) | 0 (0.0%) |
| Total | 1,998 (56.4%) | 1,544 (43.6%) |
Female Fertility in Sandpoint
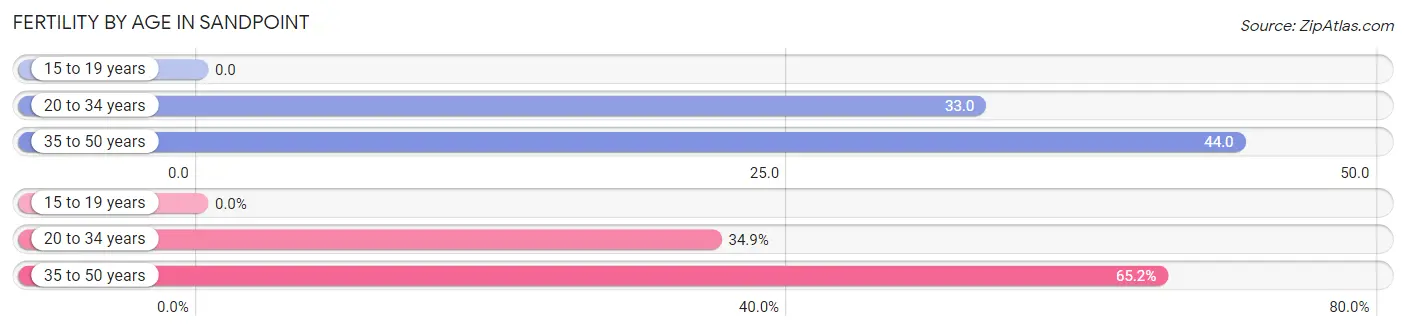
Fertility by Age in Sandpoint
Average fertility rate in Sandpoint is 36.0 births per 1,000 women. Women in the age bracket of 35 to 50 years have the highest fertility rate with 44.0 births per 1,000 women. Women in the age bracket of 35 to 50 years acount for 65.1% of all women with births.
| Age Bracket | Women with Births | Births / 1,000 Women |
| 15 to 19 years | 0 (0.0%) | 0.0 |
| 20 to 34 years | 23 (34.8%) | 33.0 |
| 35 to 50 years | 43 (65.1%) | 44.0 |
| Total | 66 (100.0%) | 36.0 |
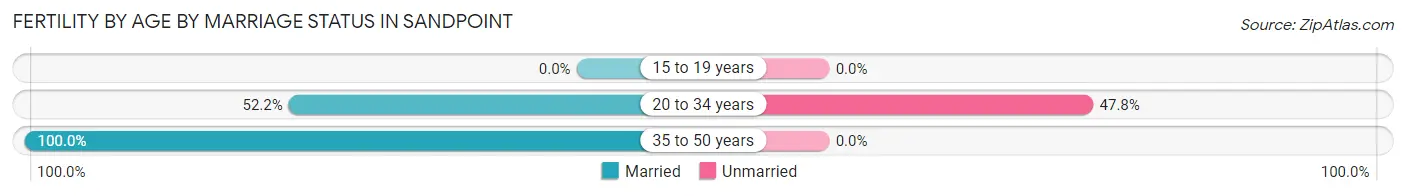
Fertility by Age by Marriage Status in Sandpoint
83.3% of women with births (66) in Sandpoint are married. The highest percentage of unmarried women with births falls into 20 to 34 years age bracket with 47.8% of them unmarried at the time of birth, while the lowest percentage of unmarried women with births belong to 35 to 50 years age bracket with 0.0% of them unmarried.
| Age Bracket | Married | Unmarried |
| 15 to 19 years | 0 (0.0%) | 0 (0.0%) |
| 20 to 34 years | 12 (52.2%) | 11 (47.8%) |
| 35 to 50 years | 43 (100.0%) | 0 (0.0%) |
| Total | 55 (83.3%) | 11 (16.7%) |
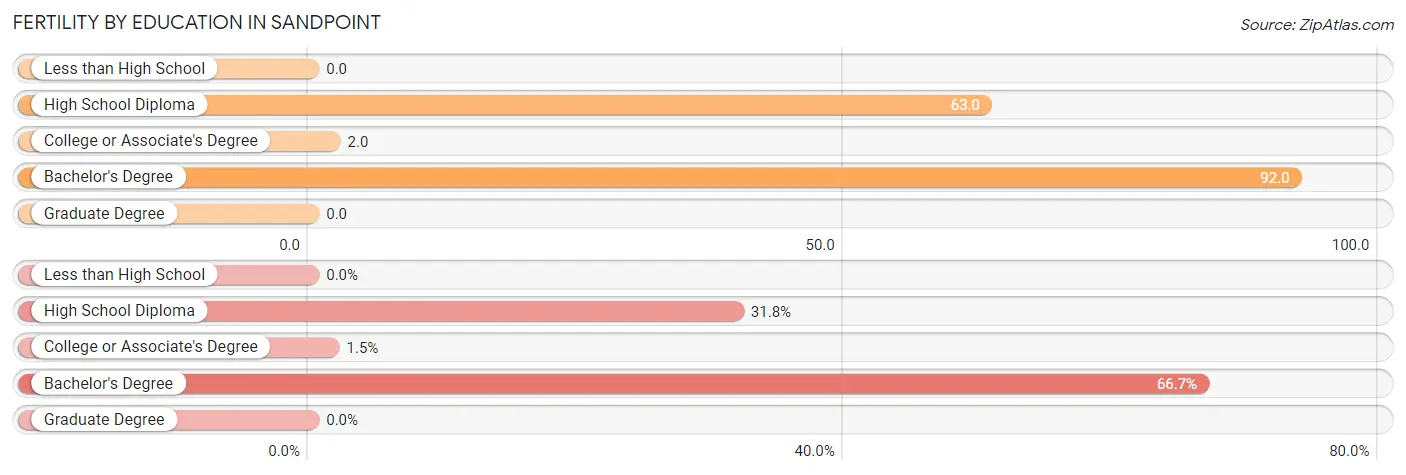
Fertility by Education in Sandpoint
| Educational Attainment | Women with Births | Births / 1,000 Women |
| Less than High School | 0 (0.0%) | 0.0 |
| High School Diploma | 21 (31.8%) | 63.0 |
| College or Associate's Degree | 1 (1.5%) | 2.0 |
| Bachelor's Degree | 44 (66.7%) | 92.0 |
| Graduate Degree | 0 (0.0%) | 0.0 |
| Total | 66 (100.0%) | 36.0 |
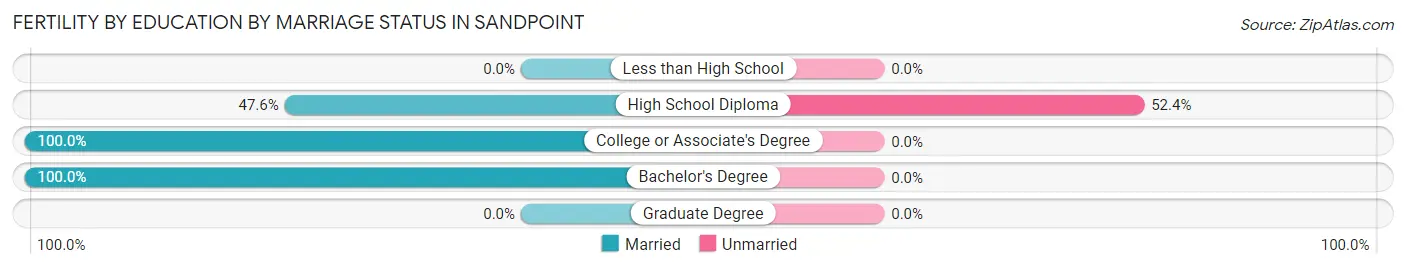
Fertility by Education by Marriage Status in Sandpoint
16.7% of women with births in Sandpoint are unmarried. Women with the educational attainment of college or associate's degree are most likely to be married with 100.0% of them married at childbirth, while women with the educational attainment of high school diploma are least likely to be married with 52.4% of them unmarried at childbirth.
| Educational Attainment | Married | Unmarried |
| Less than High School | 0 (0.0%) | 0 (0.0%) |
| High School Diploma | 10 (47.6%) | 11 (52.4%) |
| College or Associate's Degree | 1 (100.0%) | 0 (0.0%) |
| Bachelor's Degree | 44 (100.0%) | 0 (0.0%) |
| Graduate Degree | 0 (0.0%) | 0 (0.0%) |
| Total | 55 (83.3%) | 11 (16.7%) |
Income in Sandpoint
Income Overview in Sandpoint
Per Capita Income in Sandpoint is $33,808, while median incomes of families and households are $77,429 and $60,208 respectively.
| Characteristic | Number | Measure |
| Per Capita Income | 8,899 | $33,808 |
| Median Family Income | 1,998 | $77,429 |
| Mean Family Income | 1,998 | $102,121 |
| Median Household Income | 3,542 | $60,208 |
| Mean Household Income | 3,542 | $78,399 |
| Income Deficit | 1,998 | $0 |
| Wage / Income Gap (%) | 8,899 | 23.17% |
| Wage / Income Gap ($) | 8,899 | 76.83¢ per $1 |
| Gini / Inequality Index | 8,899 | 0.47 |
Earnings by Sex in Sandpoint
Average Earnings in Sandpoint are $29,935, $36,391 for men and $27,961 for women, a difference of 23.2%.
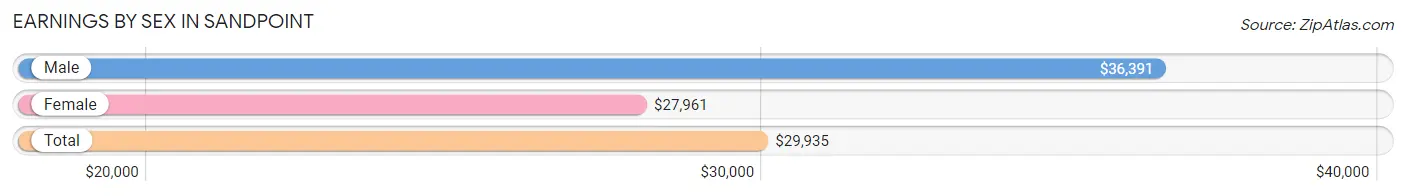
| Sex | Number | Average Earnings |
| Male | 2,433 (49.9%) | $36,391 |
| Female | 2,446 (50.1%) | $27,961 |
| Total | 4,879 (100.0%) | $29,935 |
Earnings by Sex by Income Bracket in Sandpoint
The most common earnings brackets in Sandpoint are $75,000 to $99,999 for men (350 | 14.4%) and $30,000 to $34,999 for women (280 | 11.5%).
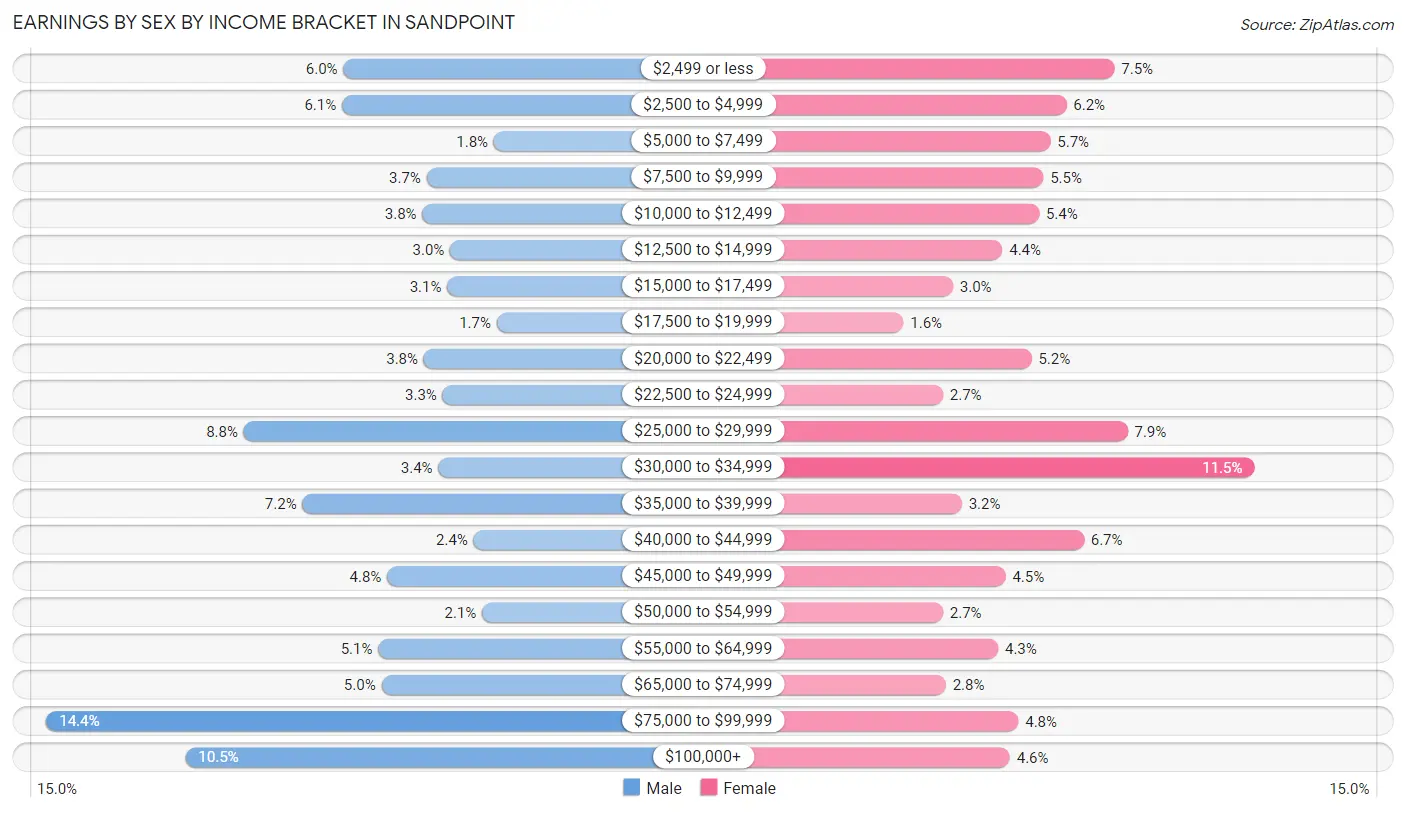
| Income | Male | Female |
| $2,499 or less | 147 (6.0%) | 184 (7.5%) |
| $2,500 to $4,999 | 148 (6.1%) | 151 (6.2%) |
| $5,000 to $7,499 | 44 (1.8%) | 140 (5.7%) |
| $7,500 to $9,999 | 90 (3.7%) | 135 (5.5%) |
| $10,000 to $12,499 | 93 (3.8%) | 132 (5.4%) |
| $12,500 to $14,999 | 74 (3.0%) | 107 (4.4%) |
| $15,000 to $17,499 | 76 (3.1%) | 73 (3.0%) |
| $17,500 to $19,999 | 42 (1.7%) | 39 (1.6%) |
| $20,000 to $22,499 | 92 (3.8%) | 127 (5.2%) |
| $22,500 to $24,999 | 79 (3.3%) | 66 (2.7%) |
| $25,000 to $29,999 | 215 (8.8%) | 193 (7.9%) |
| $30,000 to $34,999 | 82 (3.4%) | 280 (11.5%) |
| $35,000 to $39,999 | 175 (7.2%) | 79 (3.2%) |
| $40,000 to $44,999 | 58 (2.4%) | 163 (6.7%) |
| $45,000 to $49,999 | 117 (4.8%) | 109 (4.5%) |
| $50,000 to $54,999 | 52 (2.1%) | 66 (2.7%) |
| $55,000 to $64,999 | 123 (5.1%) | 104 (4.3%) |
| $65,000 to $74,999 | 121 (5.0%) | 68 (2.8%) |
| $75,000 to $99,999 | 350 (14.4%) | 118 (4.8%) |
| $100,000+ | 255 (10.5%) | 112 (4.6%) |
| Total | 2,433 (100.0%) | 2,446 (100.0%) |
Earnings by Sex by Educational Attainment in Sandpoint
Average earnings in Sandpoint are $38,805 for men and $29,276 for women, a difference of 24.6%. Men with an educational attainment of graduate degree enjoy the highest average annual earnings of $74,297, while those with high school diploma education earn the least with $34,009. Women with an educational attainment of graduate degree earn the most with the average annual earnings of $47,011, while those with high school diploma education have the smallest earnings of $25,139.
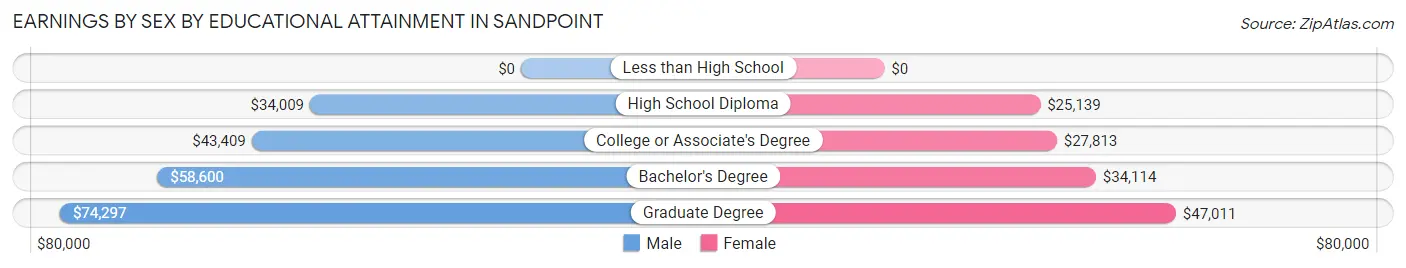
| Educational Attainment | Male Income | Female Income |
| Less than High School | - | - |
| High School Diploma | $34,009 | $25,139 |
| College or Associate's Degree | $43,409 | $27,813 |
| Bachelor's Degree | $58,600 | $34,114 |
| Graduate Degree | $74,297 | $47,011 |
| Total | $38,805 | $29,276 |
Family Income in Sandpoint
Family Income Brackets in Sandpoint
According to the Sandpoint family income data, there are 551 families falling into the $50,000 to $74,999 income range, which is the most common income bracket and makes up 27.6% of all families. Conversely, the $10,000 to $14,999 income bracket is the least frequent group with only 6 families (0.3%) belonging to this category.
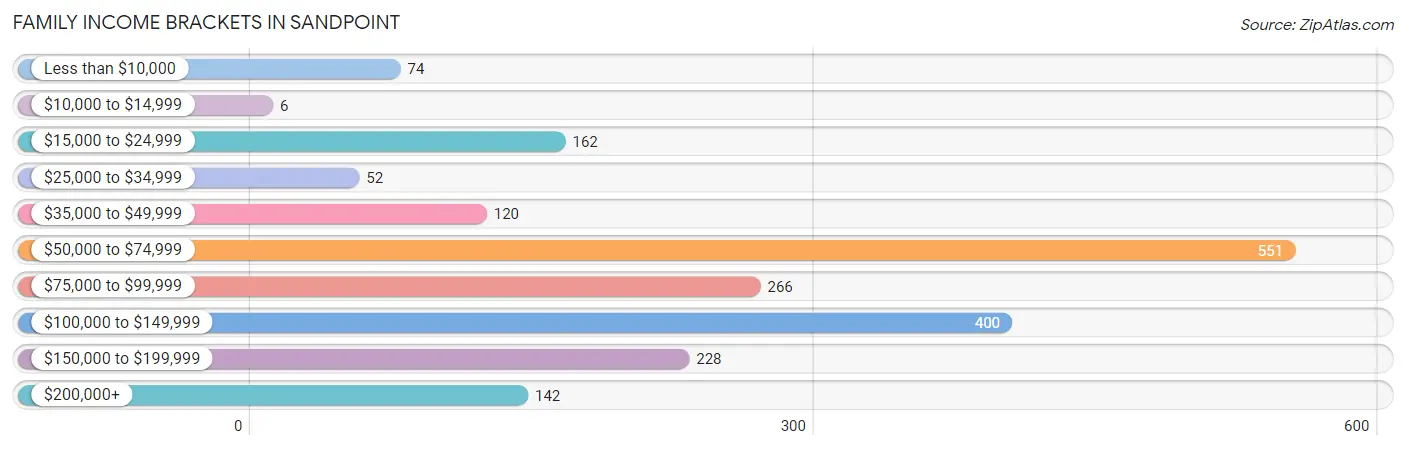
| Income Bracket | # Families | % Families |
| Less than $10,000 | 74 | 3.7% |
| $10,000 to $14,999 | 6 | 0.3% |
| $15,000 to $24,999 | 162 | 8.1% |
| $25,000 to $34,999 | 52 | 2.6% |
| $35,000 to $49,999 | 120 | 6.0% |
| $50,000 to $74,999 | 551 | 27.6% |
| $75,000 to $99,999 | 266 | 13.3% |
| $100,000 to $149,999 | 400 | 20.0% |
| $150,000 to $199,999 | 228 | 11.4% |
| $200,000+ | 142 | 7.1% |
Family Income by Famaliy Size in Sandpoint
2-person families (1,077 | 53.9%) account for the highest median family income in Sandpoint with $84,028 per family, while 2-person families (1,077 | 53.9%) have the highest median income of $42,014 per family member.
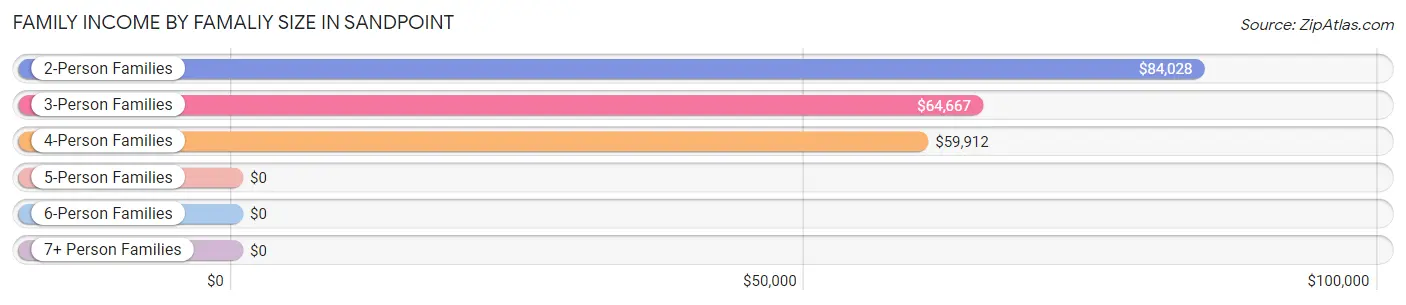
| Income Bracket | # Families | Median Income |
| 2-Person Families | 1,077 (53.9%) | $84,028 |
| 3-Person Families | 352 (17.6%) | $64,667 |
| 4-Person Families | 439 (22.0%) | $59,912 |
| 5-Person Families | 100 (5.0%) | $0 |
| 6-Person Families | 21 (1.1%) | $0 |
| 7+ Person Families | 9 (0.4%) | $0 |
| Total | 1,998 (100.0%) | $77,429 |
Family Income by Number of Earners in Sandpoint
The median family income in Sandpoint is $77,429, with families comprising 3+ earners (111) having the highest median family income of $153,472, while families with 1 earner (795) have the lowest median family income of $66,016, accounting for 5.6% and 39.8% of families, respectively.
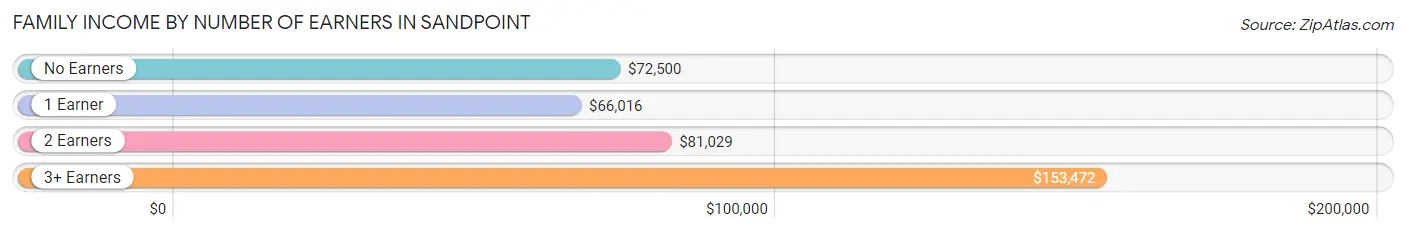
| Number of Earners | # Families | Median Income |
| No Earners | 200 (10.0%) | $72,500 |
| 1 Earner | 795 (39.8%) | $66,016 |
| 2 Earners | 892 (44.6%) | $81,029 |
| 3+ Earners | 111 (5.6%) | $153,472 |
| Total | 1,998 (100.0%) | $77,429 |
Household Income in Sandpoint
Household Income Brackets in Sandpoint
With 705 households falling in the category, the $50,000 to $74,999 income range is the most frequent in Sandpoint, accounting for 19.9% of all households. In contrast, only 159 households (4.5%) fall into the $200,000+ income bracket, making it the least populous group.
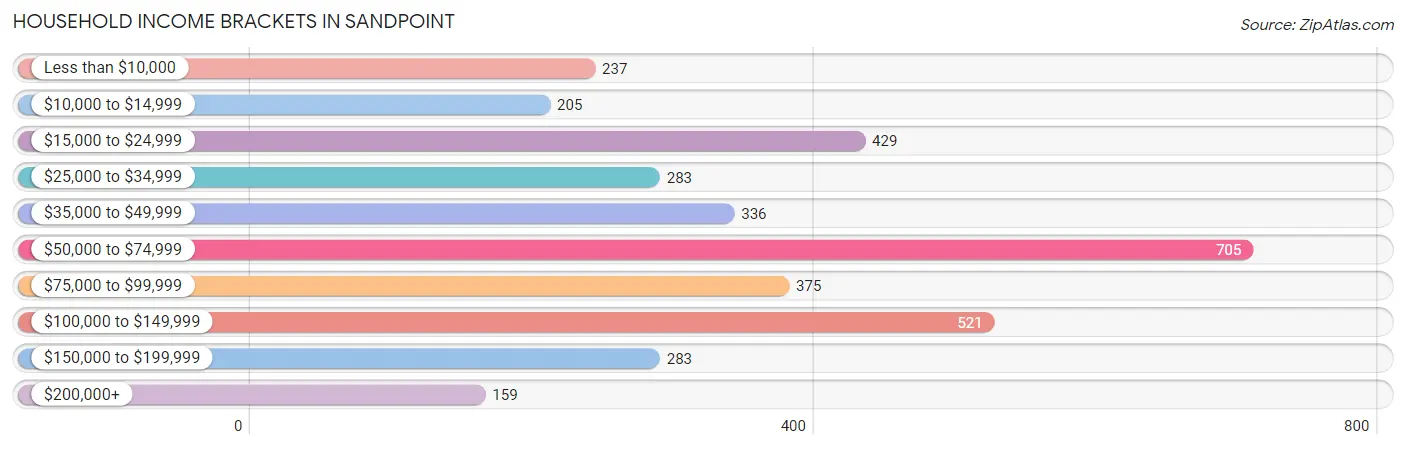
| Income Bracket | # Households | % Households |
| Less than $10,000 | 237 | 6.7% |
| $10,000 to $14,999 | 205 | 5.8% |
| $15,000 to $24,999 | 429 | 12.1% |
| $25,000 to $34,999 | 283 | 8.0% |
| $35,000 to $49,999 | 336 | 9.5% |
| $50,000 to $74,999 | 705 | 19.9% |
| $75,000 to $99,999 | 375 | 10.6% |
| $100,000 to $149,999 | 521 | 14.7% |
| $150,000 to $199,999 | 283 | 8.0% |
| $200,000+ | 159 | 4.5% |
Household Income by Householder Age in Sandpoint
The median household income in Sandpoint is $60,208, with the highest median household income of $68,654 found in the 25 to 44 years age bracket for the primary householder. A total of 1,070 households (30.2%) fall into this category. Meanwhile, the 15 to 24 years age bracket for the primary householder has the lowest median household income of $29,167, with 102 households (2.9%) in this group.
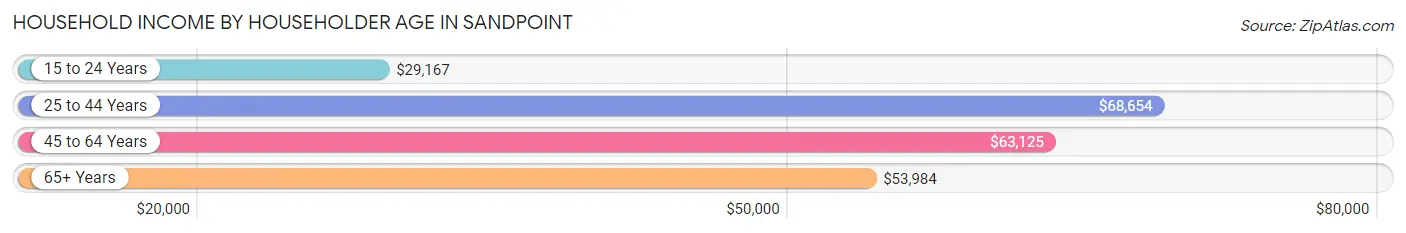
| Income Bracket | # Households | Median Income |
| 15 to 24 Years | 102 (2.9%) | $29,167 |
| 25 to 44 Years | 1,070 (30.2%) | $68,654 |
| 45 to 64 Years | 1,431 (40.4%) | $63,125 |
| 65+ Years | 939 (26.5%) | $53,984 |
| Total | 3,542 (100.0%) | $60,208 |
Poverty in Sandpoint
Income Below Poverty by Sex and Age in Sandpoint
With 15.3% poverty level for males and 16.9% for females among the residents of Sandpoint, 5 year old males and under 5 year old females are the most vulnerable to poverty, with 4 males (50.0%) and 97 females (38.0%) in their respective age groups living below the poverty level.
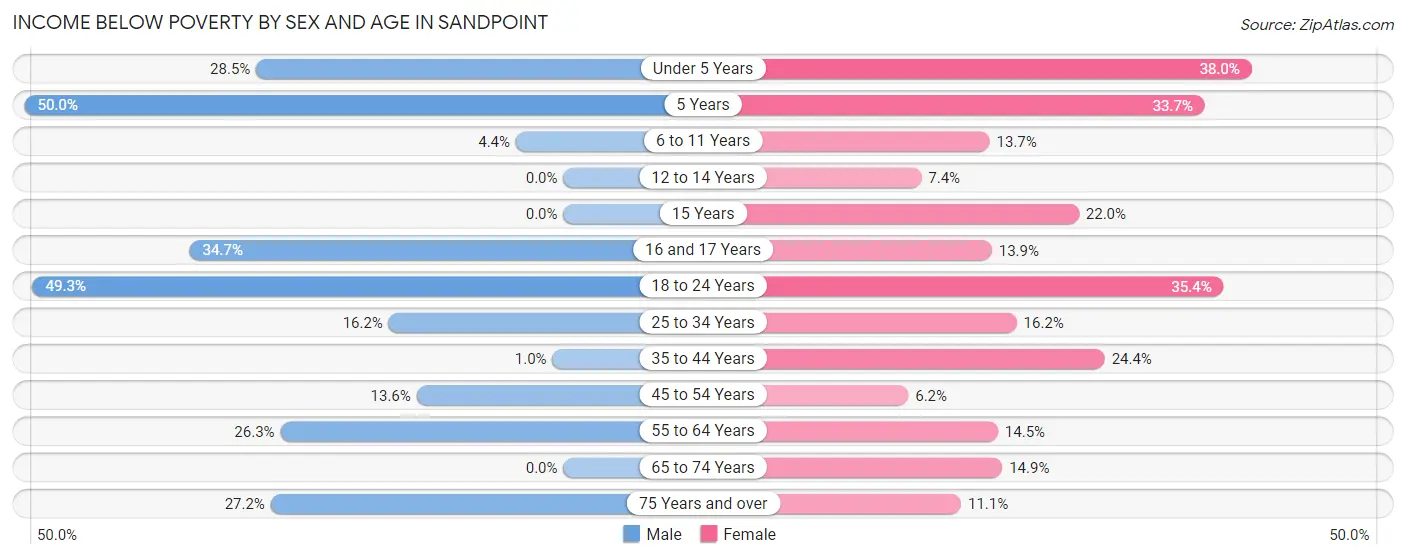
| Age Bracket | Male | Female |
| Under 5 Years | 65 (28.5%) | 97 (38.0%) |
| 5 Years | 4 (50.0%) | 32 (33.7%) |
| 6 to 11 Years | 22 (4.4%) | 41 (13.7%) |
| 12 to 14 Years | 0 (0.0%) | 11 (7.4%) |
| 15 Years | 0 (0.0%) | 11 (22.0%) |
| 16 and 17 Years | 34 (34.7%) | 11 (13.9%) |
| 18 to 24 Years | 98 (49.2%) | 51 (35.4%) |
| 25 to 34 Years | 89 (16.2%) | 93 (16.2%) |
| 35 to 44 Years | 6 (1.0%) | 143 (24.4%) |
| 45 to 54 Years | 88 (13.6%) | 43 (6.2%) |
| 55 to 64 Years | 167 (26.3%) | 81 (14.5%) |
| 65 to 74 Years | 0 (0.0%) | 84 (14.9%) |
| 75 Years and over | 66 (27.2%) | 28 (11.1%) |
| Total | 639 (15.3%) | 726 (16.9%) |
Income Above Poverty by Sex and Age in Sandpoint
According to the poverty statistics in Sandpoint, males aged 12 to 14 years and females aged 45 to 54 years are the age groups that are most secure financially, with 100.0% of males and 93.8% of females in these age groups living above the poverty line.
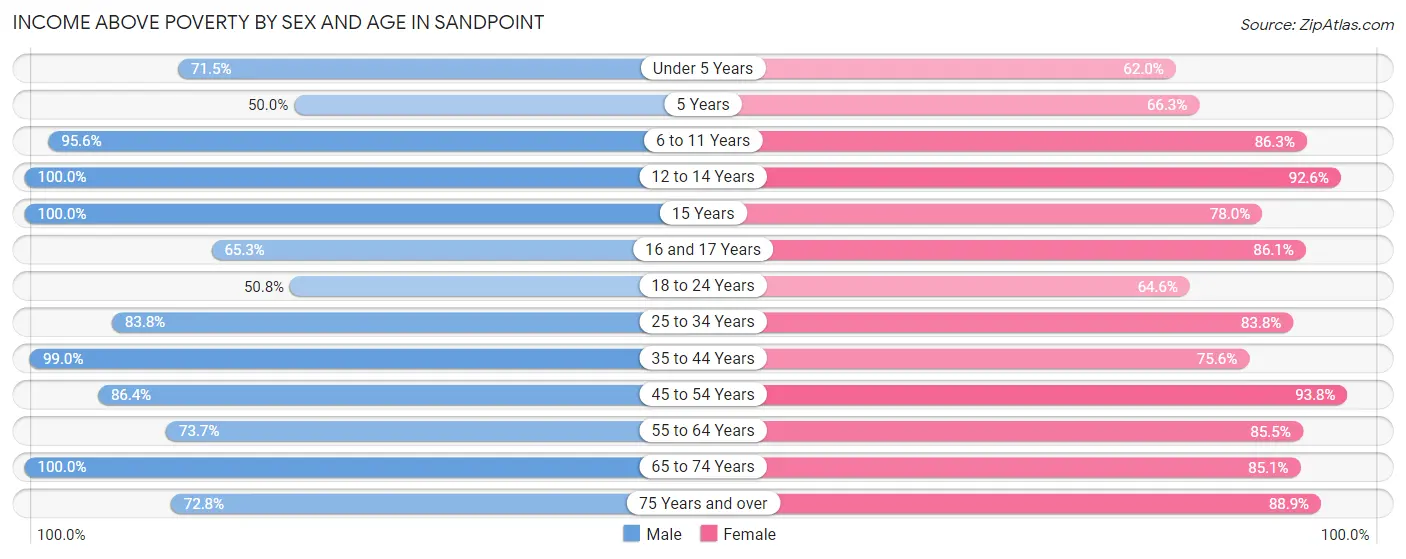
| Age Bracket | Male | Female |
| Under 5 Years | 163 (71.5%) | 158 (62.0%) |
| 5 Years | 4 (50.0%) | 63 (66.3%) |
| 6 to 11 Years | 477 (95.6%) | 258 (86.3%) |
| 12 to 14 Years | 124 (100.0%) | 138 (92.6%) |
| 15 Years | 37 (100.0%) | 39 (78.0%) |
| 16 and 17 Years | 64 (65.3%) | 68 (86.1%) |
| 18 to 24 Years | 101 (50.7%) | 93 (64.6%) |
| 25 to 34 Years | 460 (83.8%) | 480 (83.8%) |
| 35 to 44 Years | 587 (99.0%) | 443 (75.6%) |
| 45 to 54 Years | 558 (86.4%) | 654 (93.8%) |
| 55 to 64 Years | 469 (73.7%) | 478 (85.5%) |
| 65 to 74 Years | 316 (100.0%) | 480 (85.1%) |
| 75 Years and over | 177 (72.8%) | 225 (88.9%) |
| Total | 3,537 (84.7%) | 3,577 (83.1%) |
Income Below Poverty Among Married-Couple Families in Sandpoint
The poverty statistics for married-couple families in Sandpoint show that 2.8% or 43 of the total 1,545 families live below the poverty line. Families with no children have the highest poverty rate of 3.1%, comprising of 31 families. On the other hand, families with 3 or 4 children have the lowest poverty rate of 1.8%, which includes 2 families.
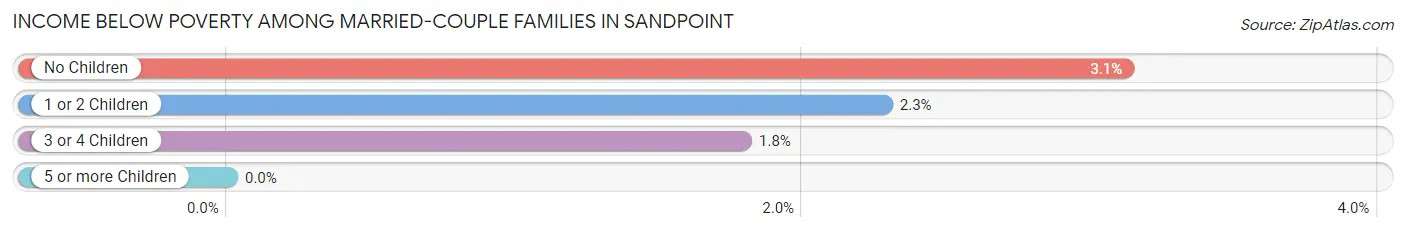
| Children | Above Poverty | Below Poverty |
| No Children | 963 (96.9%) | 31 (3.1%) |
| 1 or 2 Children | 429 (97.7%) | 10 (2.3%) |
| 3 or 4 Children | 110 (98.2%) | 2 (1.8%) |
| 5 or more Children | 0 (0.0%) | 0 (0.0%) |
| Total | 1,502 (97.2%) | 43 (2.8%) |
Income Below Poverty Among Single-Parent Households in Sandpoint
According to the poverty data in Sandpoint, 16.5% or 21 single-father households and 38.3% or 125 single-mother households are living below the poverty line. Among single-father households, those with 1 or 2 children have the highest poverty rate, with 21 households (22.8%) experiencing poverty. Likewise, among single-mother households, those with 3 or 4 children have the highest poverty rate, with 67 households (83.8%) falling below the poverty line.
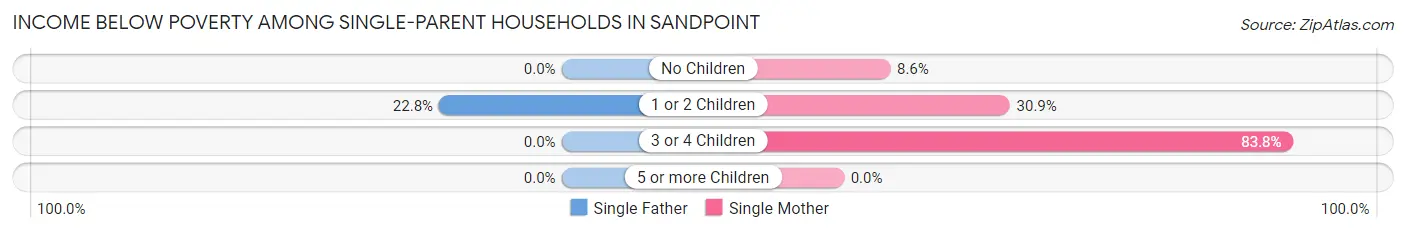
| Children | Single Father | Single Mother |
| No Children | 0 (0.0%) | 7 (8.6%) |
| 1 or 2 Children | 21 (22.8%) | 51 (30.9%) |
| 3 or 4 Children | 0 (0.0%) | 67 (83.8%) |
| 5 or more Children | 0 (0.0%) | 0 (0.0%) |
| Total | 21 (16.5%) | 125 (38.3%) |
Income Below Poverty Among Married-Couple vs Single-Parent Households in Sandpoint
The poverty data for Sandpoint shows that 43 of the married-couple family households (2.8%) and 146 of the single-parent households (32.2%) are living below the poverty level. Within the married-couple family households, those with no children have the highest poverty rate, with 31 households (3.1%) falling below the poverty line. Among the single-parent households, those with 3 or 4 children have the highest poverty rate, with 67 household (63.2%) living below poverty.
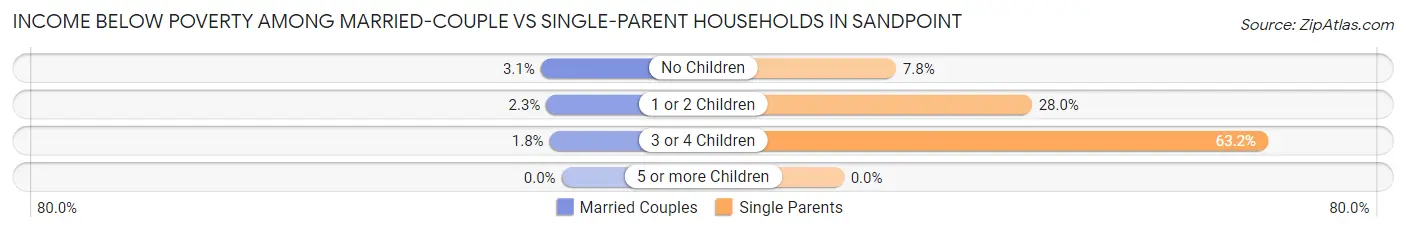
| Children | Married-Couple Families | Single-Parent Households |
| No Children | 31 (3.1%) | 7 (7.8%) |
| 1 or 2 Children | 10 (2.3%) | 72 (28.0%) |
| 3 or 4 Children | 2 (1.8%) | 67 (63.2%) |
| 5 or more Children | 0 (0.0%) | 0 (0.0%) |
| Total | 43 (2.8%) | 146 (32.2%) |
Employment Characteristics in Sandpoint
Employment by Class of Employer in Sandpoint
Among the 4,117 employed individuals in Sandpoint, private company employees (2,699 | 65.6%), self-employed (incorporated) (451 | 11.0%), and not-for-profit organizations (443 | 10.8%) make up the most common classes of employment.
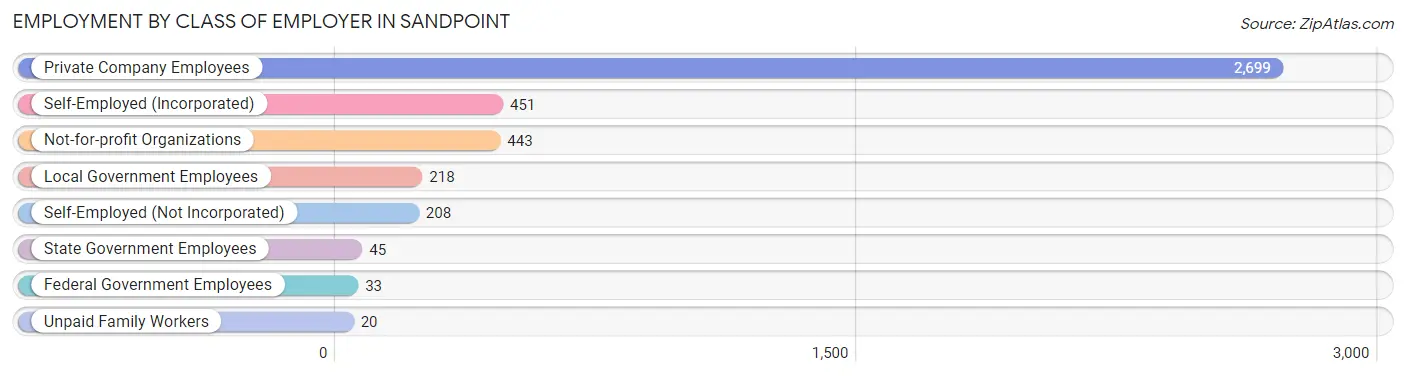
| Employer Class | # Employees | % Employees |
| Private Company Employees | 2,699 | 65.6% |
| Self-Employed (Incorporated) | 451 | 11.0% |
| Self-Employed (Not Incorporated) | 208 | 5.1% |
| Not-for-profit Organizations | 443 | 10.8% |
| Local Government Employees | 218 | 5.3% |
| State Government Employees | 45 | 1.1% |
| Federal Government Employees | 33 | 0.8% |
| Unpaid Family Workers | 20 | 0.5% |
| Total | 4,117 | 100.0% |
Employment Status by Age in Sandpoint
According to the labor force statistics for Sandpoint, out of the total population over 16 years of age (7,109), 60.9% or 4,329 individuals are in the labor force, with 2.7% or 117 of them unemployed. The age group with the highest labor force participation rate is 25 to 29 years, with 81.2% or 497 individuals in the labor force. Within the labor force, the 16 to 19 years age range has the highest percentage of unemployed individuals, with 15.5% or 20 of them being unemployed.
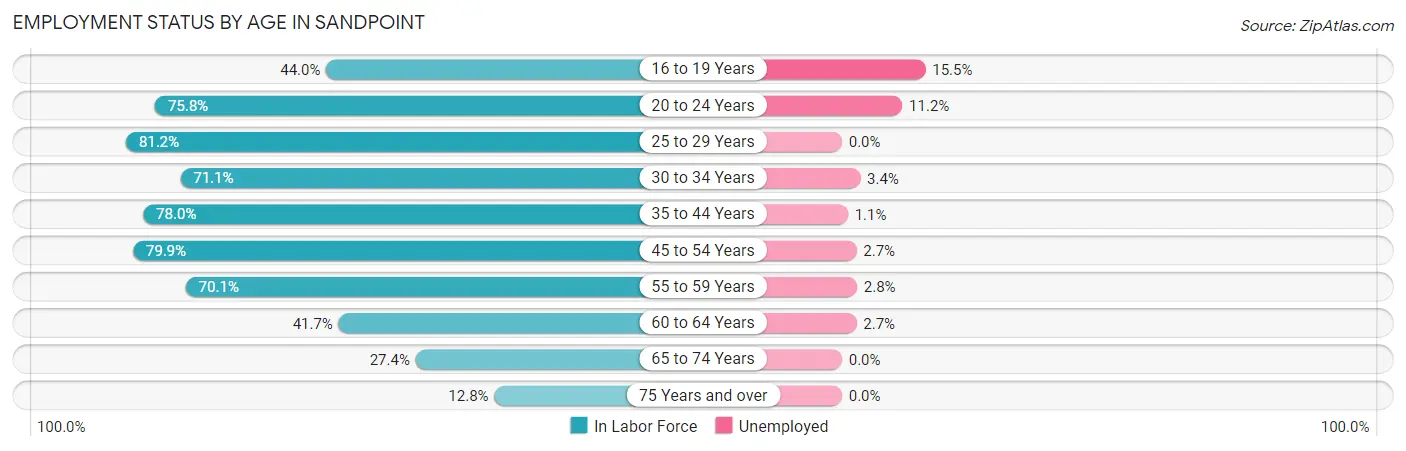
| Age Bracket | In Labor Force | Unemployed |
| 16 to 19 Years | 129 (44.0%) | 20 (15.5%) |
| 20 to 24 Years | 188 (75.8%) | 21 (11.2%) |
| 25 to 29 Years | 497 (81.2%) | 0 (0.0%) |
| 30 to 34 Years | 388 (71.1%) | 13 (3.4%) |
| 35 to 44 Years | 938 (78.0%) | 10 (1.1%) |
| 45 to 54 Years | 1,096 (79.9%) | 30 (2.7%) |
| 55 to 59 Years | 576 (70.1%) | 16 (2.8%) |
| 60 to 64 Years | 187 (41.7%) | 5 (2.7%) |
| 65 to 74 Years | 245 (27.4%) | 0 (0.0%) |
| 75 Years and over | 86 (12.8%) | 0 (0.0%) |
| Total | 4,329 (60.9%) | 117 (2.7%) |
Employment Status by Educational Attainment in Sandpoint
According to labor force statistics for Sandpoint, 73.6% of individuals (3,682) out of the total population between 25 and 64 years of age (5,003) are in the labor force, with 2.0% or 74 of them being unemployed. The group with the highest labor force participation rate are those with the educational attainment of college / associate degree, with 80.5% or 1,439 individuals in the labor force. Within the labor force, individuals with bachelor's degree or higher education have the highest percentage of unemployment, with 2.6% or 30 of them being unemployed.
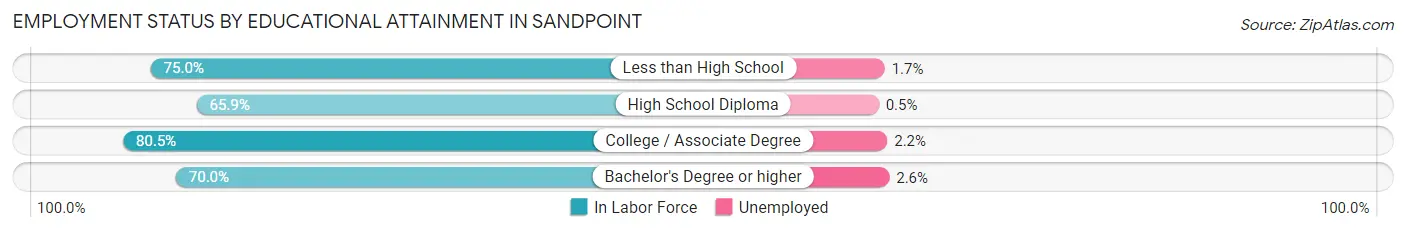
| Educational Attainment | In Labor Force | Unemployed |
| Less than High School | 460 (75.0%) | 10 (1.7%) |
| High School Diploma | 611 (65.9%) | 5 (0.5%) |
| College / Associate Degree | 1,439 (80.5%) | 39 (2.2%) |
| Bachelor's Degree or higher | 1,172 (70.0%) | 44 (2.6%) |
| Total | 3,682 (73.6%) | 100 (2.0%) |
Employment Occupations by Sex in Sandpoint
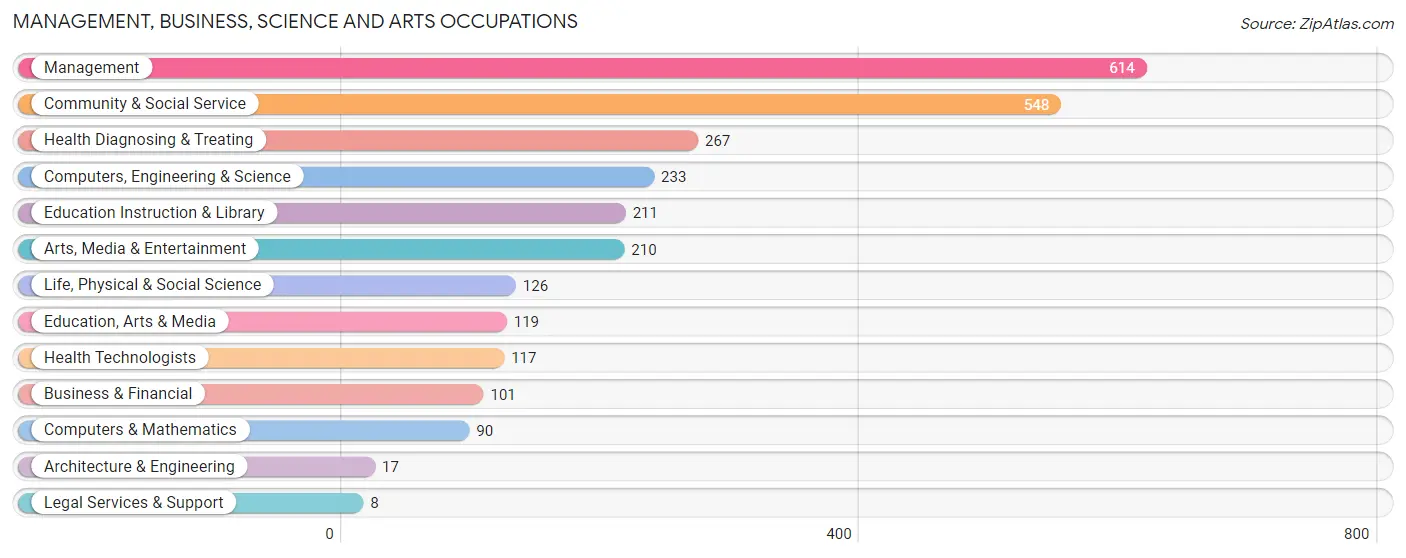
Management, Business, Science and Arts Occupations
The most common Management, Business, Science and Arts occupations in Sandpoint are Management (614 | 14.6%), Community & Social Service (548 | 13.0%), Health Diagnosing & Treating (267 | 6.3%), Computers, Engineering & Science (233 | 5.5%), and Education Instruction & Library (211 | 5.0%).
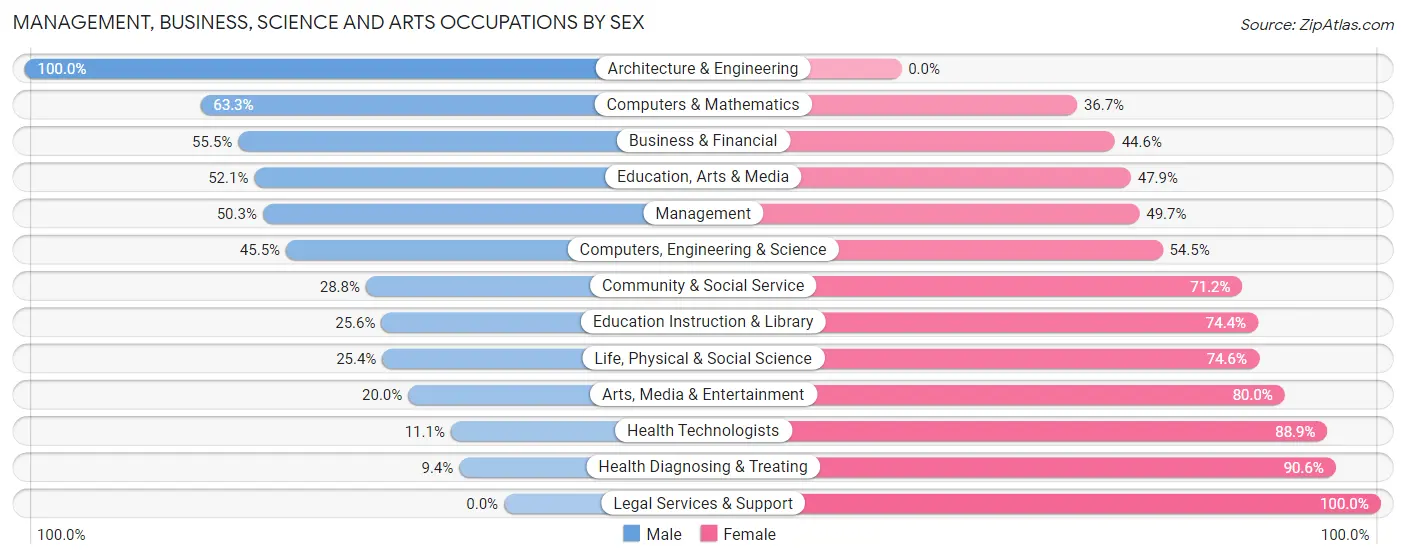
Management, Business, Science and Arts Occupations by Sex
Within the Management, Business, Science and Arts occupations in Sandpoint, the most male-oriented occupations are Architecture & Engineering (100.0%), Computers & Mathematics (63.3%), and Business & Financial (55.4%), while the most female-oriented occupations are Legal Services & Support (100.0%), Health Diagnosing & Treating (90.6%), and Health Technologists (88.9%).
| Occupation | Male | Female |
| Management | 309 (50.3%) | 305 (49.7%) |
| Business & Financial | 56 (55.4%) | 45 (44.6%) |
| Computers, Engineering & Science | 106 (45.5%) | 127 (54.5%) |
| Computers & Mathematics | 57 (63.3%) | 33 (36.7%) |
| Architecture & Engineering | 17 (100.0%) | 0 (0.0%) |
| Life, Physical & Social Science | 32 (25.4%) | 94 (74.6%) |
| Community & Social Service | 158 (28.8%) | 390 (71.2%) |
| Education, Arts & Media | 62 (52.1%) | 57 (47.9%) |
| Legal Services & Support | 0 (0.0%) | 8 (100.0%) |
| Education Instruction & Library | 54 (25.6%) | 157 (74.4%) |
| Arts, Media & Entertainment | 42 (20.0%) | 168 (80.0%) |
| Health Diagnosing & Treating | 25 (9.4%) | 242 (90.6%) |
| Health Technologists | 13 (11.1%) | 104 (88.9%) |
| Total (Category) | 654 (37.1%) | 1,109 (62.9%) |
| Total (Overall) | 2,042 (48.4%) | 2,173 (51.5%) |
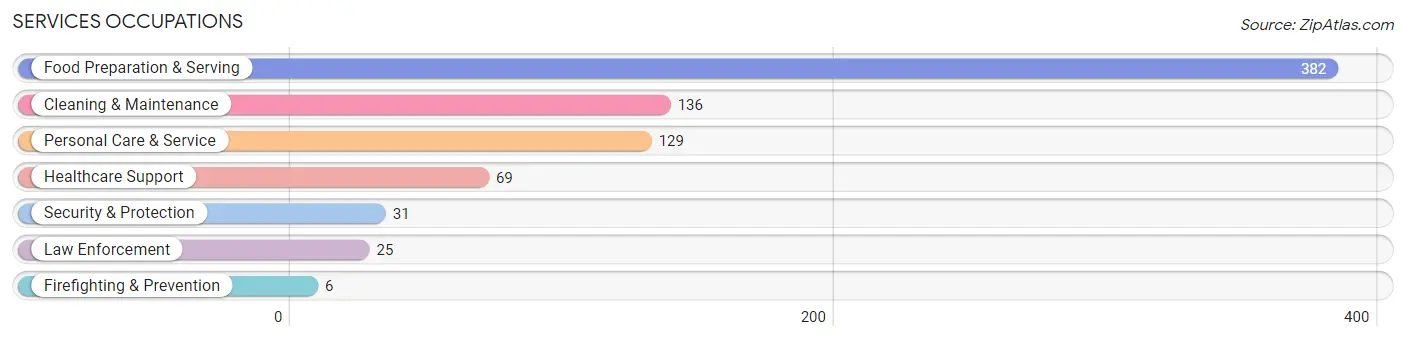
Services Occupations
The most common Services occupations in Sandpoint are Food Preparation & Serving (382 | 9.1%), Cleaning & Maintenance (136 | 3.2%), Personal Care & Service (129 | 3.1%), Healthcare Support (69 | 1.6%), and Security & Protection (31 | 0.7%).
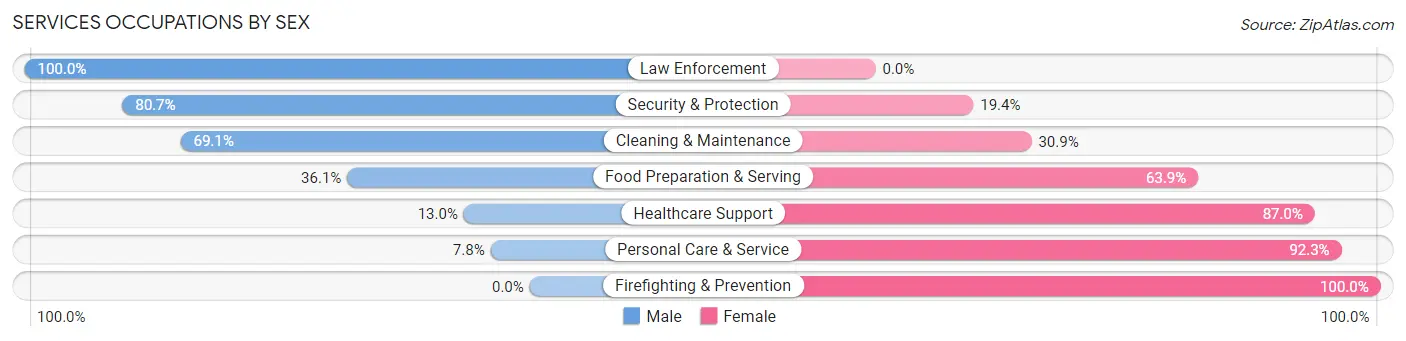
Services Occupations by Sex
Within the Services occupations in Sandpoint, the most male-oriented occupations are Law Enforcement (100.0%), Security & Protection (80.6%), and Cleaning & Maintenance (69.1%), while the most female-oriented occupations are Firefighting & Prevention (100.0%), Personal Care & Service (92.2%), and Healthcare Support (87.0%).
| Occupation | Male | Female |
| Healthcare Support | 9 (13.0%) | 60 (87.0%) |
| Security & Protection | 25 (80.6%) | 6 (19.4%) |
| Firefighting & Prevention | 0 (0.0%) | 6 (100.0%) |
| Law Enforcement | 25 (100.0%) | 0 (0.0%) |
| Food Preparation & Serving | 138 (36.1%) | 244 (63.9%) |
| Cleaning & Maintenance | 94 (69.1%) | 42 (30.9%) |
| Personal Care & Service | 10 (7.7%) | 119 (92.2%) |
| Total (Category) | 276 (36.9%) | 471 (63.0%) |
| Total (Overall) | 2,042 (48.4%) | 2,173 (51.5%) |
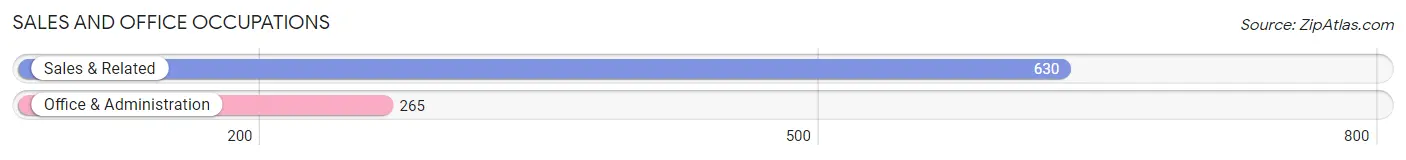
Sales and Office Occupations
The most common Sales and Office occupations in Sandpoint are Sales & Related (630 | 14.9%), and Office & Administration (265 | 6.3%).
Sales and Office Occupations by Sex
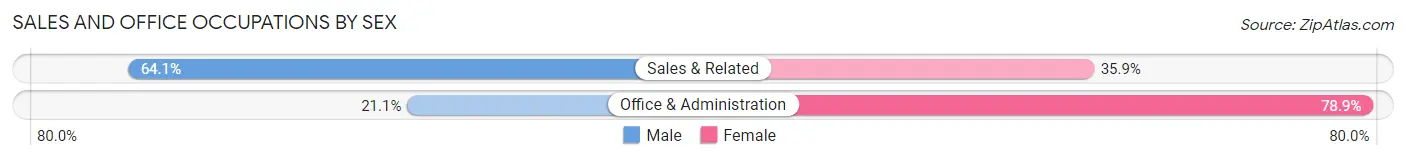
| Occupation | Male | Female |
| Sales & Related | 404 (64.1%) | 226 (35.9%) |
| Office & Administration | 56 (21.1%) | 209 (78.9%) |
| Total (Category) | 460 (51.4%) | 435 (48.6%) |
| Total (Overall) | 2,042 (48.4%) | 2,173 (51.5%) |
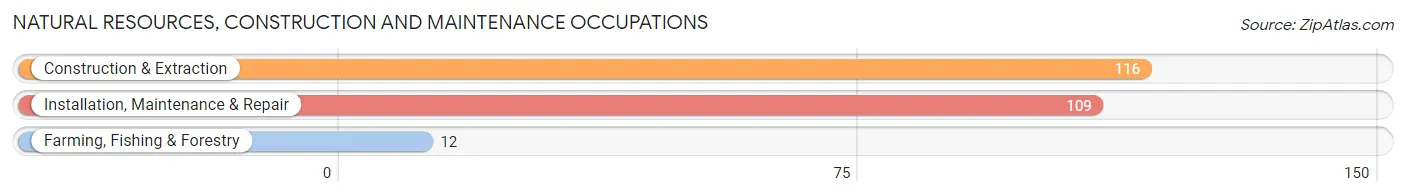
Natural Resources, Construction and Maintenance Occupations
The most common Natural Resources, Construction and Maintenance occupations in Sandpoint are Construction & Extraction (116 | 2.8%), Installation, Maintenance & Repair (109 | 2.6%), and Farming, Fishing & Forestry (12 | 0.3%).
Natural Resources, Construction and Maintenance Occupations by Sex
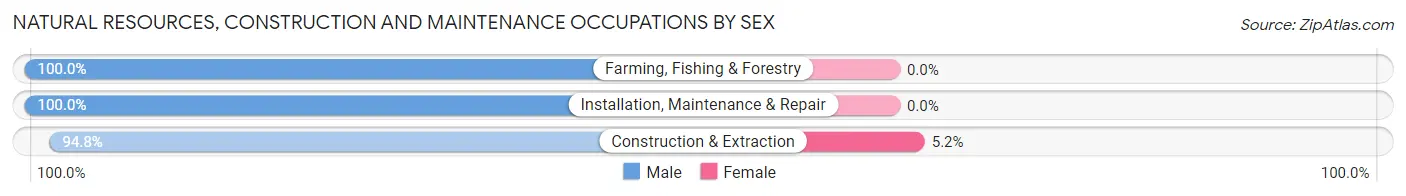
| Occupation | Male | Female |
| Farming, Fishing & Forestry | 12 (100.0%) | 0 (0.0%) |
| Construction & Extraction | 110 (94.8%) | 6 (5.2%) |
| Installation, Maintenance & Repair | 109 (100.0%) | 0 (0.0%) |
| Total (Category) | 231 (97.5%) | 6 (2.5%) |
| Total (Overall) | 2,042 (48.4%) | 2,173 (51.5%) |
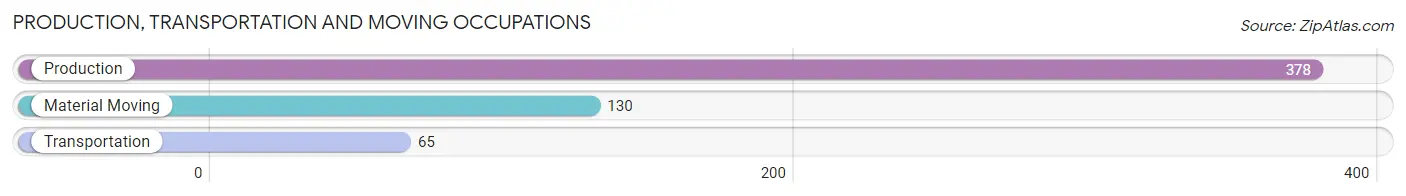
Production, Transportation and Moving Occupations
The most common Production, Transportation and Moving occupations in Sandpoint are Production (378 | 9.0%), Material Moving (130 | 3.1%), and Transportation (65 | 1.5%).
Production, Transportation and Moving Occupations by Sex
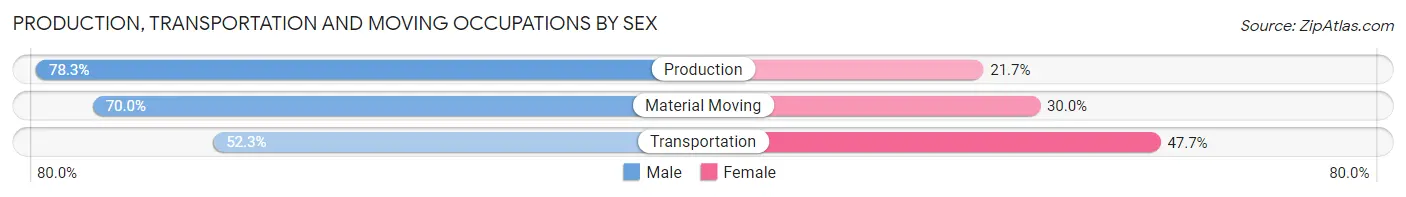
| Occupation | Male | Female |
| Production | 296 (78.3%) | 82 (21.7%) |
| Transportation | 34 (52.3%) | 31 (47.7%) |
| Material Moving | 91 (70.0%) | 39 (30.0%) |
| Total (Category) | 421 (73.5%) | 152 (26.5%) |
| Total (Overall) | 2,042 (48.4%) | 2,173 (51.5%) |
Employment Industries by Sex in Sandpoint
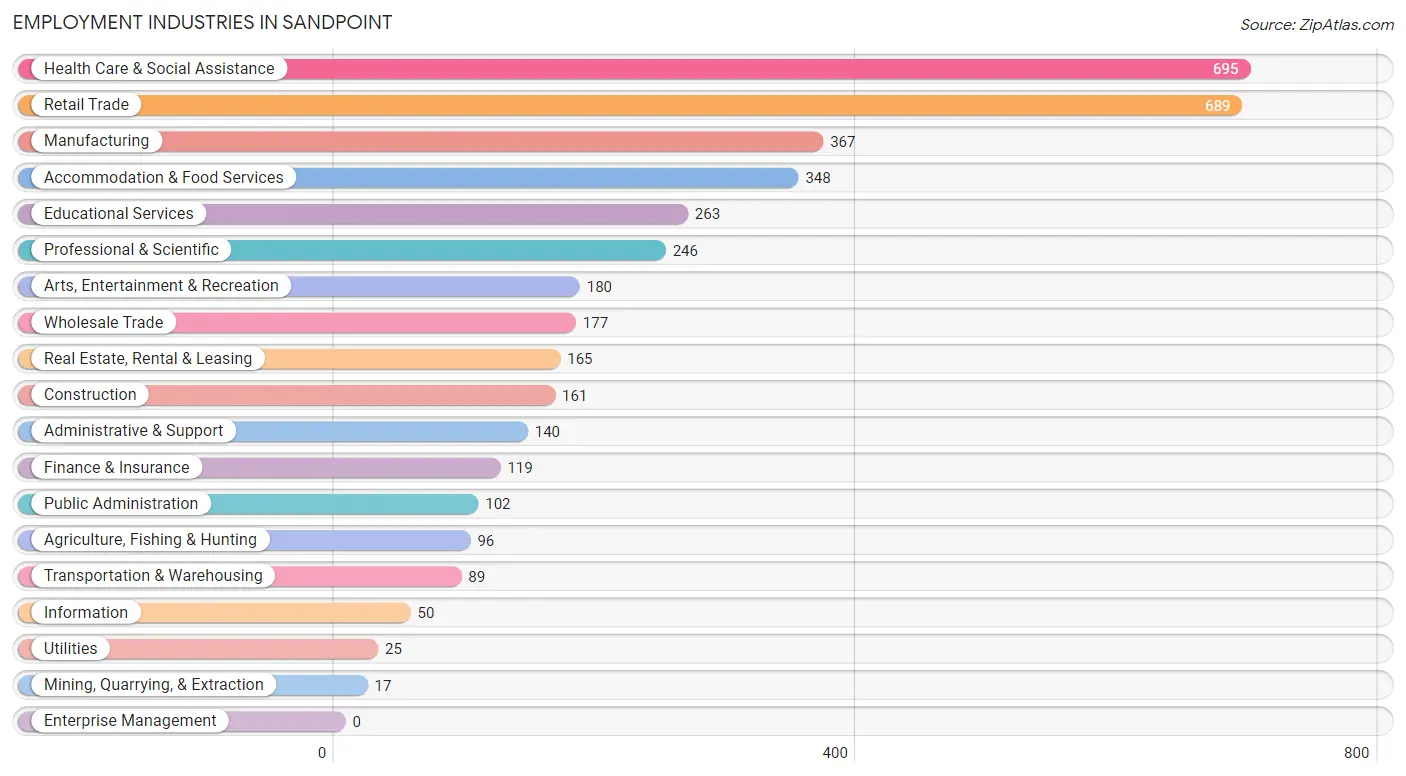
Employment Industries in Sandpoint
The major employment industries in Sandpoint include Health Care & Social Assistance (695 | 16.5%), Retail Trade (689 | 16.4%), Manufacturing (367 | 8.7%), Accommodation & Food Services (348 | 8.3%), and Educational Services (263 | 6.2%).
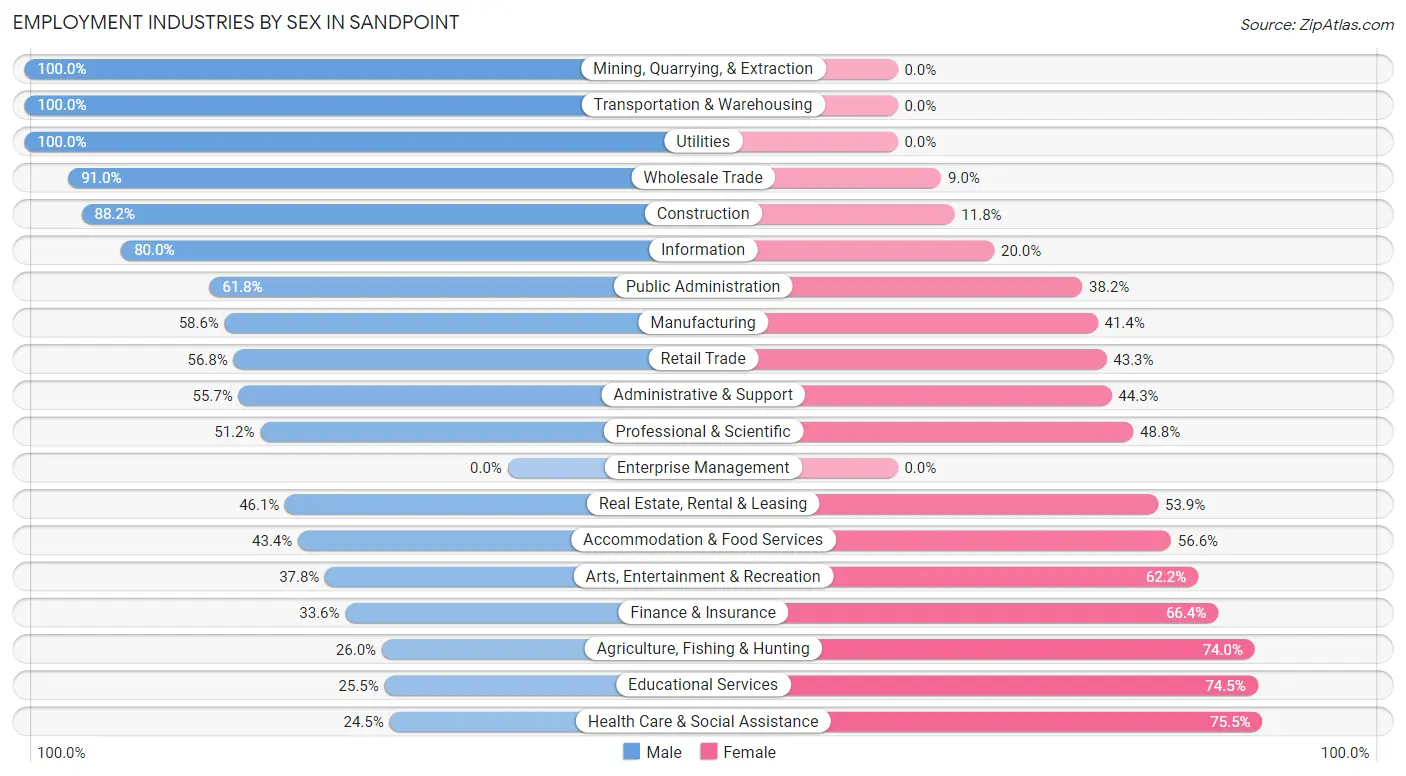
Employment Industries by Sex in Sandpoint
The Sandpoint industries that see more men than women are Mining, Quarrying, & Extraction (100.0%), Transportation & Warehousing (100.0%), and Utilities (100.0%), whereas the industries that tend to have a higher number of women are Health Care & Social Assistance (75.5%), Educational Services (74.5%), and Agriculture, Fishing & Hunting (74.0%).
| Industry | Male | Female |
| Agriculture, Fishing & Hunting | 25 (26.0%) | 71 (74.0%) |
| Mining, Quarrying, & Extraction | 17 (100.0%) | 0 (0.0%) |
| Construction | 142 (88.2%) | 19 (11.8%) |
| Manufacturing | 215 (58.6%) | 152 (41.4%) |
| Wholesale Trade | 161 (91.0%) | 16 (9.0%) |
| Retail Trade | 391 (56.8%) | 298 (43.2%) |
| Transportation & Warehousing | 89 (100.0%) | 0 (0.0%) |
| Utilities | 25 (100.0%) | 0 (0.0%) |
| Information | 40 (80.0%) | 10 (20.0%) |
| Finance & Insurance | 40 (33.6%) | 79 (66.4%) |
| Real Estate, Rental & Leasing | 76 (46.1%) | 89 (53.9%) |
| Professional & Scientific | 126 (51.2%) | 120 (48.8%) |
| Enterprise Management | 0 (0.0%) | 0 (0.0%) |
| Administrative & Support | 78 (55.7%) | 62 (44.3%) |
| Educational Services | 67 (25.5%) | 196 (74.5%) |
| Health Care & Social Assistance | 170 (24.5%) | 525 (75.5%) |
| Arts, Entertainment & Recreation | 68 (37.8%) | 112 (62.2%) |
| Accommodation & Food Services | 151 (43.4%) | 197 (56.6%) |
| Public Administration | 63 (61.8%) | 39 (38.2%) |
| Total | 2,042 (48.4%) | 2,173 (51.5%) |
Education in Sandpoint
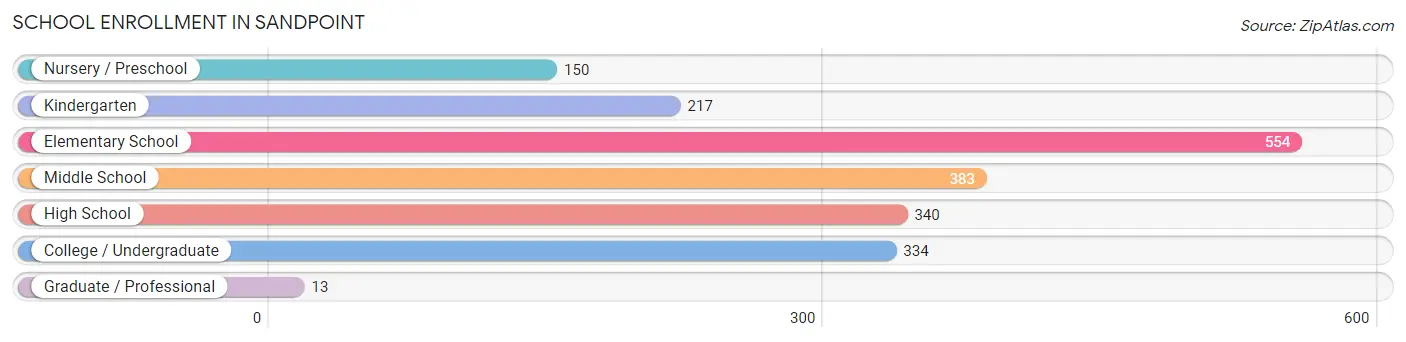
School Enrollment in Sandpoint
The most common levels of schooling among the 1,991 students in Sandpoint are elementary school (554 | 27.8%), middle school (383 | 19.2%), and high school (340 | 17.1%).
| School Level | # Students | % Students |
| Nursery / Preschool | 150 | 7.5% |
| Kindergarten | 217 | 10.9% |
| Elementary School | 554 | 27.8% |
| Middle School | 383 | 19.2% |
| High School | 340 | 17.1% |
| College / Undergraduate | 334 | 16.8% |
| Graduate / Professional | 13 | 0.6% |
| Total | 1,991 | 100.0% |
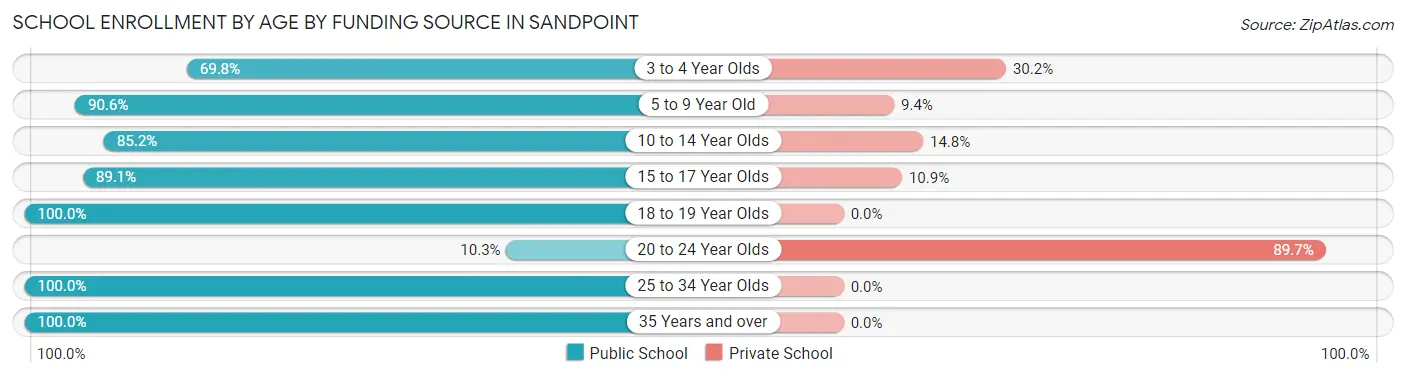
School Enrollment by Age by Funding Source in Sandpoint
Out of a total of 1,991 students who are enrolled in schools in Sandpoint, 253 (12.7%) attend a private institution, while the remaining 1,738 (87.3%) are enrolled in public schools. The age group of 20 to 24 year olds has the highest likelihood of being enrolled in private schools, with 35 (89.7% in the age bracket) enrolled. Conversely, the age group of 18 to 19 year olds has the lowest likelihood of being enrolled in a private school, with 41 (100.0% in the age bracket) attending a public institution.
| Age Bracket | Public School | Private School |
| 3 to 4 Year Olds | 120 (69.8%) | 52 (30.2%) |
| 5 to 9 Year Old | 607 (90.6%) | 63 (9.4%) |
| 10 to 14 Year Olds | 421 (85.2%) | 73 (14.8%) |
| 15 to 17 Year Olds | 238 (89.1%) | 29 (10.9%) |
| 18 to 19 Year Olds | 41 (100.0%) | 0 (0.0%) |
| 20 to 24 Year Olds | 4 (10.3%) | 35 (89.7%) |
| 25 to 34 Year Olds | 184 (100.0%) | 0 (0.0%) |
| 35 Years and over | 124 (100.0%) | 0 (0.0%) |
| Total | 1,738 (87.3%) | 253 (12.7%) |
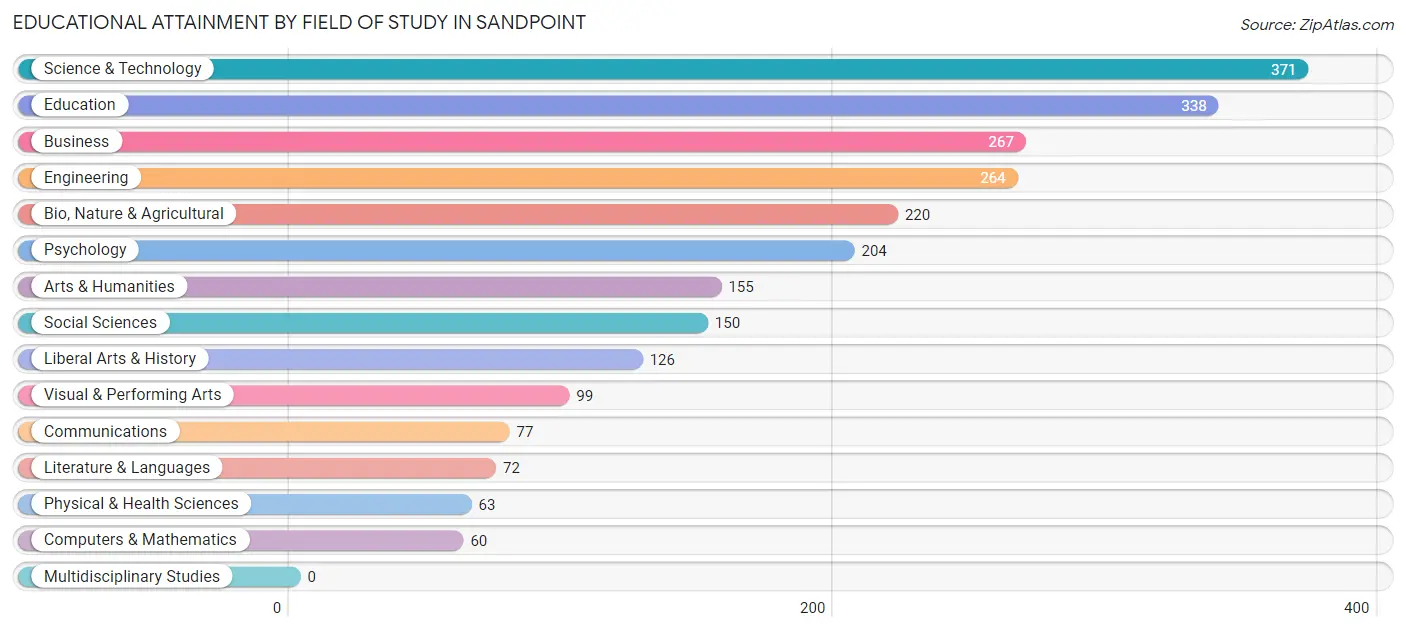
Educational Attainment by Field of Study in Sandpoint
Science & technology (371 | 15.0%), education (338 | 13.7%), business (267 | 10.8%), engineering (264 | 10.7%), and bio, nature & agricultural (220 | 8.9%) are the most common fields of study among 2,466 individuals in Sandpoint who have obtained a bachelor's degree or higher.
| Field of Study | # Graduates | % Graduates |
| Computers & Mathematics | 60 | 2.4% |
| Bio, Nature & Agricultural | 220 | 8.9% |
| Physical & Health Sciences | 63 | 2.5% |
| Psychology | 204 | 8.3% |
| Social Sciences | 150 | 6.1% |
| Engineering | 264 | 10.7% |
| Multidisciplinary Studies | 0 | 0.0% |
| Science & Technology | 371 | 15.0% |
| Business | 267 | 10.8% |
| Education | 338 | 13.7% |
| Literature & Languages | 72 | 2.9% |
| Liberal Arts & History | 126 | 5.1% |
| Visual & Performing Arts | 99 | 4.0% |
| Communications | 77 | 3.1% |
| Arts & Humanities | 155 | 6.3% |
| Total | 2,466 | 100.0% |
Transportation & Commute in Sandpoint
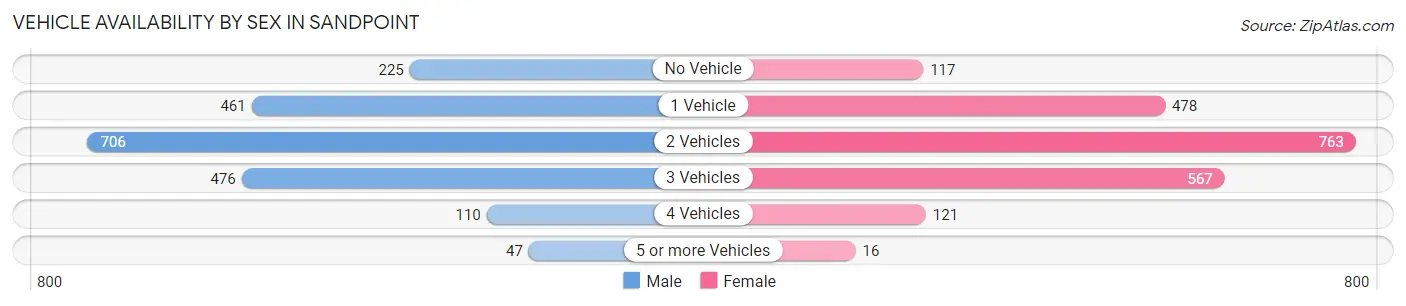
Vehicle Availability by Sex in Sandpoint
The most prevalent vehicle ownership categories in Sandpoint are males with 2 vehicles (706, accounting for 34.9%) and females with 2 vehicles (763, making up 34.2%).
| Vehicles Available | Male | Female |
| No Vehicle | 225 (11.1%) | 117 (5.7%) |
| 1 Vehicle | 461 (22.8%) | 478 (23.2%) |
| 2 Vehicles | 706 (34.9%) | 763 (37.0%) |
| 3 Vehicles | 476 (23.5%) | 567 (27.5%) |
| 4 Vehicles | 110 (5.4%) | 121 (5.9%) |
| 5 or more Vehicles | 47 (2.3%) | 16 (0.8%) |
| Total | 2,025 (100.0%) | 2,062 (100.0%) |
Commute Time in Sandpoint
The most frequently occuring commute durations in Sandpoint are 5 to 9 minutes (1,204 commuters, 31.0%), 10 to 14 minutes (1,098 commuters, 28.3%), and 30 to 34 minutes (390 commuters, 10.1%).
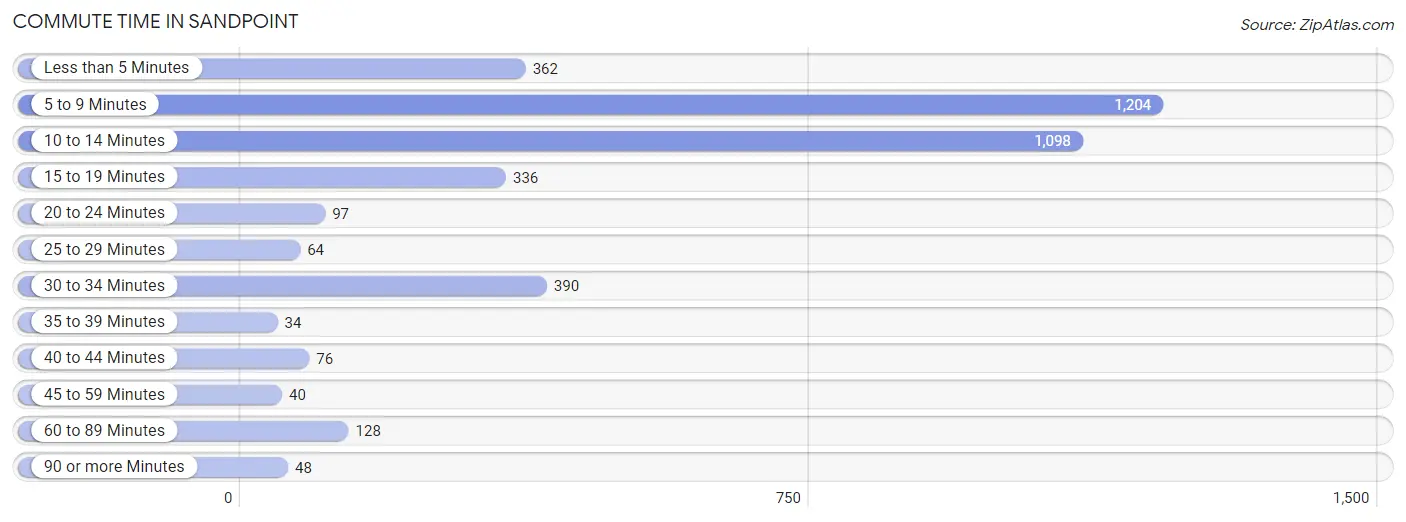
| Commute Time | # Commuters | % Commuters |
| Less than 5 Minutes | 362 | 9.3% |
| 5 to 9 Minutes | 1,204 | 31.0% |
| 10 to 14 Minutes | 1,098 | 28.3% |
| 15 to 19 Minutes | 336 | 8.7% |
| 20 to 24 Minutes | 97 | 2.5% |
| 25 to 29 Minutes | 64 | 1.7% |
| 30 to 34 Minutes | 390 | 10.1% |
| 35 to 39 Minutes | 34 | 0.9% |
| 40 to 44 Minutes | 76 | 2.0% |
| 45 to 59 Minutes | 40 | 1.0% |
| 60 to 89 Minutes | 128 | 3.3% |
| 90 or more Minutes | 48 | 1.2% |
Commute Time by Sex in Sandpoint
The most common commute times in Sandpoint are 5 to 9 minutes (653 commuters, 33.4%) for males and 10 to 14 minutes (588 commuters, 30.6%) for females.
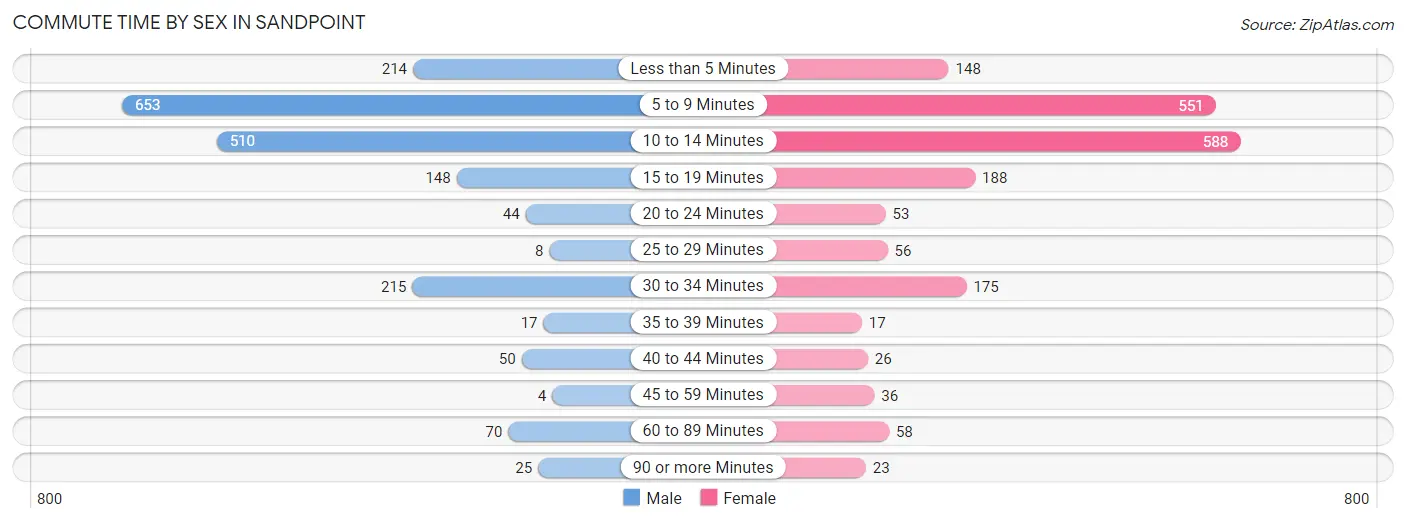
| Commute Time | Male | Female |
| Less than 5 Minutes | 214 (10.9%) | 148 (7.7%) |
| 5 to 9 Minutes | 653 (33.4%) | 551 (28.7%) |
| 10 to 14 Minutes | 510 (26.1%) | 588 (30.6%) |
| 15 to 19 Minutes | 148 (7.6%) | 188 (9.8%) |
| 20 to 24 Minutes | 44 (2.2%) | 53 (2.8%) |
| 25 to 29 Minutes | 8 (0.4%) | 56 (2.9%) |
| 30 to 34 Minutes | 215 (11.0%) | 175 (9.1%) |
| 35 to 39 Minutes | 17 (0.9%) | 17 (0.9%) |
| 40 to 44 Minutes | 50 (2.5%) | 26 (1.3%) |
| 45 to 59 Minutes | 4 (0.2%) | 36 (1.9%) |
| 60 to 89 Minutes | 70 (3.6%) | 58 (3.0%) |
| 90 or more Minutes | 25 (1.3%) | 23 (1.2%) |
Time of Departure to Work by Sex in Sandpoint
The most frequent times of departure to work in Sandpoint are 7:00 AM to 7:29 AM (312, 15.9%) for males and 7:30 AM to 7:59 AM (449, 23.4%) for females.
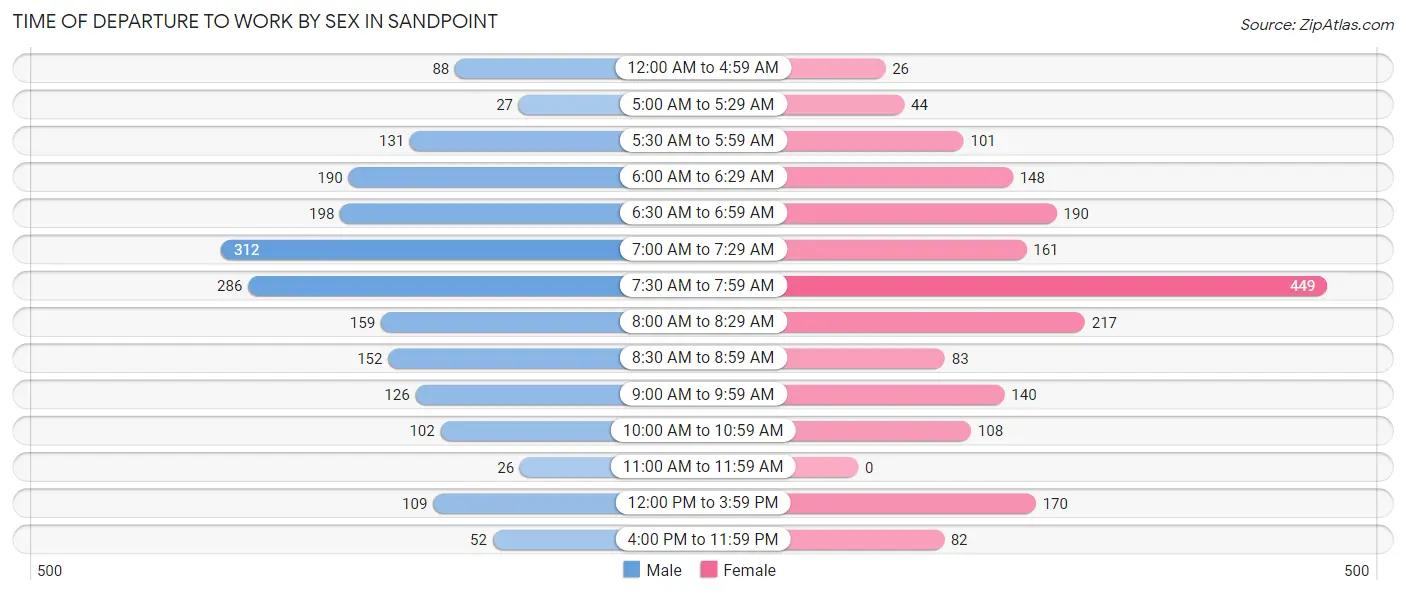
| Time of Departure | Male | Female |
| 12:00 AM to 4:59 AM | 88 (4.5%) | 26 (1.3%) |
| 5:00 AM to 5:29 AM | 27 (1.4%) | 44 (2.3%) |
| 5:30 AM to 5:59 AM | 131 (6.7%) | 101 (5.3%) |
| 6:00 AM to 6:29 AM | 190 (9.7%) | 148 (7.7%) |
| 6:30 AM to 6:59 AM | 198 (10.1%) | 190 (9.9%) |
| 7:00 AM to 7:29 AM | 312 (15.9%) | 161 (8.4%) |
| 7:30 AM to 7:59 AM | 286 (14.6%) | 449 (23.4%) |
| 8:00 AM to 8:29 AM | 159 (8.1%) | 217 (11.3%) |
| 8:30 AM to 8:59 AM | 152 (7.8%) | 83 (4.3%) |
| 9:00 AM to 9:59 AM | 126 (6.4%) | 140 (7.3%) |
| 10:00 AM to 10:59 AM | 102 (5.2%) | 108 (5.6%) |
| 11:00 AM to 11:59 AM | 26 (1.3%) | 0 (0.0%) |
| 12:00 PM to 3:59 PM | 109 (5.6%) | 170 (8.9%) |
| 4:00 PM to 11:59 PM | 52 (2.7%) | 82 (4.3%) |
| Total | 1,958 (100.0%) | 1,919 (100.0%) |
Housing Occupancy in Sandpoint
Occupancy by Ownership in Sandpoint
Of the total 3,542 dwellings in Sandpoint, owner-occupied units account for 2,057 (58.1%), while renter-occupied units make up 1,485 (41.9%).
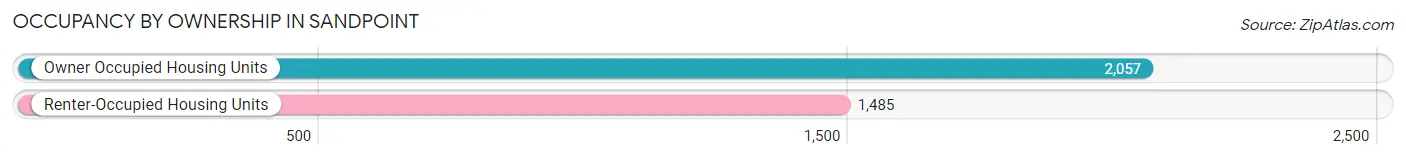
| Occupancy | # Housing Units | % Housing Units |
| Owner Occupied Housing Units | 2,057 | 58.1% |
| Renter-Occupied Housing Units | 1,485 | 41.9% |
| Total Occupied Housing Units | 3,542 | 100.0% |
Occupancy by Household Size in Sandpoint
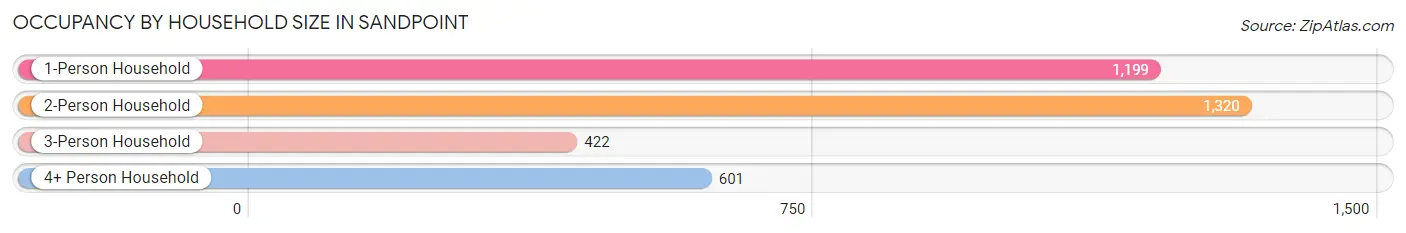
| Household Size | # Housing Units | % Housing Units |
| 1-Person Household | 1,199 | 33.9% |
| 2-Person Household | 1,320 | 37.3% |
| 3-Person Household | 422 | 11.9% |
| 4+ Person Household | 601 | 17.0% |
| Total Housing Units | 3,542 | 100.0% |
Occupancy by Ownership by Household Size in Sandpoint
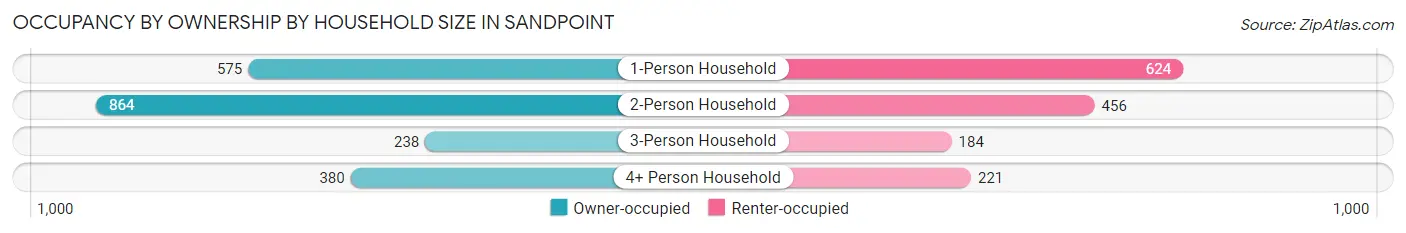
| Household Size | Owner-occupied | Renter-occupied |
| 1-Person Household | 575 (48.0%) | 624 (52.0%) |
| 2-Person Household | 864 (65.4%) | 456 (34.5%) |
| 3-Person Household | 238 (56.4%) | 184 (43.6%) |
| 4+ Person Household | 380 (63.2%) | 221 (36.8%) |
| Total Housing Units | 2,057 (58.1%) | 1,485 (41.9%) |
Occupancy by Educational Attainment in Sandpoint
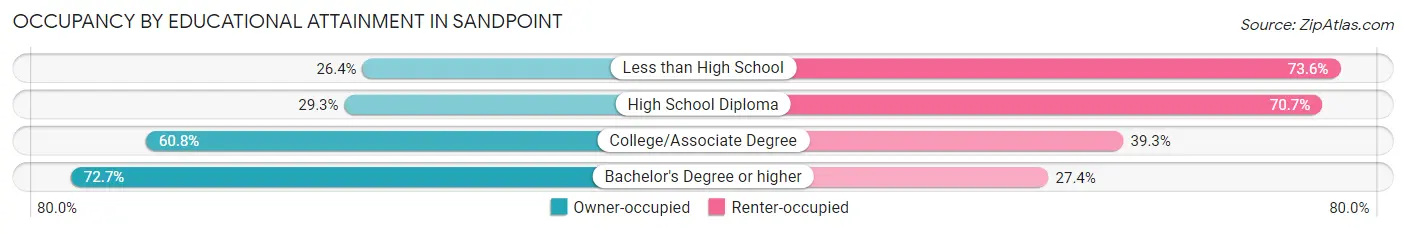
| Household Size | Owner-occupied | Renter-occupied |
| Less than High School | 61 (26.4%) | 170 (73.6%) |
| High School Diploma | 171 (29.3%) | 413 (70.7%) |
| College/Associate Degree | 797 (60.8%) | 515 (39.3%) |
| Bachelor's Degree or higher | 1,028 (72.7%) | 387 (27.4%) |
Occupancy by Age of Householder in Sandpoint
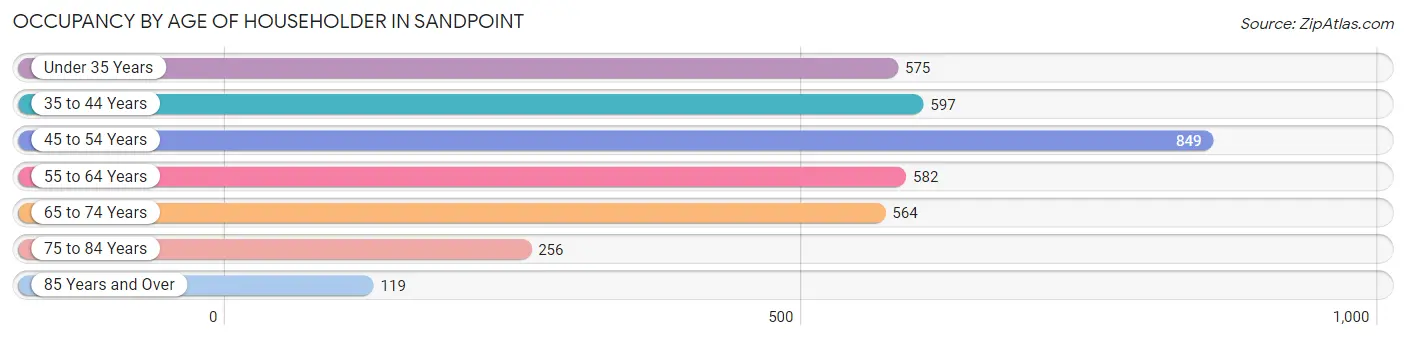
| Age Bracket | # Households | % Households |
| Under 35 Years | 575 | 16.2% |
| 35 to 44 Years | 597 | 16.9% |
| 45 to 54 Years | 849 | 24.0% |
| 55 to 64 Years | 582 | 16.4% |
| 65 to 74 Years | 564 | 15.9% |
| 75 to 84 Years | 256 | 7.2% |
| 85 Years and Over | 119 | 3.4% |
| Total | 3,542 | 100.0% |
Housing Finances in Sandpoint
Median Income by Occupancy in Sandpoint
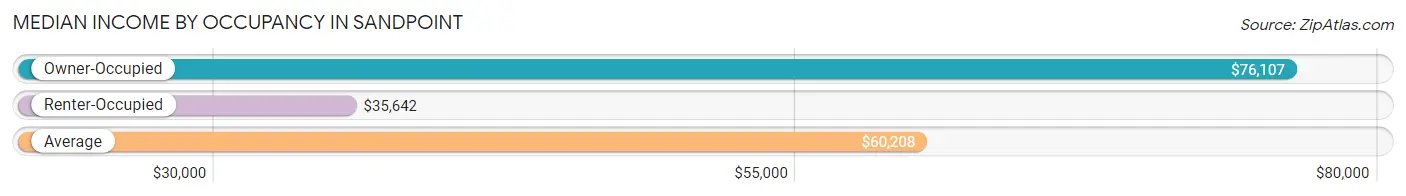
| Occupancy Type | # Households | Median Income |
| Owner-Occupied | 2,057 (58.1%) | $76,107 |
| Renter-Occupied | 1,485 (41.9%) | $35,642 |
| Average | 3,542 (100.0%) | $60,208 |
Occupancy by Householder Income Bracket in Sandpoint
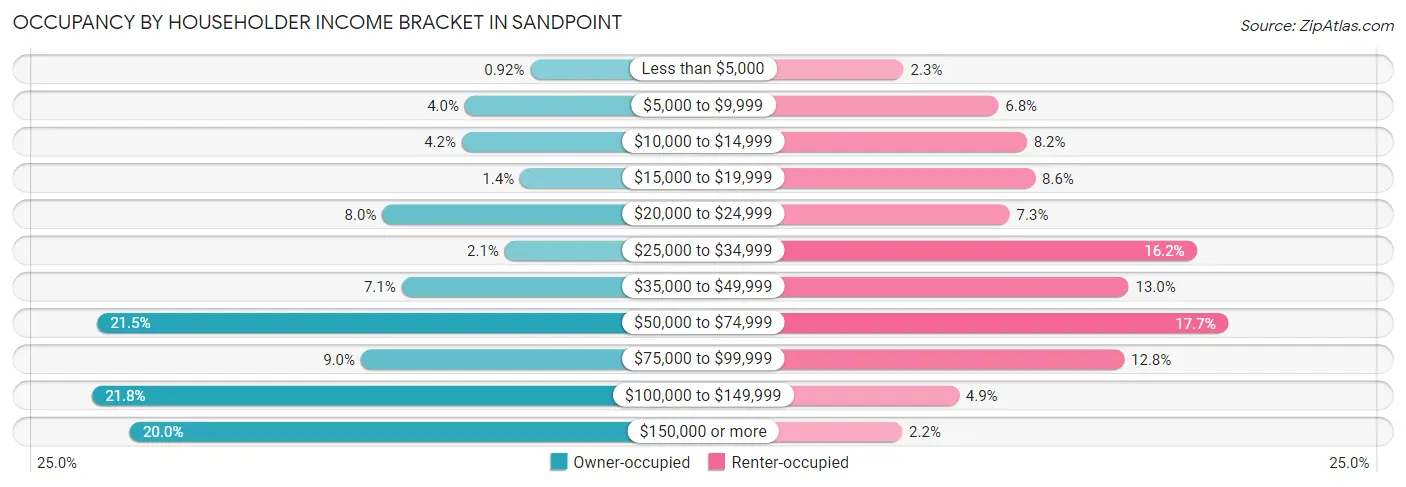
| Income Bracket | Owner-occupied | Renter-occupied |
| Less than $5,000 | 19 (0.9%) | 34 (2.3%) |
| $5,000 to $9,999 | 83 (4.0%) | 101 (6.8%) |
| $10,000 to $14,999 | 86 (4.2%) | 121 (8.2%) |
| $15,000 to $19,999 | 29 (1.4%) | 127 (8.6%) |
| $20,000 to $24,999 | 164 (8.0%) | 109 (7.3%) |
| $25,000 to $34,999 | 44 (2.1%) | 241 (16.2%) |
| $35,000 to $49,999 | 145 (7.0%) | 193 (13.0%) |
| $50,000 to $74,999 | 443 (21.5%) | 263 (17.7%) |
| $75,000 to $99,999 | 185 (9.0%) | 190 (12.8%) |
| $100,000 to $149,999 | 448 (21.8%) | 73 (4.9%) |
| $150,000 or more | 411 (20.0%) | 33 (2.2%) |
| Total | 2,057 (100.0%) | 1,485 (100.0%) |
Monthly Housing Cost Tiers in Sandpoint
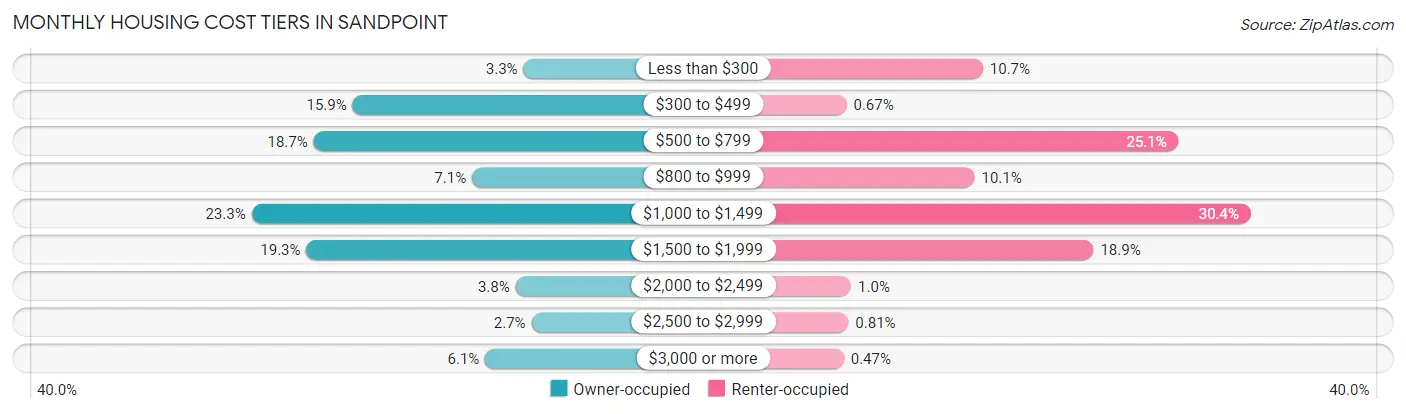
| Monthly Cost | Owner-occupied | Renter-occupied |
| Less than $300 | 67 (3.3%) | 159 (10.7%) |
| $300 to $499 | 326 (15.9%) | 10 (0.7%) |
| $500 to $799 | 385 (18.7%) | 373 (25.1%) |
| $800 to $999 | 145 (7.0%) | 150 (10.1%) |
| $1,000 to $1,499 | 479 (23.3%) | 452 (30.4%) |
| $1,500 to $1,999 | 396 (19.3%) | 280 (18.9%) |
| $2,000 to $2,499 | 79 (3.8%) | 15 (1.0%) |
| $2,500 to $2,999 | 55 (2.7%) | 12 (0.8%) |
| $3,000 or more | 125 (6.1%) | 7 (0.5%) |
| Total | 2,057 (100.0%) | 1,485 (100.0%) |
Physical Housing Characteristics in Sandpoint
Housing Structures in Sandpoint
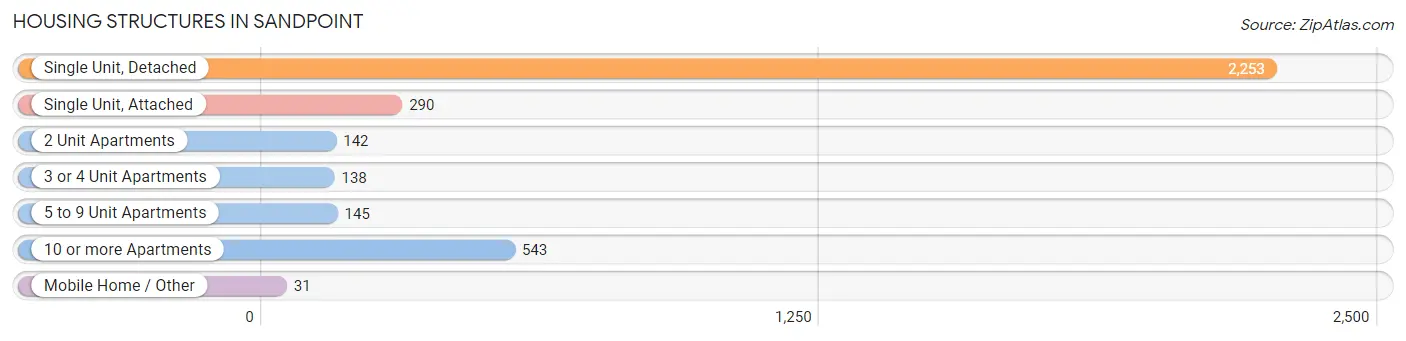
| Structure Type | # Housing Units | % Housing Units |
| Single Unit, Detached | 2,253 | 63.6% |
| Single Unit, Attached | 290 | 8.2% |
| 2 Unit Apartments | 142 | 4.0% |
| 3 or 4 Unit Apartments | 138 | 3.9% |
| 5 to 9 Unit Apartments | 145 | 4.1% |
| 10 or more Apartments | 543 | 15.3% |
| Mobile Home / Other | 31 | 0.9% |
| Total | 3,542 | 100.0% |
Housing Structures by Occupancy in Sandpoint
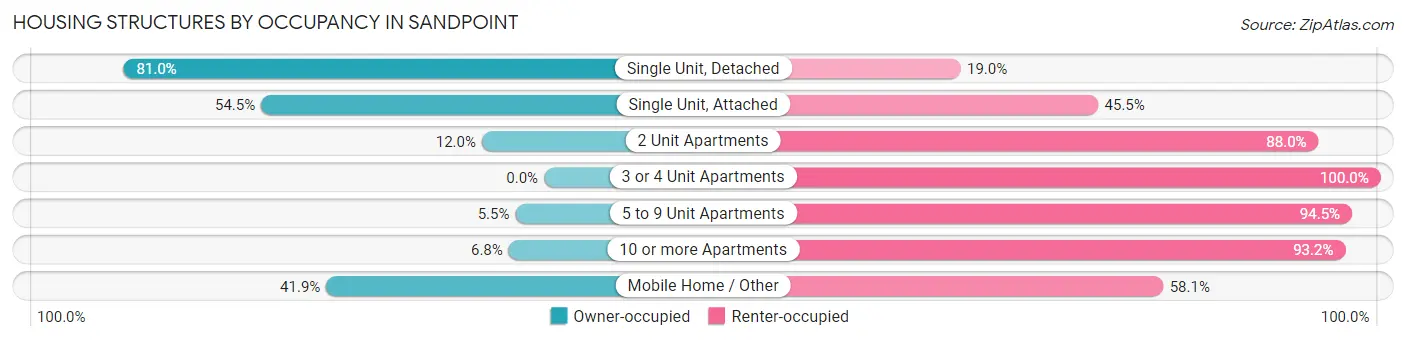
| Structure Type | Owner-occupied | Renter-occupied |
| Single Unit, Detached | 1,824 (81.0%) | 429 (19.0%) |
| Single Unit, Attached | 158 (54.5%) | 132 (45.5%) |
| 2 Unit Apartments | 17 (12.0%) | 125 (88.0%) |
| 3 or 4 Unit Apartments | 0 (0.0%) | 138 (100.0%) |
| 5 to 9 Unit Apartments | 8 (5.5%) | 137 (94.5%) |
| 10 or more Apartments | 37 (6.8%) | 506 (93.2%) |
| Mobile Home / Other | 13 (41.9%) | 18 (58.1%) |
| Total | 2,057 (58.1%) | 1,485 (41.9%) |
Housing Structures by Number of Rooms in Sandpoint
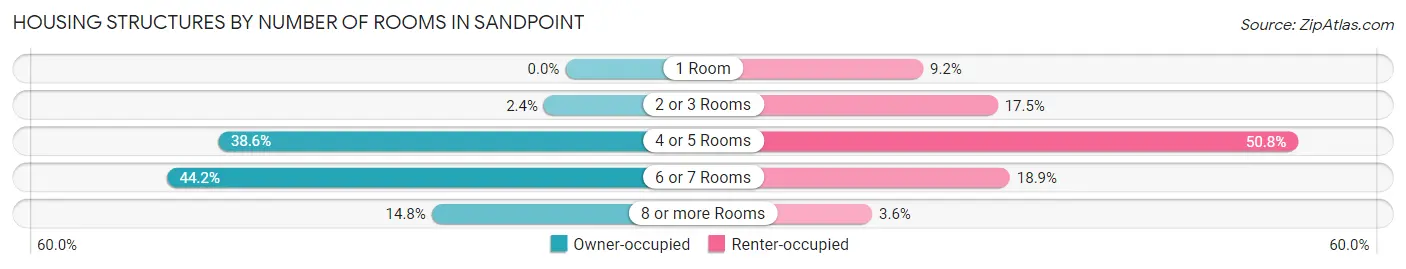
| Number of Rooms | Owner-occupied | Renter-occupied |
| 1 Room | 0 (0.0%) | 137 (9.2%) |
| 2 or 3 Rooms | 49 (2.4%) | 260 (17.5%) |
| 4 or 5 Rooms | 793 (38.6%) | 755 (50.8%) |
| 6 or 7 Rooms | 910 (44.2%) | 280 (18.9%) |
| 8 or more Rooms | 305 (14.8%) | 53 (3.6%) |
| Total | 2,057 (100.0%) | 1,485 (100.0%) |
Housing Structure by Heating Type in Sandpoint
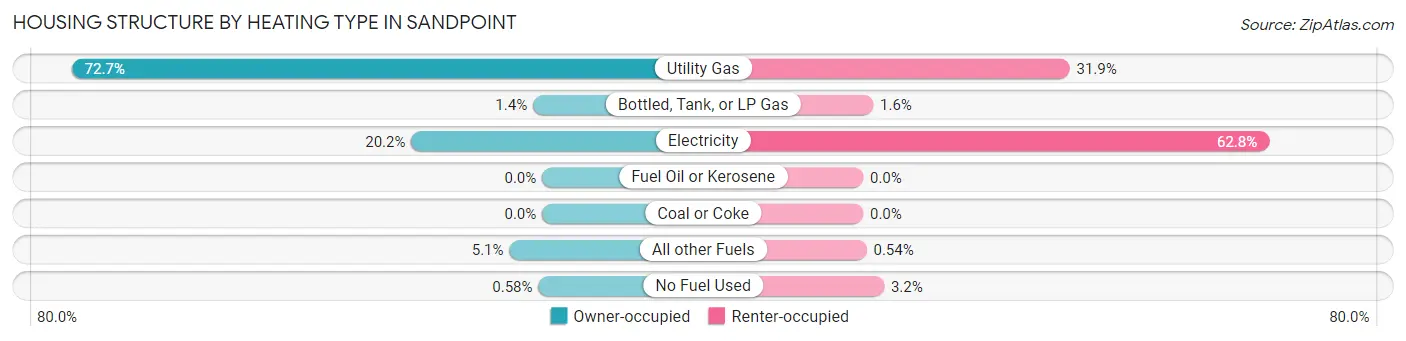
| Heating Type | Owner-occupied | Renter-occupied |
| Utility Gas | 1,496 (72.7%) | 474 (31.9%) |
| Bottled, Tank, or LP Gas | 29 (1.4%) | 23 (1.5%) |
| Electricity | 416 (20.2%) | 932 (62.8%) |
| Fuel Oil or Kerosene | 0 (0.0%) | 0 (0.0%) |
| Coal or Coke | 0 (0.0%) | 0 (0.0%) |
| All other Fuels | 104 (5.1%) | 8 (0.5%) |
| No Fuel Used | 12 (0.6%) | 48 (3.2%) |
| Total | 2,057 (100.0%) | 1,485 (100.0%) |
Household Vehicle Usage in Sandpoint
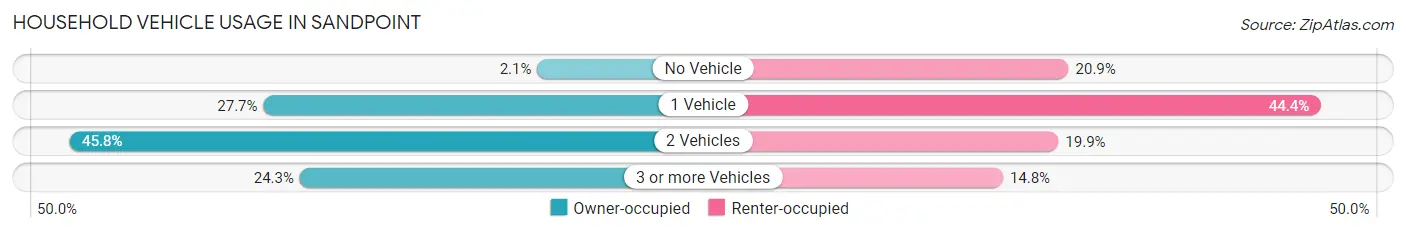
| Vehicles per Household | Owner-occupied | Renter-occupied |
| No Vehicle | 44 (2.1%) | 310 (20.9%) |
| 1 Vehicle | 570 (27.7%) | 660 (44.4%) |
| 2 Vehicles | 943 (45.8%) | 296 (19.9%) |
| 3 or more Vehicles | 500 (24.3%) | 219 (14.7%) |
| Total | 2,057 (100.0%) | 1,485 (100.0%) |
Real Estate & Mortgages in Sandpoint
Real Estate and Mortgage Overview in Sandpoint
| Characteristic | Without Mortgage | With Mortgage |
| Housing Units | 860 | 1,197 |
| Median Property Value | $396,200 | $419,400 |
| Median Household Income | $56,250 | $236 |
| Monthly Housing Costs | $521 | $125 |
| Real Estate Taxes | $2,111 | $6 |
Property Value by Mortgage Status in Sandpoint
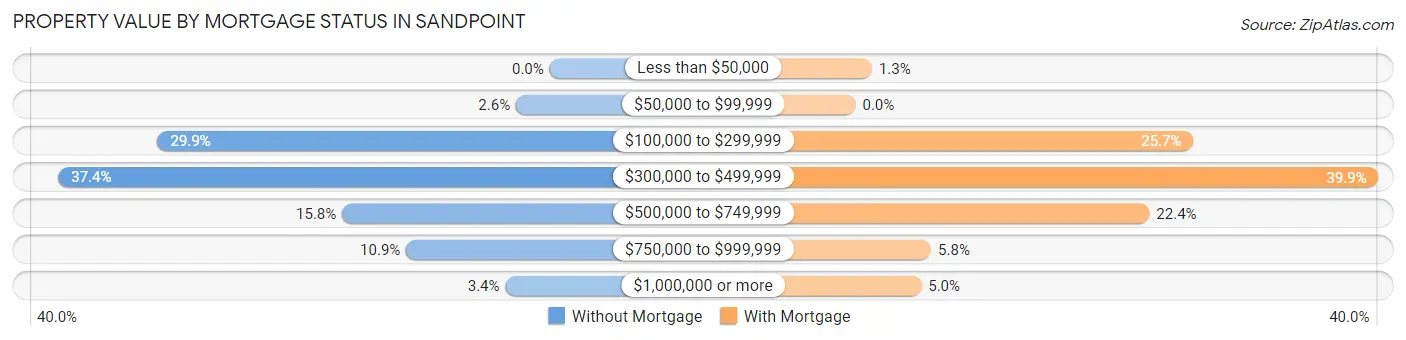
| Property Value | Without Mortgage | With Mortgage |
| Less than $50,000 | 0 (0.0%) | 15 (1.3%) |
| $50,000 to $99,999 | 22 (2.6%) | 0 (0.0%) |
| $100,000 to $299,999 | 257 (29.9%) | 308 (25.7%) |
| $300,000 to $499,999 | 322 (37.4%) | 477 (39.9%) |
| $500,000 to $749,999 | 136 (15.8%) | 268 (22.4%) |
| $750,000 to $999,999 | 94 (10.9%) | 69 (5.8%) |
| $1,000,000 or more | 29 (3.4%) | 60 (5.0%) |
| Total | 860 (100.0%) | 1,197 (100.0%) |
Household Income by Mortgage Status in Sandpoint
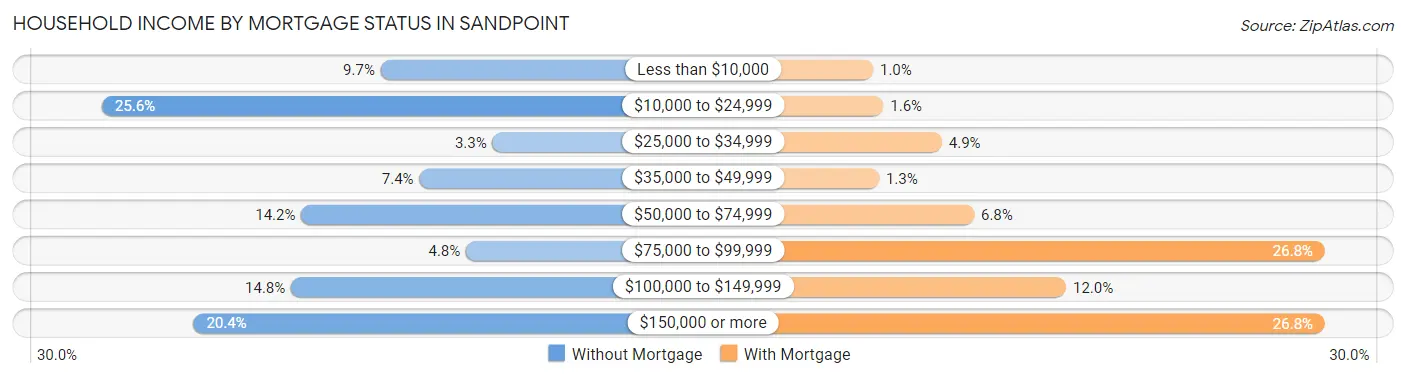
| Household Income | Without Mortgage | With Mortgage |
| Less than $10,000 | 83 (9.7%) | 12 (1.0%) |
| $10,000 to $24,999 | 220 (25.6%) | 19 (1.6%) |
| $25,000 to $34,999 | 28 (3.3%) | 59 (4.9%) |
| $35,000 to $49,999 | 64 (7.4%) | 16 (1.3%) |
| $50,000 to $74,999 | 122 (14.2%) | 81 (6.8%) |
| $75,000 to $99,999 | 41 (4.8%) | 321 (26.8%) |
| $100,000 to $149,999 | 127 (14.8%) | 144 (12.0%) |
| $150,000 or more | 175 (20.3%) | 321 (26.8%) |
| Total | 860 (100.0%) | 1,197 (100.0%) |
Property Value to Household Income Ratio in Sandpoint
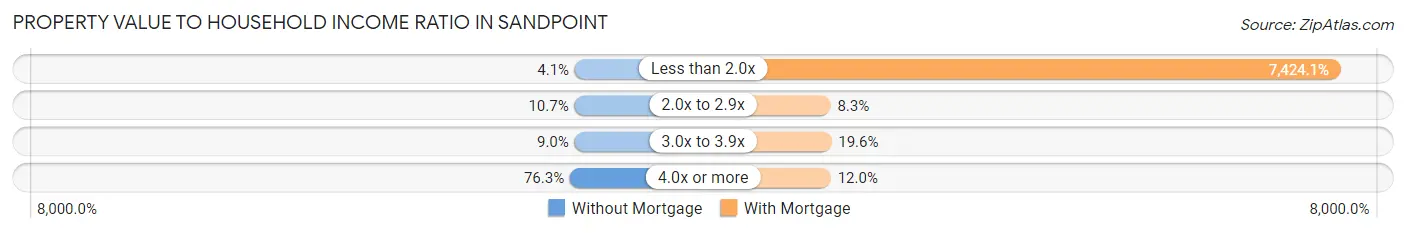
| Value-to-Income Ratio | Without Mortgage | With Mortgage |
| Less than 2.0x | 35 (4.1%) | 88,867 (7,424.1%) |
| 2.0x to 2.9x | 92 (10.7%) | 99 (8.3%) |
| 3.0x to 3.9x | 77 (8.9%) | 234 (19.6%) |
| 4.0x or more | 656 (76.3%) | 143 (11.9%) |
| Total | 860 (100.0%) | 1,197 (100.0%) |
Real Estate Taxes by Mortgage Status in Sandpoint
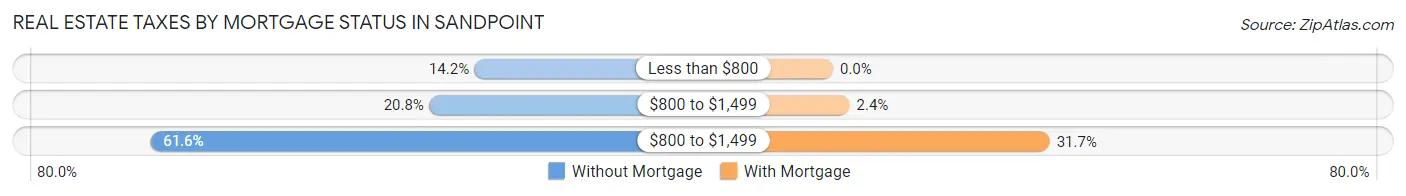
| Property Taxes | Without Mortgage | With Mortgage |
| Less than $800 | 122 (14.2%) | 0 (0.0%) |
| $800 to $1,499 | 179 (20.8%) | 29 (2.4%) |
| $800 to $1,499 | 530 (61.6%) | 379 (31.7%) |
| Total | 860 (100.0%) | 1,197 (100.0%) |
Health & Disability in Sandpoint
Health Insurance Coverage by Age in Sandpoint
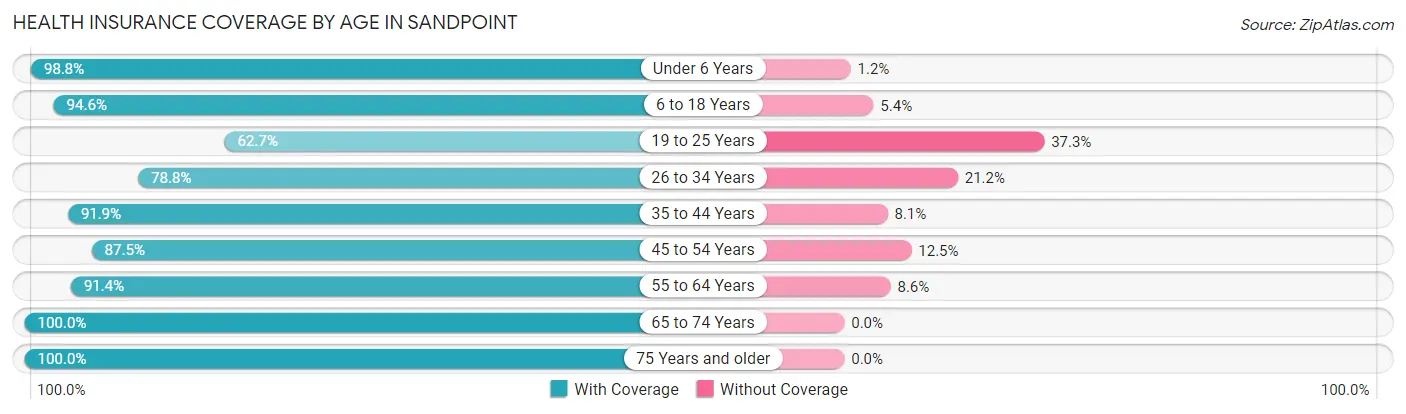
| Age Bracket | With Coverage | Without Coverage |
| Under 6 Years | 589 (98.8%) | 7 (1.2%) |
| 6 to 18 Years | 1,341 (94.6%) | 77 (5.4%) |
| 19 to 25 Years | 286 (62.7%) | 170 (37.3%) |
| 26 to 34 Years | 749 (78.8%) | 201 (21.2%) |
| 35 to 44 Years | 1,084 (91.9%) | 95 (8.1%) |
| 45 to 54 Years | 1,175 (87.5%) | 168 (12.5%) |
| 55 to 64 Years | 1,092 (91.4%) | 103 (8.6%) |
| 65 to 74 Years | 880 (100.0%) | 0 (0.0%) |
| 75 Years and older | 496 (100.0%) | 0 (0.0%) |
| Total | 7,692 (90.4%) | 821 (9.6%) |
Health Insurance Coverage by Citizenship Status in Sandpoint
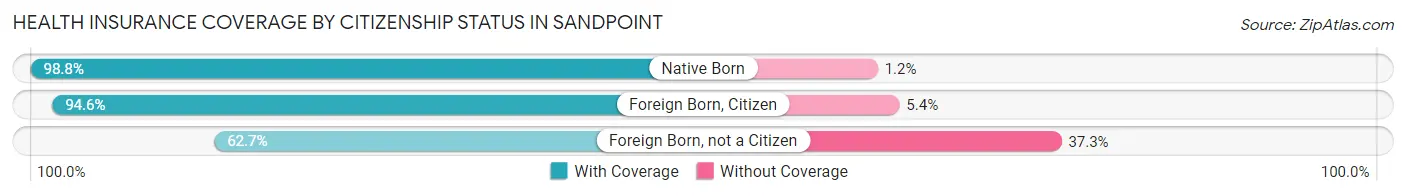
| Citizenship Status | With Coverage | Without Coverage |
| Native Born | 589 (98.8%) | 7 (1.2%) |
| Foreign Born, Citizen | 1,341 (94.6%) | 77 (5.4%) |
| Foreign Born, not a Citizen | 286 (62.7%) | 170 (37.3%) |
Health Insurance Coverage by Household Income in Sandpoint
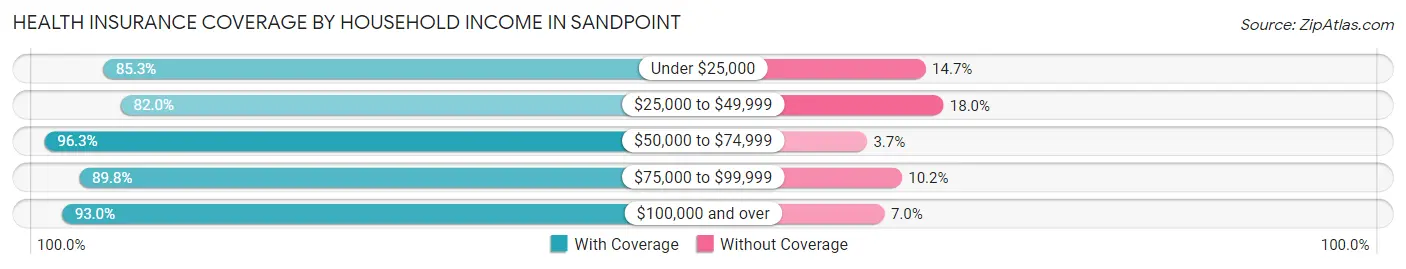
| Household Income | With Coverage | Without Coverage |
| Under $25,000 | 1,087 (85.3%) | 187 (14.7%) |
| $25,000 to $49,999 | 1,098 (82.0%) | 241 (18.0%) |
| $50,000 to $74,999 | 1,854 (96.3%) | 71 (3.7%) |
| $75,000 to $99,999 | 950 (89.8%) | 108 (10.2%) |
| $100,000 and over | 2,628 (93.0%) | 197 (7.0%) |
Public vs Private Health Insurance Coverage by Age in Sandpoint
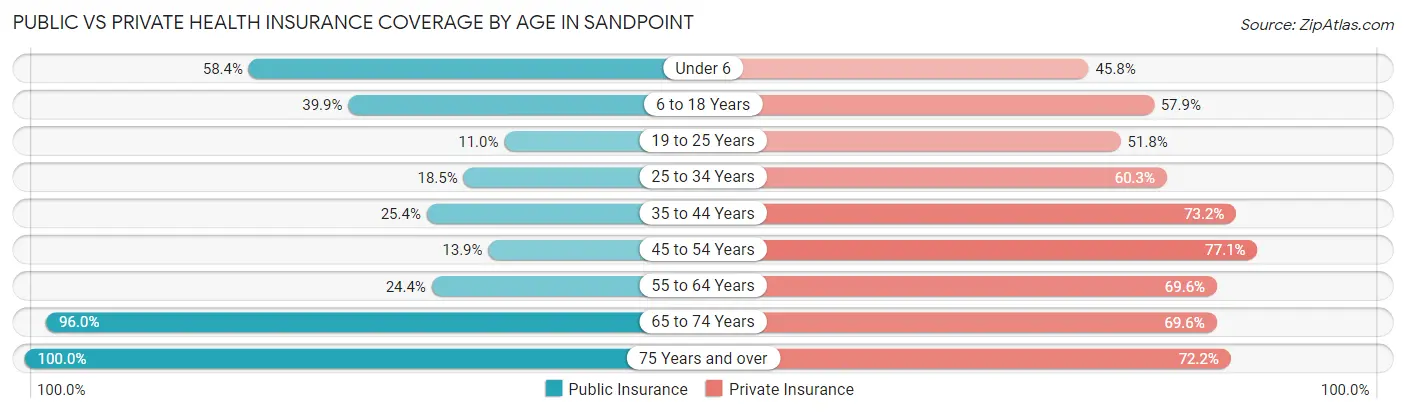
| Age Bracket | Public Insurance | Private Insurance |
| Under 6 | 348 (58.4%) | 273 (45.8%) |
| 6 to 18 Years | 566 (39.9%) | 821 (57.9%) |
| 19 to 25 Years | 50 (11.0%) | 236 (51.7%) |
| 25 to 34 Years | 176 (18.5%) | 573 (60.3%) |
| 35 to 44 Years | 299 (25.4%) | 863 (73.2%) |
| 45 to 54 Years | 187 (13.9%) | 1,036 (77.1%) |
| 55 to 64 Years | 292 (24.4%) | 832 (69.6%) |
| 65 to 74 Years | 845 (96.0%) | 612 (69.6%) |
| 75 Years and over | 496 (100.0%) | 358 (72.2%) |
| Total | 3,259 (38.3%) | 5,604 (65.8%) |
Disability Status by Sex by Age in Sandpoint
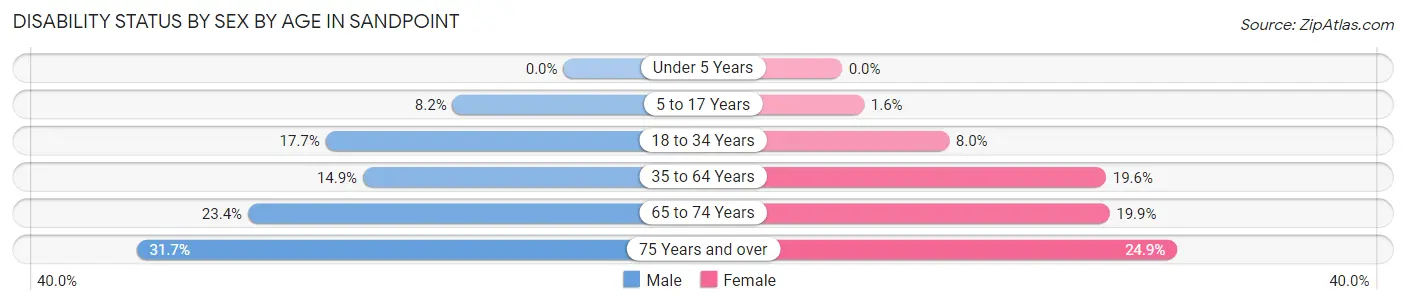
| Age Bracket | Male | Female |
| Under 5 Years | 0 (0.0%) | 0 (0.0%) |
| 5 to 17 Years | 65 (8.2%) | 11 (1.6%) |
| 18 to 34 Years | 132 (17.6%) | 57 (8.0%) |
| 35 to 64 Years | 279 (14.9%) | 361 (19.6%) |
| 65 to 74 Years | 74 (23.4%) | 112 (19.9%) |
| 75 Years and over | 77 (31.7%) | 63 (24.9%) |
Disability Class by Sex by Age in Sandpoint
Disability Class: Hearing Difficulty
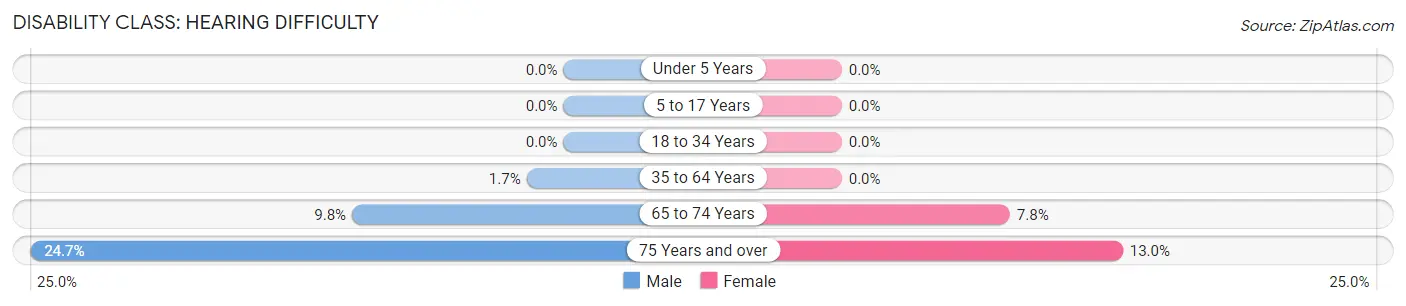
| Age Bracket | Male | Female |
| Under 5 Years | 0 (0.0%) | 0 (0.0%) |
| 5 to 17 Years | 0 (0.0%) | 0 (0.0%) |
| 18 to 34 Years | 0 (0.0%) | 0 (0.0%) |
| 35 to 64 Years | 32 (1.7%) | 0 (0.0%) |
| 65 to 74 Years | 31 (9.8%) | 44 (7.8%) |
| 75 Years and over | 60 (24.7%) | 33 (13.0%) |
Disability Class: Vision Difficulty
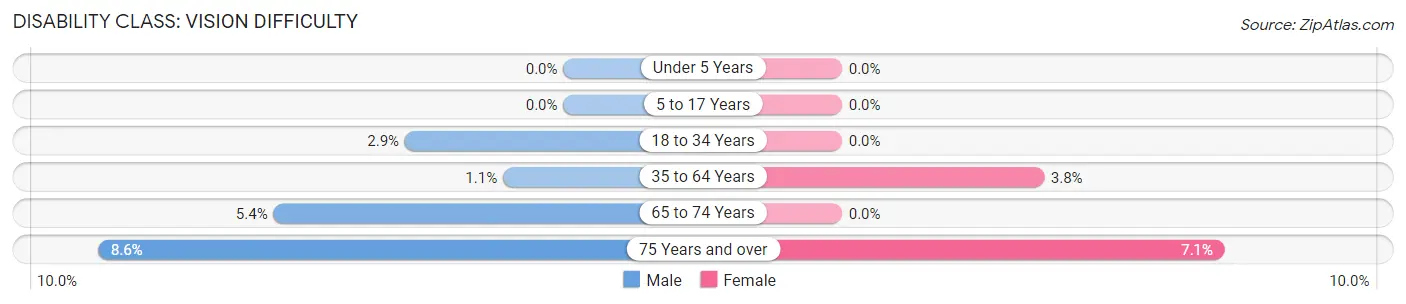
| Age Bracket | Male | Female |
| Under 5 Years | 0 (0.0%) | 0 (0.0%) |
| 5 to 17 Years | 0 (0.0%) | 0 (0.0%) |
| 18 to 34 Years | 22 (2.9%) | 0 (0.0%) |
| 35 to 64 Years | 21 (1.1%) | 69 (3.7%) |
| 65 to 74 Years | 17 (5.4%) | 0 (0.0%) |
| 75 Years and over | 21 (8.6%) | 18 (7.1%) |
Disability Class: Cognitive Difficulty
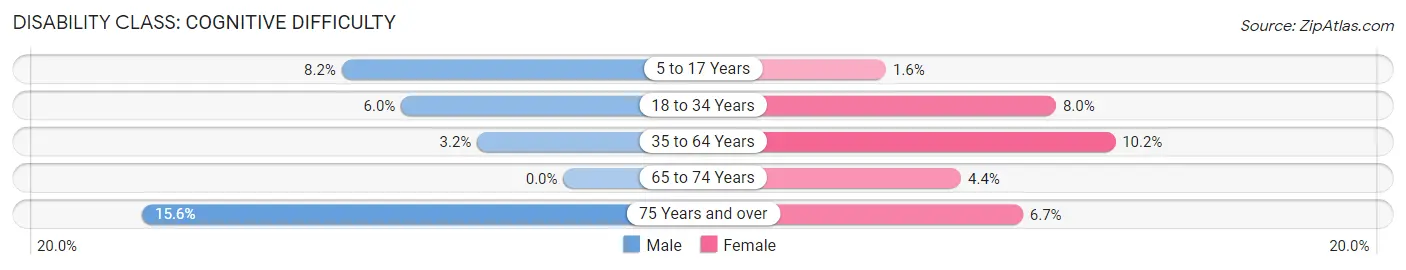
| Age Bracket | Male | Female |
| 5 to 17 Years | 65 (8.2%) | 11 (1.6%) |
| 18 to 34 Years | 45 (6.0%) | 57 (8.0%) |
| 35 to 64 Years | 60 (3.2%) | 187 (10.2%) |
| 65 to 74 Years | 0 (0.0%) | 25 (4.4%) |
| 75 Years and over | 38 (15.6%) | 17 (6.7%) |
Disability Class: Ambulatory Difficulty
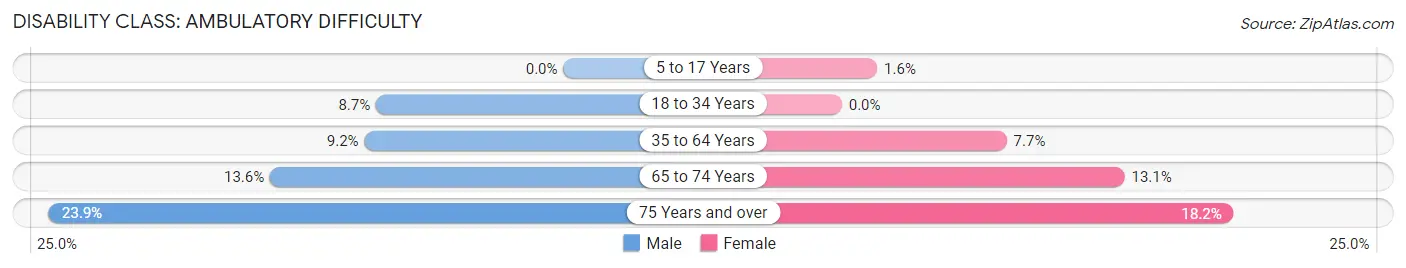
| Age Bracket | Male | Female |
| 5 to 17 Years | 0 (0.0%) | 11 (1.6%) |
| 18 to 34 Years | 65 (8.7%) | 0 (0.0%) |
| 35 to 64 Years | 173 (9.2%) | 141 (7.6%) |
| 65 to 74 Years | 43 (13.6%) | 74 (13.1%) |
| 75 Years and over | 58 (23.9%) | 46 (18.2%) |
Disability Class: Self-Care Difficulty
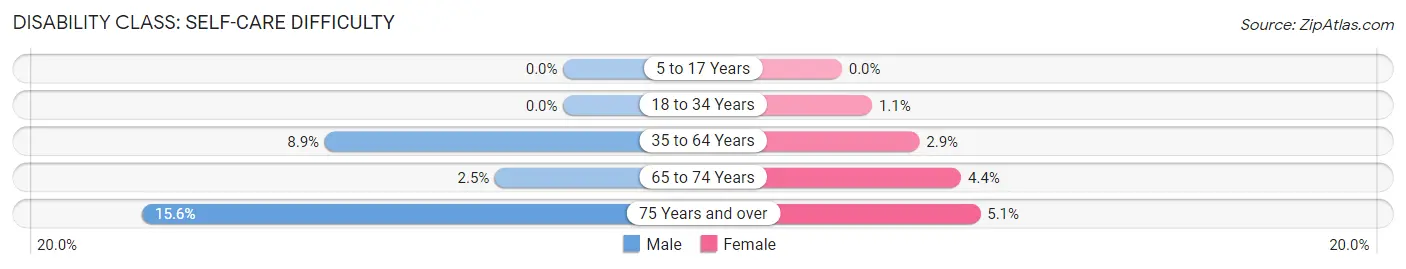
| Age Bracket | Male | Female |
| 5 to 17 Years | 0 (0.0%) | 0 (0.0%) |
| 18 to 34 Years | 0 (0.0%) | 8 (1.1%) |
| 35 to 64 Years | 166 (8.8%) | 53 (2.9%) |
| 65 to 74 Years | 8 (2.5%) | 25 (4.4%) |
| 75 Years and over | 38 (15.6%) | 13 (5.1%) |
Technology Access in Sandpoint
Computing Device Access in Sandpoint
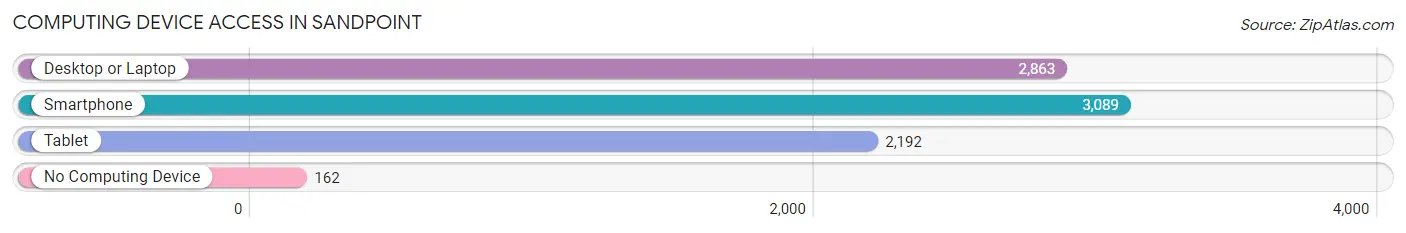
| Device Type | # Households | % Households |
| Desktop or Laptop | 2,863 | 80.8% |
| Smartphone | 3,089 | 87.2% |
| Tablet | 2,192 | 61.9% |
| No Computing Device | 162 | 4.6% |
| Total | 3,542 | 100.0% |
Internet Access in Sandpoint
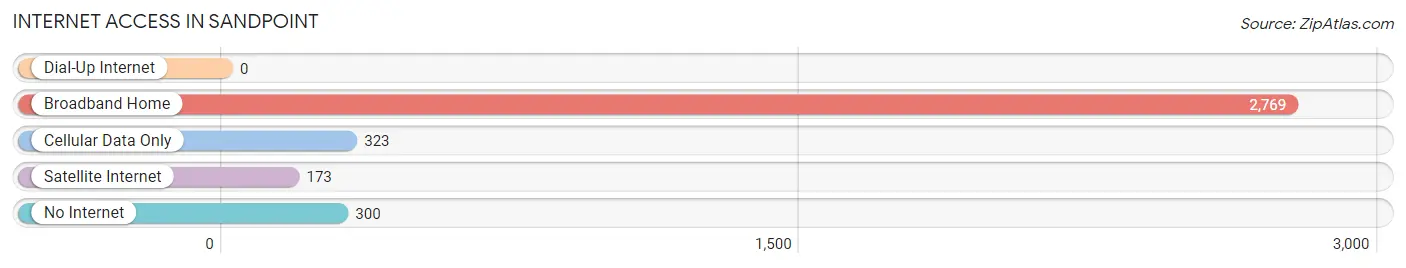
| Internet Type | # Households | % Households |
| Dial-Up Internet | 0 | 0.0% |
| Broadband Home | 2,769 | 78.2% |
| Cellular Data Only | 323 | 9.1% |
| Satellite Internet | 173 | 4.9% |
| No Internet | 300 | 8.5% |
| Total | 3,542 | 100.0% |
Sandpoint Summary
Sandpoint, Idaho is a small city located in the northern part of the state, in Bonner County. It is situated on the shores of Lake Pend Oreille, the largest lake in Idaho, and is surrounded by the Selkirk and Cabinet Mountains. The city has a population of 8,390, according to the 2019 U.S. Census, and is the county seat of Bonner County.
History
The area that is now Sandpoint was first inhabited by the Kootenai and Salish Native American tribes. The first non-native settlers arrived in the area in the late 1800s, and the town was officially founded in 1883. The city was named after the nearby Sand Creek, which was named by early settlers for the sandbars that formed in the creek.
The city grew rapidly in the early 1900s, and by 1910, it had become the largest city in the county. The city was incorporated in 1911, and the first mayor was elected in 1912.
In the 1920s, the city experienced a period of growth and prosperity, with the construction of a new railroad line and the opening of a new sawmill. The city also became a popular tourist destination, with the opening of a number of resorts and hotels.
In the 1940s, the city experienced a period of decline, as the timber industry declined and the population decreased. However, the city experienced a resurgence in the 1950s, with the opening of a new ski resort and the construction of a new bridge across Lake Pend Oreille.
Geography
Sandpoint is located in the northern part of Idaho, in Bonner County. It is situated on the shores of Lake Pend Oreille, the largest lake in Idaho, and is surrounded by the Selkirk and Cabinet Mountains. The city has a total area of 8.3 square miles, of which 8.2 square miles is land and 0.1 square miles is water.
The city has a humid continental climate, with cold winters and warm summers. The average annual temperature is 44.3°F, and the average annual precipitation is 24.3 inches.
Economy
The economy of Sandpoint is largely based on tourism, with the city being a popular destination for outdoor recreation. The city is also home to a number of manufacturing and technology companies, as well as a number of retail stores.
The largest employers in the city are the Bonner County School District, the City of Sandpoint, and the Pend Oreille County Hospital. Other major employers include the Pend Oreille County Sheriff's Office, the Bonner County Sheriff's Office, and the Sandpoint Airport.
Demographics
As of the 2019 U.S. Census, the population of Sandpoint was 8,390. The racial makeup of the city was 94.2% White, 0.7% African American, 0.7% Native American, 0.7% Asian, 0.2% Pacific Islander, 1.2% from other races, and 2.1% from two or more races. Hispanic or Latino of any race were 4.2% of the population.
The median household income in the city was $45,945, and the median family income was $54,917. The per capita income in the city was $25,945. About 11.2% of the population was below the poverty line.
Common Questions
What is the Total Population of Sandpoint?
Total Population of Sandpoint is 8,899.
What is the Total Male Population of Sandpoint?
Total Male Population of Sandpoint is 4,367.
What is the Total Female Population of Sandpoint?
Total Female Population of Sandpoint is 4,532.
What is the Ratio of Males per 100 Females in Sandpoint?
There are 96.36 Males per 100 Females in Sandpoint.
What is the Ratio of Females per 100 Males in Sandpoint?
There are 103.78 Females per 100 Males in Sandpoint.
What is the Median Population Age in Sandpoint?
Median Population Age in Sandpoint is 42.4 Years.
What is the Average Family Size in Sandpoint
Average Family Size in Sandpoint is 3.0 People.
What is the Average Household Size in Sandpoint
Average Household Size in Sandpoint is 2.4 People.
What is Per Capita Income in Sandpoint?
Per Capita income in Sandpoint is $33,808.
What is the Median Family Income in Sandpoint?
Median Family Income in Sandpoint is $77,429.
What is the Median Household income in Sandpoint?
Median Household Income in Sandpoint is $60,208.
What is Income or Wage Gap in Sandpoint?
Income or Wage Gap in Sandpoint is 23.2%.
Women in Sandpoint earn 76.8 cents for every dollar earned by a man.
What is Inequality or Gini Index in Sandpoint?
Inequality or Gini Index in Sandpoint is 0.47.
How Large is the Labor Force in Sandpoint?
There are 4,329 People in the Labor Forcein in Sandpoint.
What is the Percentage of People in the Labor Force in Sandpoint?
60.9% of People are in the Labor Force in Sandpoint.
What is the Unemployment Rate in Sandpoint?
Unemployment Rate in Sandpoint is 2.7%.