St Charles, ID
St Charles Map
St Charles Overview
123
TOTAL POPULATION
87
MALE POPULATION
36
FEMALE POPULATION
241.67
MALES / 100 FEMALES
41.38
FEMALES / 100 MALES
58.2
MEDIAN AGE
3.0
AVG FAMILY SIZE
2.2
AVG HOUSEHOLD SIZE
$44,992
PER CAPITA INCOME
$99,545
AVG FAMILY INCOME
$86,500
AVG HOUSEHOLD INCOME
30.8%
WAGE / INCOME GAP [ % ]
69.2¢/ $1
WAGE / INCOME GAP [ $ ]
0.45
INEQUALITY / GINI INDEX
69
LABOR FORCE [ PEOPLE ]
56.1%
PERCENT IN LABOR FORCE
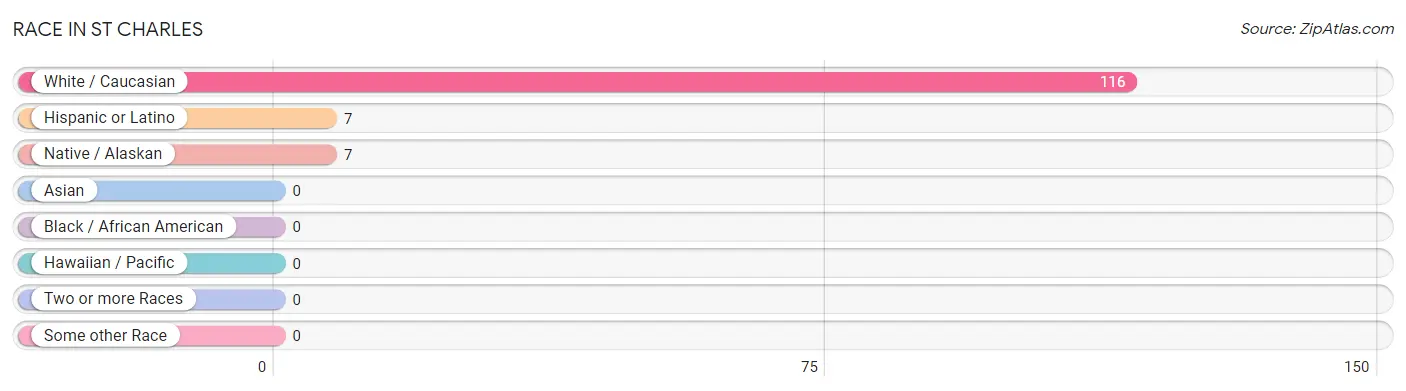
Race in St Charles
The most populous races in St Charles are White / Caucasian (116 | 94.3%), Hispanic or Latino (7 | 5.7%), and Native / Alaskan (7 | 5.7%).
| Race | # Population | % Population |
| Asian | 0 | 0.0% |
| Black / African American | 0 | 0.0% |
| Hawaiian / Pacific | 0 | 0.0% |
| Hispanic or Latino | 7 | 5.7% |
| Native / Alaskan | 7 | 5.7% |
| White / Caucasian | 116 | 94.3% |
| Two or more Races | 0 | 0.0% |
| Some other Race | 0 | 0.0% |
| Total | 123 | 100.0% |
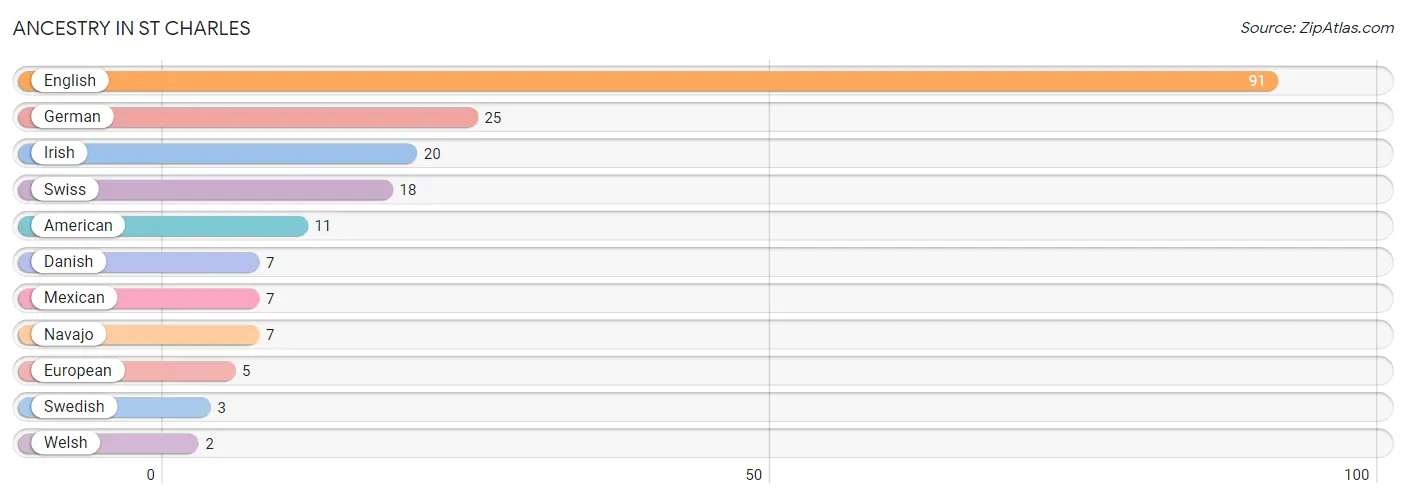
Ancestry in St Charles
The most populous ancestries reported in St Charles are English (91 | 74.0%), German (25 | 20.3%), Irish (20 | 16.3%), Swiss (18 | 14.6%), and American (11 | 8.9%), together accounting for 134.1% of all St Charles residents.
| Ancestry | # Population | % Population |
| American | 11 | 8.9% |
| Danish | 7 | 5.7% |
| English | 91 | 74.0% |
| European | 5 | 4.1% |
| German | 25 | 20.3% |
| Irish | 20 | 16.3% |
| Mexican | 7 | 5.7% |
| Navajo | 7 | 5.7% |
| Swedish | 3 | 2.4% |
| Swiss | 18 | 14.6% |
| Welsh | 2 | 1.6% | View All 11 Rows |
Immigrants in St Charles

| Immigration Origin | # Population | % Population | View All 0 Rows |
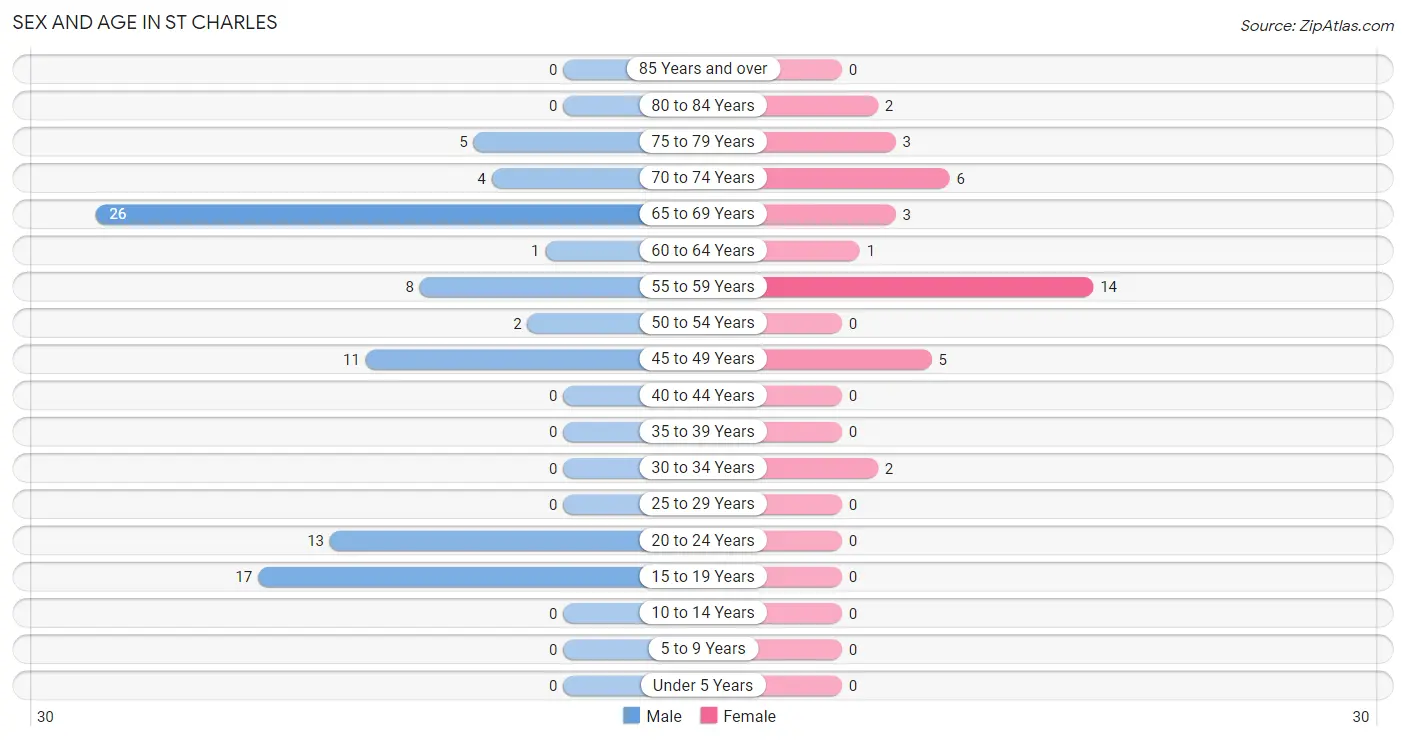
Sex and Age in St Charles
Sex and Age in St Charles
The most populous age groups in St Charles are 65 to 69 Years (26 | 29.9%) for men and 55 to 59 Years (14 | 38.9%) for women.
| Age Bracket | Male | Female |
| Under 5 Years | 0 (0.0%) | 0 (0.0%) |
| 5 to 9 Years | 0 (0.0%) | 0 (0.0%) |
| 10 to 14 Years | 0 (0.0%) | 0 (0.0%) |
| 15 to 19 Years | 17 (19.5%) | 0 (0.0%) |
| 20 to 24 Years | 13 (14.9%) | 0 (0.0%) |
| 25 to 29 Years | 0 (0.0%) | 0 (0.0%) |
| 30 to 34 Years | 0 (0.0%) | 2 (5.6%) |
| 35 to 39 Years | 0 (0.0%) | 0 (0.0%) |
| 40 to 44 Years | 0 (0.0%) | 0 (0.0%) |
| 45 to 49 Years | 11 (12.6%) | 5 (13.9%) |
| 50 to 54 Years | 2 (2.3%) | 0 (0.0%) |
| 55 to 59 Years | 8 (9.2%) | 14 (38.9%) |
| 60 to 64 Years | 1 (1.1%) | 1 (2.8%) |
| 65 to 69 Years | 26 (29.9%) | 3 (8.3%) |
| 70 to 74 Years | 4 (4.6%) | 6 (16.7%) |
| 75 to 79 Years | 5 (5.8%) | 3 (8.3%) |
| 80 to 84 Years | 0 (0.0%) | 2 (5.6%) |
| 85 Years and over | 0 (0.0%) | 0 (0.0%) |
| Total | 87 (100.0%) | 36 (100.0%) |
Families and Households in St Charles
Median Family Size in St Charles
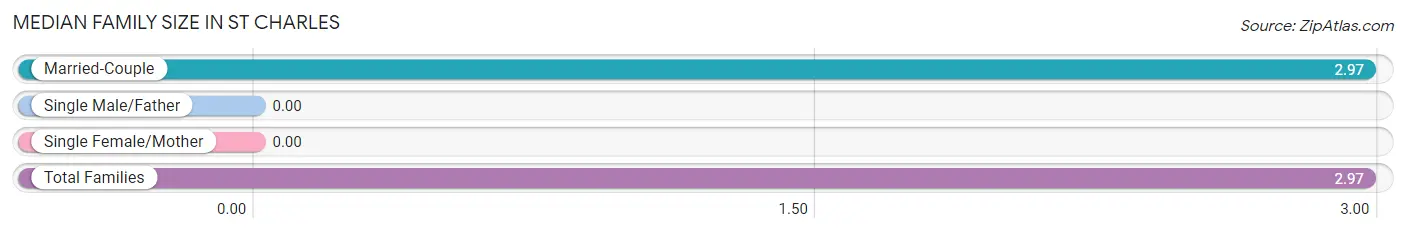
| Family Type | # Families | Family Size |
| Married-Couple | 34 (100.0%) | 2.97 |
| Single Male/Father | 0 (0.0%) | - |
| Single Female/Mother | 0 (0.0%) | - |
| Total Families | 34 (100.0%) | 2.97 |
Median Household Size in St Charles
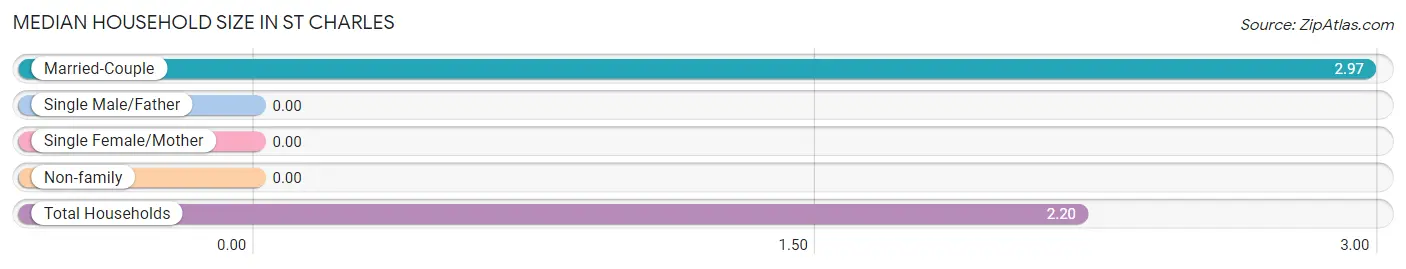
| Household Type | # Households | Household Size |
| Married-Couple | 34 (60.7%) | 2.97 |
| Single Male/Father | 0 (0.0%) | - |
| Single Female/Mother | 0 (0.0%) | - |
| Non-family | 22 (39.3%) | - |
| Total Households | 56 (100.0%) | 2.20 |
Household Size by Marriage Status in St Charles
Out of a total of 56 households in St Charles, 34 (60.7%) are family households, while 22 (39.3%) are nonfamily households. The most numerous type of family households are 2-person households, comprising 18, and the most common type of nonfamily households are 1-person households, comprising 22.
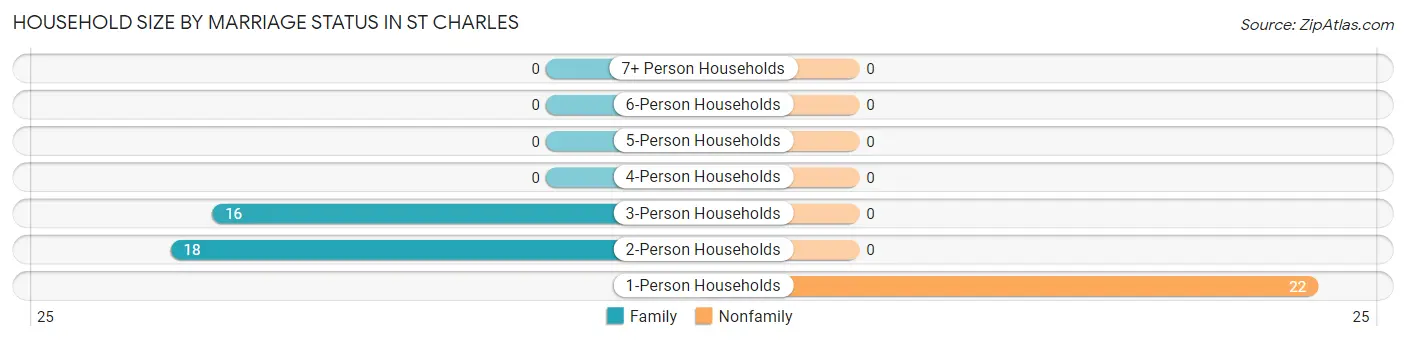
| Household Size | Family Households | Nonfamily Households |
| 1-Person Households | - | 22 (39.3%) |
| 2-Person Households | 18 (32.1%) | 0 (0.0%) |
| 3-Person Households | 16 (28.6%) | 0 (0.0%) |
| 4-Person Households | 0 (0.0%) | 0 (0.0%) |
| 5-Person Households | 0 (0.0%) | 0 (0.0%) |
| 6-Person Households | 0 (0.0%) | 0 (0.0%) |
| 7+ Person Households | 0 (0.0%) | 0 (0.0%) |
| Total | 34 (60.7%) | 22 (39.3%) |
Female Fertility in St Charles
Fertility by Age in St Charles
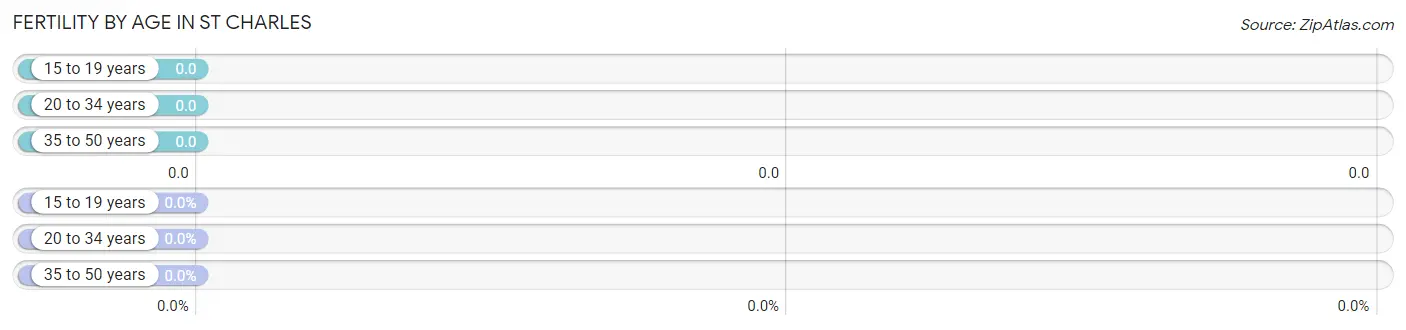
| Age Bracket | Women with Births | Births / 1,000 Women |
| 15 to 19 years | 0 (0.0%) | 0.0 |
| 20 to 34 years | 0 (0.0%) | 0.0 |
| 35 to 50 years | 0 (0.0%) | 0.0 |
| Total | 0 (0.0%) | 0.0 |
Fertility by Age by Marriage Status in St Charles
| Age Bracket | Married | Unmarried |
| 15 to 19 years | 0 (0.0%) | 0 (0.0%) |
| 20 to 34 years | 0 (0.0%) | 0 (0.0%) |
| 35 to 50 years | 0 (0.0%) | 0 (0.0%) |
| Total | 0 (0.0%) | 0 (0.0%) |
Fertility by Education in St Charles
| Educational Attainment | Women with Births | Births / 1,000 Women |
| Less than High School | 0 (0.0%) | 0.0 |
| High School Diploma | 0 (0.0%) | 0.0 |
| College or Associate's Degree | 0 (0.0%) | 0.0 |
| Bachelor's Degree | 0 (0.0%) | 0.0 |
| Graduate Degree | 0 (0.0%) | 0.0 |
| Total | 0 (0.0%) | 0.0 |
Fertility by Education by Marriage Status in St Charles
| Educational Attainment | Married | Unmarried |
| Less than High School | 0 (0.0%) | 0 (0.0%) |
| High School Diploma | 0 (0.0%) | 0 (0.0%) |
| College or Associate's Degree | 0 (0.0%) | 0 (0.0%) |
| Bachelor's Degree | 0 (0.0%) | 0 (0.0%) |
| Graduate Degree | 0 (0.0%) | 0 (0.0%) |
| Total | 0 (0.0%) | 0 (0.0%) |
Income in St Charles
Income Overview in St Charles
Per Capita Income in St Charles is $44,992, while median incomes of families and households are $99,545 and $86,500 respectively.
| Characteristic | Number | Measure |
| Per Capita Income | 123 | $44,992 |
| Median Family Income | 34 | $99,545 |
| Mean Family Income | 34 | $141,156 |
| Median Household Income | 56 | $86,500 |
| Mean Household Income | 56 | $96,614 |
| Income Deficit | 34 | $0 |
| Wage / Income Gap (%) | 123 | 30.83% |
| Wage / Income Gap ($) | 123 | 69.17¢ per $1 |
| Gini / Inequality Index | 123 | 0.45 |
Earnings by Sex in St Charles
Average Earnings in St Charles are $27,000, $28,462 for men and $19,688 for women, a difference of 30.8%.
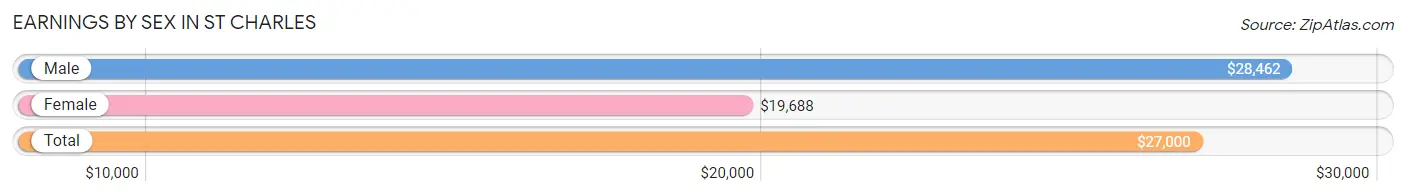
| Sex | Number | Average Earnings |
| Male | 54 (77.1%) | $28,462 |
| Female | 16 (22.9%) | $19,688 |
| Total | 70 (100.0%) | $27,000 |
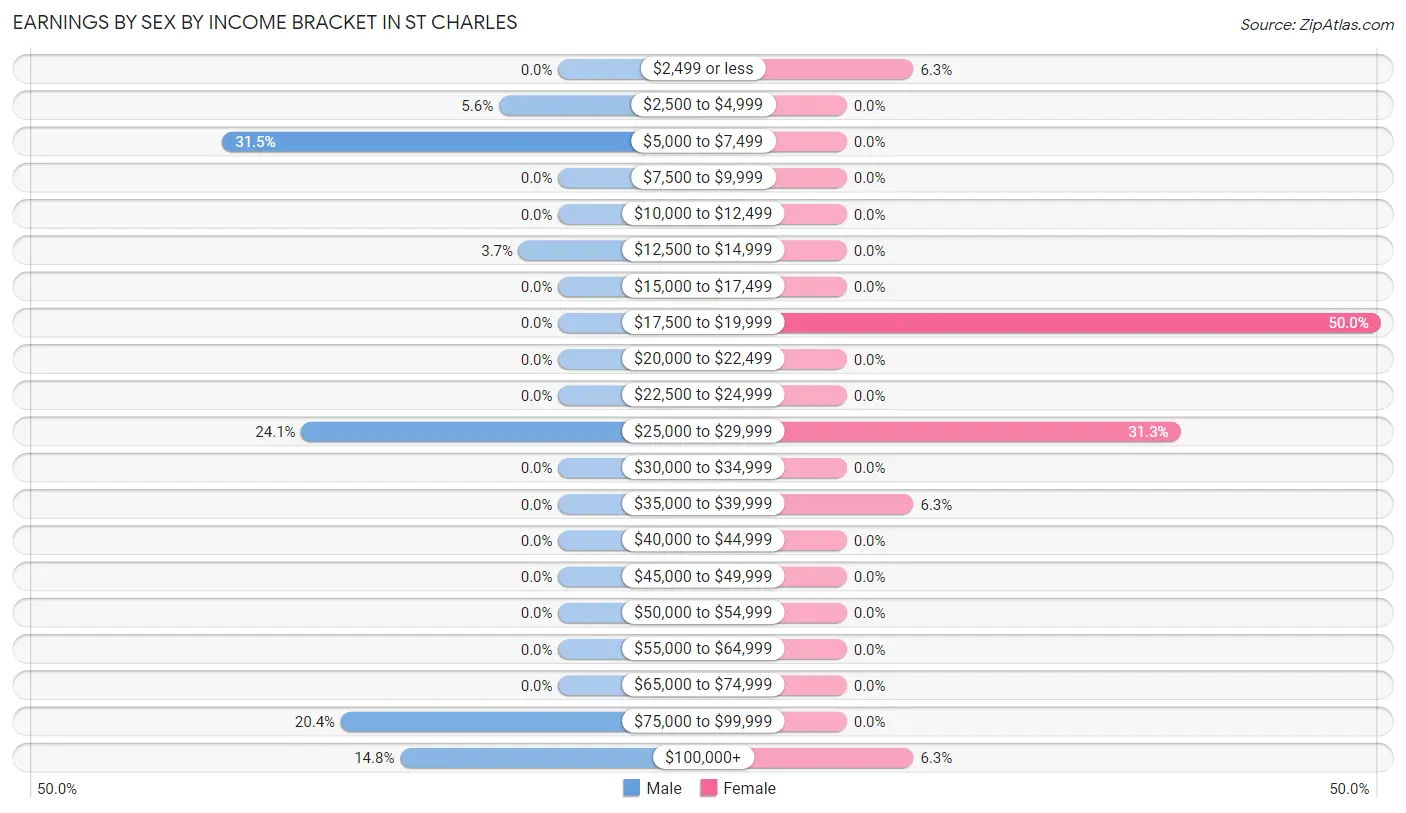
Earnings by Sex by Income Bracket in St Charles
The most common earnings brackets in St Charles are $5,000 to $7,499 for men (17 | 31.5%) and $17,500 to $19,999 for women (8 | 50.0%).
| Income | Male | Female |
| $2,499 or less | 0 (0.0%) | 1 (6.2%) |
| $2,500 to $4,999 | 3 (5.6%) | 0 (0.0%) |
| $5,000 to $7,499 | 17 (31.5%) | 0 (0.0%) |
| $7,500 to $9,999 | 0 (0.0%) | 0 (0.0%) |
| $10,000 to $12,499 | 0 (0.0%) | 0 (0.0%) |
| $12,500 to $14,999 | 2 (3.7%) | 0 (0.0%) |
| $15,000 to $17,499 | 0 (0.0%) | 0 (0.0%) |
| $17,500 to $19,999 | 0 (0.0%) | 8 (50.0%) |
| $20,000 to $22,499 | 0 (0.0%) | 0 (0.0%) |
| $22,500 to $24,999 | 0 (0.0%) | 0 (0.0%) |
| $25,000 to $29,999 | 13 (24.1%) | 5 (31.2%) |
| $30,000 to $34,999 | 0 (0.0%) | 0 (0.0%) |
| $35,000 to $39,999 | 0 (0.0%) | 1 (6.2%) |
| $40,000 to $44,999 | 0 (0.0%) | 0 (0.0%) |
| $45,000 to $49,999 | 0 (0.0%) | 0 (0.0%) |
| $50,000 to $54,999 | 0 (0.0%) | 0 (0.0%) |
| $55,000 to $64,999 | 0 (0.0%) | 0 (0.0%) |
| $65,000 to $74,999 | 0 (0.0%) | 0 (0.0%) |
| $75,000 to $99,999 | 11 (20.4%) | 0 (0.0%) |
| $100,000+ | 8 (14.8%) | 1 (6.2%) |
| Total | 54 (100.0%) | 16 (100.0%) |
Earnings by Sex by Educational Attainment in St Charles
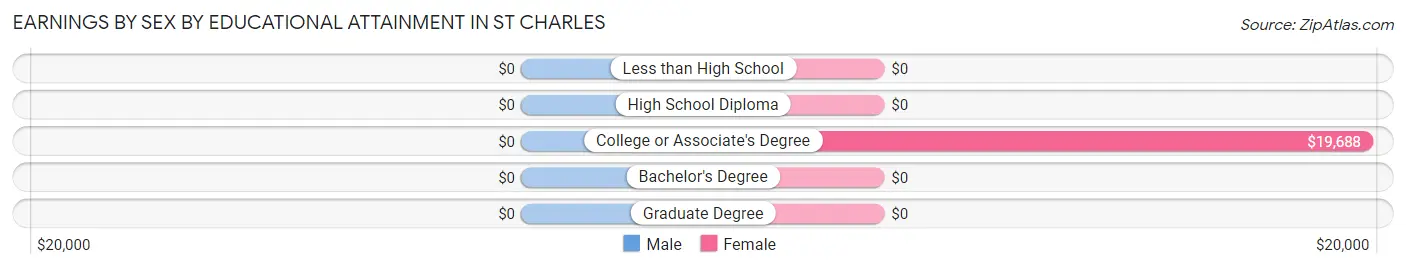
| Educational Attainment | Male Income | Female Income |
| Less than High School | - | - |
| High School Diploma | - | - |
| College or Associate's Degree | - | - |
| Bachelor's Degree | - | - |
| Graduate Degree | - | - |
| Total | - | - |
Family Income in St Charles
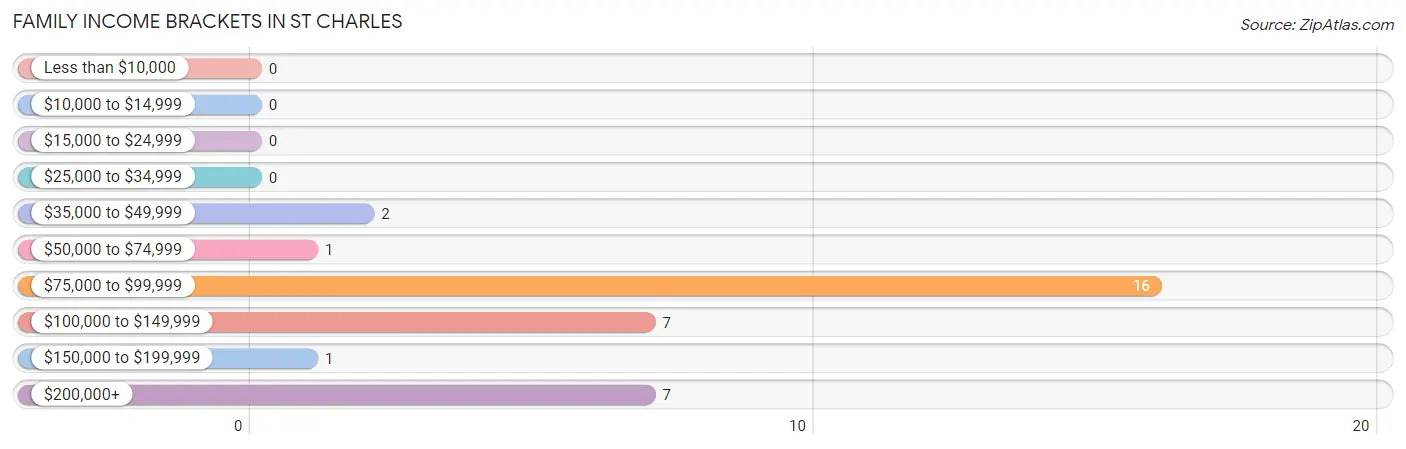
Family Income Brackets in St Charles
According to the St Charles family income data, there are 16 families falling into the $75,000 to $99,999 income range, which is the most common income bracket and makes up 47.1% of all families.
| Income Bracket | # Families | % Families |
| Less than $10,000 | 0 | 0.0% |
| $10,000 to $14,999 | 0 | 0.0% |
| $15,000 to $24,999 | 0 | 0.0% |
| $25,000 to $34,999 | 0 | 0.0% |
| $35,000 to $49,999 | 2 | 5.9% |
| $50,000 to $74,999 | 1 | 2.9% |
| $75,000 to $99,999 | 16 | 47.1% |
| $100,000 to $149,999 | 7 | 20.6% |
| $150,000 to $199,999 | 1 | 2.9% |
| $200,000+ | 7 | 20.6% |
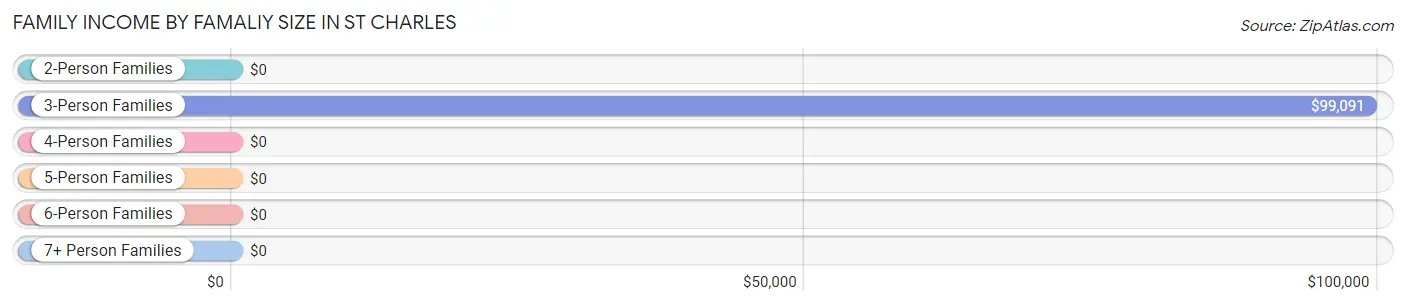
Family Income by Famaliy Size in St Charles
3-person families (16 | 47.1%) account for the highest median family income in St Charles with $99,091 per family, while 3-person families (16 | 47.1%) have the highest median income of $33,030 per family member.
| Income Bracket | # Families | Median Income |
| 2-Person Families | 18 (52.9%) | $0 |
| 3-Person Families | 16 (47.1%) | $99,091 |
| 4-Person Families | 0 (0.0%) | $0 |
| 5-Person Families | 0 (0.0%) | $0 |
| 6-Person Families | 0 (0.0%) | $0 |
| 7+ Person Families | 0 (0.0%) | $0 |
| Total | 34 (100.0%) | $99,545 |
Family Income by Number of Earners in St Charles
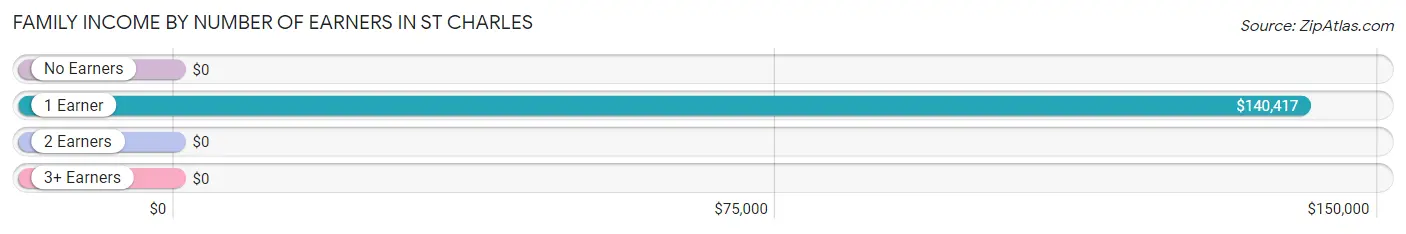
| Number of Earners | # Families | Median Income |
| No Earners | 4 (11.8%) | $0 |
| 1 Earner | 11 (32.4%) | $140,417 |
| 2 Earners | 8 (23.5%) | $0 |
| 3+ Earners | 11 (32.4%) | $0 |
| Total | 34 (100.0%) | $99,545 |
Household Income in St Charles
Household Income Brackets in St Charles
With 18 households falling in the category, the $25,000 to $34,999 income range is the most frequent in St Charles, accounting for 32.1% of all households.
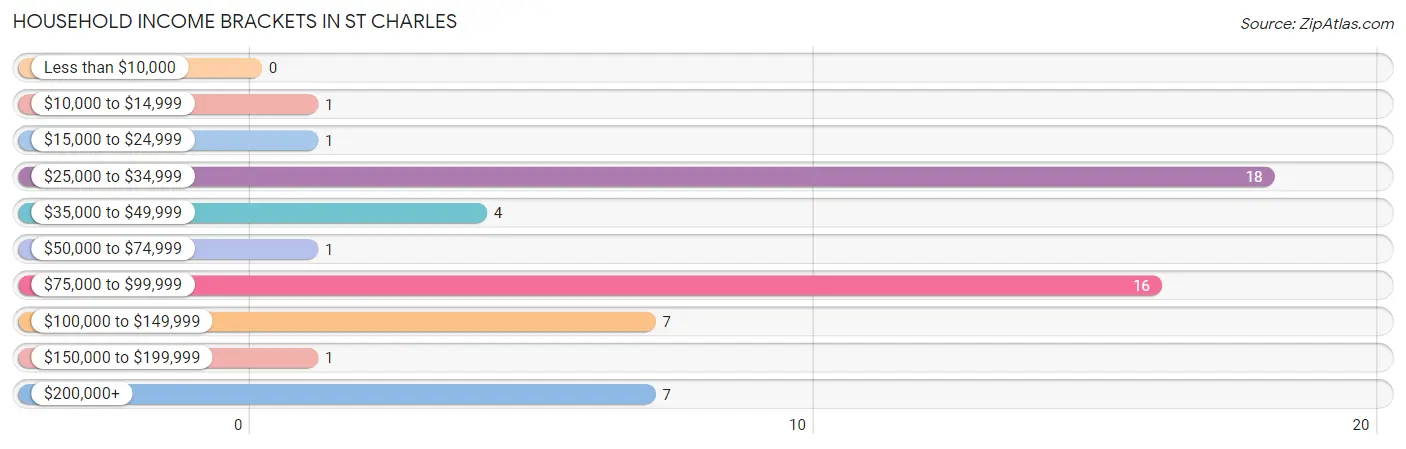
| Income Bracket | # Households | % Households |
| Less than $10,000 | 0 | 0.0% |
| $10,000 to $14,999 | 1 | 1.8% |
| $15,000 to $24,999 | 1 | 1.8% |
| $25,000 to $34,999 | 18 | 32.1% |
| $35,000 to $49,999 | 4 | 7.1% |
| $50,000 to $74,999 | 1 | 1.8% |
| $75,000 to $99,999 | 16 | 28.6% |
| $100,000 to $149,999 | 7 | 12.5% |
| $150,000 to $199,999 | 1 | 1.8% |
| $200,000+ | 7 | 12.5% |
Household Income by Householder Age in St Charles
| Income Bracket | # Households | Median Income |
| 15 to 24 Years | 0 (0.0%) | $0 |
| 25 to 44 Years | 0 (0.0%) | $0 |
| 45 to 64 Years | 19 (33.9%) | $0 |
| 65+ Years | 37 (66.1%) | $0 |
| Total | 56 (100.0%) | $86,500 |
Poverty in St Charles
Income Below Poverty by Sex and Age in St Charles
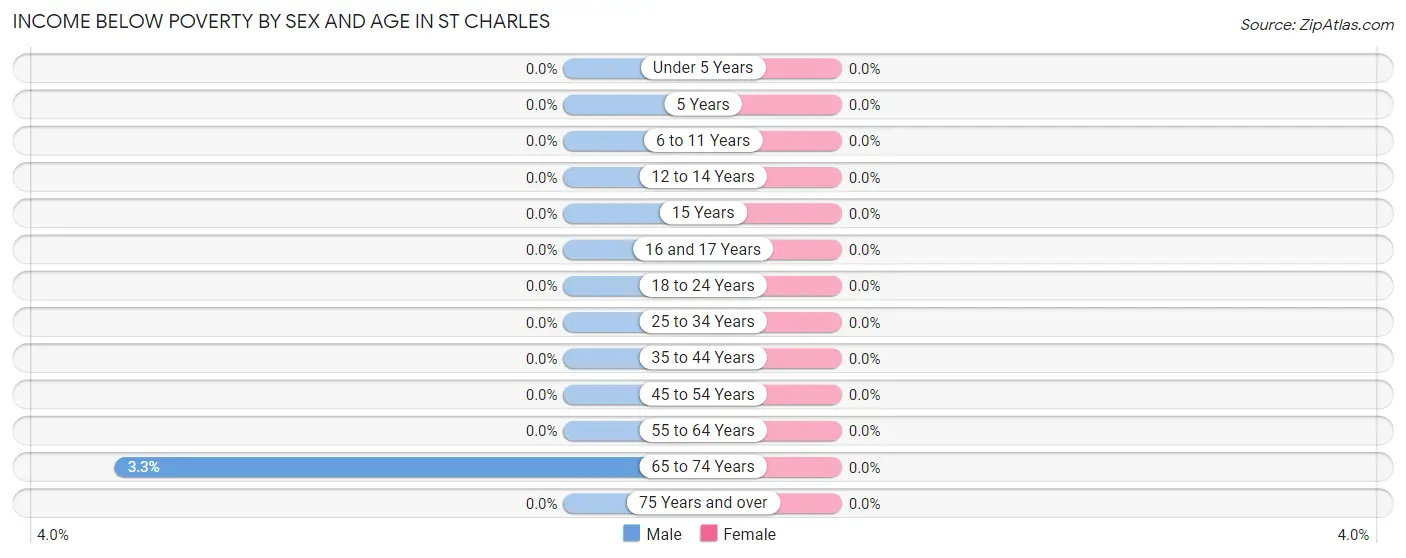
| Age Bracket | Male | Female |
| Under 5 Years | 0 (0.0%) | 0 (0.0%) |
| 5 Years | 0 (0.0%) | 0 (0.0%) |
| 6 to 11 Years | 0 (0.0%) | 0 (0.0%) |
| 12 to 14 Years | 0 (0.0%) | 0 (0.0%) |
| 15 Years | 0 (0.0%) | 0 (0.0%) |
| 16 and 17 Years | 0 (0.0%) | 0 (0.0%) |
| 18 to 24 Years | 0 (0.0%) | 0 (0.0%) |
| 25 to 34 Years | 0 (0.0%) | 0 (0.0%) |
| 35 to 44 Years | 0 (0.0%) | 0 (0.0%) |
| 45 to 54 Years | 0 (0.0%) | 0 (0.0%) |
| 55 to 64 Years | 0 (0.0%) | 0 (0.0%) |
| 65 to 74 Years | 1 (3.3%) | 0 (0.0%) |
| 75 Years and over | 0 (0.0%) | 0 (0.0%) |
| Total | 1 (1.1%) | 0 (0.0%) |
Income Above Poverty by Sex and Age in St Charles
According to the poverty statistics in St Charles, males aged 16 and 17 years and females aged 25 to 34 years are the age groups that are most secure financially, with 100.0% of males and 100.0% of females in these age groups living above the poverty line.
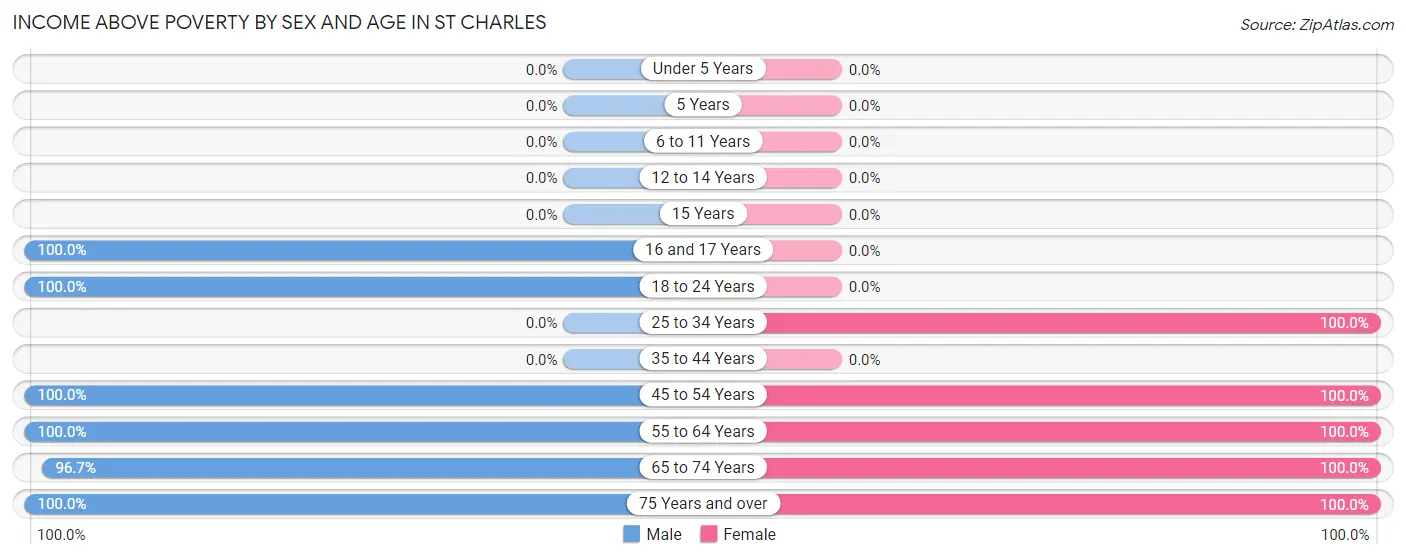
| Age Bracket | Male | Female |
| Under 5 Years | 0 (0.0%) | 0 (0.0%) |
| 5 Years | 0 (0.0%) | 0 (0.0%) |
| 6 to 11 Years | 0 (0.0%) | 0 (0.0%) |
| 12 to 14 Years | 0 (0.0%) | 0 (0.0%) |
| 15 Years | 0 (0.0%) | 0 (0.0%) |
| 16 and 17 Years | 17 (100.0%) | 0 (0.0%) |
| 18 to 24 Years | 13 (100.0%) | 0 (0.0%) |
| 25 to 34 Years | 0 (0.0%) | 2 (100.0%) |
| 35 to 44 Years | 0 (0.0%) | 0 (0.0%) |
| 45 to 54 Years | 13 (100.0%) | 5 (100.0%) |
| 55 to 64 Years | 9 (100.0%) | 15 (100.0%) |
| 65 to 74 Years | 29 (96.7%) | 9 (100.0%) |
| 75 Years and over | 5 (100.0%) | 5 (100.0%) |
| Total | 86 (98.9%) | 36 (100.0%) |
Income Below Poverty Among Married-Couple Families in St Charles
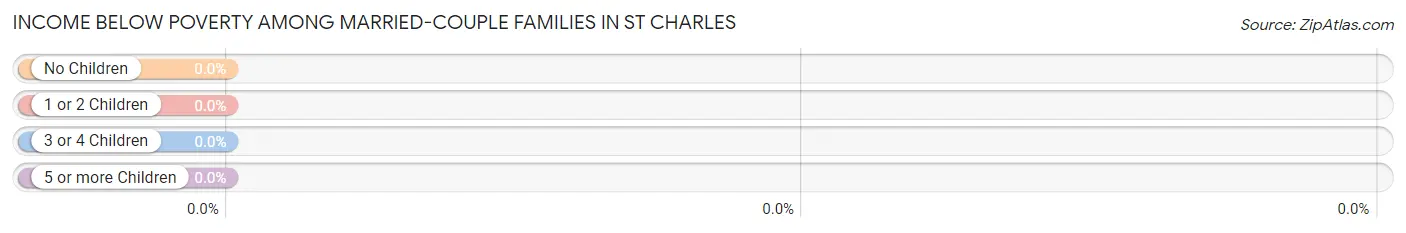
| Children | Above Poverty | Below Poverty |
| No Children | 23 (100.0%) | 0 (0.0%) |
| 1 or 2 Children | 11 (100.0%) | 0 (0.0%) |
| 3 or 4 Children | 0 (0.0%) | 0 (0.0%) |
| 5 or more Children | 0 (0.0%) | 0 (0.0%) |
| Total | 34 (100.0%) | 0 (0.0%) |
Income Below Poverty Among Single-Parent Households in St Charles
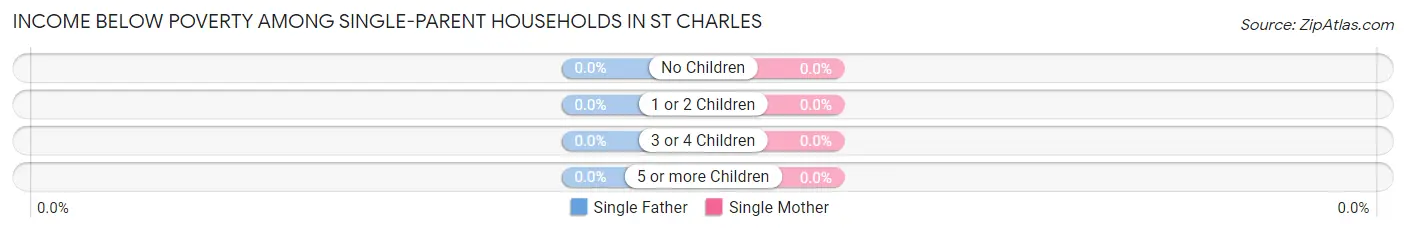
| Children | Single Father | Single Mother |
| No Children | 0 (0.0%) | 0 (0.0%) |
| 1 or 2 Children | 0 (0.0%) | 0 (0.0%) |
| 3 or 4 Children | 0 (0.0%) | 0 (0.0%) |
| 5 or more Children | 0 (0.0%) | 0 (0.0%) |
| Total | 0 (0.0%) | 0 (0.0%) |
Income Below Poverty Among Married-Couple vs Single-Parent Households in St Charles
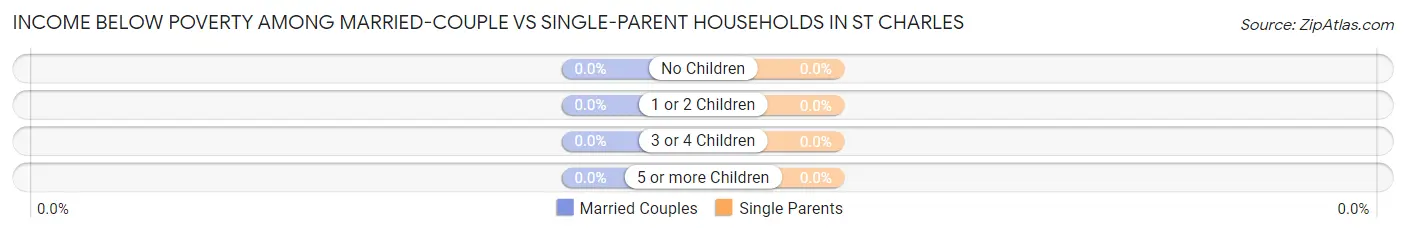
| Children | Married-Couple Families | Single-Parent Households |
| No Children | 0 (0.0%) | 0 (0.0%) |
| 1 or 2 Children | 0 (0.0%) | 0 (0.0%) |
| 3 or 4 Children | 0 (0.0%) | 0 (0.0%) |
| 5 or more Children | 0 (0.0%) | 0 (0.0%) |
| Total | 0 (0.0%) | 0 (0.0%) |
Employment Characteristics in St Charles
Employment by Class of Employer in St Charles
Among the 69 employed individuals in St Charles, private company employees (50 | 72.5%), state government employees (11 | 15.9%), and local government employees (7 | 10.1%) make up the most common classes of employment.
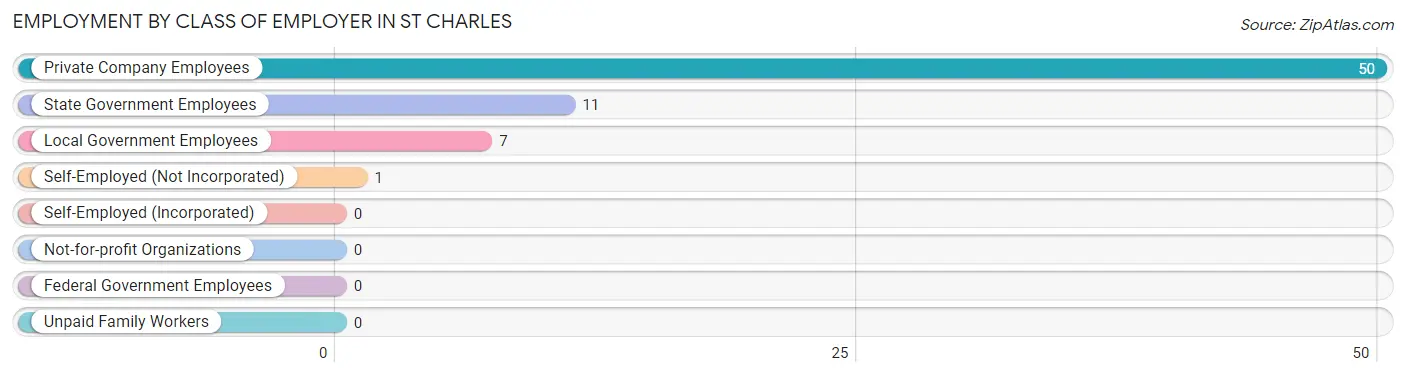
| Employer Class | # Employees | % Employees |
| Private Company Employees | 50 | 72.5% |
| Self-Employed (Incorporated) | 0 | 0.0% |
| Self-Employed (Not Incorporated) | 1 | 1.5% |
| Not-for-profit Organizations | 0 | 0.0% |
| Local Government Employees | 7 | 10.1% |
| State Government Employees | 11 | 15.9% |
| Federal Government Employees | 0 | 0.0% |
| Unpaid Family Workers | 0 | 0.0% |
| Total | 69 | 100.0% |
Employment Status by Age in St Charles
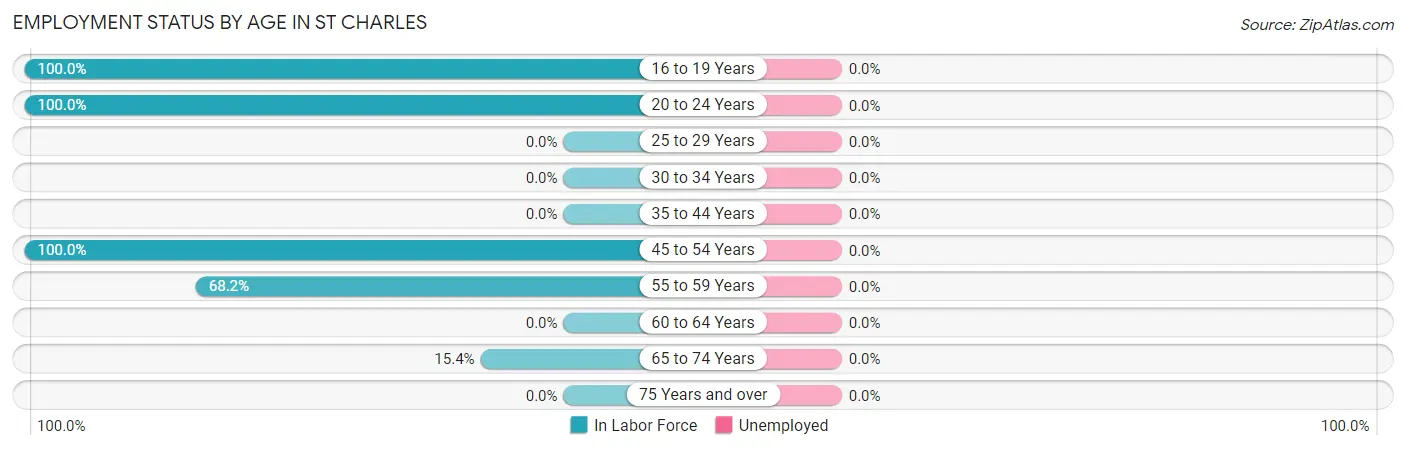
| Age Bracket | In Labor Force | Unemployed |
| 16 to 19 Years | 17 (100.0%) | 0 (0.0%) |
| 20 to 24 Years | 13 (100.0%) | 0 (0.0%) |
| 25 to 29 Years | 0 (0.0%) | 0 (0.0%) |
| 30 to 34 Years | 0 (0.0%) | 0 (0.0%) |
| 35 to 44 Years | 0 (0.0%) | 0 (0.0%) |
| 45 to 54 Years | 18 (100.0%) | 0 (0.0%) |
| 55 to 59 Years | 15 (68.2%) | 0 (0.0%) |
| 60 to 64 Years | 0 (0.0%) | 0 (0.0%) |
| 65 to 74 Years | 6 (15.4%) | 0 (0.0%) |
| 75 Years and over | 0 (0.0%) | 0 (0.0%) |
| Total | 69 (56.1%) | 0 (0.0%) |
Employment Status by Educational Attainment in St Charles
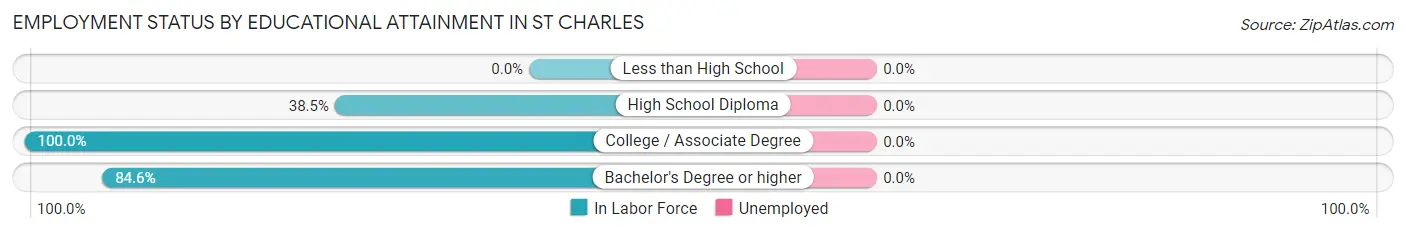
| Educational Attainment | In Labor Force | Unemployed |
| Less than High School | 0 (0.0%) | 0 (0.0%) |
| High School Diploma | 5 (38.5%) | 0 (0.0%) |
| College / Associate Degree | 17 (100.0%) | 0 (0.0%) |
| Bachelor's Degree or higher | 11 (84.6%) | 0 (0.0%) |
| Total | 33 (75.0%) | 0 (0.0%) |
Employment Occupations by Sex in St Charles
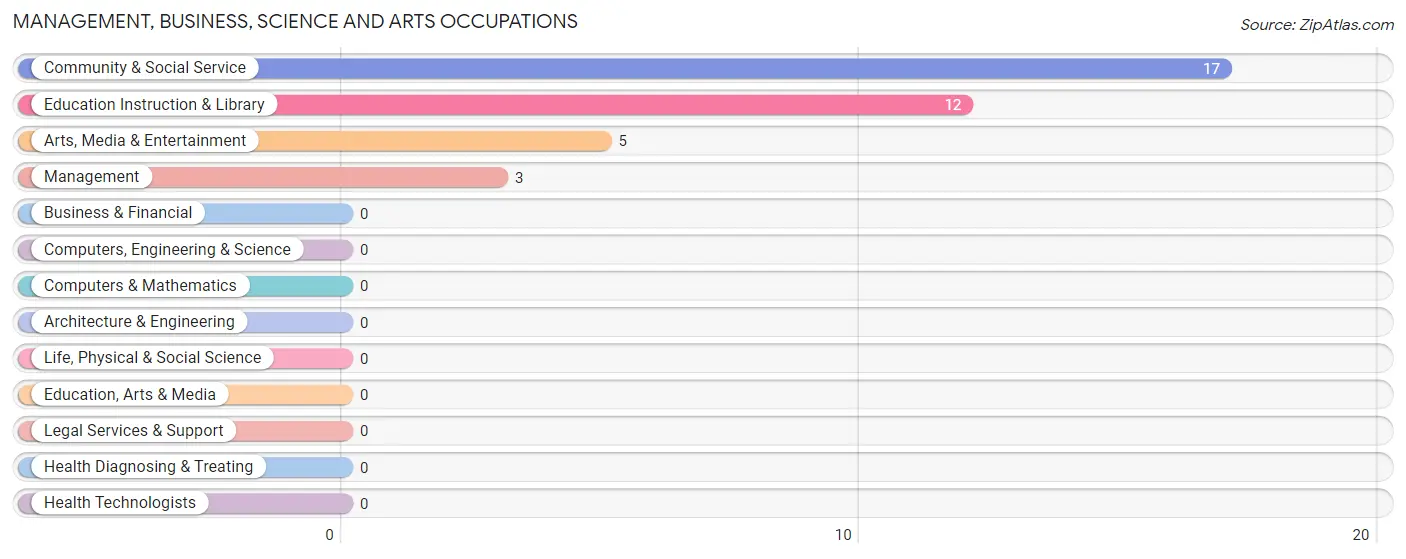
Management, Business, Science and Arts Occupations
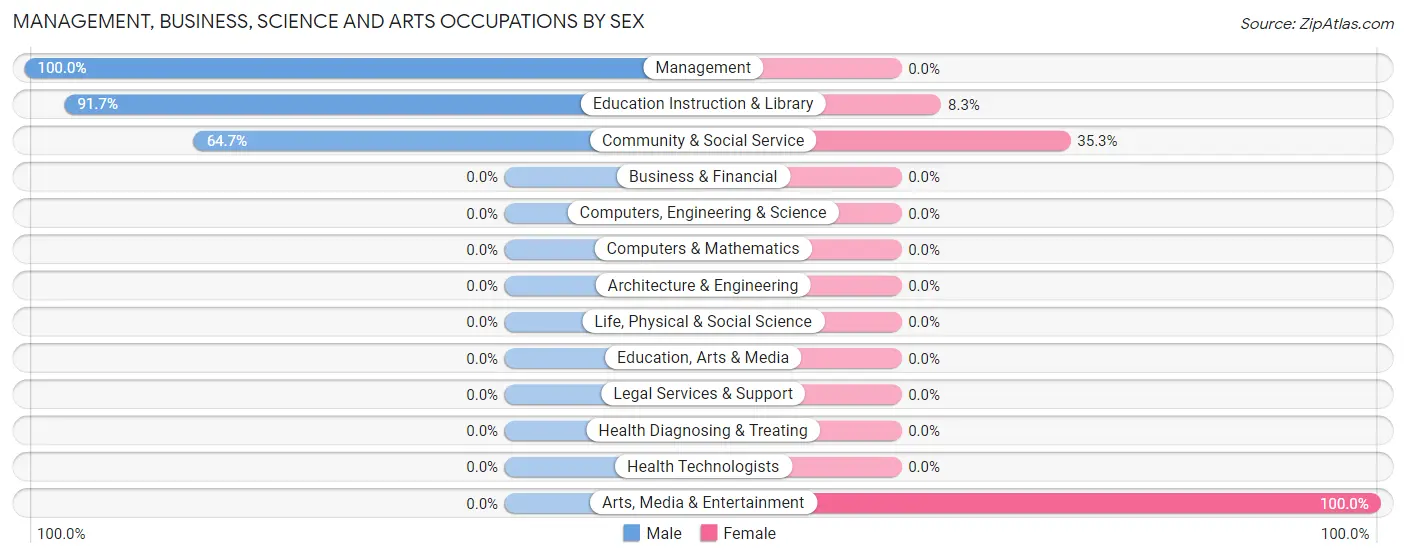
The most common Management, Business, Science and Arts occupations in St Charles are Community & Social Service (17 | 24.6%), Education Instruction & Library (12 | 17.4%), Arts, Media & Entertainment (5 | 7.2%), and Management (3 | 4.3%).
Management, Business, Science and Arts Occupations by Sex
Within the Management, Business, Science and Arts occupations in St Charles, the most male-oriented occupations are Management (100.0%), Education Instruction & Library (91.7%), and Community & Social Service (64.7%), while the most female-oriented occupations are Arts, Media & Entertainment (100.0%), Community & Social Service (35.3%), and Education Instruction & Library (8.3%).
| Occupation | Male | Female |
| Management | 3 (100.0%) | 0 (0.0%) |
| Business & Financial | 0 (0.0%) | 0 (0.0%) |
| Computers, Engineering & Science | 0 (0.0%) | 0 (0.0%) |
| Computers & Mathematics | 0 (0.0%) | 0 (0.0%) |
| Architecture & Engineering | 0 (0.0%) | 0 (0.0%) |
| Life, Physical & Social Science | 0 (0.0%) | 0 (0.0%) |
| Community & Social Service | 11 (64.7%) | 6 (35.3%) |
| Education, Arts & Media | 0 (0.0%) | 0 (0.0%) |
| Legal Services & Support | 0 (0.0%) | 0 (0.0%) |
| Education Instruction & Library | 11 (91.7%) | 1 (8.3%) |
| Arts, Media & Entertainment | 0 (0.0%) | 5 (100.0%) |
| Health Diagnosing & Treating | 0 (0.0%) | 0 (0.0%) |
| Health Technologists | 0 (0.0%) | 0 (0.0%) |
| Total (Category) | 14 (70.0%) | 6 (30.0%) |
| Total (Overall) | 54 (78.3%) | 15 (21.7%) |
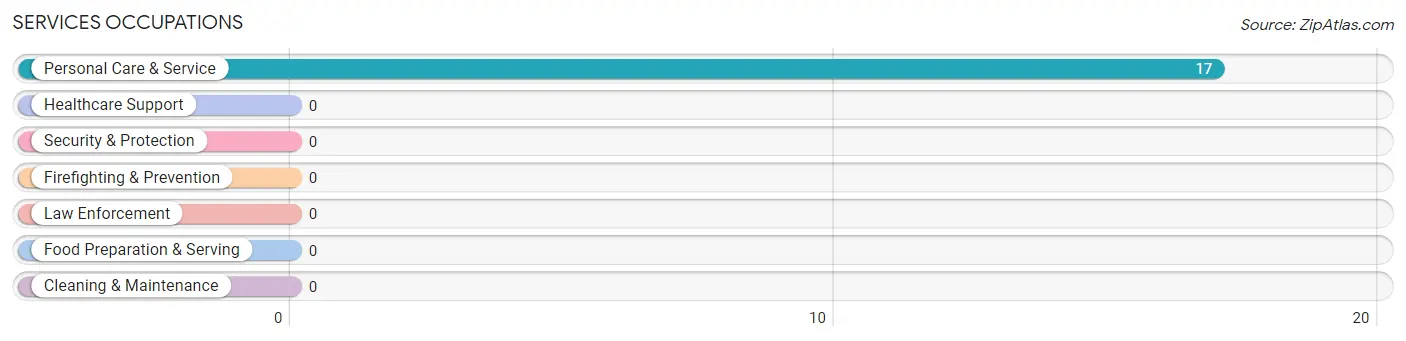
Services Occupations
The most common Services occupations in St Charles are , and Personal Care & Service (17 | 24.6%).
Services Occupations by Sex
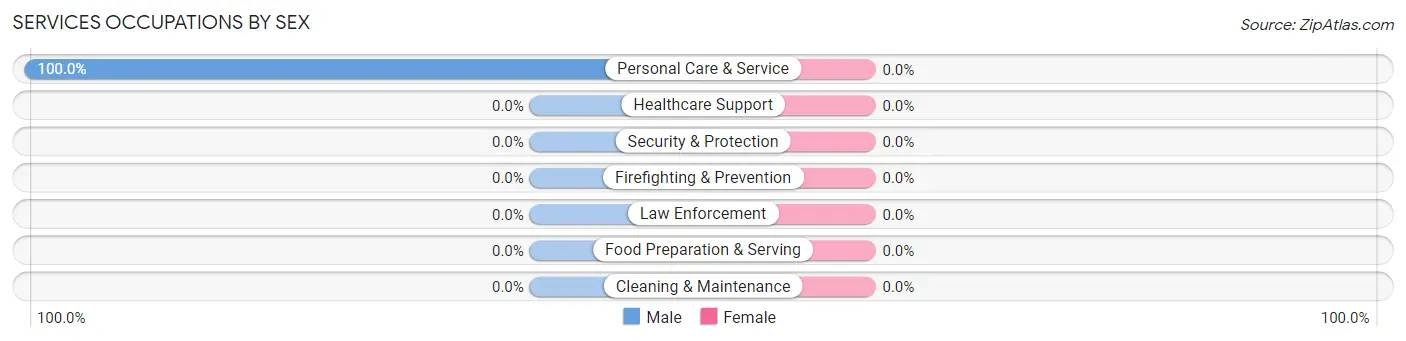
| Occupation | Male | Female |
| Healthcare Support | 0 (0.0%) | 0 (0.0%) |
| Security & Protection | 0 (0.0%) | 0 (0.0%) |
| Firefighting & Prevention | 0 (0.0%) | 0 (0.0%) |
| Law Enforcement | 0 (0.0%) | 0 (0.0%) |
| Food Preparation & Serving | 0 (0.0%) | 0 (0.0%) |
| Cleaning & Maintenance | 0 (0.0%) | 0 (0.0%) |
| Personal Care & Service | 17 (100.0%) | 0 (0.0%) |
| Total (Category) | 17 (100.0%) | 0 (0.0%) |
| Total (Overall) | 54 (78.3%) | 15 (21.7%) |
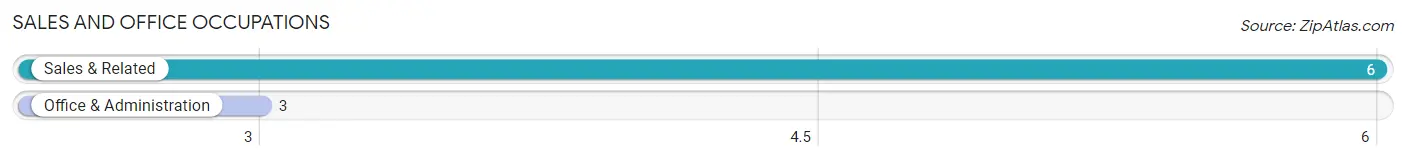
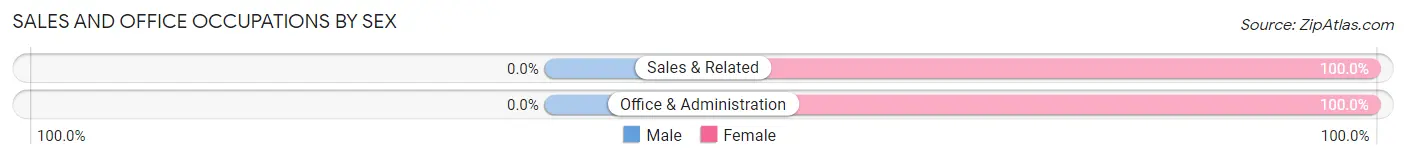
Sales and Office Occupations
The most common Sales and Office occupations in St Charles are Sales & Related (6 | 8.7%), and Office & Administration (3 | 4.3%).
Sales and Office Occupations by Sex
| Occupation | Male | Female |
| Sales & Related | 0 (0.0%) | 6 (100.0%) |
| Office & Administration | 0 (0.0%) | 3 (100.0%) |
| Total (Category) | 0 (0.0%) | 9 (100.0%) |
| Total (Overall) | 54 (78.3%) | 15 (21.7%) |
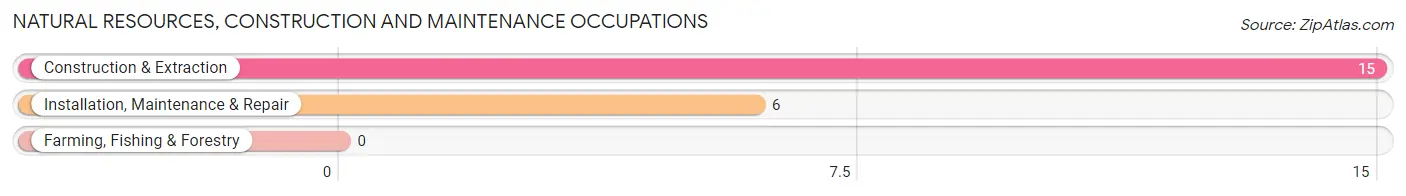
Natural Resources, Construction and Maintenance Occupations
The most common Natural Resources, Construction and Maintenance occupations in St Charles are Construction & Extraction (15 | 21.7%), and Installation, Maintenance & Repair (6 | 8.7%).
Natural Resources, Construction and Maintenance Occupations by Sex
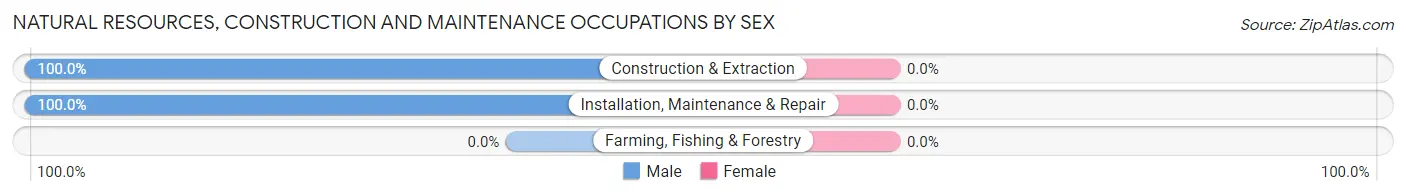
| Occupation | Male | Female |
| Farming, Fishing & Forestry | 0 (0.0%) | 0 (0.0%) |
| Construction & Extraction | 15 (100.0%) | 0 (0.0%) |
| Installation, Maintenance & Repair | 6 (100.0%) | 0 (0.0%) |
| Total (Category) | 21 (100.0%) | 0 (0.0%) |
| Total (Overall) | 54 (78.3%) | 15 (21.7%) |
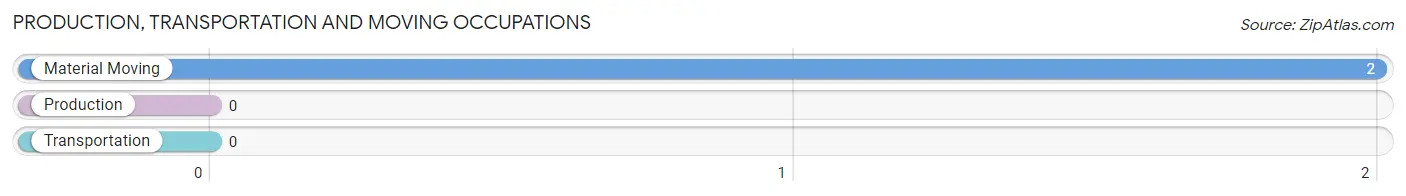
Production, Transportation and Moving Occupations
The most common Production, Transportation and Moving occupations in St Charles are , and Material Moving (2 | 2.9%).
Production, Transportation and Moving Occupations by Sex
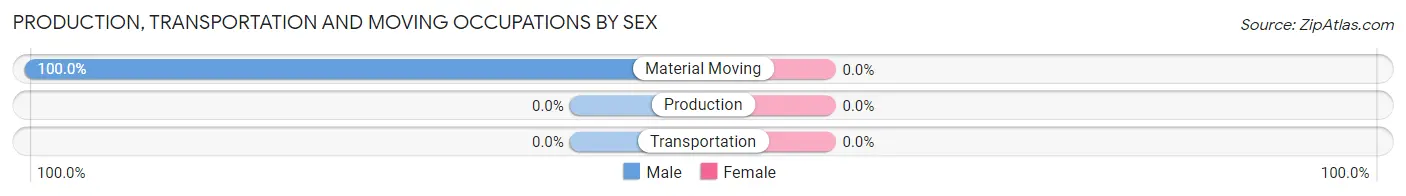
| Occupation | Male | Female |
| Production | 0 (0.0%) | 0 (0.0%) |
| Transportation | 0 (0.0%) | 0 (0.0%) |
| Material Moving | 2 (100.0%) | 0 (0.0%) |
| Total (Category) | 2 (100.0%) | 0 (0.0%) |
| Total (Overall) | 54 (78.3%) | 15 (21.7%) |
Employment Industries by Sex in St Charles
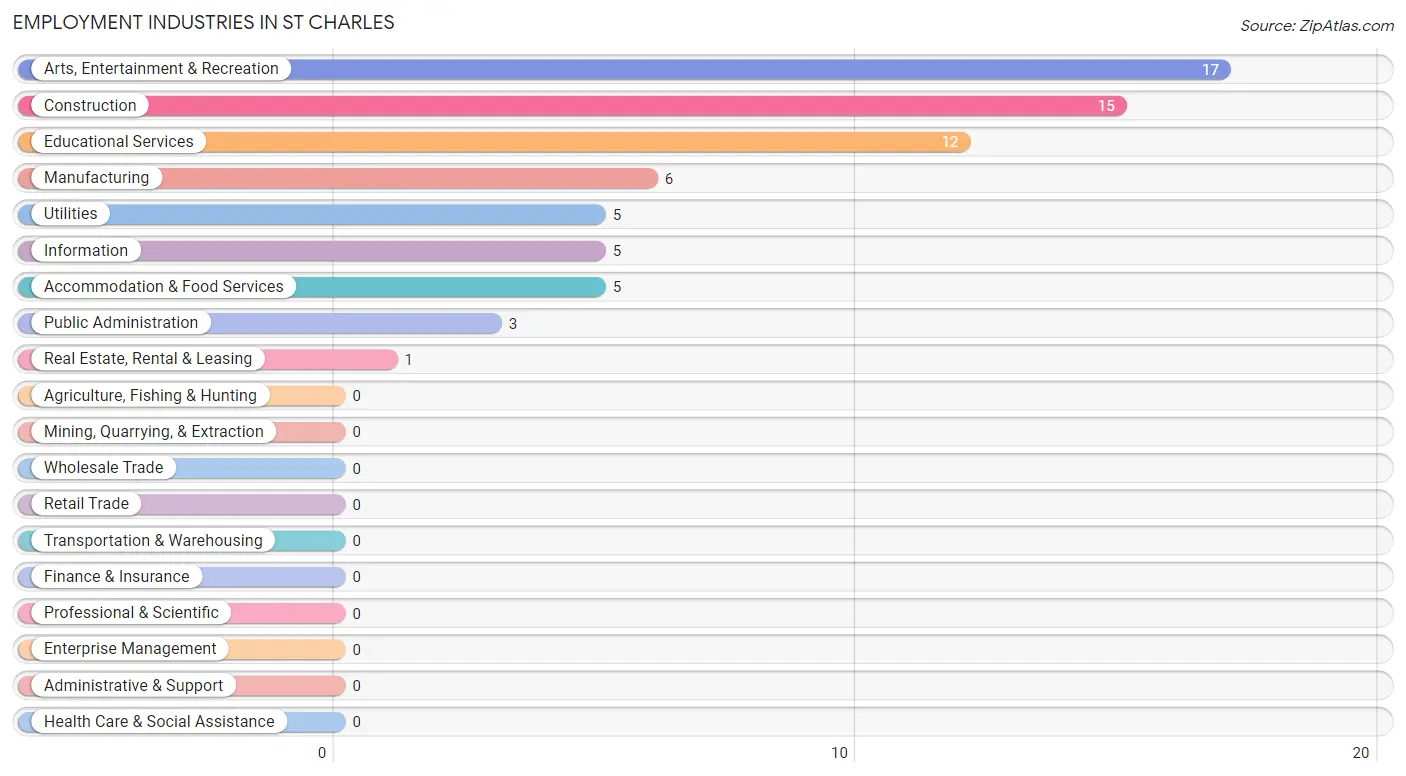
Employment Industries in St Charles
The major employment industries in St Charles include Arts, Entertainment & Recreation (17 | 24.6%), Construction (15 | 21.7%), Educational Services (12 | 17.4%), Manufacturing (6 | 8.7%), and Utilities (5 | 7.2%).
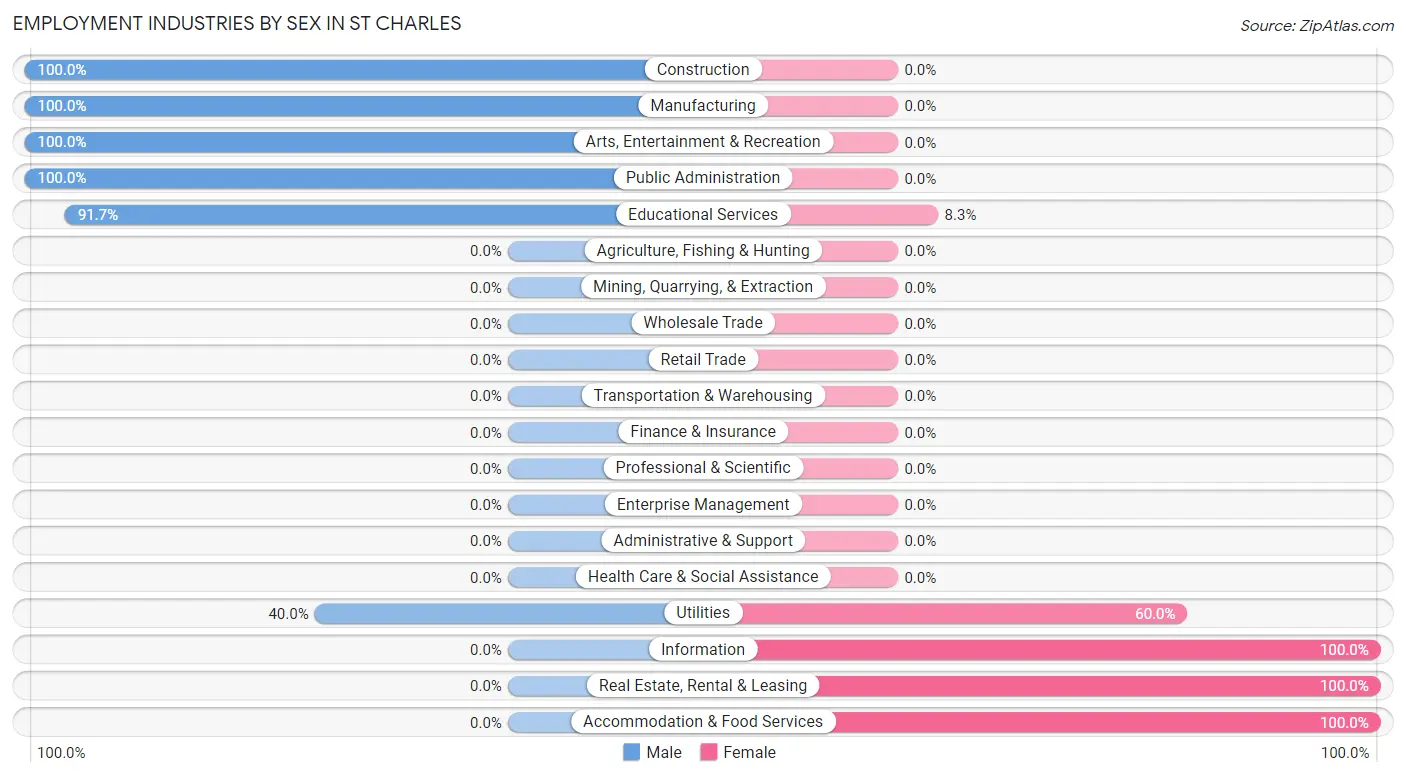
Employment Industries by Sex in St Charles
The St Charles industries that see more men than women are Construction (100.0%), Manufacturing (100.0%), and Arts, Entertainment & Recreation (100.0%), whereas the industries that tend to have a higher number of women are Information (100.0%), Real Estate, Rental & Leasing (100.0%), and Accommodation & Food Services (100.0%).
| Industry | Male | Female |
| Agriculture, Fishing & Hunting | 0 (0.0%) | 0 (0.0%) |
| Mining, Quarrying, & Extraction | 0 (0.0%) | 0 (0.0%) |
| Construction | 15 (100.0%) | 0 (0.0%) |
| Manufacturing | 6 (100.0%) | 0 (0.0%) |
| Wholesale Trade | 0 (0.0%) | 0 (0.0%) |
| Retail Trade | 0 (0.0%) | 0 (0.0%) |
| Transportation & Warehousing | 0 (0.0%) | 0 (0.0%) |
| Utilities | 2 (40.0%) | 3 (60.0%) |
| Information | 0 (0.0%) | 5 (100.0%) |
| Finance & Insurance | 0 (0.0%) | 0 (0.0%) |
| Real Estate, Rental & Leasing | 0 (0.0%) | 1 (100.0%) |
| Professional & Scientific | 0 (0.0%) | 0 (0.0%) |
| Enterprise Management | 0 (0.0%) | 0 (0.0%) |
| Administrative & Support | 0 (0.0%) | 0 (0.0%) |
| Educational Services | 11 (91.7%) | 1 (8.3%) |
| Health Care & Social Assistance | 0 (0.0%) | 0 (0.0%) |
| Arts, Entertainment & Recreation | 17 (100.0%) | 0 (0.0%) |
| Accommodation & Food Services | 0 (0.0%) | 5 (100.0%) |
| Public Administration | 3 (100.0%) | 0 (0.0%) |
| Total | 54 (78.3%) | 15 (21.7%) |
Education in St Charles
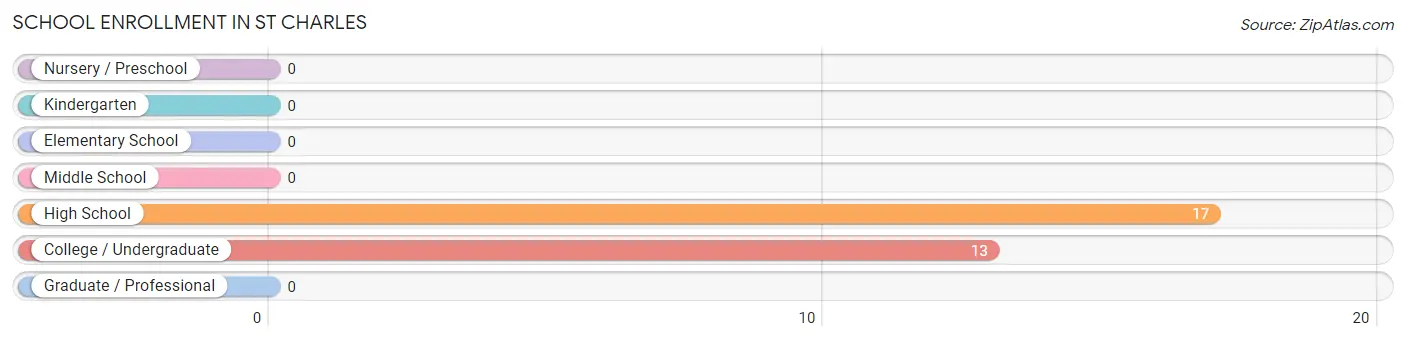
School Enrollment in St Charles
The most common levels of schooling among the 30 students in St Charles are high school (17 | 56.7%), and college / undergraduate (13 | 43.3%).
| School Level | # Students | % Students |
| Nursery / Preschool | 0 | 0.0% |
| Kindergarten | 0 | 0.0% |
| Elementary School | 0 | 0.0% |
| Middle School | 0 | 0.0% |
| High School | 17 | 56.7% |
| College / Undergraduate | 13 | 43.3% |
| Graduate / Professional | 0 | 0.0% |
| Total | 30 | 100.0% |
School Enrollment by Age by Funding Source in St Charles
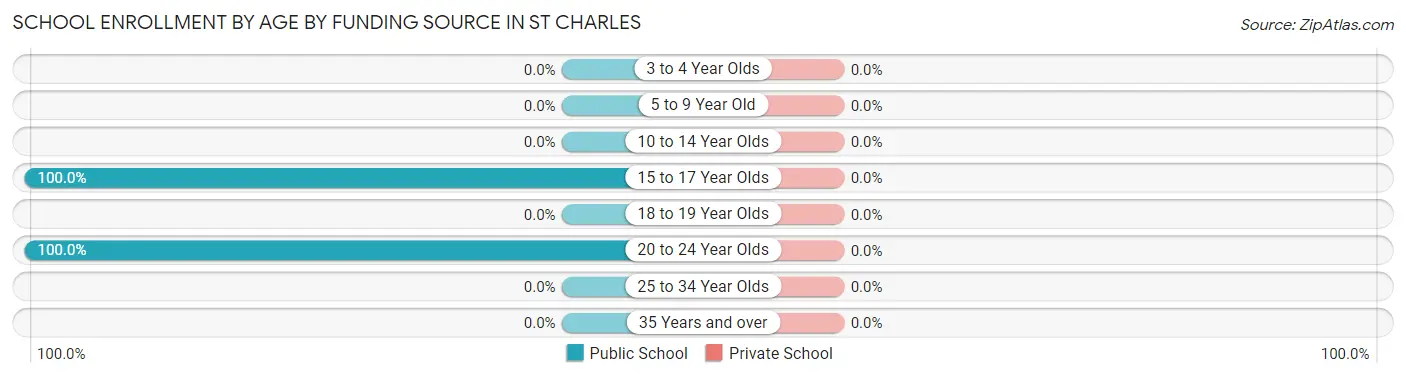
| Age Bracket | Public School | Private School |
| 3 to 4 Year Olds | 0 (0.0%) | 0 (0.0%) |
| 5 to 9 Year Old | 0 (0.0%) | 0 (0.0%) |
| 10 to 14 Year Olds | 0 (0.0%) | 0 (0.0%) |
| 15 to 17 Year Olds | 17 (100.0%) | 0 (0.0%) |
| 18 to 19 Year Olds | 0 (0.0%) | 0 (0.0%) |
| 20 to 24 Year Olds | 13 (100.0%) | 0 (0.0%) |
| 25 to 34 Year Olds | 0 (0.0%) | 0 (0.0%) |
| 35 Years and over | 0 (0.0%) | 0 (0.0%) |
| Total | 30 (100.0%) | 0 (0.0%) |
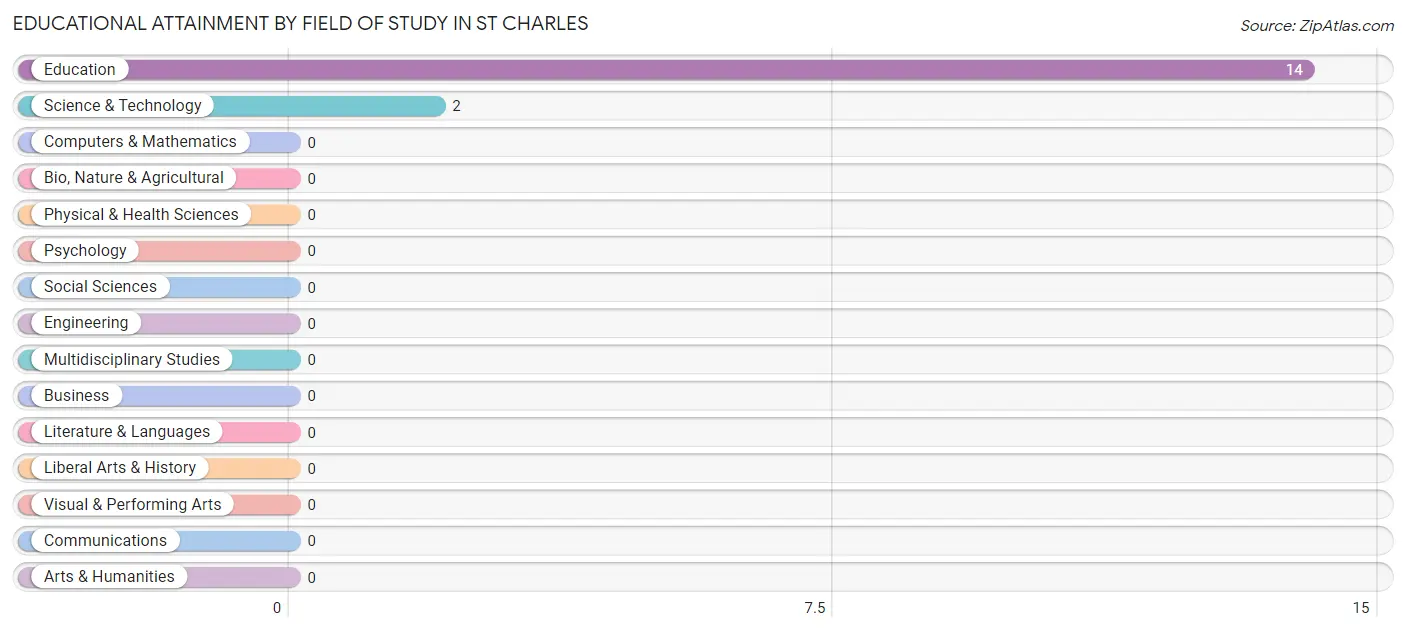
Educational Attainment by Field of Study in St Charles
Education (14 | 87.5%), and science & technology (2 | 12.5%) are the most common fields of study among 16 individuals in St Charles who have obtained a bachelor's degree or higher.
| Field of Study | # Graduates | % Graduates |
| Computers & Mathematics | 0 | 0.0% |
| Bio, Nature & Agricultural | 0 | 0.0% |
| Physical & Health Sciences | 0 | 0.0% |
| Psychology | 0 | 0.0% |
| Social Sciences | 0 | 0.0% |
| Engineering | 0 | 0.0% |
| Multidisciplinary Studies | 0 | 0.0% |
| Science & Technology | 2 | 12.5% |
| Business | 0 | 0.0% |
| Education | 14 | 87.5% |
| Literature & Languages | 0 | 0.0% |
| Liberal Arts & History | 0 | 0.0% |
| Visual & Performing Arts | 0 | 0.0% |
| Communications | 0 | 0.0% |
| Arts & Humanities | 0 | 0.0% |
| Total | 16 | 100.0% |
Transportation & Commute in St Charles
Vehicle Availability by Sex in St Charles
The most prevalent vehicle ownership categories in St Charles are males with 3 vehicles (39, accounting for 72.2%) and females with 3 vehicles (14, making up 260.0%).
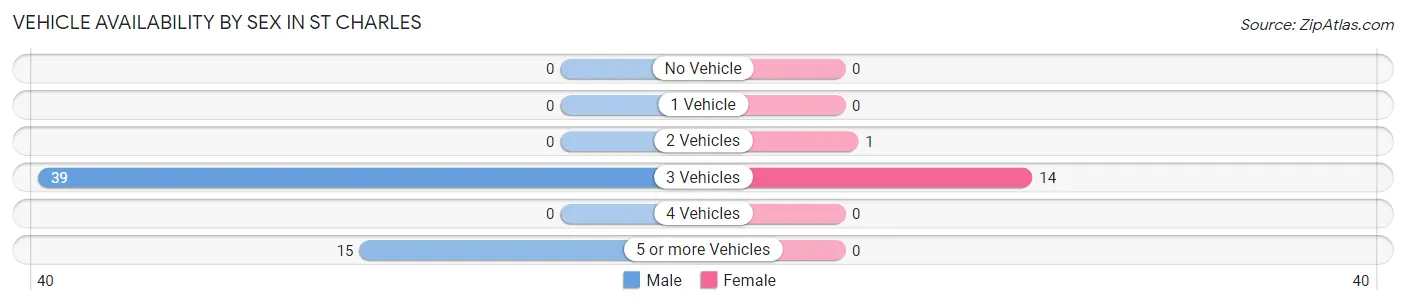
| Vehicles Available | Male | Female |
| No Vehicle | 0 (0.0%) | 0 (0.0%) |
| 1 Vehicle | 0 (0.0%) | 0 (0.0%) |
| 2 Vehicles | 0 (0.0%) | 1 (6.7%) |
| 3 Vehicles | 39 (72.2%) | 14 (93.3%) |
| 4 Vehicles | 0 (0.0%) | 0 (0.0%) |
| 5 or more Vehicles | 15 (27.8%) | 0 (0.0%) |
| Total | 54 (100.0%) | 15 (100.0%) |
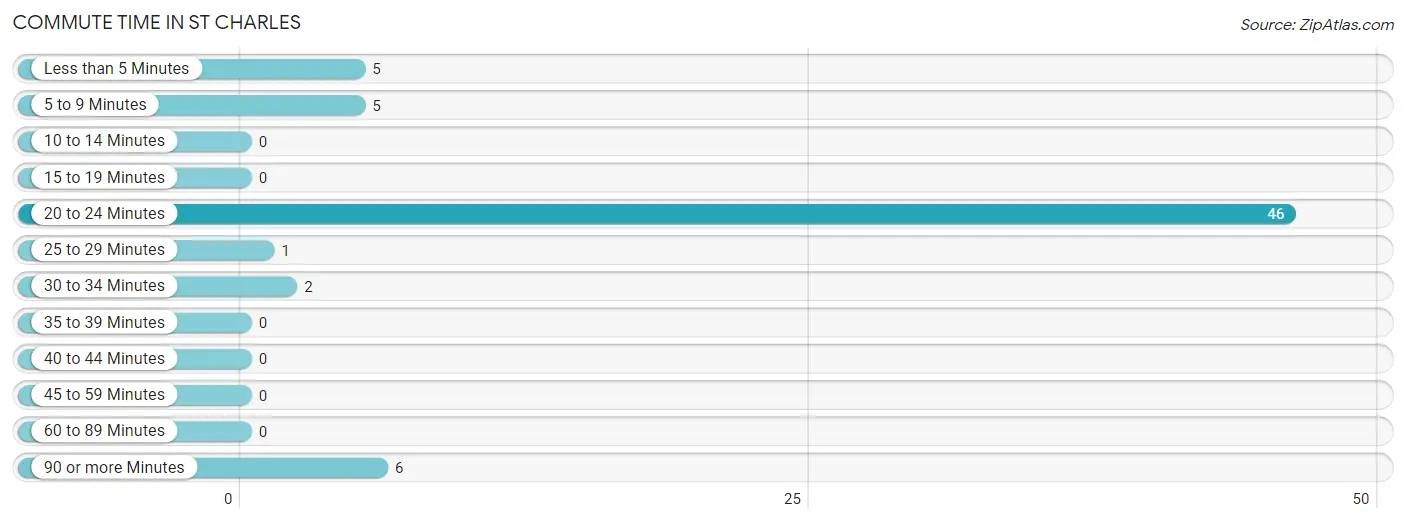
Commute Time in St Charles
The most frequently occuring commute durations in St Charles are 20 to 24 minutes (46 commuters, 70.8%), 90 or more minutes (6 commuters, 9.2%), and less than 5 minutes (5 commuters, 7.7%).
| Commute Time | # Commuters | % Commuters |
| Less than 5 Minutes | 5 | 7.7% |
| 5 to 9 Minutes | 5 | 7.7% |
| 10 to 14 Minutes | 0 | 0.0% |
| 15 to 19 Minutes | 0 | 0.0% |
| 20 to 24 Minutes | 46 | 70.8% |
| 25 to 29 Minutes | 1 | 1.5% |
| 30 to 34 Minutes | 2 | 3.1% |
| 35 to 39 Minutes | 0 | 0.0% |
| 40 to 44 Minutes | 0 | 0.0% |
| 45 to 59 Minutes | 0 | 0.0% |
| 60 to 89 Minutes | 0 | 0.0% |
| 90 or more Minutes | 6 | 9.2% |
Commute Time by Sex in St Charles
The most common commute times in St Charles are 20 to 24 minutes (41 commuters, 75.9%) for males and less than 5 minutes (5 commuters, 45.5%) for females.
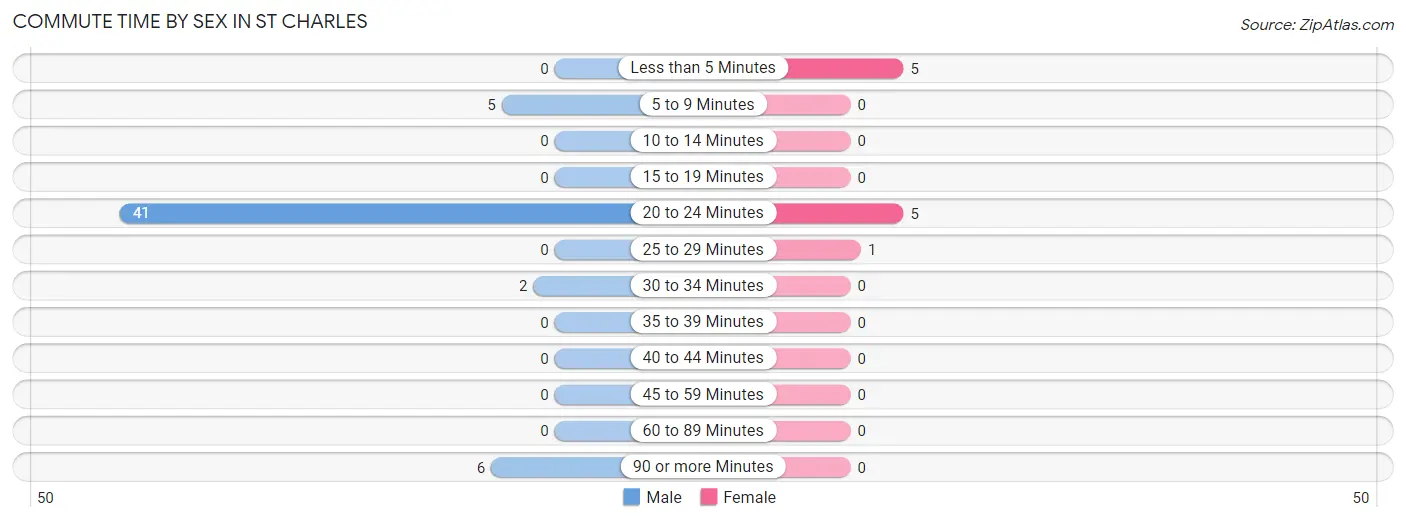
| Commute Time | Male | Female |
| Less than 5 Minutes | 0 (0.0%) | 5 (45.5%) |
| 5 to 9 Minutes | 5 (9.3%) | 0 (0.0%) |
| 10 to 14 Minutes | 0 (0.0%) | 0 (0.0%) |
| 15 to 19 Minutes | 0 (0.0%) | 0 (0.0%) |
| 20 to 24 Minutes | 41 (75.9%) | 5 (45.5%) |
| 25 to 29 Minutes | 0 (0.0%) | 1 (9.1%) |
| 30 to 34 Minutes | 2 (3.7%) | 0 (0.0%) |
| 35 to 39 Minutes | 0 (0.0%) | 0 (0.0%) |
| 40 to 44 Minutes | 0 (0.0%) | 0 (0.0%) |
| 45 to 59 Minutes | 0 (0.0%) | 0 (0.0%) |
| 60 to 89 Minutes | 0 (0.0%) | 0 (0.0%) |
| 90 or more Minutes | 6 (11.1%) | 0 (0.0%) |
Time of Departure to Work by Sex in St Charles
The most frequent times of departure to work in St Charles are 8:00 AM to 8:29 AM (28, 51.8%) for males and 6:00 AM to 6:29 AM (5, 45.5%) for females.
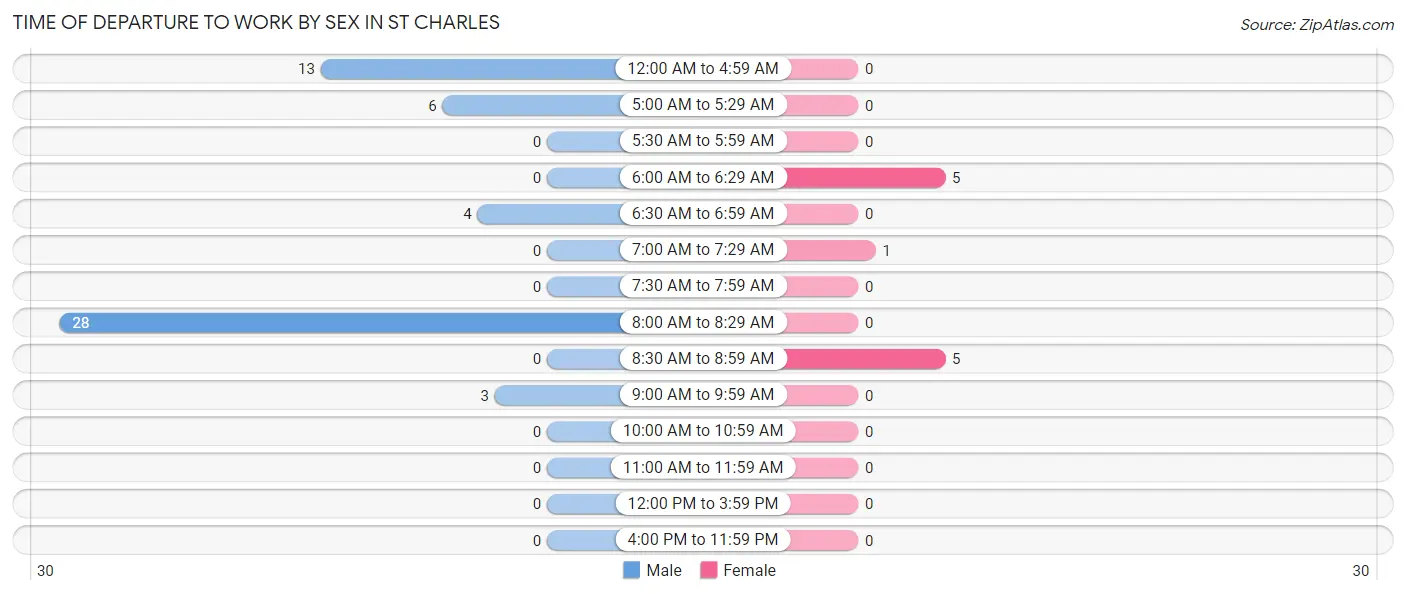
| Time of Departure | Male | Female |
| 12:00 AM to 4:59 AM | 13 (24.1%) | 0 (0.0%) |
| 5:00 AM to 5:29 AM | 6 (11.1%) | 0 (0.0%) |
| 5:30 AM to 5:59 AM | 0 (0.0%) | 0 (0.0%) |
| 6:00 AM to 6:29 AM | 0 (0.0%) | 5 (45.5%) |
| 6:30 AM to 6:59 AM | 4 (7.4%) | 0 (0.0%) |
| 7:00 AM to 7:29 AM | 0 (0.0%) | 1 (9.1%) |
| 7:30 AM to 7:59 AM | 0 (0.0%) | 0 (0.0%) |
| 8:00 AM to 8:29 AM | 28 (51.8%) | 0 (0.0%) |
| 8:30 AM to 8:59 AM | 0 (0.0%) | 5 (45.5%) |
| 9:00 AM to 9:59 AM | 3 (5.6%) | 0 (0.0%) |
| 10:00 AM to 10:59 AM | 0 (0.0%) | 0 (0.0%) |
| 11:00 AM to 11:59 AM | 0 (0.0%) | 0 (0.0%) |
| 12:00 PM to 3:59 PM | 0 (0.0%) | 0 (0.0%) |
| 4:00 PM to 11:59 PM | 0 (0.0%) | 0 (0.0%) |
| Total | 54 (100.0%) | 11 (100.0%) |
Housing Occupancy in St Charles
Occupancy by Ownership in St Charles
Of the total 56 dwellings in St Charles, owner-occupied units account for 54 (96.4%), while renter-occupied units make up 2 (3.6%).
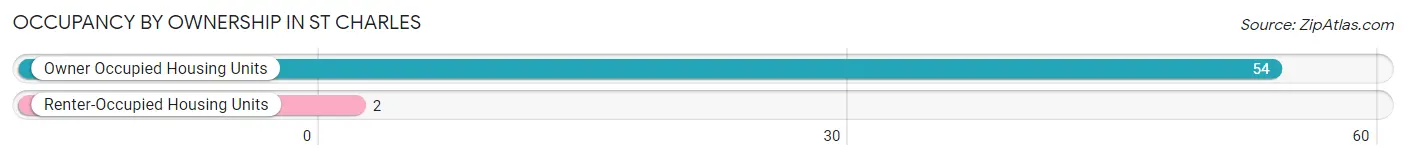
| Occupancy | # Housing Units | % Housing Units |
| Owner Occupied Housing Units | 54 | 96.4% |
| Renter-Occupied Housing Units | 2 | 3.6% |
| Total Occupied Housing Units | 56 | 100.0% |
Occupancy by Household Size in St Charles
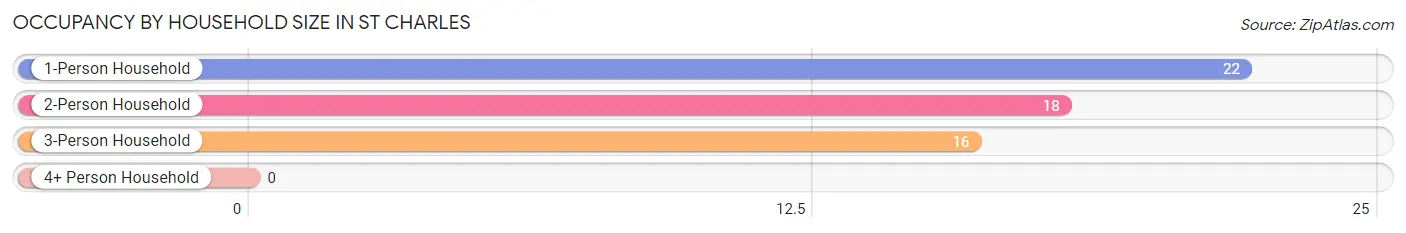
| Household Size | # Housing Units | % Housing Units |
| 1-Person Household | 22 | 39.3% |
| 2-Person Household | 18 | 32.1% |
| 3-Person Household | 16 | 28.6% |
| 4+ Person Household | 0 | 0.0% |
| Total Housing Units | 56 | 100.0% |
Occupancy by Ownership by Household Size in St Charles
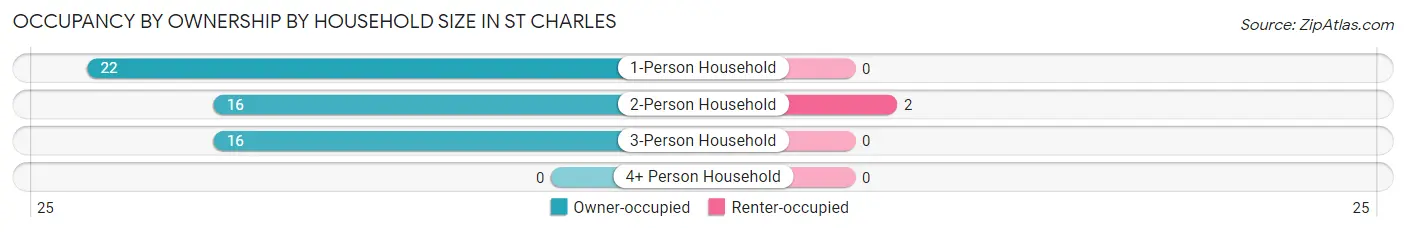
| Household Size | Owner-occupied | Renter-occupied |
| 1-Person Household | 22 (100.0%) | 0 (0.0%) |
| 2-Person Household | 16 (88.9%) | 2 (11.1%) |
| 3-Person Household | 16 (100.0%) | 0 (0.0%) |
| 4+ Person Household | 0 (0.0%) | 0 (0.0%) |
| Total Housing Units | 54 (96.4%) | 2 (3.6%) |
Occupancy by Educational Attainment in St Charles
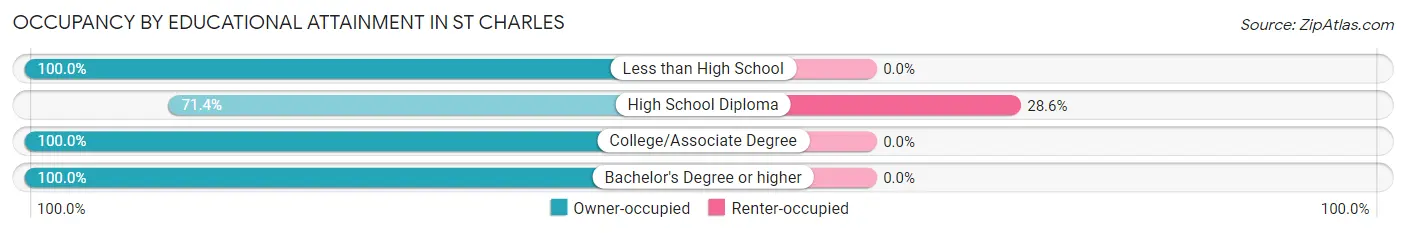
| Household Size | Owner-occupied | Renter-occupied |
| Less than High School | 2 (100.0%) | 0 (0.0%) |
| High School Diploma | 5 (71.4%) | 2 (28.6%) |
| College/Associate Degree | 34 (100.0%) | 0 (0.0%) |
| Bachelor's Degree or higher | 13 (100.0%) | 0 (0.0%) |
Occupancy by Age of Householder in St Charles
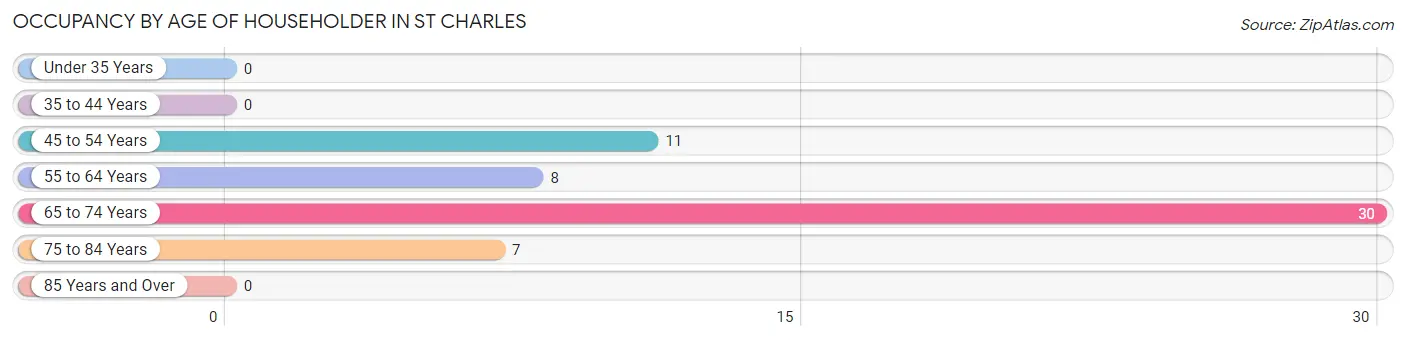
| Age Bracket | # Households | % Households |
| Under 35 Years | 0 | 0.0% |
| 35 to 44 Years | 0 | 0.0% |
| 45 to 54 Years | 11 | 19.6% |
| 55 to 64 Years | 8 | 14.3% |
| 65 to 74 Years | 30 | 53.6% |
| 75 to 84 Years | 7 | 12.5% |
| 85 Years and Over | 0 | 0.0% |
| Total | 56 | 100.0% |
Housing Finances in St Charles
Median Income by Occupancy in St Charles
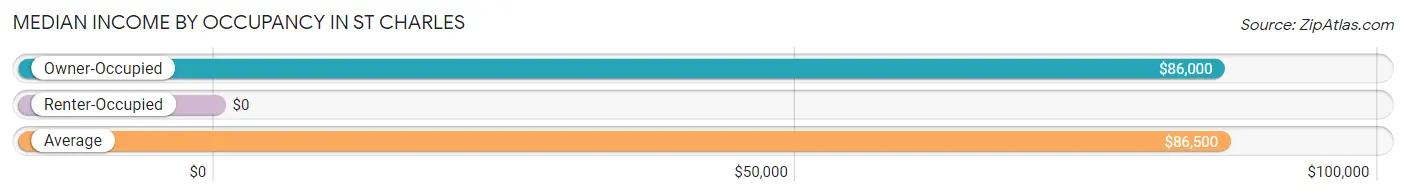
| Occupancy Type | # Households | Median Income |
| Owner-Occupied | 54 (96.4%) | $86,000 |
| Renter-Occupied | 2 (3.6%) | $0 |
| Average | 56 (100.0%) | $86,500 |
Occupancy by Householder Income Bracket in St Charles
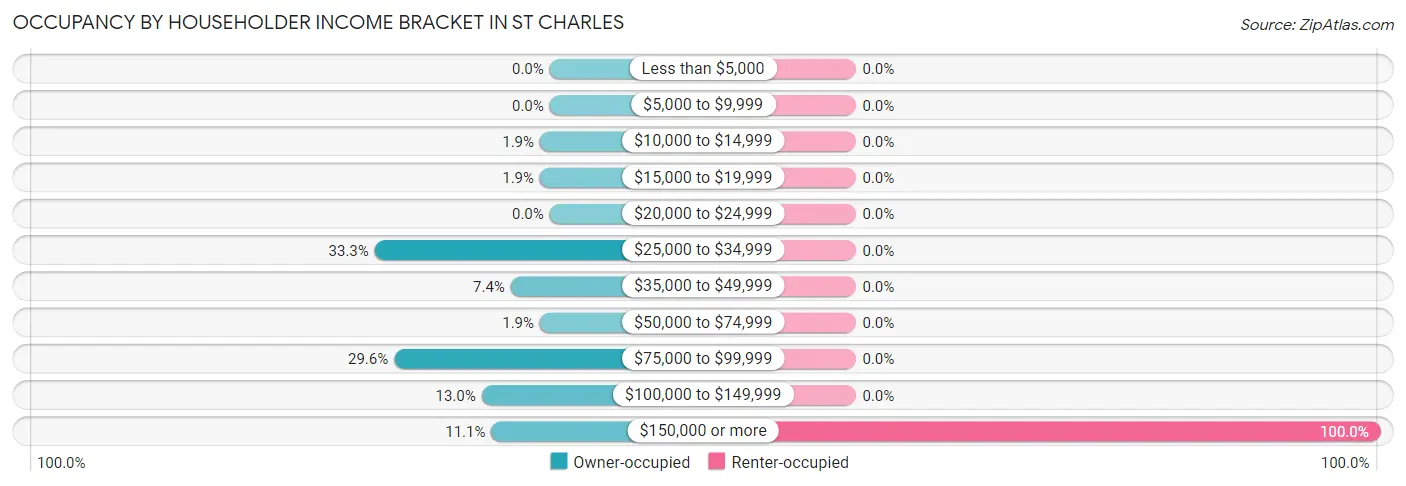
| Income Bracket | Owner-occupied | Renter-occupied |
| Less than $5,000 | 0 (0.0%) | 0 (0.0%) |
| $5,000 to $9,999 | 0 (0.0%) | 0 (0.0%) |
| $10,000 to $14,999 | 1 (1.8%) | 0 (0.0%) |
| $15,000 to $19,999 | 1 (1.8%) | 0 (0.0%) |
| $20,000 to $24,999 | 0 (0.0%) | 0 (0.0%) |
| $25,000 to $34,999 | 18 (33.3%) | 0 (0.0%) |
| $35,000 to $49,999 | 4 (7.4%) | 0 (0.0%) |
| $50,000 to $74,999 | 1 (1.8%) | 0 (0.0%) |
| $75,000 to $99,999 | 16 (29.6%) | 0 (0.0%) |
| $100,000 to $149,999 | 7 (13.0%) | 0 (0.0%) |
| $150,000 or more | 6 (11.1%) | 2 (100.0%) |
| Total | 54 (100.0%) | 2 (100.0%) |
Monthly Housing Cost Tiers in St Charles
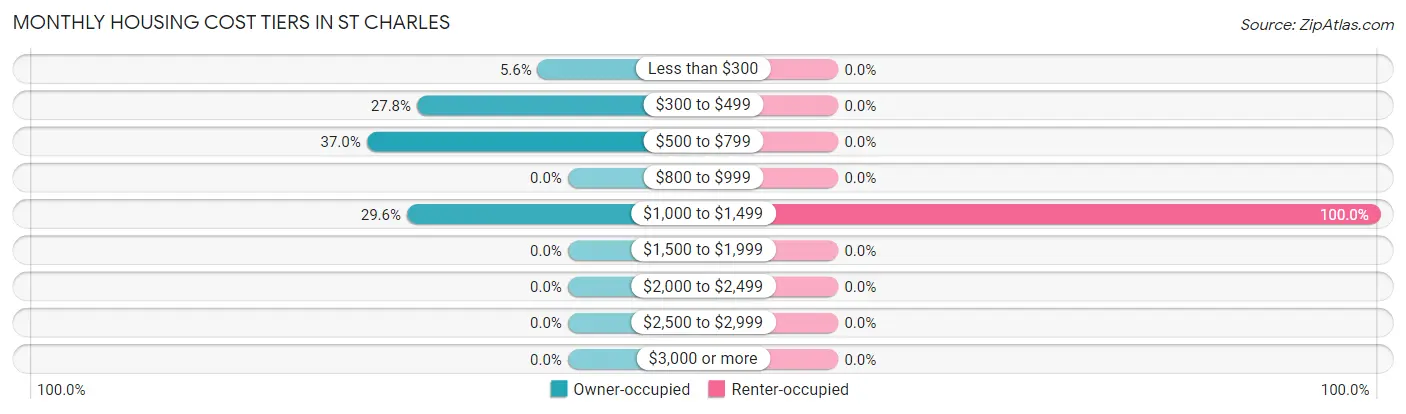
| Monthly Cost | Owner-occupied | Renter-occupied |
| Less than $300 | 3 (5.6%) | 0 (0.0%) |
| $300 to $499 | 15 (27.8%) | 0 (0.0%) |
| $500 to $799 | 20 (37.0%) | 0 (0.0%) |
| $800 to $999 | 0 (0.0%) | 0 (0.0%) |
| $1,000 to $1,499 | 16 (29.6%) | 2 (100.0%) |
| $1,500 to $1,999 | 0 (0.0%) | 0 (0.0%) |
| $2,000 to $2,499 | 0 (0.0%) | 0 (0.0%) |
| $2,500 to $2,999 | 0 (0.0%) | 0 (0.0%) |
| $3,000 or more | 0 (0.0%) | 0 (0.0%) |
| Total | 54 (100.0%) | 2 (100.0%) |
Physical Housing Characteristics in St Charles
Housing Structures in St Charles
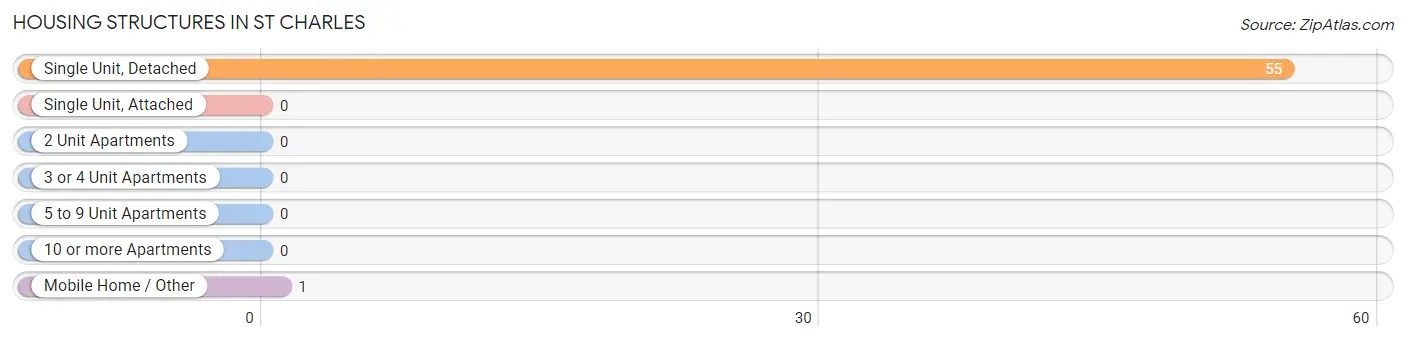
| Structure Type | # Housing Units | % Housing Units |
| Single Unit, Detached | 55 | 98.2% |
| Single Unit, Attached | 0 | 0.0% |
| 2 Unit Apartments | 0 | 0.0% |
| 3 or 4 Unit Apartments | 0 | 0.0% |
| 5 to 9 Unit Apartments | 0 | 0.0% |
| 10 or more Apartments | 0 | 0.0% |
| Mobile Home / Other | 1 | 1.8% |
| Total | 56 | 100.0% |
Housing Structures by Occupancy in St Charles
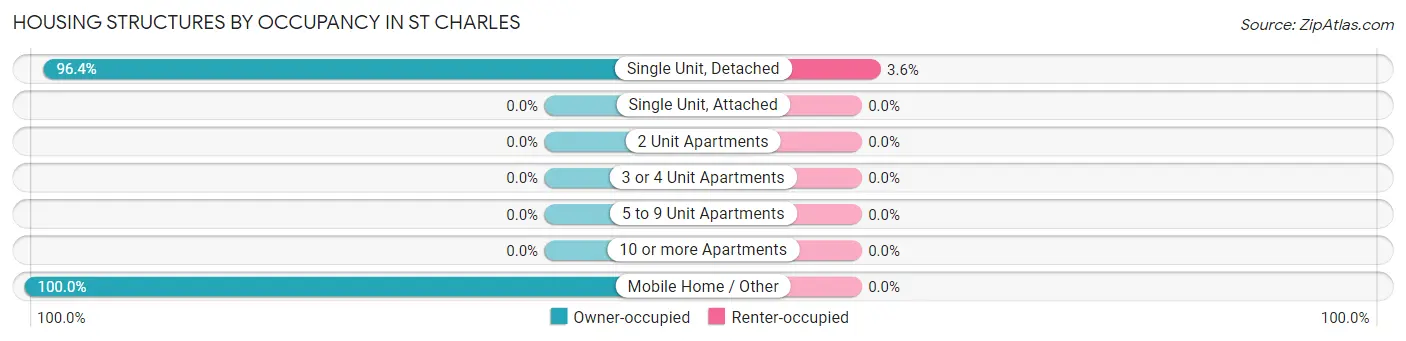
| Structure Type | Owner-occupied | Renter-occupied |
| Single Unit, Detached | 53 (96.4%) | 2 (3.6%) |
| Single Unit, Attached | 0 (0.0%) | 0 (0.0%) |
| 2 Unit Apartments | 0 (0.0%) | 0 (0.0%) |
| 3 or 4 Unit Apartments | 0 (0.0%) | 0 (0.0%) |
| 5 to 9 Unit Apartments | 0 (0.0%) | 0 (0.0%) |
| 10 or more Apartments | 0 (0.0%) | 0 (0.0%) |
| Mobile Home / Other | 1 (100.0%) | 0 (0.0%) |
| Total | 54 (96.4%) | 2 (3.6%) |
Housing Structures by Number of Rooms in St Charles
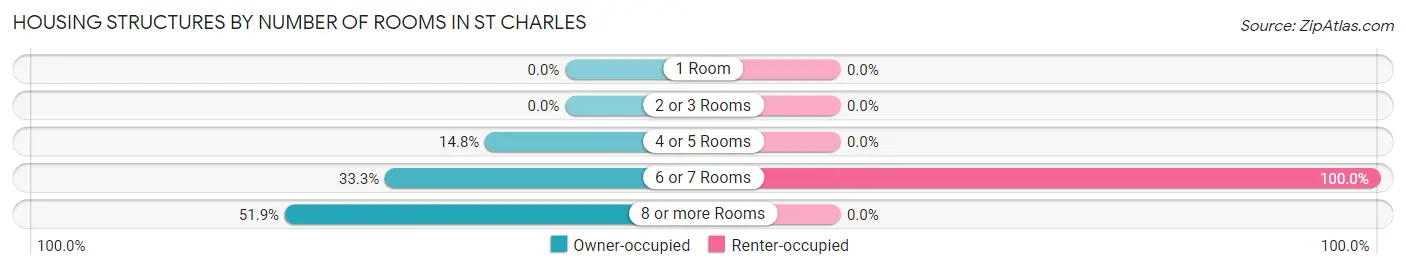
| Number of Rooms | Owner-occupied | Renter-occupied |
| 1 Room | 0 (0.0%) | 0 (0.0%) |
| 2 or 3 Rooms | 0 (0.0%) | 0 (0.0%) |
| 4 or 5 Rooms | 8 (14.8%) | 0 (0.0%) |
| 6 or 7 Rooms | 18 (33.3%) | 2 (100.0%) |
| 8 or more Rooms | 28 (51.8%) | 0 (0.0%) |
| Total | 54 (100.0%) | 2 (100.0%) |
Housing Structure by Heating Type in St Charles
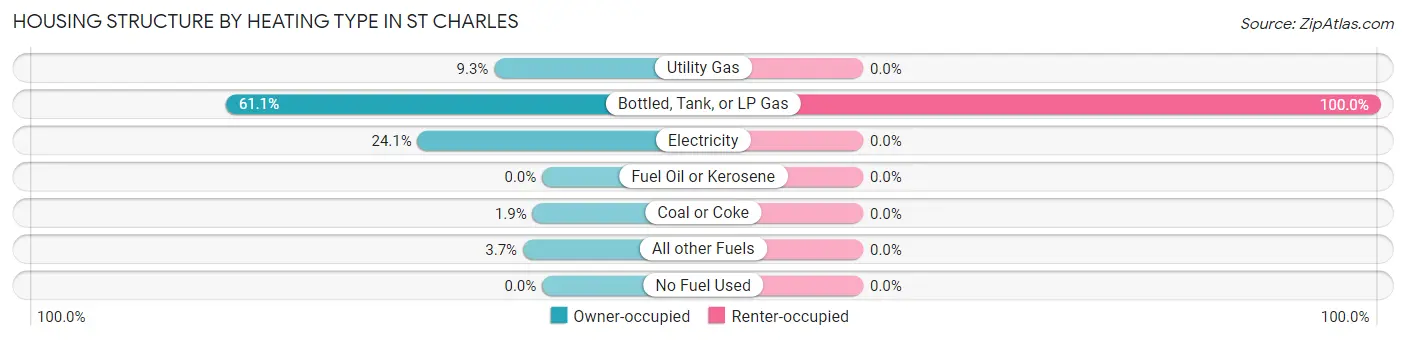
| Heating Type | Owner-occupied | Renter-occupied |
| Utility Gas | 5 (9.3%) | 0 (0.0%) |
| Bottled, Tank, or LP Gas | 33 (61.1%) | 2 (100.0%) |
| Electricity | 13 (24.1%) | 0 (0.0%) |
| Fuel Oil or Kerosene | 0 (0.0%) | 0 (0.0%) |
| Coal or Coke | 1 (1.8%) | 0 (0.0%) |
| All other Fuels | 2 (3.7%) | 0 (0.0%) |
| No Fuel Used | 0 (0.0%) | 0 (0.0%) |
| Total | 54 (100.0%) | 2 (100.0%) |
Household Vehicle Usage in St Charles
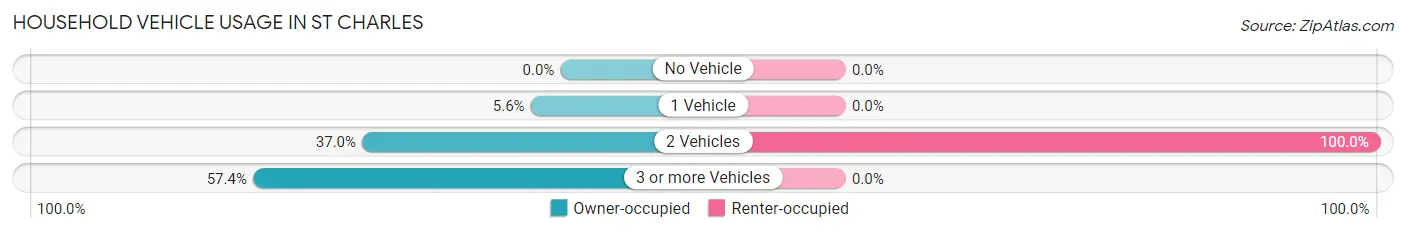
| Vehicles per Household | Owner-occupied | Renter-occupied |
| No Vehicle | 0 (0.0%) | 0 (0.0%) |
| 1 Vehicle | 3 (5.6%) | 0 (0.0%) |
| 2 Vehicles | 20 (37.0%) | 2 (100.0%) |
| 3 or more Vehicles | 31 (57.4%) | 0 (0.0%) |
| Total | 54 (100.0%) | 2 (100.0%) |
Real Estate & Mortgages in St Charles
Real Estate and Mortgage Overview in St Charles
| Characteristic | Without Mortgage | With Mortgage |
| Housing Units | 36 | 18 |
| Median Property Value | $162,500 | $218,200 |
| Median Household Income | - | - |
| Monthly Housing Costs | $500 | $0 |
| Real Estate Taxes | $748 | $0 |
Property Value by Mortgage Status in St Charles
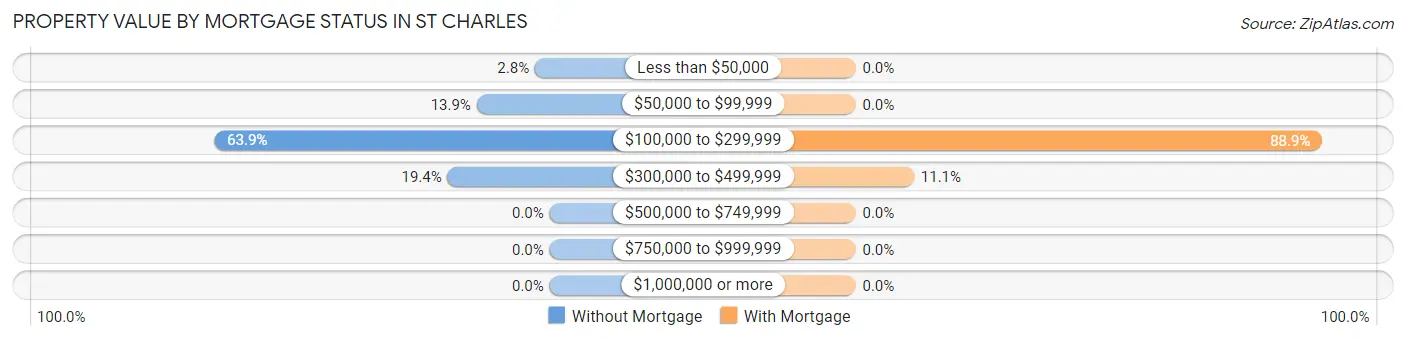
| Property Value | Without Mortgage | With Mortgage |
| Less than $50,000 | 1 (2.8%) | 0 (0.0%) |
| $50,000 to $99,999 | 5 (13.9%) | 0 (0.0%) |
| $100,000 to $299,999 | 23 (63.9%) | 16 (88.9%) |
| $300,000 to $499,999 | 7 (19.4%) | 2 (11.1%) |
| $500,000 to $749,999 | 0 (0.0%) | 0 (0.0%) |
| $750,000 to $999,999 | 0 (0.0%) | 0 (0.0%) |
| $1,000,000 or more | 0 (0.0%) | 0 (0.0%) |
| Total | 36 (100.0%) | 18 (100.0%) |
Household Income by Mortgage Status in St Charles
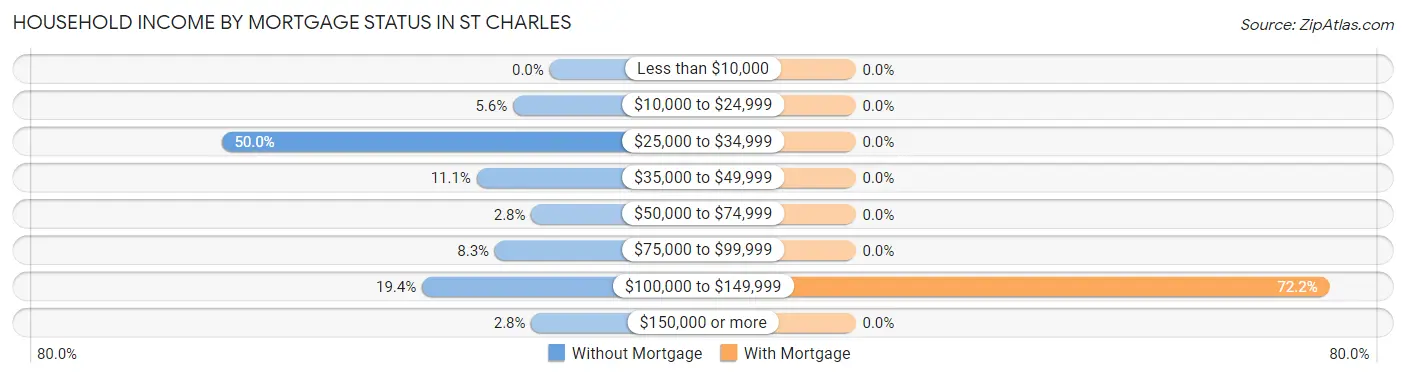
| Household Income | Without Mortgage | With Mortgage |
| Less than $10,000 | 0 (0.0%) | 0 (0.0%) |
| $10,000 to $24,999 | 2 (5.6%) | 0 (0.0%) |
| $25,000 to $34,999 | 18 (50.0%) | 0 (0.0%) |
| $35,000 to $49,999 | 4 (11.1%) | 0 (0.0%) |
| $50,000 to $74,999 | 1 (2.8%) | 0 (0.0%) |
| $75,000 to $99,999 | 3 (8.3%) | 0 (0.0%) |
| $100,000 to $149,999 | 7 (19.4%) | 13 (72.2%) |
| $150,000 or more | 1 (2.8%) | 0 (0.0%) |
| Total | 36 (100.0%) | 18 (100.0%) |
Property Value to Household Income Ratio in St Charles
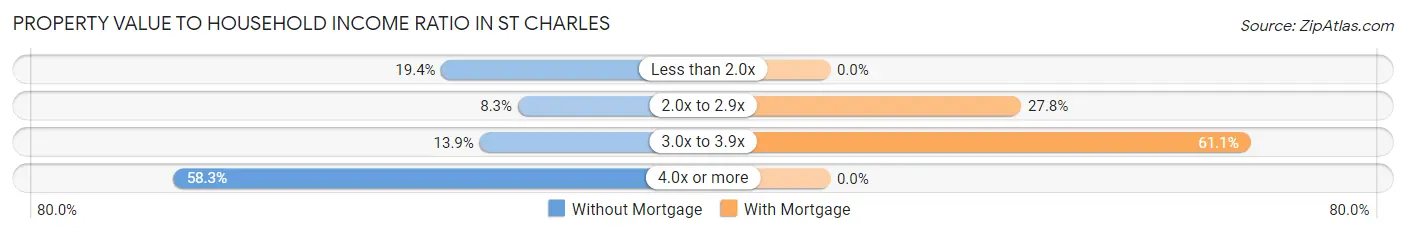
| Value-to-Income Ratio | Without Mortgage | With Mortgage |
| Less than 2.0x | 7 (19.4%) | 0 (0.0%) |
| 2.0x to 2.9x | 3 (8.3%) | 5 (27.8%) |
| 3.0x to 3.9x | 5 (13.9%) | 11 (61.1%) |
| 4.0x or more | 21 (58.3%) | 0 (0.0%) |
| Total | 36 (100.0%) | 18 (100.0%) |
Real Estate Taxes by Mortgage Status in St Charles
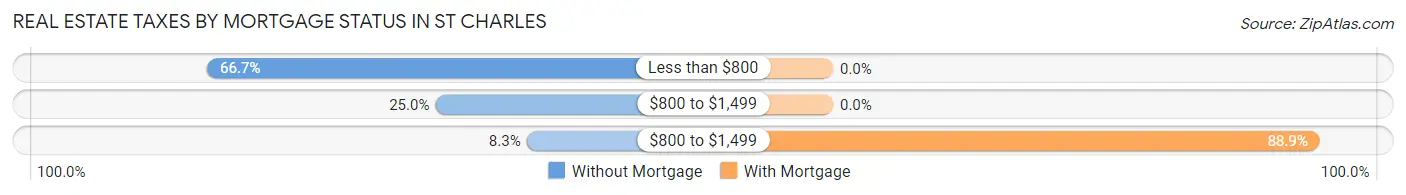
| Property Taxes | Without Mortgage | With Mortgage |
| Less than $800 | 24 (66.7%) | 0 (0.0%) |
| $800 to $1,499 | 9 (25.0%) | 0 (0.0%) |
| $800 to $1,499 | 3 (8.3%) | 16 (88.9%) |
| Total | 36 (100.0%) | 18 (100.0%) |
Health & Disability in St Charles
Health Insurance Coverage by Age in St Charles
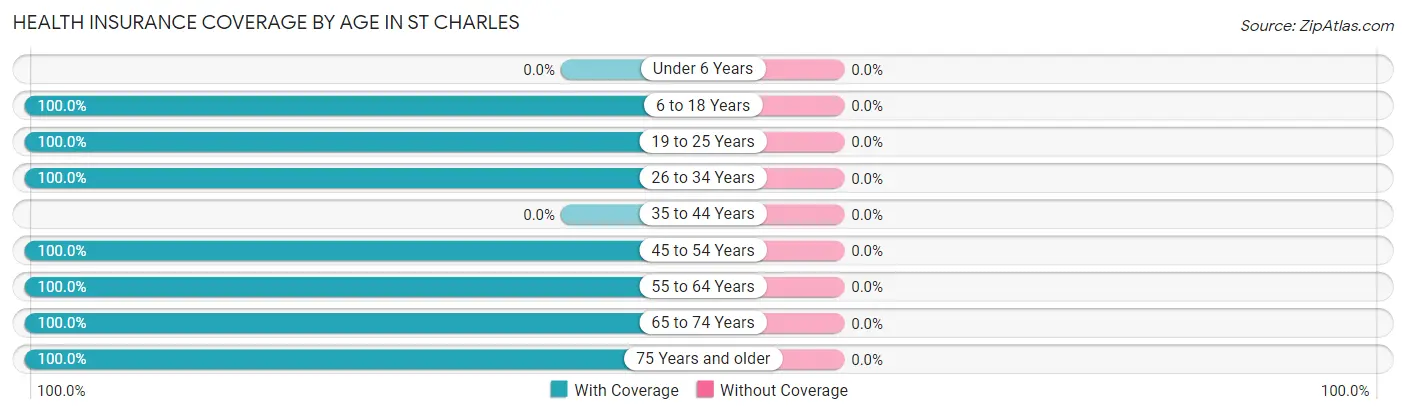
| Age Bracket | With Coverage | Without Coverage |
| Under 6 Years | 0 (0.0%) | 0 (0.0%) |
| 6 to 18 Years | 17 (100.0%) | 0 (0.0%) |
| 19 to 25 Years | 13 (100.0%) | 0 (0.0%) |
| 26 to 34 Years | 2 (100.0%) | 0 (0.0%) |
| 35 to 44 Years | 0 (0.0%) | 0 (0.0%) |
| 45 to 54 Years | 18 (100.0%) | 0 (0.0%) |
| 55 to 64 Years | 24 (100.0%) | 0 (0.0%) |
| 65 to 74 Years | 39 (100.0%) | 0 (0.0%) |
| 75 Years and older | 10 (100.0%) | 0 (0.0%) |
| Total | 123 (100.0%) | 0 (0.0%) |
Health Insurance Coverage by Citizenship Status in St Charles
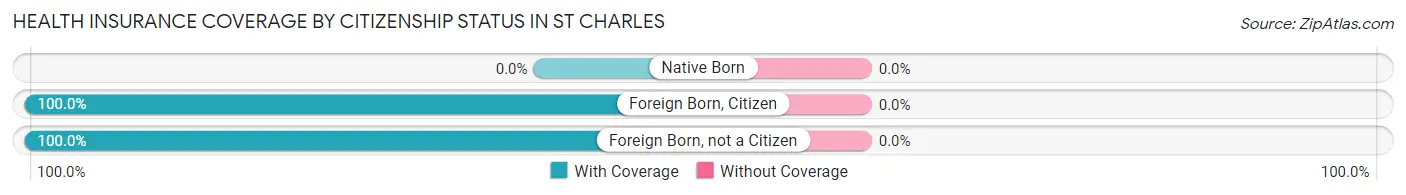
| Citizenship Status | With Coverage | Without Coverage |
| Native Born | 0 (0.0%) | 0 (0.0%) |
| Foreign Born, Citizen | 17 (100.0%) | 0 (0.0%) |
| Foreign Born, not a Citizen | 13 (100.0%) | 0 (0.0%) |
Health Insurance Coverage by Household Income in St Charles
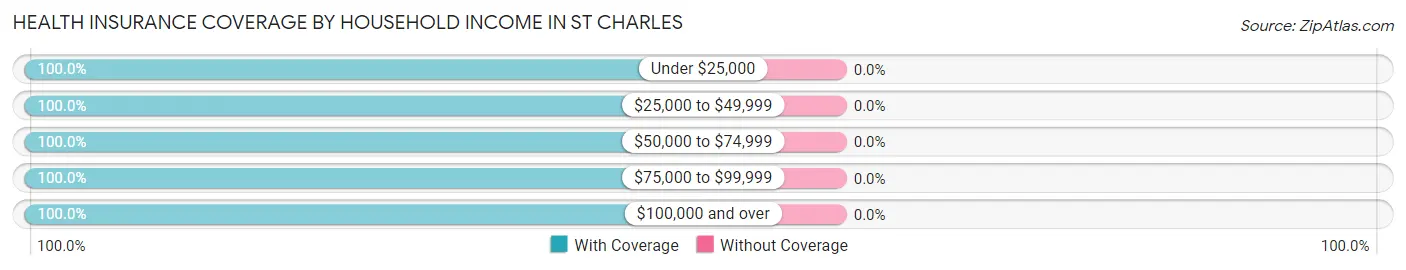
| Household Income | With Coverage | Without Coverage |
| Under $25,000 | 2 (100.0%) | 0 (0.0%) |
| $25,000 to $49,999 | 24 (100.0%) | 0 (0.0%) |
| $50,000 to $74,999 | 5 (100.0%) | 0 (0.0%) |
| $75,000 to $99,999 | 48 (100.0%) | 0 (0.0%) |
| $100,000 and over | 44 (100.0%) | 0 (0.0%) |
Public vs Private Health Insurance Coverage by Age in St Charles
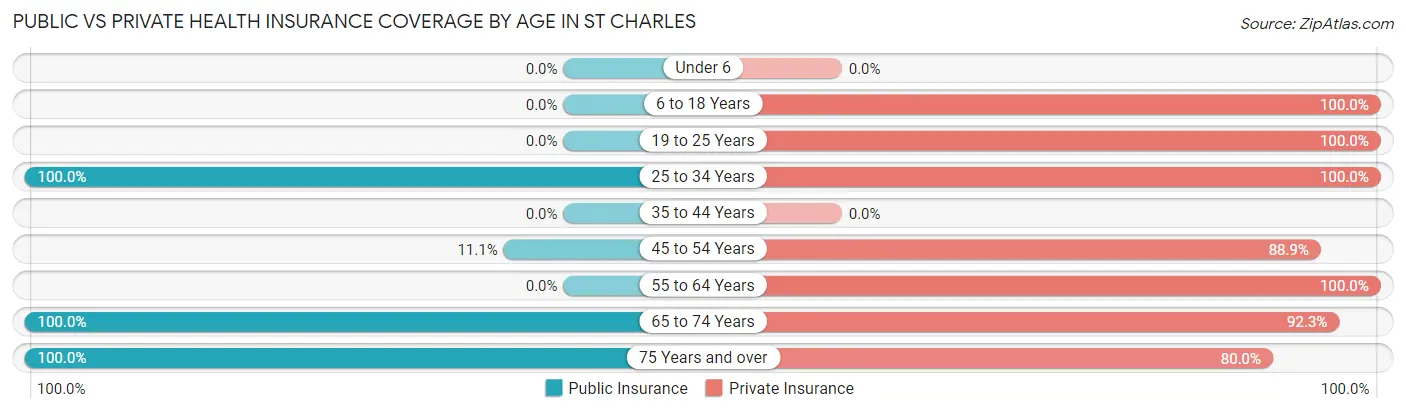
| Age Bracket | Public Insurance | Private Insurance |
| Under 6 | 0 (0.0%) | 0 (0.0%) |
| 6 to 18 Years | 0 (0.0%) | 17 (100.0%) |
| 19 to 25 Years | 0 (0.0%) | 13 (100.0%) |
| 25 to 34 Years | 2 (100.0%) | 2 (100.0%) |
| 35 to 44 Years | 0 (0.0%) | 0 (0.0%) |
| 45 to 54 Years | 2 (11.1%) | 16 (88.9%) |
| 55 to 64 Years | 0 (0.0%) | 24 (100.0%) |
| 65 to 74 Years | 39 (100.0%) | 36 (92.3%) |
| 75 Years and over | 10 (100.0%) | 8 (80.0%) |
| Total | 53 (43.1%) | 116 (94.3%) |
Disability Status by Sex by Age in St Charles
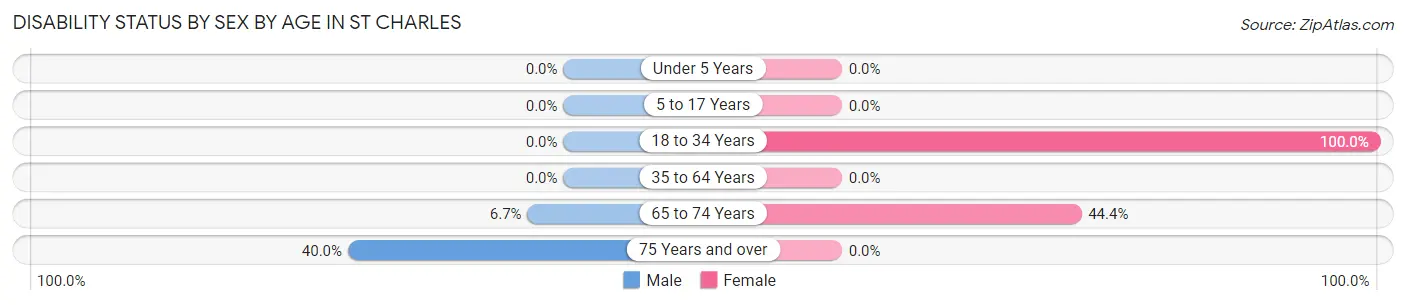
| Age Bracket | Male | Female |
| Under 5 Years | 0 (0.0%) | 0 (0.0%) |
| 5 to 17 Years | 0 (0.0%) | 0 (0.0%) |
| 18 to 34 Years | 0 (0.0%) | 2 (100.0%) |
| 35 to 64 Years | 0 (0.0%) | 0 (0.0%) |
| 65 to 74 Years | 2 (6.7%) | 4 (44.4%) |
| 75 Years and over | 2 (40.0%) | 0 (0.0%) |
Disability Class by Sex by Age in St Charles
Disability Class: Hearing Difficulty
| Age Bracket | Male | Female |
| Under 5 Years | 0 (0.0%) | 0 (0.0%) |
| 5 to 17 Years | 0 (0.0%) | 0 (0.0%) |
| 18 to 34 Years | 0 (0.0%) | 0 (0.0%) |
| 35 to 64 Years | 0 (0.0%) | 0 (0.0%) |
| 65 to 74 Years | 0 (0.0%) | 0 (0.0%) |
| 75 Years and over | 0 (0.0%) | 0 (0.0%) |
Disability Class: Vision Difficulty
| Age Bracket | Male | Female |
| Under 5 Years | 0 (0.0%) | 0 (0.0%) |
| 5 to 17 Years | 0 (0.0%) | 0 (0.0%) |
| 18 to 34 Years | 0 (0.0%) | 0 (0.0%) |
| 35 to 64 Years | 0 (0.0%) | 0 (0.0%) |
| 65 to 74 Years | 0 (0.0%) | 0 (0.0%) |
| 75 Years and over | 0 (0.0%) | 0 (0.0%) |
Disability Class: Cognitive Difficulty
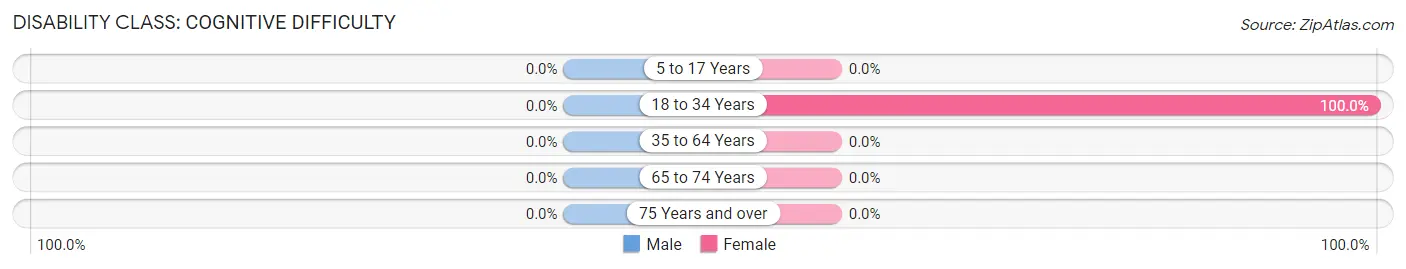
| Age Bracket | Male | Female |
| 5 to 17 Years | 0 (0.0%) | 0 (0.0%) |
| 18 to 34 Years | 0 (0.0%) | 2 (100.0%) |
| 35 to 64 Years | 0 (0.0%) | 0 (0.0%) |
| 65 to 74 Years | 0 (0.0%) | 0 (0.0%) |
| 75 Years and over | 0 (0.0%) | 0 (0.0%) |
Disability Class: Ambulatory Difficulty
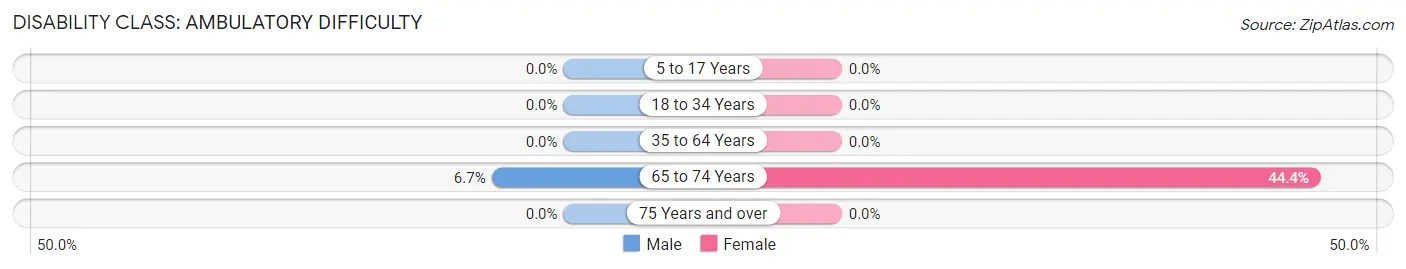
| Age Bracket | Male | Female |
| 5 to 17 Years | 0 (0.0%) | 0 (0.0%) |
| 18 to 34 Years | 0 (0.0%) | 0 (0.0%) |
| 35 to 64 Years | 0 (0.0%) | 0 (0.0%) |
| 65 to 74 Years | 2 (6.7%) | 4 (44.4%) |
| 75 Years and over | 0 (0.0%) | 0 (0.0%) |
Disability Class: Self-Care Difficulty
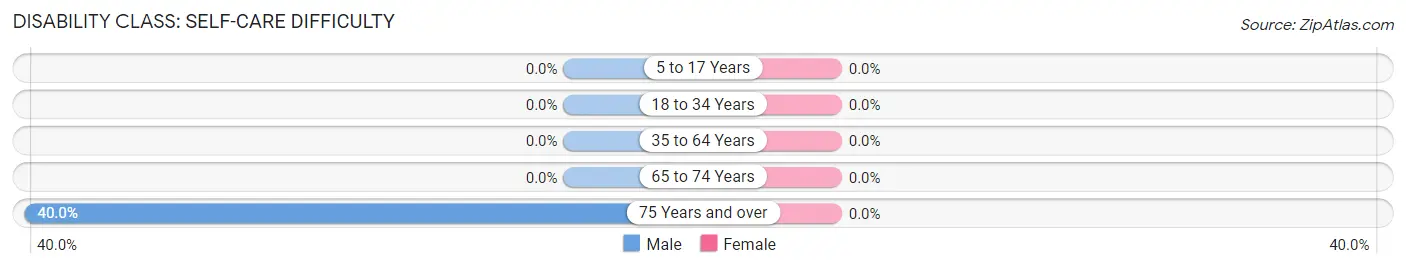
| Age Bracket | Male | Female |
| 5 to 17 Years | 0 (0.0%) | 0 (0.0%) |
| 18 to 34 Years | 0 (0.0%) | 0 (0.0%) |
| 35 to 64 Years | 0 (0.0%) | 0 (0.0%) |
| 65 to 74 Years | 0 (0.0%) | 0 (0.0%) |
| 75 Years and over | 2 (40.0%) | 0 (0.0%) |
Technology Access in St Charles
Computing Device Access in St Charles
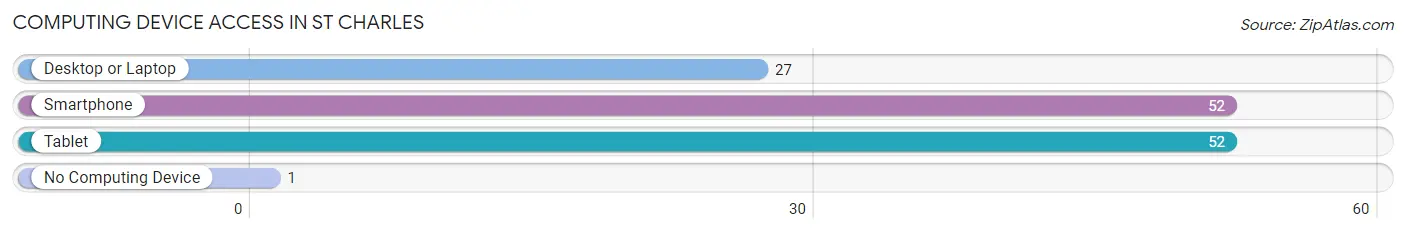
| Device Type | # Households | % Households |
| Desktop or Laptop | 27 | 48.2% |
| Smartphone | 52 | 92.9% |
| Tablet | 52 | 92.9% |
| No Computing Device | 1 | 1.8% |
| Total | 56 | 100.0% |
Internet Access in St Charles
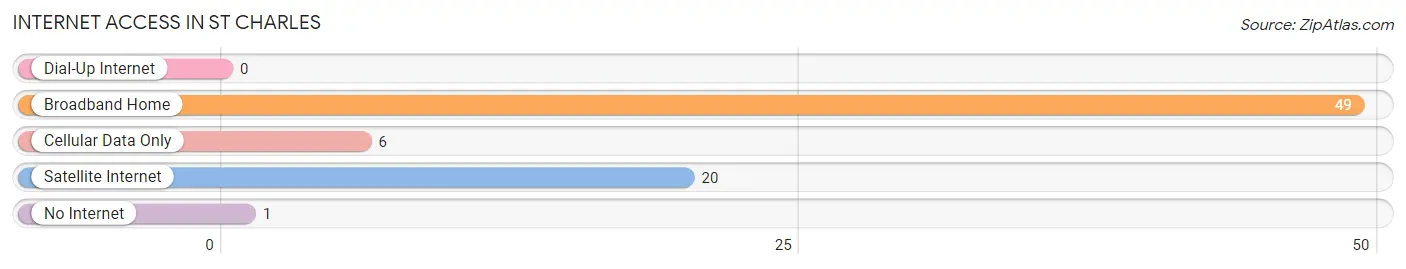
| Internet Type | # Households | % Households |
| Dial-Up Internet | 0 | 0.0% |
| Broadband Home | 49 | 87.5% |
| Cellular Data Only | 6 | 10.7% |
| Satellite Internet | 20 | 35.7% |
| No Internet | 1 | 1.8% |
| Total | 56 | 100.0% |
St Charles Summary
St. Charles is a small city located in the southeastern corner of Idaho, in the county of Bear Lake. It is situated on the western shore of Bear Lake, a large natural freshwater lake that straddles the Idaho-Utah border. The city is home to a population of approximately 1,000 people, and is the county seat of Bear Lake County.
History
The area that is now St. Charles was first settled in the late 1800s by Mormon pioneers. The city was originally known as Paris, and was later renamed St. Charles in honor of Charles C. Rich, a prominent early leader of the Church of Jesus Christ of Latter-day Saints. The city was incorporated in 1891, and has remained a small, rural community ever since.
Geography
St. Charles is located in the southeastern corner of Idaho, in the county of Bear Lake. It is situated on the western shore of Bear Lake, a large natural freshwater lake that straddles the Idaho-Utah border. The city is surrounded by rolling hills and farmland, and is located at an elevation of 5,400 feet. The climate in St. Charles is semi-arid, with hot summers and cold winters.
Economy
The economy of St. Charles is largely based on agriculture and tourism. The city is home to several farms and ranches, which produce a variety of crops and livestock. Tourism is also an important part of the local economy, as the city is a popular destination for outdoor recreation. Fishing, boating, and camping are all popular activities in the area.
Demographics
As of the 2010 census, the population of St. Charles was 1,000. The racial makeup of the city was 95.2% White, 0.3% African American, 0.2% Native American, 0.2% Asian, 0.1% Pacific Islander, 0.2% from other races, and 3.9% from two or more races. The median household income in St. Charles was $37,500, and the median family income was $45,000. The per capita income was $17,000. The unemployment rate was 5.2%.
Conclusion
St. Charles is a small city located in the southeastern corner of Idaho, in the county of Bear Lake. It is situated on the western shore of Bear Lake, a large natural freshwater lake that straddles the Idaho-Utah border. The city is home to a population of approximately 1,000 people, and is the county seat of Bear Lake County. The economy of St. Charles is largely based on agriculture and tourism, and the city is a popular destination for outdoor recreation. The population of St. Charles is predominantly White, with a median household income of $37,500 and a median family income of $45,000.
Common Questions
What is the Total Population of St Charles?
Total Population of St Charles is 123.
What is the Total Male Population of St Charles?
Total Male Population of St Charles is 87.
What is the Total Female Population of St Charles?
Total Female Population of St Charles is 36.
What is the Ratio of Males per 100 Females in St Charles?
There are 241.67 Males per 100 Females in St Charles.
What is the Ratio of Females per 100 Males in St Charles?
There are 41.38 Females per 100 Males in St Charles.
What is the Median Population Age in St Charles?
Median Population Age in St Charles is 58.2 Years.
What is the Average Family Size in St Charles
Average Family Size in St Charles is 3.0 People.
What is the Average Household Size in St Charles
Average Household Size in St Charles is 2.2 People.
What is Per Capita Income in St Charles?
Per Capita income in St Charles is $44,992.
What is the Median Family Income in St Charles?
Median Family Income in St Charles is $99,545.
What is the Median Household income in St Charles?
Median Household Income in St Charles is $86,500.
What is Income or Wage Gap in St Charles?
Income or Wage Gap in St Charles is 30.8%.
Women in St Charles earn 69.2 cents for every dollar earned by a man.
What is Inequality or Gini Index in St Charles?
Inequality or Gini Index in St Charles is 0.45.
How Large is the Labor Force in St Charles?
There are 69 People in the Labor Forcein in St Charles.
What is the Percentage of People in the Labor Force in St Charles?
56.1% of People are in the Labor Force in St Charles.