Lincoln, ID
Lincoln Map
Lincoln Overview
3,638
TOTAL POPULATION
1,854
MALE POPULATION
1,784
FEMALE POPULATION
103.92
MALES / 100 FEMALES
96.22
FEMALES / 100 MALES
29.4
MEDIAN AGE
3.4
AVG FAMILY SIZE
3.1
AVG HOUSEHOLD SIZE
$27,405
PER CAPITA INCOME
$78,013
AVG FAMILY INCOME
$77,623
AVG HOUSEHOLD INCOME
45.0%
WAGE / INCOME GAP [ % ]
55.0¢/ $1
WAGE / INCOME GAP [ $ ]
0.33
INEQUALITY / GINI INDEX
1,769
LABOR FORCE [ PEOPLE ]
77.6%
PERCENT IN LABOR FORCE
5.7%
UNEMPLOYMENT RATE
Race in Lincoln
The most populous races in Lincoln are White / Caucasian (2,929 | 80.5%), Hispanic or Latino (575 | 15.8%), and Some other Race (439 | 12.1%).
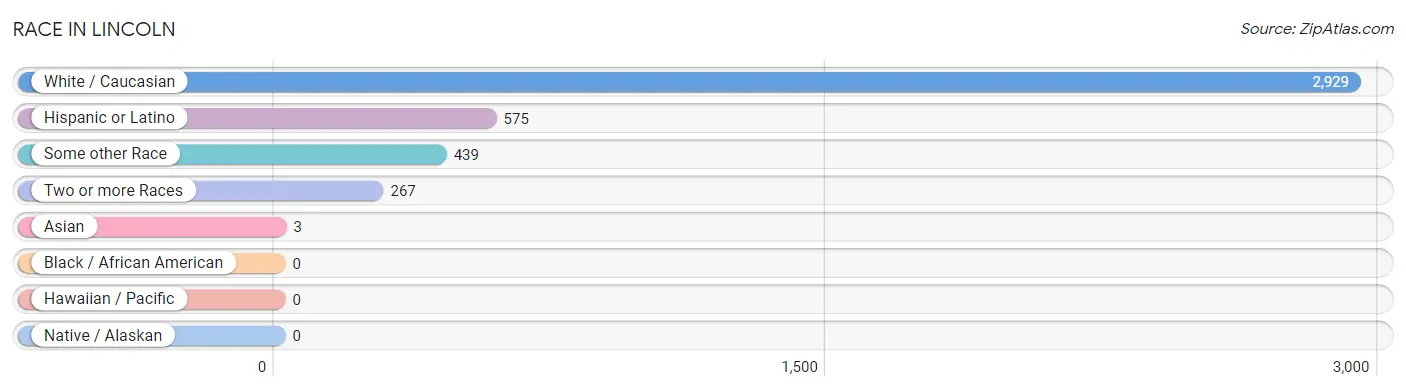
| Race | # Population | % Population |
| Asian | 3 | 0.1% |
| Black / African American | 0 | 0.0% |
| Hawaiian / Pacific | 0 | 0.0% |
| Hispanic or Latino | 575 | 15.8% |
| Native / Alaskan | 0 | 0.0% |
| White / Caucasian | 2,929 | 80.5% |
| Two or more Races | 267 | 7.3% |
| Some other Race | 439 | 12.1% |
| Total | 3,638 | 100.0% |
Ancestry in Lincoln
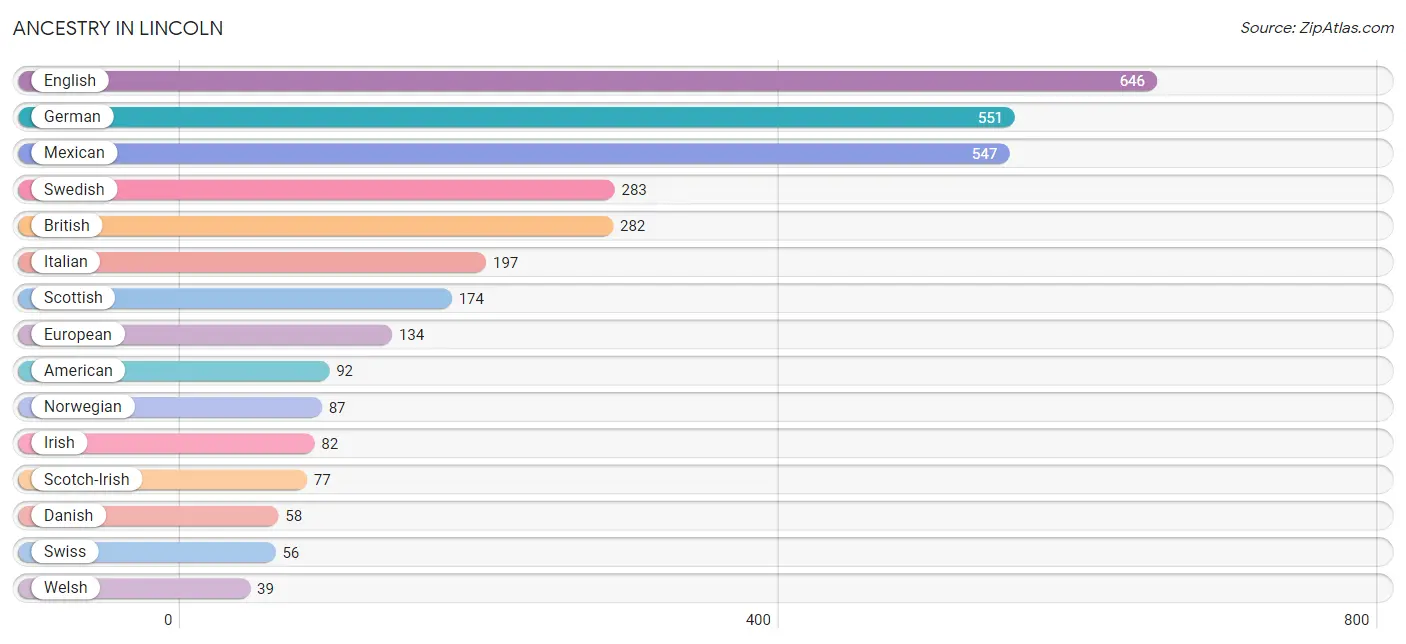
The most populous ancestries reported in Lincoln are English (646 | 17.8%), German (551 | 15.1%), Mexican (547 | 15.0%), Swedish (283 | 7.8%), and British (282 | 7.7%), together accounting for 63.5% of all Lincoln residents.
| Ancestry | # Population | % Population |
| African | 12 | 0.3% |
| American | 92 | 2.5% |
| Austrian | 26 | 0.7% |
| Basque | 7 | 0.2% |
| Bhutanese | 22 | 0.6% |
| Brazilian | 22 | 0.6% |
| British | 282 | 7.7% |
| Cherokee | 2 | 0.1% |
| Cuban | 28 | 0.8% |
| Czech | 17 | 0.5% |
| Danish | 58 | 1.6% |
| Dutch | 30 | 0.8% |
| English | 646 | 17.8% |
| European | 134 | 3.7% |
| French | 38 | 1.0% |
| French Canadian | 21 | 0.6% |
| German | 551 | 15.1% |
| Greek | 11 | 0.3% |
| Indian (Asian) | 3 | 0.1% |
| Irish | 82 | 2.2% |
| Italian | 197 | 5.4% |
| Lithuanian | 21 | 0.6% |
| Mexican | 547 | 15.0% |
| New Zealander | 8 | 0.2% |
| Northern European | 2 | 0.1% |
| Norwegian | 87 | 2.4% |
| Scotch-Irish | 77 | 2.1% |
| Scottish | 174 | 4.8% |
| Subsaharan African | 12 | 0.3% |
| Swedish | 283 | 7.8% |
| Swiss | 56 | 1.5% |
| Welsh | 39 | 1.1% | View All 32 Rows |
Immigrants in Lincoln
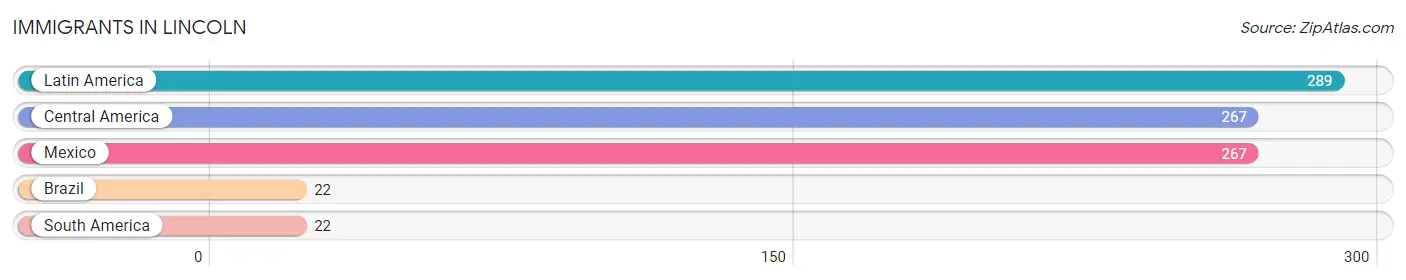
The most numerous immigrant groups reported in Lincoln came from Latin America (289 | 7.9%), Central America (267 | 7.3%), Mexico (267 | 7.3%), Brazil (22 | 0.6%), and South America (22 | 0.6%), together accounting for 23.8% of all Lincoln residents.
| Immigration Origin | # Population | % Population |
| Brazil | 22 | 0.6% |
| Central America | 267 | 7.3% |
| Latin America | 289 | 7.9% |
| Mexico | 267 | 7.3% |
| South America | 22 | 0.6% | View All 5 Rows |
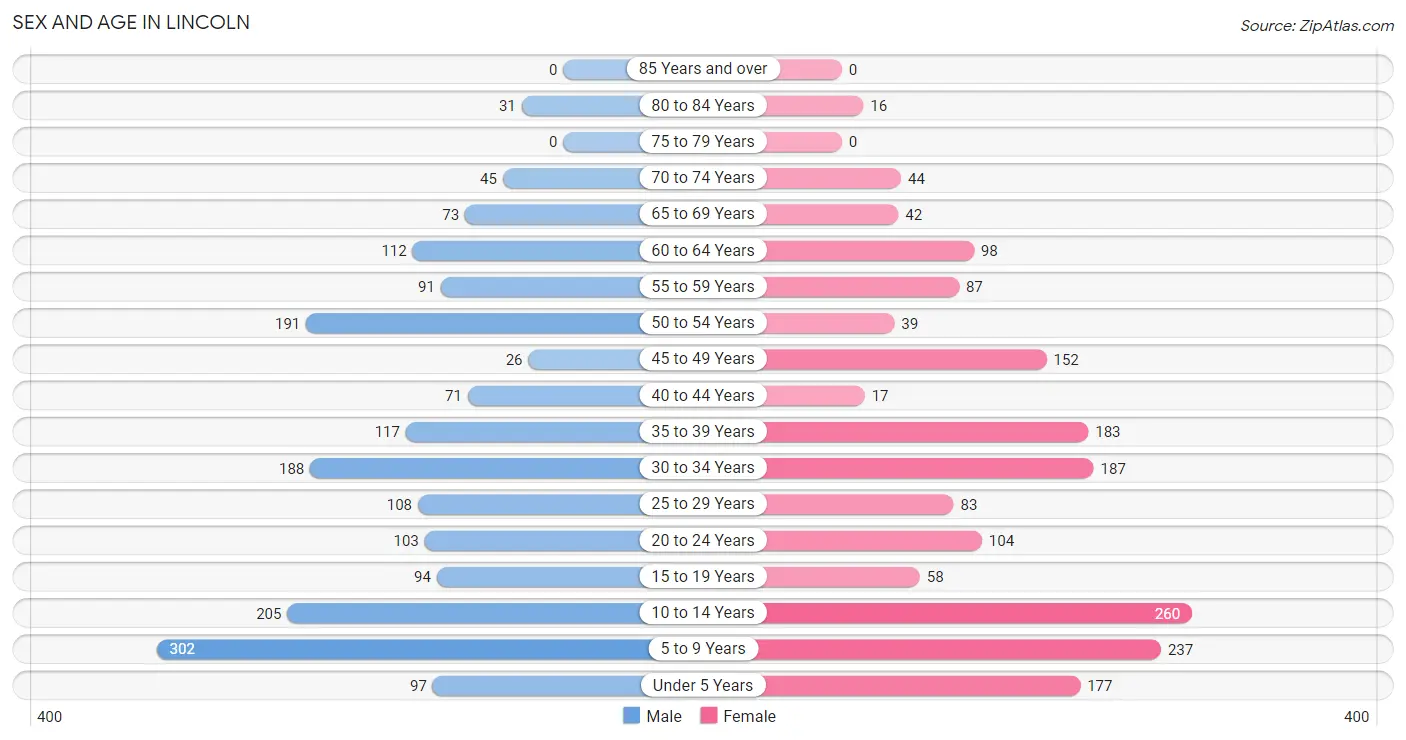
Sex and Age in Lincoln
Sex and Age in Lincoln
The most populous age groups in Lincoln are 5 to 9 Years (302 | 16.3%) for men and 10 to 14 Years (260 | 14.6%) for women.
| Age Bracket | Male | Female |
| Under 5 Years | 97 (5.2%) | 177 (9.9%) |
| 5 to 9 Years | 302 (16.3%) | 237 (13.3%) |
| 10 to 14 Years | 205 (11.1%) | 260 (14.6%) |
| 15 to 19 Years | 94 (5.1%) | 58 (3.3%) |
| 20 to 24 Years | 103 (5.6%) | 104 (5.8%) |
| 25 to 29 Years | 108 (5.8%) | 83 (4.6%) |
| 30 to 34 Years | 188 (10.1%) | 187 (10.5%) |
| 35 to 39 Years | 117 (6.3%) | 183 (10.3%) |
| 40 to 44 Years | 71 (3.8%) | 17 (0.9%) |
| 45 to 49 Years | 26 (1.4%) | 152 (8.5%) |
| 50 to 54 Years | 191 (10.3%) | 39 (2.2%) |
| 55 to 59 Years | 91 (4.9%) | 87 (4.9%) |
| 60 to 64 Years | 112 (6.0%) | 98 (5.5%) |
| 65 to 69 Years | 73 (3.9%) | 42 (2.4%) |
| 70 to 74 Years | 45 (2.4%) | 44 (2.5%) |
| 75 to 79 Years | 0 (0.0%) | 0 (0.0%) |
| 80 to 84 Years | 31 (1.7%) | 16 (0.9%) |
| 85 Years and over | 0 (0.0%) | 0 (0.0%) |
| Total | 1,854 (100.0%) | 1,784 (100.0%) |
Families and Households in Lincoln
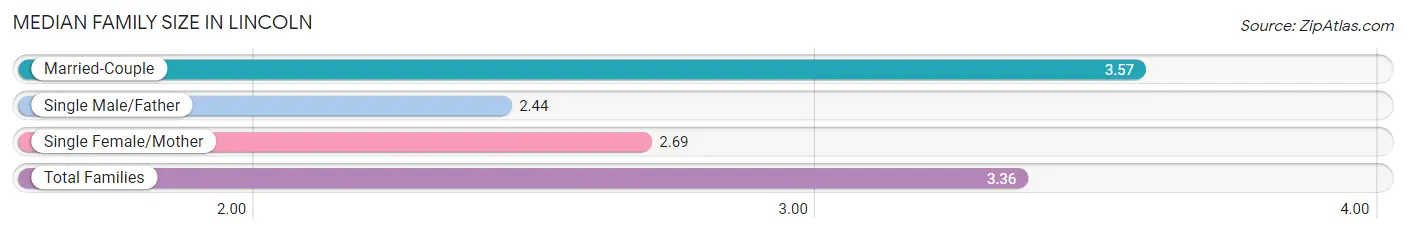
Median Family Size in Lincoln
The median family size in Lincoln is 3.36 persons per family, with married-couple families (743 | 76.8%) accounting for the largest median family size of 3.57 persons per family. On the other hand, single male/father families (48 | 5.0%) represent the smallest median family size with 2.44 persons per family.
| Family Type | # Families | Family Size |
| Married-Couple | 743 (76.8%) | 3.57 |
| Single Male/Father | 48 (5.0%) | 2.44 |
| Single Female/Mother | 177 (18.3%) | 2.69 |
| Total Families | 968 (100.0%) | 3.36 |
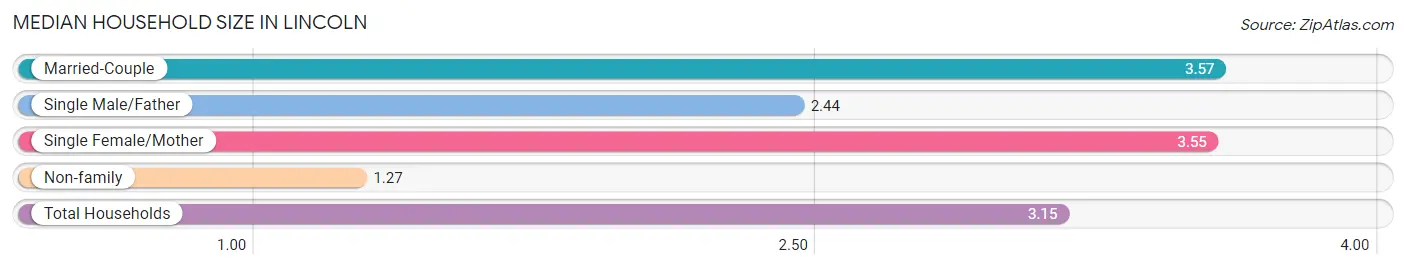
Median Household Size in Lincoln
The median household size in Lincoln is 3.15 persons per household, with married-couple households (743 | 64.4%) accounting for the largest median household size of 3.57 persons per household. non-family households (186 | 16.1%) represent the smallest median household size with 1.27 persons per household.
| Household Type | # Households | Household Size |
| Married-Couple | 743 (64.4%) | 3.57 |
| Single Male/Father | 48 (4.2%) | 2.44 |
| Single Female/Mother | 177 (15.3%) | 3.55 |
| Non-family | 186 (16.1%) | 1.27 |
| Total Households | 1,154 (100.0%) | 3.15 |
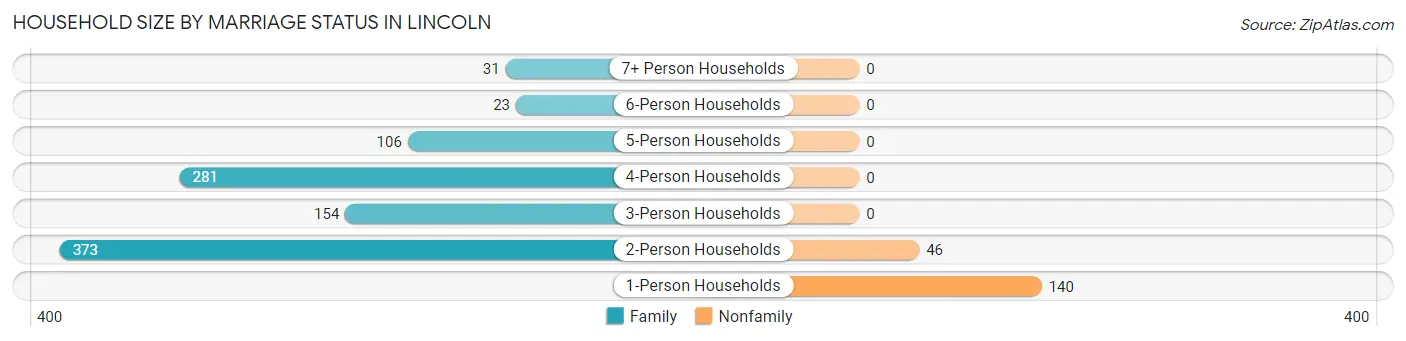
Household Size by Marriage Status in Lincoln
Out of a total of 1,154 households in Lincoln, 968 (83.9%) are family households, while 186 (16.1%) are nonfamily households. The most numerous type of family households are 2-person households, comprising 373, and the most common type of nonfamily households are 1-person households, comprising 140.
| Household Size | Family Households | Nonfamily Households |
| 1-Person Households | - | 140 (12.1%) |
| 2-Person Households | 373 (32.3%) | 46 (4.0%) |
| 3-Person Households | 154 (13.3%) | 0 (0.0%) |
| 4-Person Households | 281 (24.3%) | 0 (0.0%) |
| 5-Person Households | 106 (9.2%) | 0 (0.0%) |
| 6-Person Households | 23 (2.0%) | 0 (0.0%) |
| 7+ Person Households | 31 (2.7%) | 0 (0.0%) |
| Total | 968 (83.9%) | 186 (16.1%) |
Female Fertility in Lincoln
Fertility by Age in Lincoln
Average fertility rate in Lincoln is 103.0 births per 1,000 women. Women in the age bracket of 20 to 34 years have the highest fertility rate with 217.0 births per 1,000 women. Women in the age bracket of 20 to 34 years acount for 100.0% of all women with births.
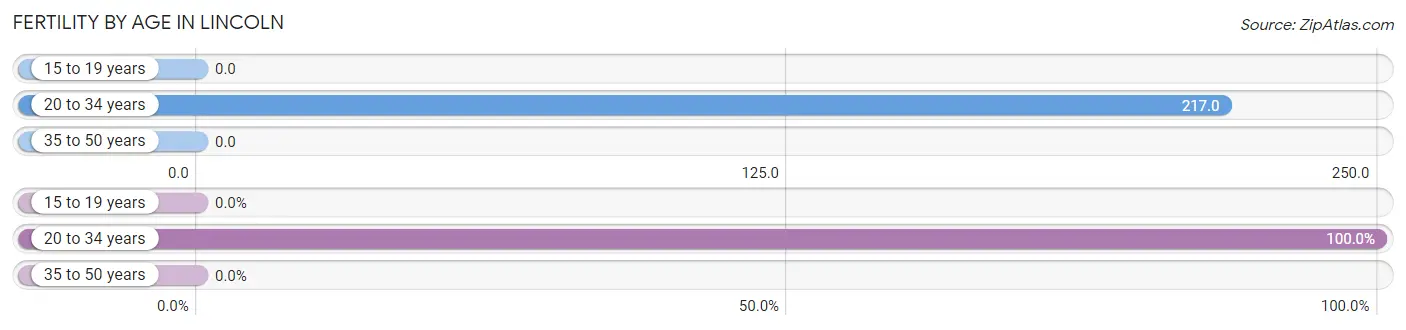
| Age Bracket | Women with Births | Births / 1,000 Women |
| 15 to 19 years | 0 (0.0%) | 0.0 |
| 20 to 34 years | 81 (100.0%) | 217.0 |
| 35 to 50 years | 0 (0.0%) | 0.0 |
| Total | 81 (100.0%) | 103.0 |
Fertility by Age by Marriage Status in Lincoln
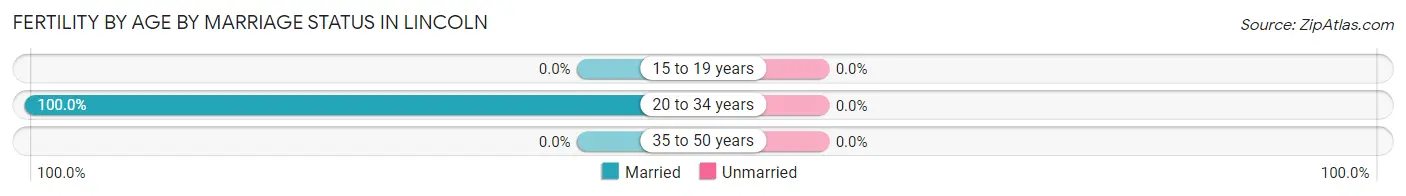
| Age Bracket | Married | Unmarried |
| 15 to 19 years | 0 (0.0%) | 0 (0.0%) |
| 20 to 34 years | 81 (100.0%) | 0 (0.0%) |
| 35 to 50 years | 0 (0.0%) | 0 (0.0%) |
| Total | 81 (100.0%) | 0 (0.0%) |
Fertility by Education in Lincoln
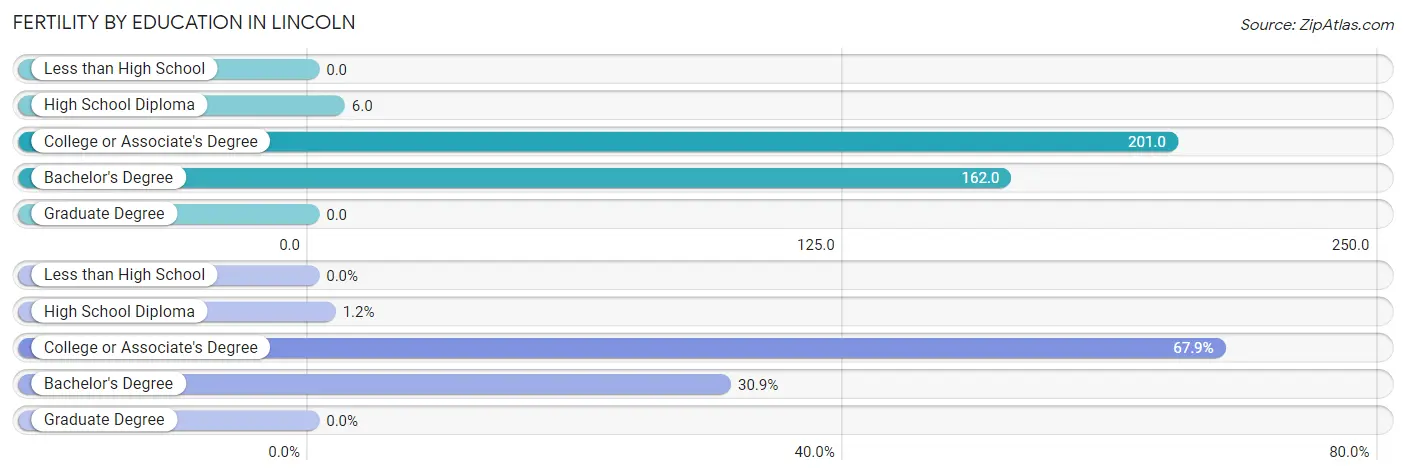
| Educational Attainment | Women with Births | Births / 1,000 Women |
| Less than High School | 0 (0.0%) | 0.0 |
| High School Diploma | 1 (1.2%) | 6.0 |
| College or Associate's Degree | 55 (67.9%) | 201.0 |
| Bachelor's Degree | 25 (30.9%) | 162.0 |
| Graduate Degree | 0 (0.0%) | 0.0 |
| Total | 81 (100.0%) | 103.0 |
Fertility by Education by Marriage Status in Lincoln
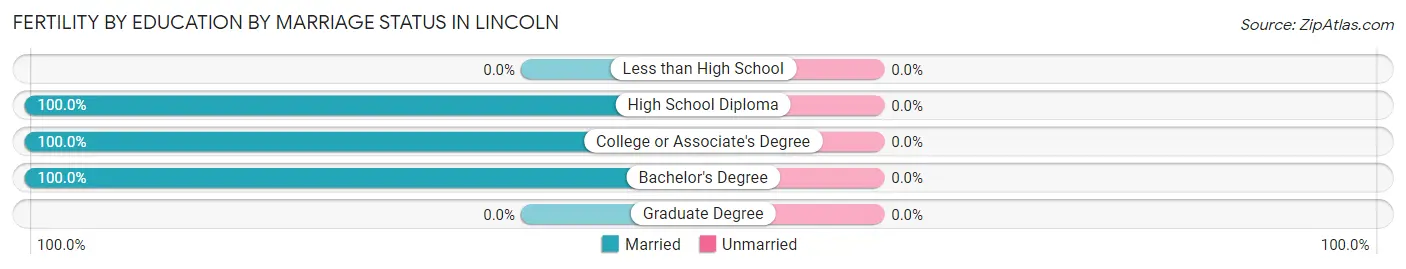
| Educational Attainment | Married | Unmarried |
| Less than High School | 0 (0.0%) | 0 (0.0%) |
| High School Diploma | 1 (100.0%) | 0 (0.0%) |
| College or Associate's Degree | 55 (100.0%) | 0 (0.0%) |
| Bachelor's Degree | 25 (100.0%) | 0 (0.0%) |
| Graduate Degree | 0 (0.0%) | 0 (0.0%) |
| Total | 81 (100.0%) | 0 (0.0%) |
Income in Lincoln
Income Overview in Lincoln
Per Capita Income in Lincoln is $27,405, while median incomes of families and households are $78,013 and $77,623 respectively.
| Characteristic | Number | Measure |
| Per Capita Income | 3,638 | $27,405 |
| Median Family Income | 968 | $78,013 |
| Mean Family Income | 968 | $83,567 |
| Median Household Income | 1,154 | $77,623 |
| Mean Household Income | 1,154 | $84,695 |
| Income Deficit | 968 | $0 |
| Wage / Income Gap (%) | 3,638 | 45.05% |
| Wage / Income Gap ($) | 3,638 | 54.95¢ per $1 |
| Gini / Inequality Index | 3,638 | 0.33 |
Earnings by Sex in Lincoln
Average Earnings in Lincoln are $37,765, $39,895 for men and $21,923 for women, a difference of 45.1%.
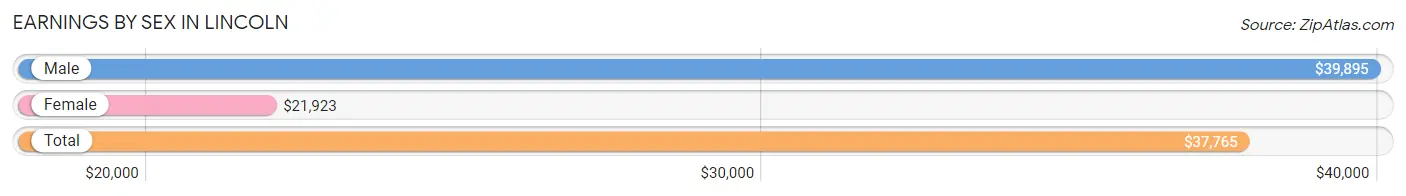
| Sex | Number | Average Earnings |
| Male | 989 (52.6%) | $39,895 |
| Female | 890 (47.4%) | $21,923 |
| Total | 1,879 (100.0%) | $37,765 |
Earnings by Sex by Income Bracket in Lincoln
The most common earnings brackets in Lincoln are $35,000 to $39,999 for men (227 | 23.0%) and $2,500 to $4,999 for women (100 | 11.2%).
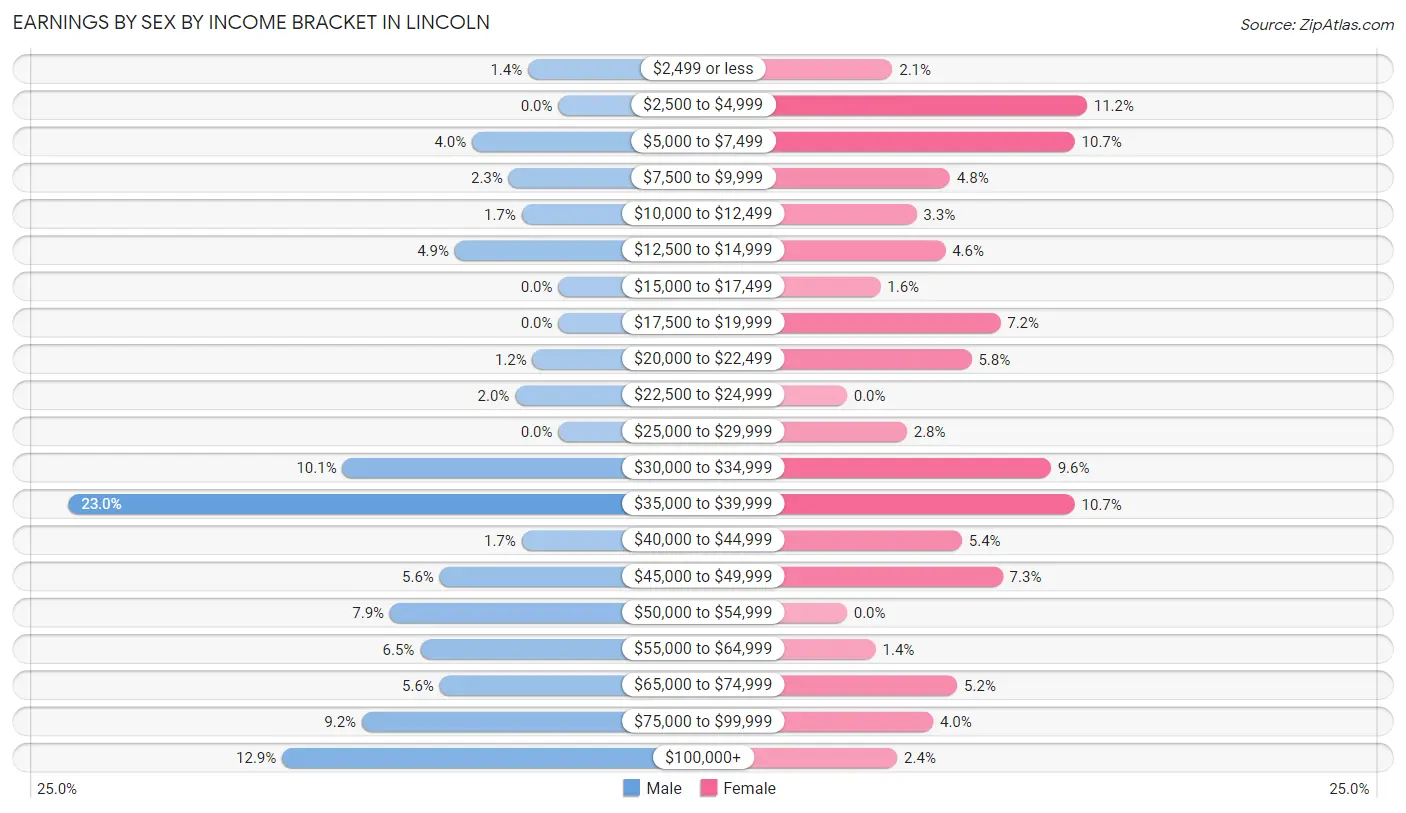
| Income | Male | Female |
| $2,499 or less | 14 (1.4%) | 19 (2.1%) |
| $2,500 to $4,999 | 0 (0.0%) | 100 (11.2%) |
| $5,000 to $7,499 | 40 (4.0%) | 95 (10.7%) |
| $7,500 to $9,999 | 23 (2.3%) | 43 (4.8%) |
| $10,000 to $12,499 | 17 (1.7%) | 29 (3.3%) |
| $12,500 to $14,999 | 48 (4.9%) | 41 (4.6%) |
| $15,000 to $17,499 | 0 (0.0%) | 14 (1.6%) |
| $17,500 to $19,999 | 0 (0.0%) | 64 (7.2%) |
| $20,000 to $22,499 | 12 (1.2%) | 52 (5.8%) |
| $22,500 to $24,999 | 20 (2.0%) | 0 (0.0%) |
| $25,000 to $29,999 | 0 (0.0%) | 25 (2.8%) |
| $30,000 to $34,999 | 100 (10.1%) | 85 (9.6%) |
| $35,000 to $39,999 | 227 (23.0%) | 95 (10.7%) |
| $40,000 to $44,999 | 17 (1.7%) | 48 (5.4%) |
| $45,000 to $49,999 | 55 (5.6%) | 65 (7.3%) |
| $50,000 to $54,999 | 78 (7.9%) | 0 (0.0%) |
| $55,000 to $64,999 | 64 (6.5%) | 12 (1.3%) |
| $65,000 to $74,999 | 55 (5.6%) | 46 (5.2%) |
| $75,000 to $99,999 | 91 (9.2%) | 36 (4.0%) |
| $100,000+ | 128 (12.9%) | 21 (2.4%) |
| Total | 989 (100.0%) | 890 (100.0%) |
Earnings by Sex by Educational Attainment in Lincoln
Average earnings in Lincoln are $46,620 for men and $30,605 for women, a difference of 34.4%. Men with an educational attainment of bachelor's degree enjoy the highest average annual earnings of $75,635, while those with high school diploma education earn the least with $35,568. Women with an educational attainment of college or associate's degree earn the most with the average annual earnings of $31,563, while those with graduate degree education have the smallest earnings of $13,266.
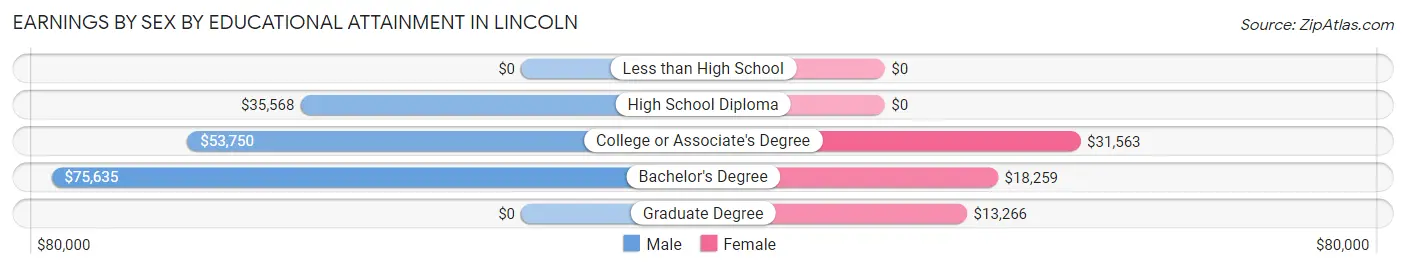
| Educational Attainment | Male Income | Female Income |
| Less than High School | - | - |
| High School Diploma | $35,568 | $0 |
| College or Associate's Degree | $53,750 | $31,563 |
| Bachelor's Degree | $75,635 | $18,259 |
| Graduate Degree | - | - |
| Total | $46,620 | $30,605 |
Family Income in Lincoln
Family Income Brackets in Lincoln
According to the Lincoln family income data, there are 360 families falling into the $75,000 to $99,999 income range, which is the most common income bracket and makes up 37.2% of all families.
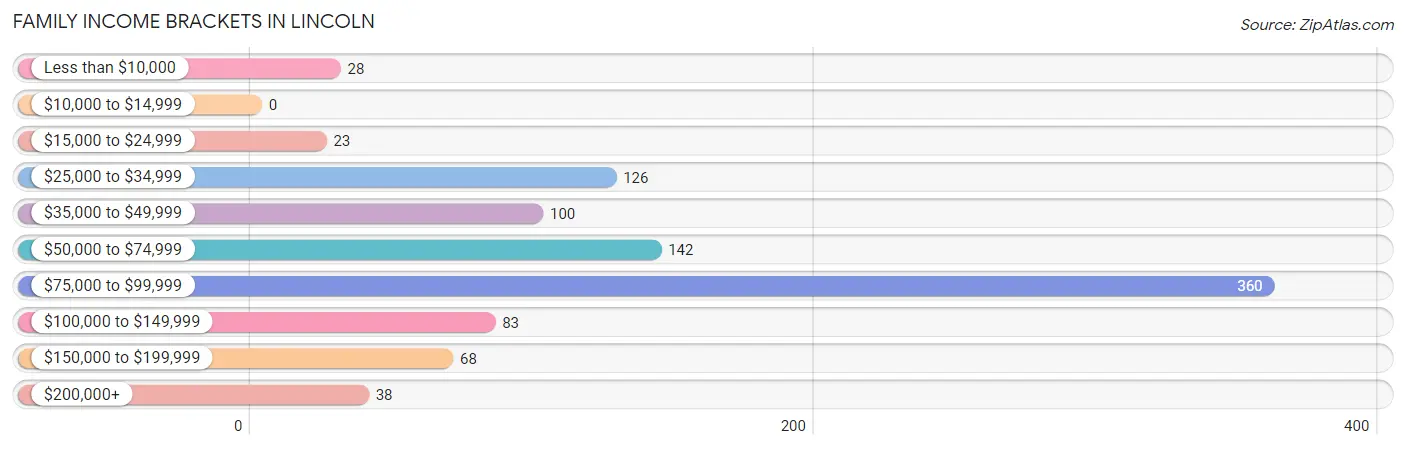
| Income Bracket | # Families | % Families |
| Less than $10,000 | 28 | 2.9% |
| $10,000 to $14,999 | 0 | 0.0% |
| $15,000 to $24,999 | 23 | 2.4% |
| $25,000 to $34,999 | 126 | 13.0% |
| $35,000 to $49,999 | 100 | 10.3% |
| $50,000 to $74,999 | 142 | 14.7% |
| $75,000 to $99,999 | 360 | 37.2% |
| $100,000 to $149,999 | 83 | 8.6% |
| $150,000 to $199,999 | 68 | 7.0% |
| $200,000+ | 38 | 3.9% |
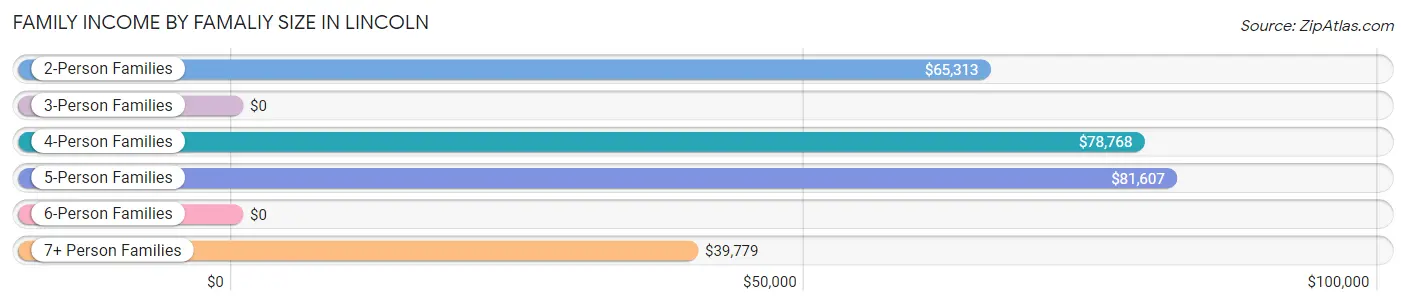
Family Income by Famaliy Size in Lincoln
5-person families (105 | 10.8%) account for the highest median family income in Lincoln with $81,607 per family, while 2-person families (458 | 47.3%) have the highest median income of $32,656 per family member.
| Income Bracket | # Families | Median Income |
| 2-Person Families | 458 (47.3%) | $65,313 |
| 3-Person Families | 82 (8.5%) | $0 |
| 4-Person Families | 281 (29.0%) | $78,768 |
| 5-Person Families | 105 (10.8%) | $81,607 |
| 6-Person Families | 11 (1.1%) | $0 |
| 7+ Person Families | 31 (3.2%) | $39,779 |
| Total | 968 (100.0%) | $78,013 |
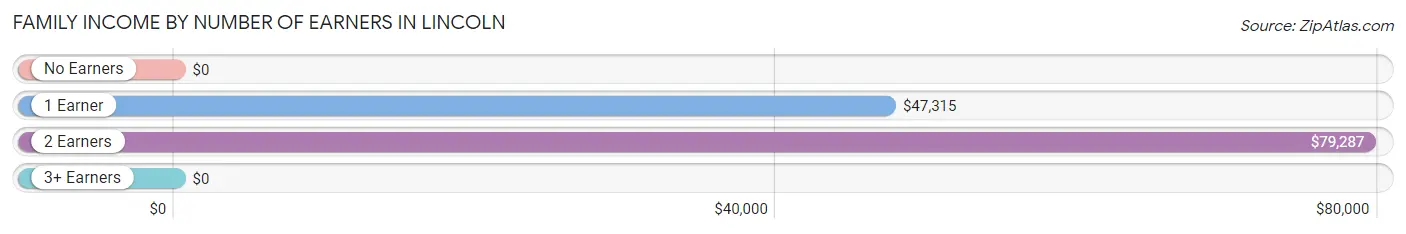
Family Income by Number of Earners in Lincoln
| Number of Earners | # Families | Median Income |
| No Earners | 86 (8.9%) | $0 |
| 1 Earner | 264 (27.3%) | $47,315 |
| 2 Earners | 597 (61.7%) | $79,287 |
| 3+ Earners | 21 (2.2%) | $0 |
| Total | 968 (100.0%) | $78,013 |
Household Income in Lincoln
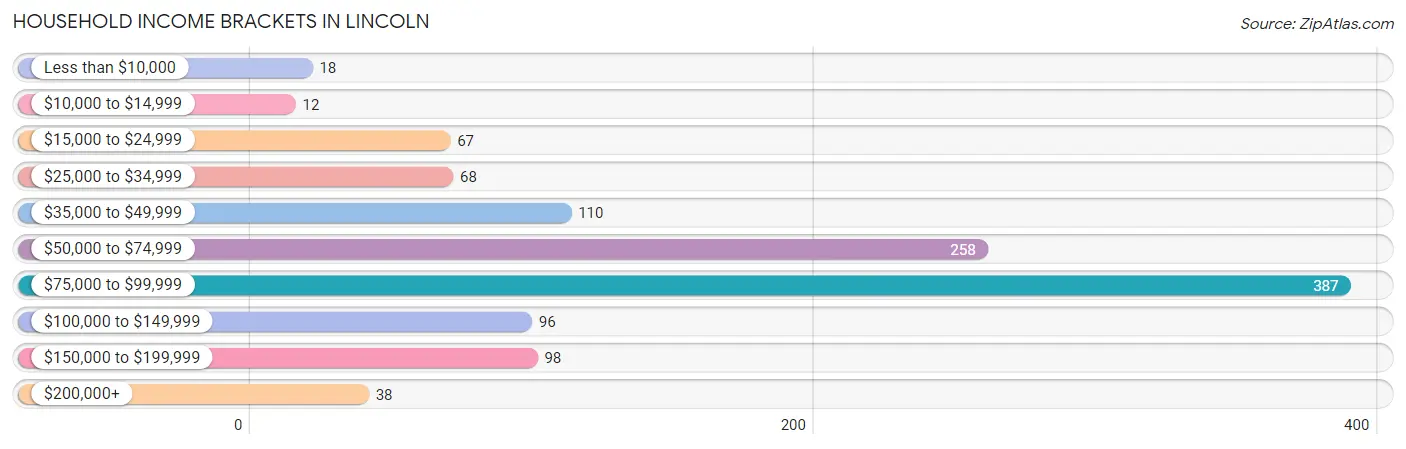
Household Income Brackets in Lincoln
With 387 households falling in the category, the $75,000 to $99,999 income range is the most frequent in Lincoln, accounting for 33.5% of all households. In contrast, only 12 households (1.0%) fall into the $10,000 to $14,999 income bracket, making it the least populous group.
| Income Bracket | # Households | % Households |
| Less than $10,000 | 18 | 1.6% |
| $10,000 to $14,999 | 12 | 1.0% |
| $15,000 to $24,999 | 67 | 5.8% |
| $25,000 to $34,999 | 68 | 5.9% |
| $35,000 to $49,999 | 110 | 9.5% |
| $50,000 to $74,999 | 258 | 22.4% |
| $75,000 to $99,999 | 387 | 33.5% |
| $100,000 to $149,999 | 96 | 8.3% |
| $150,000 to $199,999 | 98 | 8.5% |
| $200,000+ | 38 | 3.3% |
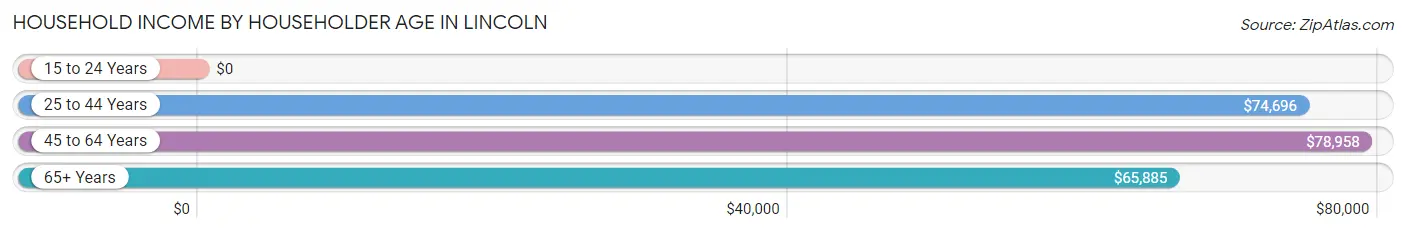
Household Income by Householder Age in Lincoln
The median household income in Lincoln is $77,623, with the highest median household income of $78,958 found in the 45 to 64 years age bracket for the primary householder. A total of 418 households (36.2%) fall into this category. Meanwhile, the 15 to 24 years age bracket for the primary householder has the lowest median household income of $0, with 48 households (4.2%) in this group.
| Income Bracket | # Households | Median Income |
| 15 to 24 Years | 48 (4.2%) | $0 |
| 25 to 44 Years | 509 (44.1%) | $74,696 |
| 45 to 64 Years | 418 (36.2%) | $78,958 |
| 65+ Years | 179 (15.5%) | $65,885 |
| Total | 1,154 (100.0%) | $77,623 |
Poverty in Lincoln
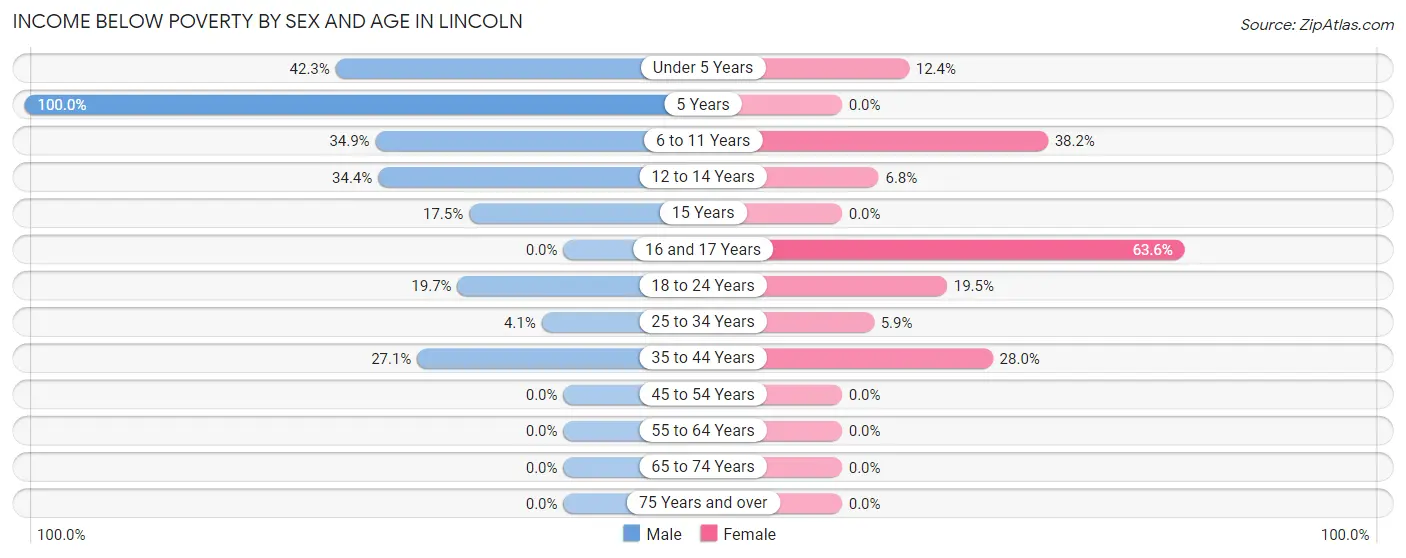
Income Below Poverty by Sex and Age in Lincoln
With 17.6% poverty level for males and 14.3% for females among the residents of Lincoln, 5 year old males and 16 and 17 year old females are the most vulnerable to poverty, with 14 males (100.0%) and 28 females (63.6%) in their respective age groups living below the poverty level.
| Age Bracket | Male | Female |
| Under 5 Years | 41 (42.3%) | 22 (12.4%) |
| 5 Years | 14 (100.0%) | 0 (0.0%) |
| 6 to 11 Years | 105 (34.9%) | 99 (38.2%) |
| 12 to 14 Years | 66 (34.4%) | 12 (6.8%) |
| 15 Years | 14 (17.5%) | 0 (0.0%) |
| 16 and 17 Years | 0 (0.0%) | 28 (63.6%) |
| 18 to 24 Years | 23 (19.7%) | 23 (19.5%) |
| 25 to 34 Years | 12 (4.1%) | 16 (5.9%) |
| 35 to 44 Years | 51 (27.1%) | 56 (28.0%) |
| 45 to 54 Years | 0 (0.0%) | 0 (0.0%) |
| 55 to 64 Years | 0 (0.0%) | 0 (0.0%) |
| 65 to 74 Years | 0 (0.0%) | 0 (0.0%) |
| 75 Years and over | 0 (0.0%) | 0 (0.0%) |
| Total | 326 (17.6%) | 256 (14.3%) |
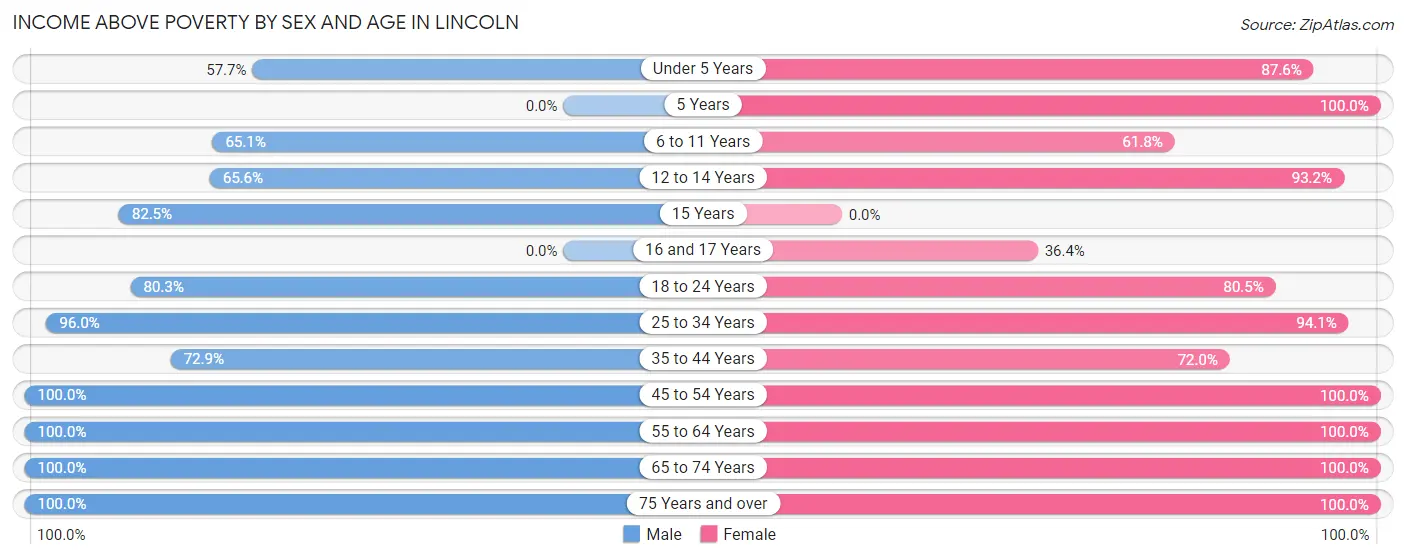
Income Above Poverty by Sex and Age in Lincoln
According to the poverty statistics in Lincoln, males aged 45 to 54 years and females aged 5 years are the age groups that are most secure financially, with 100.0% of males and 100.0% of females in these age groups living above the poverty line.
| Age Bracket | Male | Female |
| Under 5 Years | 56 (57.7%) | 155 (87.6%) |
| 5 Years | 0 (0.0%) | 62 (100.0%) |
| 6 to 11 Years | 196 (65.1%) | 160 (61.8%) |
| 12 to 14 Years | 126 (65.6%) | 164 (93.2%) |
| 15 Years | 66 (82.5%) | 0 (0.0%) |
| 16 and 17 Years | 0 (0.0%) | 16 (36.4%) |
| 18 to 24 Years | 94 (80.3%) | 95 (80.5%) |
| 25 to 34 Years | 284 (96.0%) | 254 (94.1%) |
| 35 to 44 Years | 137 (72.9%) | 144 (72.0%) |
| 45 to 54 Years | 217 (100.0%) | 191 (100.0%) |
| 55 to 64 Years | 203 (100.0%) | 185 (100.0%) |
| 65 to 74 Years | 118 (100.0%) | 86 (100.0%) |
| 75 Years and over | 31 (100.0%) | 16 (100.0%) |
| Total | 1,528 (82.4%) | 1,528 (85.7%) |
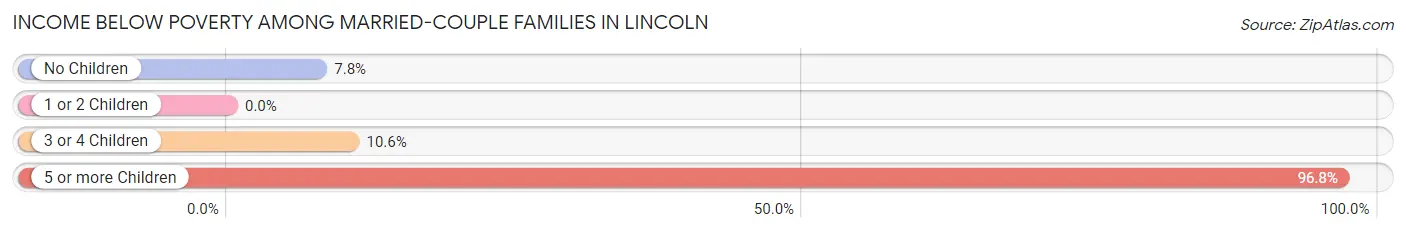
Income Below Poverty Among Married-Couple Families in Lincoln
The poverty statistics for married-couple families in Lincoln show that 8.6% or 64 of the total 743 families live below the poverty line. Families with 5 or more children have the highest poverty rate of 96.8%, comprising of 30 families. On the other hand, families with 1 or 2 children have the lowest poverty rate of 0.0%, which includes 0 families.
| Children | Above Poverty | Below Poverty |
| No Children | 273 (92.2%) | 23 (7.8%) |
| 1 or 2 Children | 312 (100.0%) | 0 (0.0%) |
| 3 or 4 Children | 93 (89.4%) | 11 (10.6%) |
| 5 or more Children | 1 (3.2%) | 30 (96.8%) |
| Total | 679 (91.4%) | 64 (8.6%) |
Income Below Poverty Among Single-Parent Households in Lincoln
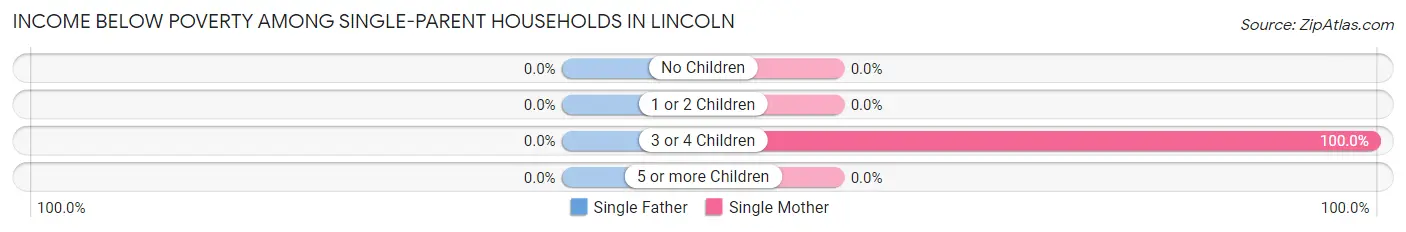
| Children | Single Father | Single Mother |
| No Children | 0 (0.0%) | 0 (0.0%) |
| 1 or 2 Children | 0 (0.0%) | 0 (0.0%) |
| 3 or 4 Children | 0 (0.0%) | 28 (100.0%) |
| 5 or more Children | 0 (0.0%) | 0 (0.0%) |
| Total | 0 (0.0%) | 28 (15.8%) |
Income Below Poverty Among Married-Couple vs Single-Parent Households in Lincoln
The poverty data for Lincoln shows that 64 of the married-couple family households (8.6%) and 28 of the single-parent households (12.4%) are living below the poverty level. Within the married-couple family households, those with 5 or more children have the highest poverty rate, with 30 households (96.8%) falling below the poverty line. Among the single-parent households, those with 3 or 4 children have the highest poverty rate, with 28 household (100.0%) living below poverty.
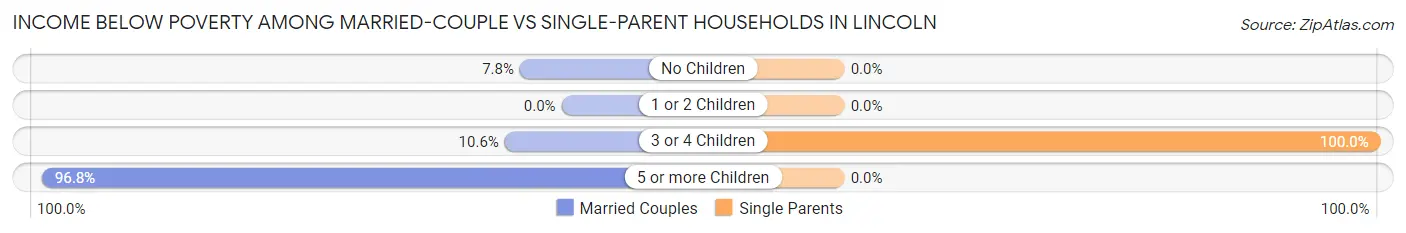
| Children | Married-Couple Families | Single-Parent Households |
| No Children | 23 (7.8%) | 0 (0.0%) |
| 1 or 2 Children | 0 (0.0%) | 0 (0.0%) |
| 3 or 4 Children | 11 (10.6%) | 28 (100.0%) |
| 5 or more Children | 30 (96.8%) | 0 (0.0%) |
| Total | 64 (8.6%) | 28 (12.4%) |
Employment Characteristics in Lincoln
Employment by Class of Employer in Lincoln
Among the 1,642 employed individuals in Lincoln, private company employees (1,270 | 77.3%), local government employees (131 | 8.0%), and self-employed (not incorporated) (115 | 7.0%) make up the most common classes of employment.
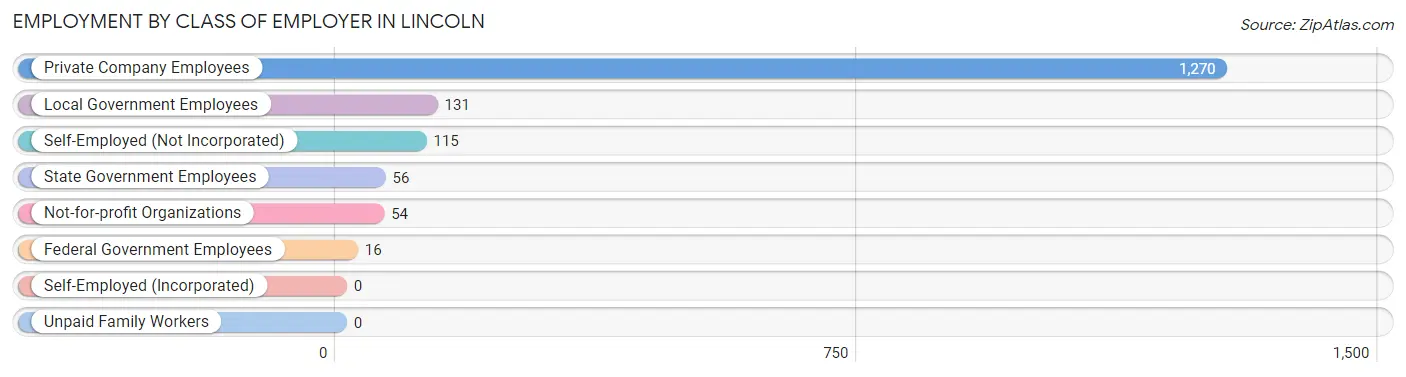
| Employer Class | # Employees | % Employees |
| Private Company Employees | 1,270 | 77.3% |
| Self-Employed (Incorporated) | 0 | 0.0% |
| Self-Employed (Not Incorporated) | 115 | 7.0% |
| Not-for-profit Organizations | 54 | 3.3% |
| Local Government Employees | 131 | 8.0% |
| State Government Employees | 56 | 3.4% |
| Federal Government Employees | 16 | 1.0% |
| Unpaid Family Workers | 0 | 0.0% |
| Total | 1,642 | 100.0% |
Employment Status by Age in Lincoln
According to the labor force statistics for Lincoln, out of the total population over 16 years of age (2,280), 77.6% or 1,769 individuals are in the labor force, with 5.7% or 101 of them unemployed. The age group with the highest labor force participation rate is 45 to 54 years, with 93.4% or 381 individuals in the labor force. Within the labor force, the 65 to 74 years age range has the highest percentage of unemployed individuals, with 27.1% or 19 of them being unemployed.
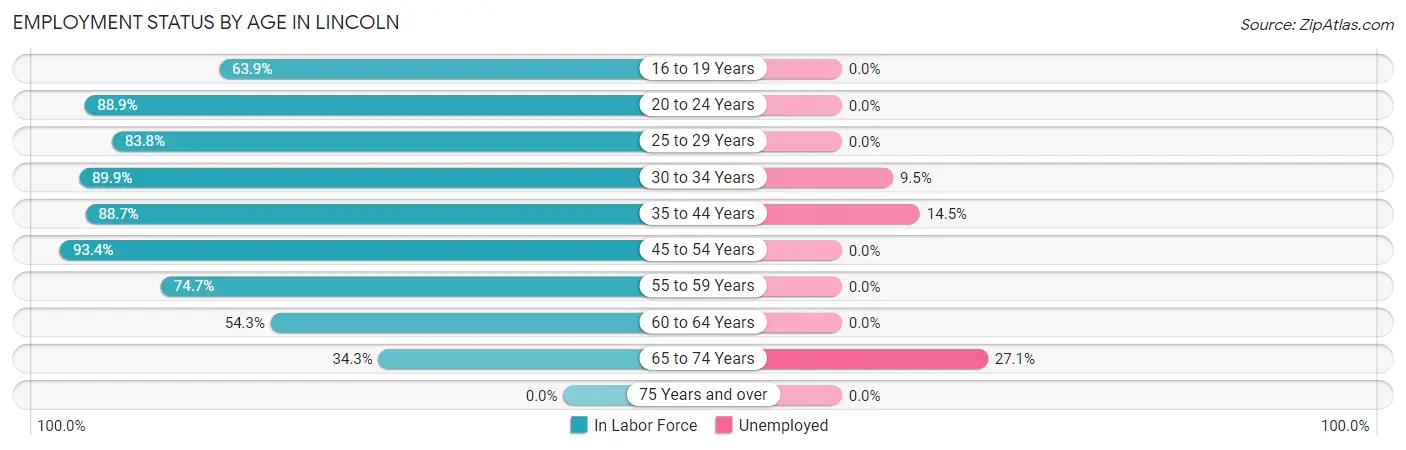
| Age Bracket | In Labor Force | Unemployed |
| 16 to 19 Years | 46 (63.9%) | 0 (0.0%) |
| 20 to 24 Years | 184 (88.9%) | 0 (0.0%) |
| 25 to 29 Years | 160 (83.8%) | 0 (0.0%) |
| 30 to 34 Years | 337 (89.9%) | 32 (9.5%) |
| 35 to 44 Years | 344 (88.7%) | 50 (14.5%) |
| 45 to 54 Years | 381 (93.4%) | 0 (0.0%) |
| 55 to 59 Years | 133 (74.7%) | 0 (0.0%) |
| 60 to 64 Years | 114 (54.3%) | 0 (0.0%) |
| 65 to 74 Years | 70 (34.3%) | 19 (27.1%) |
| 75 Years and over | 0 (0.0%) | 0 (0.0%) |
| Total | 1,769 (77.6%) | 101 (5.7%) |
Employment Status by Educational Attainment in Lincoln
According to labor force statistics for Lincoln, 83.9% of individuals (1,468) out of the total population between 25 and 64 years of age (1,750) are in the labor force, with 5.6% or 82 of them being unemployed. The group with the highest labor force participation rate are those with the educational attainment of high school diploma, with 85.7% or 222 individuals in the labor force. Within the labor force, individuals with high school diploma education have the highest percentage of unemployment, with 14.9% or 33 of them being unemployed.
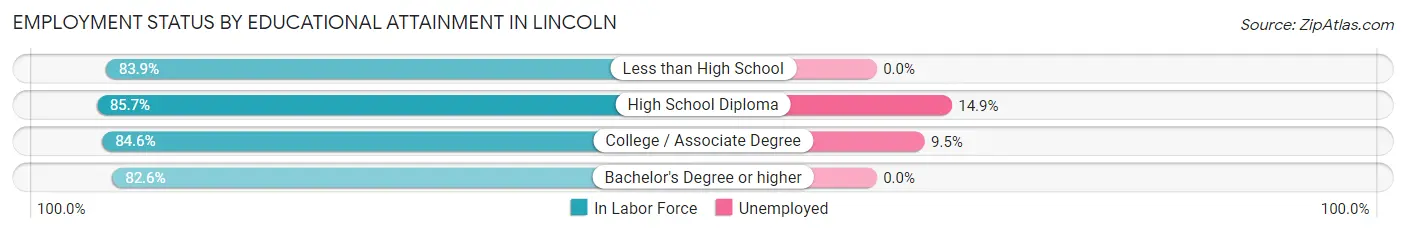
| Educational Attainment | In Labor Force | Unemployed |
| Less than High School | 234 (83.9%) | 0 (0.0%) |
| High School Diploma | 222 (85.7%) | 39 (14.9%) |
| College / Associate Degree | 515 (84.6%) | 58 (9.5%) |
| Bachelor's Degree or higher | 498 (82.6%) | 0 (0.0%) |
| Total | 1,468 (83.9%) | 98 (5.6%) |
Employment Occupations by Sex in Lincoln
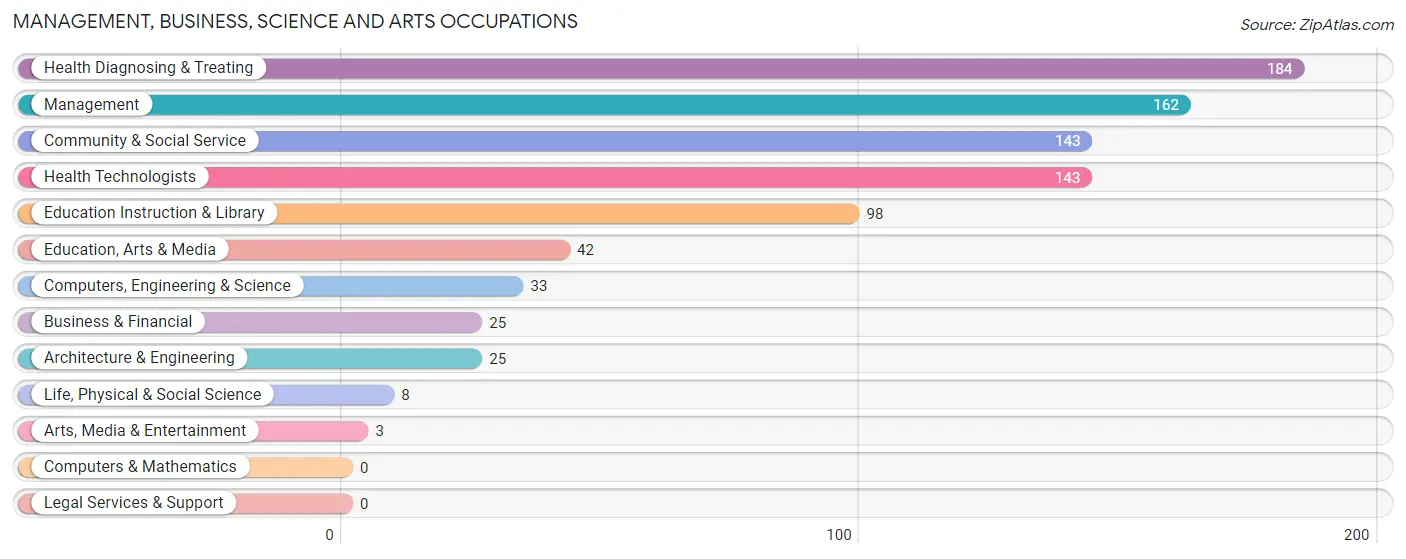
Management, Business, Science and Arts Occupations
The most common Management, Business, Science and Arts occupations in Lincoln are Health Diagnosing & Treating (184 | 11.0%), Management (162 | 9.7%), Community & Social Service (143 | 8.6%), Health Technologists (143 | 8.6%), and Education Instruction & Library (98 | 5.9%).
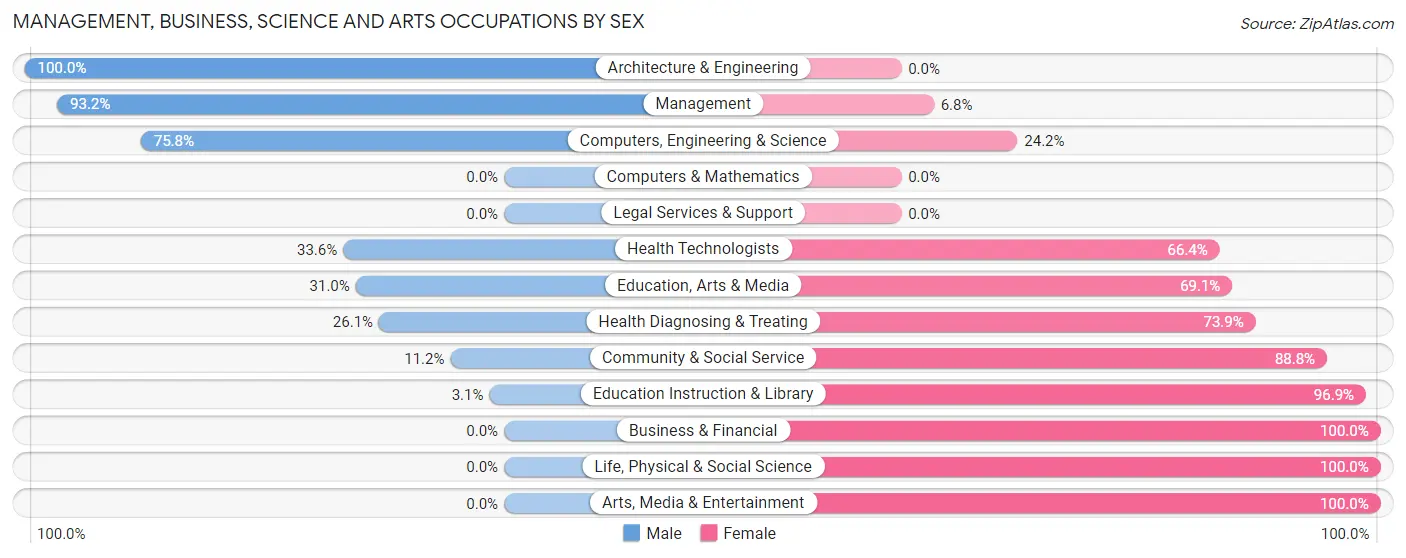
Management, Business, Science and Arts Occupations by Sex
Within the Management, Business, Science and Arts occupations in Lincoln, the most male-oriented occupations are Architecture & Engineering (100.0%), Management (93.2%), and Computers, Engineering & Science (75.8%), while the most female-oriented occupations are Business & Financial (100.0%), Life, Physical & Social Science (100.0%), and Arts, Media & Entertainment (100.0%).
| Occupation | Male | Female |
| Management | 151 (93.2%) | 11 (6.8%) |
| Business & Financial | 0 (0.0%) | 25 (100.0%) |
| Computers, Engineering & Science | 25 (75.8%) | 8 (24.2%) |
| Computers & Mathematics | 0 (0.0%) | 0 (0.0%) |
| Architecture & Engineering | 25 (100.0%) | 0 (0.0%) |
| Life, Physical & Social Science | 0 (0.0%) | 8 (100.0%) |
| Community & Social Service | 16 (11.2%) | 127 (88.8%) |
| Education, Arts & Media | 13 (30.9%) | 29 (69.1%) |
| Legal Services & Support | 0 (0.0%) | 0 (0.0%) |
| Education Instruction & Library | 3 (3.1%) | 95 (96.9%) |
| Arts, Media & Entertainment | 0 (0.0%) | 3 (100.0%) |
| Health Diagnosing & Treating | 48 (26.1%) | 136 (73.9%) |
| Health Technologists | 48 (33.6%) | 95 (66.4%) |
| Total (Category) | 240 (43.9%) | 307 (56.1%) |
| Total (Overall) | 905 (54.3%) | 763 (45.7%) |
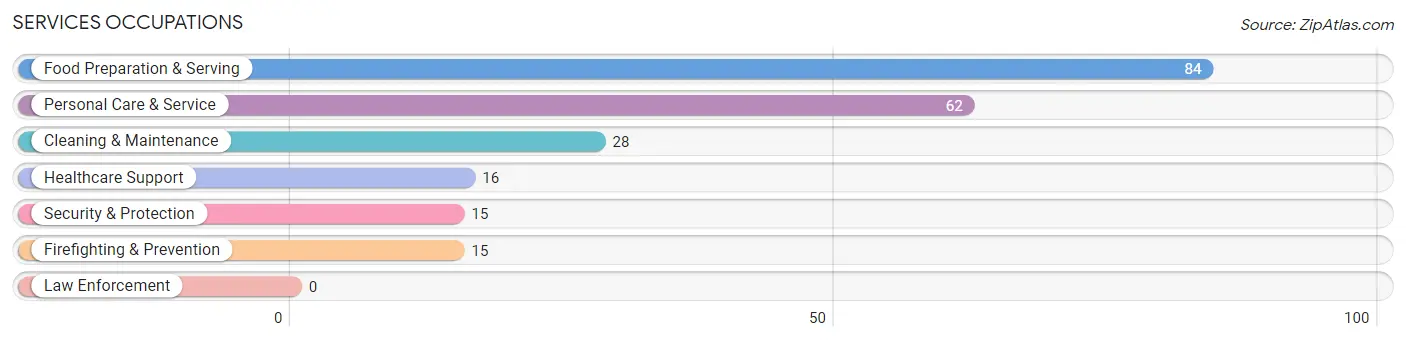
Services Occupations
The most common Services occupations in Lincoln are Food Preparation & Serving (84 | 5.0%), Personal Care & Service (62 | 3.7%), Cleaning & Maintenance (28 | 1.7%), Healthcare Support (16 | 1.0%), and Security & Protection (15 | 0.9%).
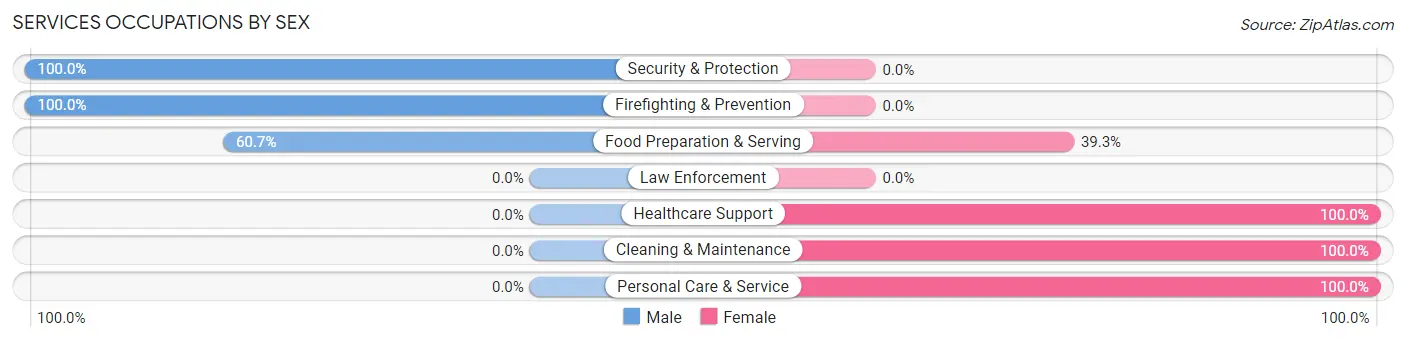
Services Occupations by Sex
Within the Services occupations in Lincoln, the most male-oriented occupations are Security & Protection (100.0%), Firefighting & Prevention (100.0%), and Food Preparation & Serving (60.7%), while the most female-oriented occupations are Healthcare Support (100.0%), Cleaning & Maintenance (100.0%), and Personal Care & Service (100.0%).
| Occupation | Male | Female |
| Healthcare Support | 0 (0.0%) | 16 (100.0%) |
| Security & Protection | 15 (100.0%) | 0 (0.0%) |
| Firefighting & Prevention | 15 (100.0%) | 0 (0.0%) |
| Law Enforcement | 0 (0.0%) | 0 (0.0%) |
| Food Preparation & Serving | 51 (60.7%) | 33 (39.3%) |
| Cleaning & Maintenance | 0 (0.0%) | 28 (100.0%) |
| Personal Care & Service | 0 (0.0%) | 62 (100.0%) |
| Total (Category) | 66 (32.2%) | 139 (67.8%) |
| Total (Overall) | 905 (54.3%) | 763 (45.7%) |
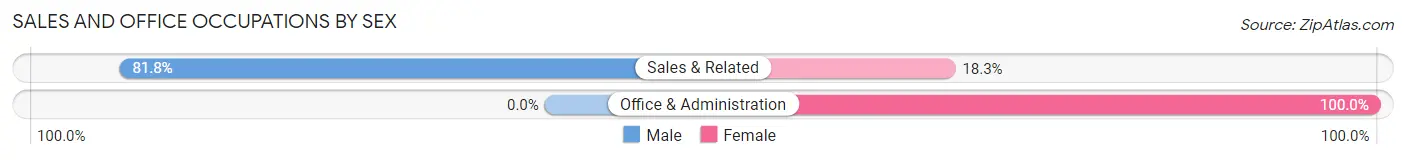
Sales and Office Occupations
The most common Sales and Office occupations in Lincoln are Sales & Related (137 | 8.2%), and Office & Administration (83 | 5.0%).
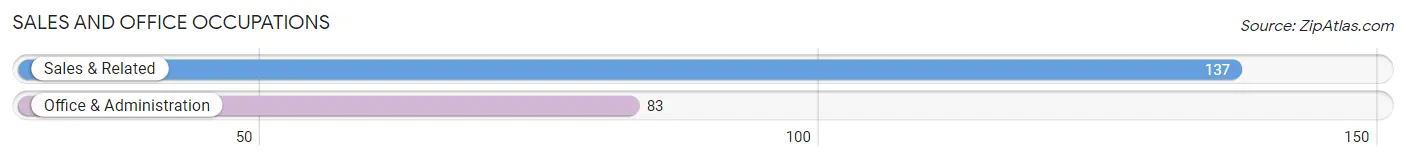
Sales and Office Occupations by Sex
| Occupation | Male | Female |
| Sales & Related | 112 (81.8%) | 25 (18.2%) |
| Office & Administration | 0 (0.0%) | 83 (100.0%) |
| Total (Category) | 112 (50.9%) | 108 (49.1%) |
| Total (Overall) | 905 (54.3%) | 763 (45.7%) |
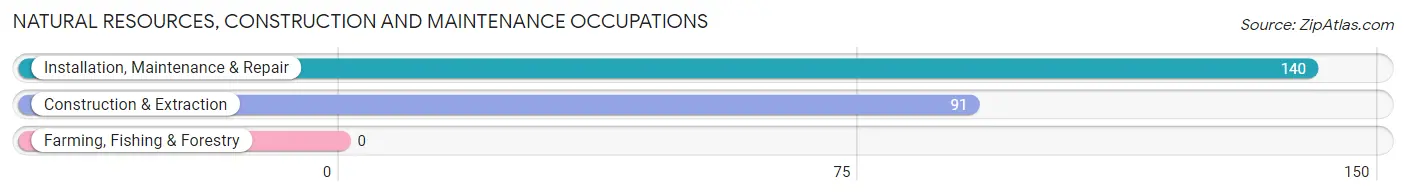
Natural Resources, Construction and Maintenance Occupations
The most common Natural Resources, Construction and Maintenance occupations in Lincoln are Installation, Maintenance & Repair (140 | 8.4%), and Construction & Extraction (91 | 5.5%).
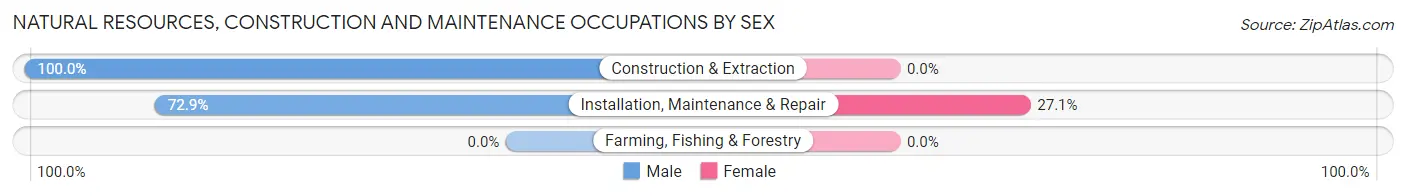
Natural Resources, Construction and Maintenance Occupations by Sex
| Occupation | Male | Female |
| Farming, Fishing & Forestry | 0 (0.0%) | 0 (0.0%) |
| Construction & Extraction | 91 (100.0%) | 0 (0.0%) |
| Installation, Maintenance & Repair | 102 (72.9%) | 38 (27.1%) |
| Total (Category) | 193 (83.6%) | 38 (16.5%) |
| Total (Overall) | 905 (54.3%) | 763 (45.7%) |
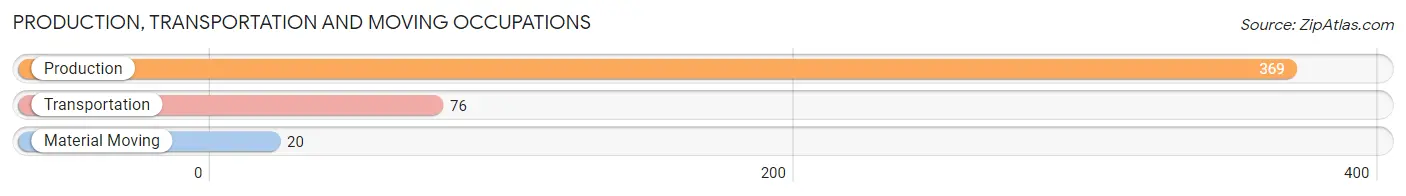
Production, Transportation and Moving Occupations
The most common Production, Transportation and Moving occupations in Lincoln are Production (369 | 22.1%), Transportation (76 | 4.6%), and Material Moving (20 | 1.2%).
Production, Transportation and Moving Occupations by Sex
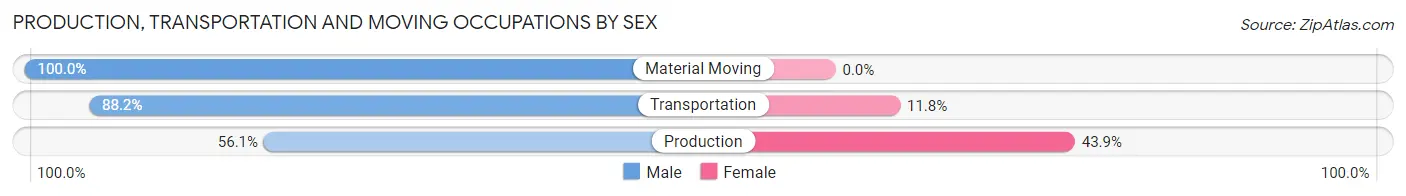
| Occupation | Male | Female |
| Production | 207 (56.1%) | 162 (43.9%) |
| Transportation | 67 (88.2%) | 9 (11.8%) |
| Material Moving | 20 (100.0%) | 0 (0.0%) |
| Total (Category) | 294 (63.2%) | 171 (36.8%) |
| Total (Overall) | 905 (54.3%) | 763 (45.7%) |
Employment Industries by Sex in Lincoln
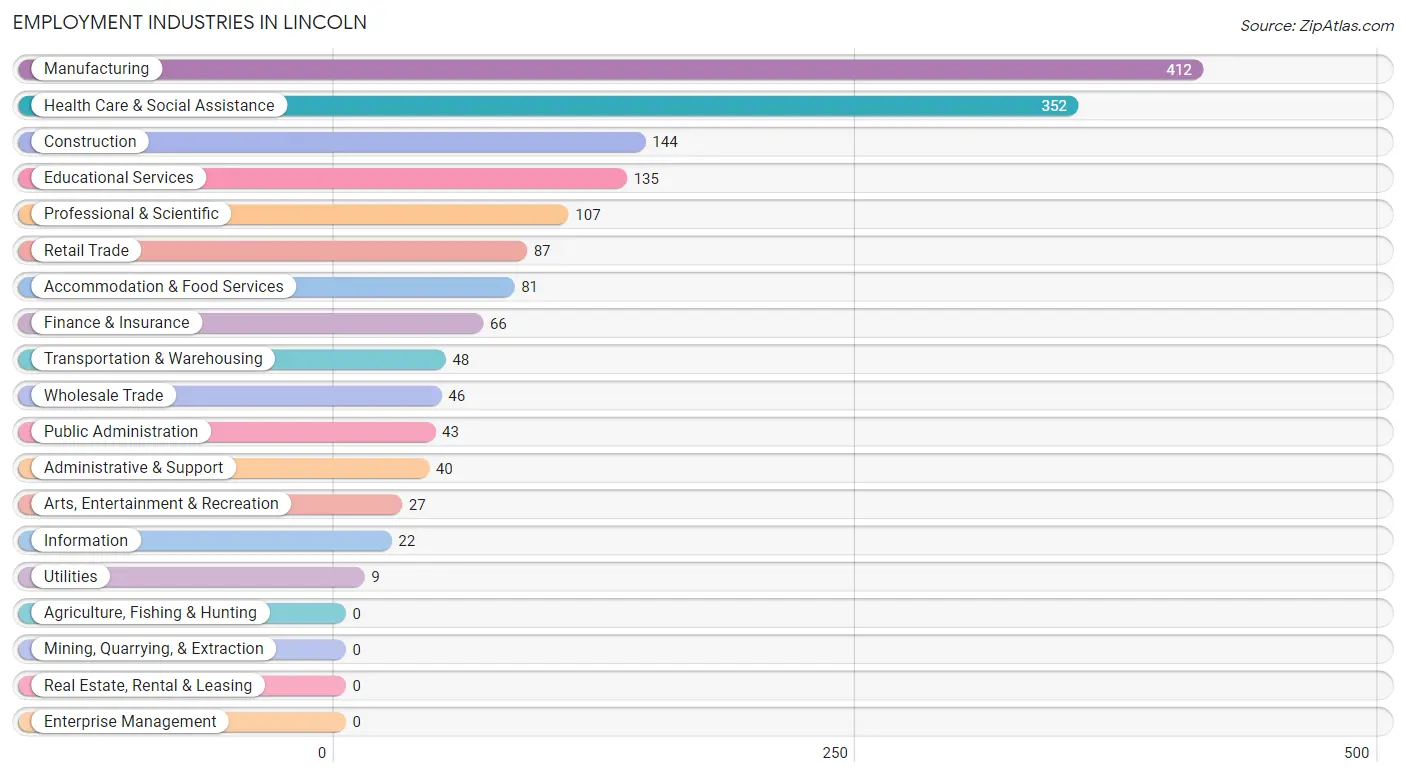
Employment Industries in Lincoln
The major employment industries in Lincoln include Manufacturing (412 | 24.7%), Health Care & Social Assistance (352 | 21.1%), Construction (144 | 8.6%), Educational Services (135 | 8.1%), and Professional & Scientific (107 | 6.4%).
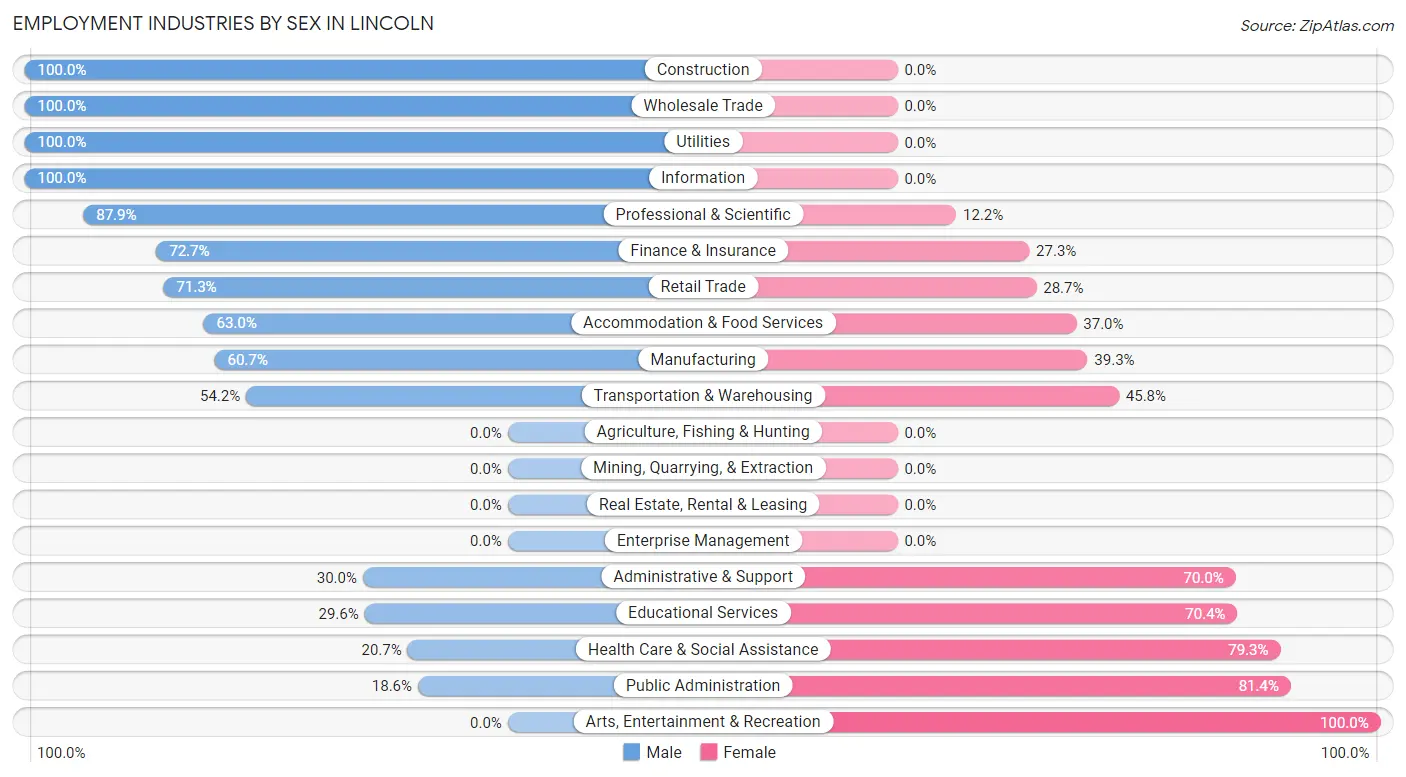
Employment Industries by Sex in Lincoln
The Lincoln industries that see more men than women are Construction (100.0%), Wholesale Trade (100.0%), and Utilities (100.0%), whereas the industries that tend to have a higher number of women are Arts, Entertainment & Recreation (100.0%), Public Administration (81.4%), and Health Care & Social Assistance (79.3%).
| Industry | Male | Female |
| Agriculture, Fishing & Hunting | 0 (0.0%) | 0 (0.0%) |
| Mining, Quarrying, & Extraction | 0 (0.0%) | 0 (0.0%) |
| Construction | 144 (100.0%) | 0 (0.0%) |
| Manufacturing | 250 (60.7%) | 162 (39.3%) |
| Wholesale Trade | 46 (100.0%) | 0 (0.0%) |
| Retail Trade | 62 (71.3%) | 25 (28.7%) |
| Transportation & Warehousing | 26 (54.2%) | 22 (45.8%) |
| Utilities | 9 (100.0%) | 0 (0.0%) |
| Information | 22 (100.0%) | 0 (0.0%) |
| Finance & Insurance | 48 (72.7%) | 18 (27.3%) |
| Real Estate, Rental & Leasing | 0 (0.0%) | 0 (0.0%) |
| Professional & Scientific | 94 (87.8%) | 13 (12.1%) |
| Enterprise Management | 0 (0.0%) | 0 (0.0%) |
| Administrative & Support | 12 (30.0%) | 28 (70.0%) |
| Educational Services | 40 (29.6%) | 95 (70.4%) |
| Health Care & Social Assistance | 73 (20.7%) | 279 (79.3%) |
| Arts, Entertainment & Recreation | 0 (0.0%) | 27 (100.0%) |
| Accommodation & Food Services | 51 (63.0%) | 30 (37.0%) |
| Public Administration | 8 (18.6%) | 35 (81.4%) |
| Total | 905 (54.3%) | 763 (45.7%) |
Education in Lincoln
School Enrollment in Lincoln
The most common levels of schooling among the 1,306 students in Lincoln are middle school (429 | 32.9%), elementary school (406 | 31.1%), and high school (174 | 13.3%).
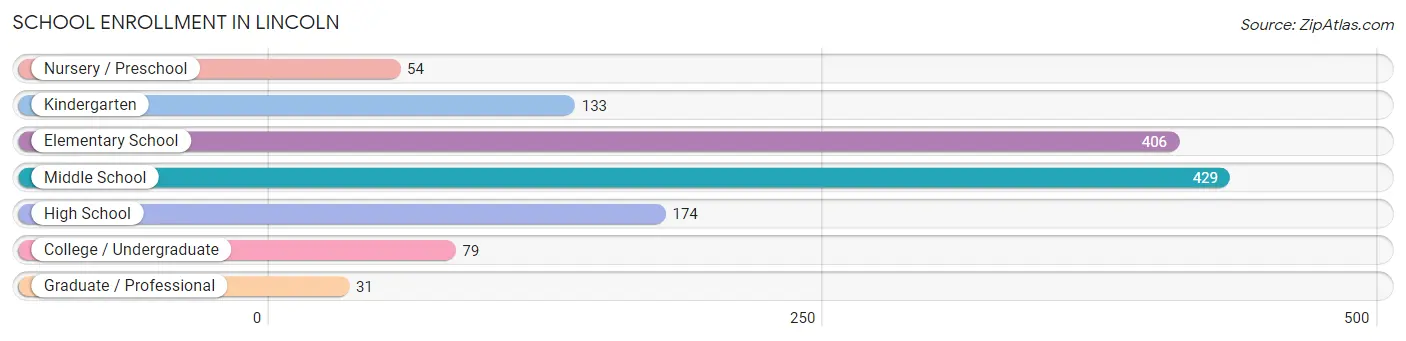
| School Level | # Students | % Students |
| Nursery / Preschool | 54 | 4.1% |
| Kindergarten | 133 | 10.2% |
| Elementary School | 406 | 31.1% |
| Middle School | 429 | 32.9% |
| High School | 174 | 13.3% |
| College / Undergraduate | 79 | 6.0% |
| Graduate / Professional | 31 | 2.4% |
| Total | 1,306 | 100.0% |
School Enrollment by Age by Funding Source in Lincoln
Out of a total of 1,306 students who are enrolled in schools in Lincoln, 201 (15.4%) attend a private institution, while the remaining 1,105 (84.6%) are enrolled in public schools. The age group of 20 to 24 year olds has the highest likelihood of being enrolled in private schools, with 23 (100.0% in the age bracket) enrolled. Conversely, the age group of 10 to 14 year olds has the lowest likelihood of being enrolled in a private school, with 465 (100.0% in the age bracket) attending a public institution.
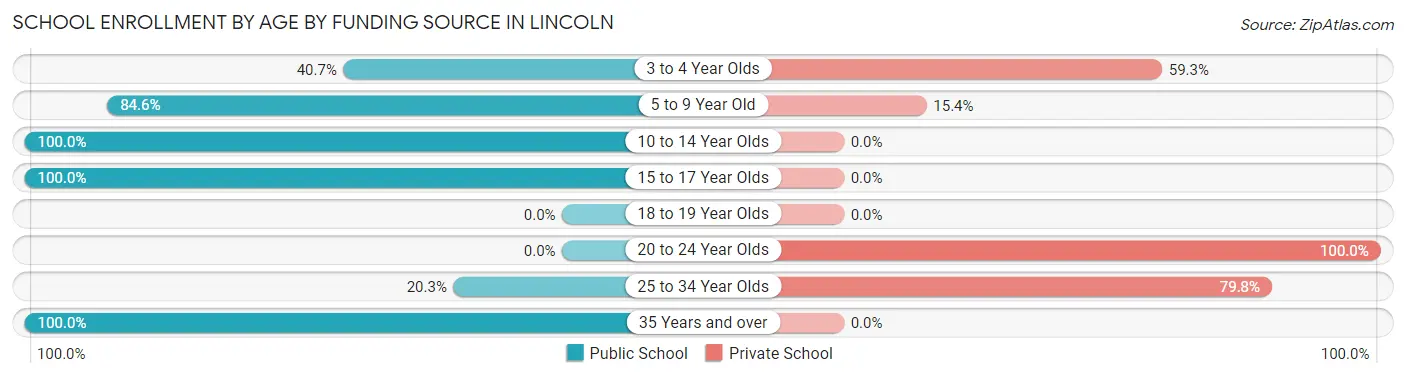
| Age Bracket | Public School | Private School |
| 3 to 4 Year Olds | 22 (40.7%) | 32 (59.3%) |
| 5 to 9 Year Old | 456 (84.6%) | 83 (15.4%) |
| 10 to 14 Year Olds | 465 (100.0%) | 0 (0.0%) |
| 15 to 17 Year Olds | 124 (100.0%) | 0 (0.0%) |
| 18 to 19 Year Olds | 0 (0.0%) | 0 (0.0%) |
| 20 to 24 Year Olds | 0 (0.0%) | 23 (100.0%) |
| 25 to 34 Year Olds | 16 (20.3%) | 63 (79.7%) |
| 35 Years and over | 22 (100.0%) | 0 (0.0%) |
| Total | 1,105 (84.6%) | 201 (15.4%) |
Educational Attainment by Field of Study in Lincoln
Business (118 | 18.4%), science & technology (97 | 15.2%), education (88 | 13.8%), arts & humanities (85 | 13.3%), and literature & languages (67 | 10.5%) are the most common fields of study among 640 individuals in Lincoln who have obtained a bachelor's degree or higher.
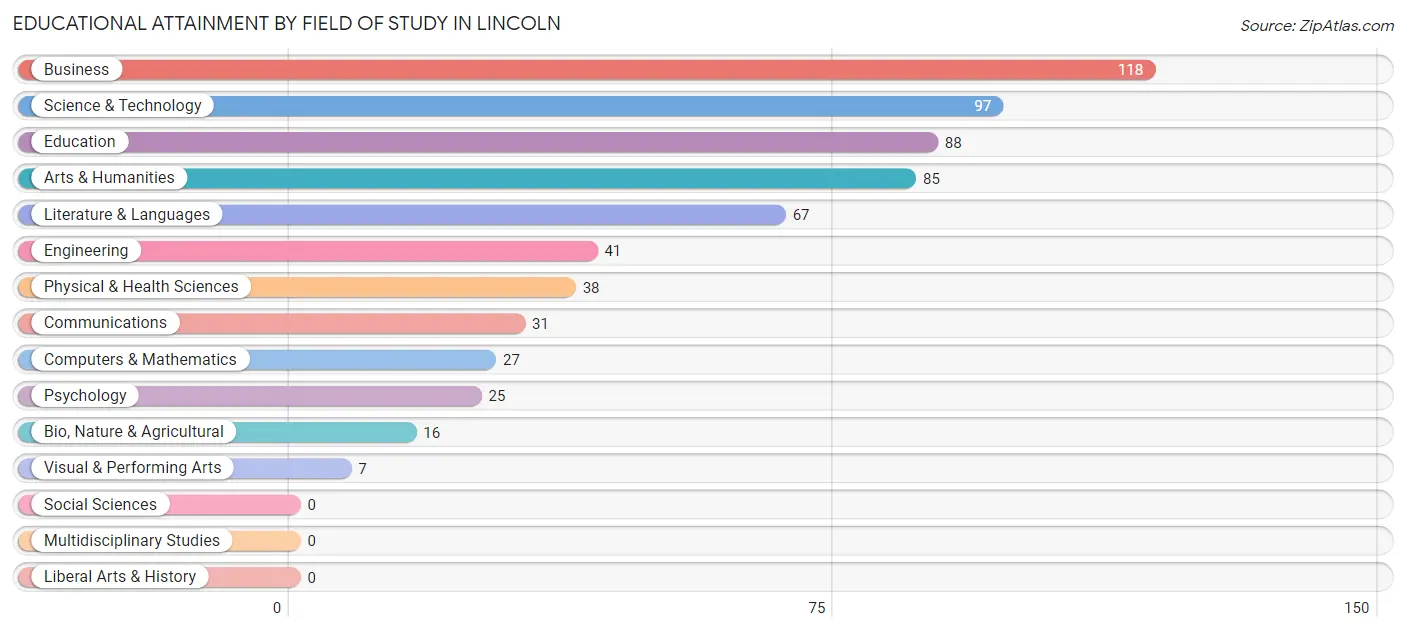
| Field of Study | # Graduates | % Graduates |
| Computers & Mathematics | 27 | 4.2% |
| Bio, Nature & Agricultural | 16 | 2.5% |
| Physical & Health Sciences | 38 | 5.9% |
| Psychology | 25 | 3.9% |
| Social Sciences | 0 | 0.0% |
| Engineering | 41 | 6.4% |
| Multidisciplinary Studies | 0 | 0.0% |
| Science & Technology | 97 | 15.2% |
| Business | 118 | 18.4% |
| Education | 88 | 13.8% |
| Literature & Languages | 67 | 10.5% |
| Liberal Arts & History | 0 | 0.0% |
| Visual & Performing Arts | 7 | 1.1% |
| Communications | 31 | 4.8% |
| Arts & Humanities | 85 | 13.3% |
| Total | 640 | 100.0% |
Transportation & Commute in Lincoln
Vehicle Availability by Sex in Lincoln
The most prevalent vehicle ownership categories in Lincoln are males with 2 vehicles (451, accounting for 51.3%) and females with 2 vehicles (395, making up 59.1%).
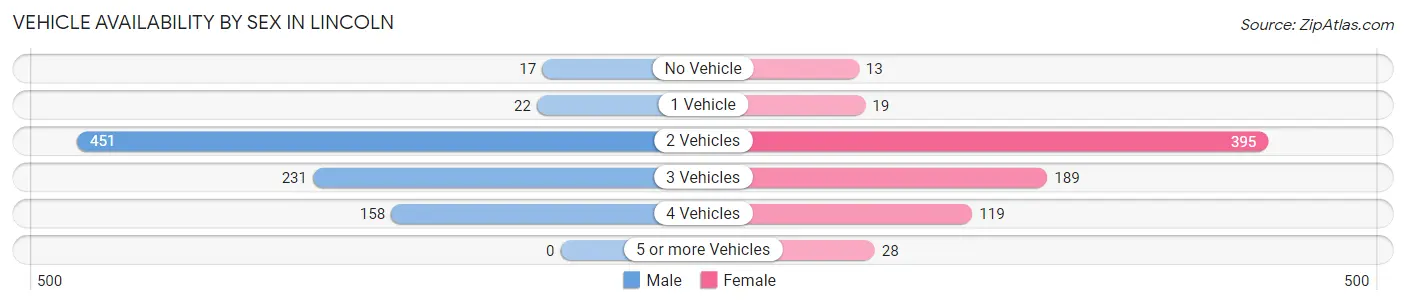
| Vehicles Available | Male | Female |
| No Vehicle | 17 (1.9%) | 13 (1.7%) |
| 1 Vehicle | 22 (2.5%) | 19 (2.5%) |
| 2 Vehicles | 451 (51.3%) | 395 (51.8%) |
| 3 Vehicles | 231 (26.3%) | 189 (24.8%) |
| 4 Vehicles | 158 (18.0%) | 119 (15.6%) |
| 5 or more Vehicles | 0 (0.0%) | 28 (3.7%) |
| Total | 879 (100.0%) | 763 (100.0%) |
Commute Time in Lincoln
The most frequently occuring commute durations in Lincoln are 10 to 14 minutes (482 commuters, 30.8%), 15 to 19 minutes (396 commuters, 25.3%), and 20 to 24 minutes (243 commuters, 15.5%).
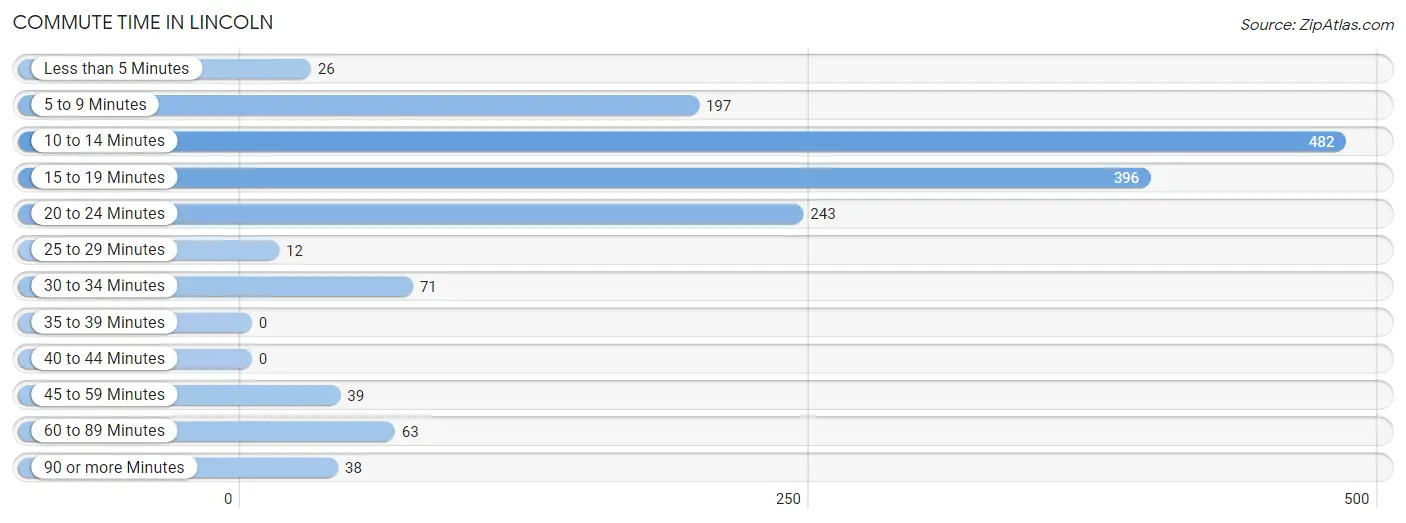
| Commute Time | # Commuters | % Commuters |
| Less than 5 Minutes | 26 | 1.7% |
| 5 to 9 Minutes | 197 | 12.6% |
| 10 to 14 Minutes | 482 | 30.8% |
| 15 to 19 Minutes | 396 | 25.3% |
| 20 to 24 Minutes | 243 | 15.5% |
| 25 to 29 Minutes | 12 | 0.8% |
| 30 to 34 Minutes | 71 | 4.5% |
| 35 to 39 Minutes | 0 | 0.0% |
| 40 to 44 Minutes | 0 | 0.0% |
| 45 to 59 Minutes | 39 | 2.5% |
| 60 to 89 Minutes | 63 | 4.0% |
| 90 or more Minutes | 38 | 2.4% |
Commute Time by Sex in Lincoln
The most common commute times in Lincoln are 15 to 19 minutes (337 commuters, 38.5%) for males and 10 to 14 minutes (293 commuters, 42.4%) for females.
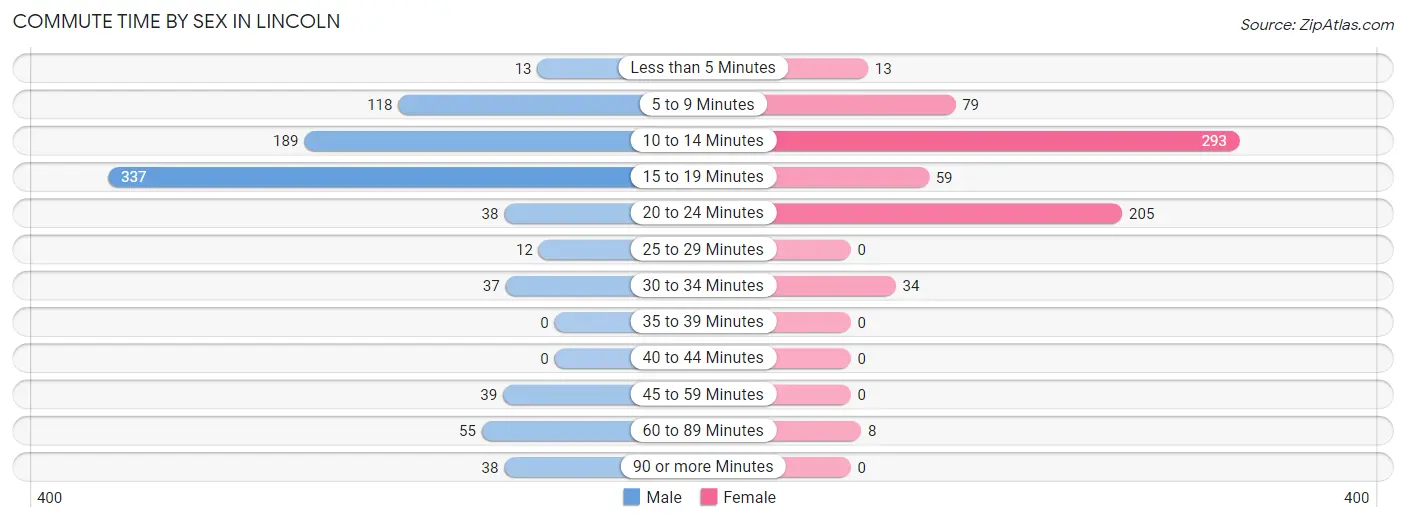
| Commute Time | Male | Female |
| Less than 5 Minutes | 13 (1.5%) | 13 (1.9%) |
| 5 to 9 Minutes | 118 (13.5%) | 79 (11.4%) |
| 10 to 14 Minutes | 189 (21.6%) | 293 (42.4%) |
| 15 to 19 Minutes | 337 (38.5%) | 59 (8.5%) |
| 20 to 24 Minutes | 38 (4.3%) | 205 (29.7%) |
| 25 to 29 Minutes | 12 (1.4%) | 0 (0.0%) |
| 30 to 34 Minutes | 37 (4.2%) | 34 (4.9%) |
| 35 to 39 Minutes | 0 (0.0%) | 0 (0.0%) |
| 40 to 44 Minutes | 0 (0.0%) | 0 (0.0%) |
| 45 to 59 Minutes | 39 (4.4%) | 0 (0.0%) |
| 60 to 89 Minutes | 55 (6.3%) | 8 (1.2%) |
| 90 or more Minutes | 38 (4.3%) | 0 (0.0%) |
Time of Departure to Work by Sex in Lincoln
The most frequent times of departure to work in Lincoln are 4:00 PM to 11:59 PM (162, 18.5%) for males and 7:30 AM to 7:59 AM (273, 39.5%) for females.
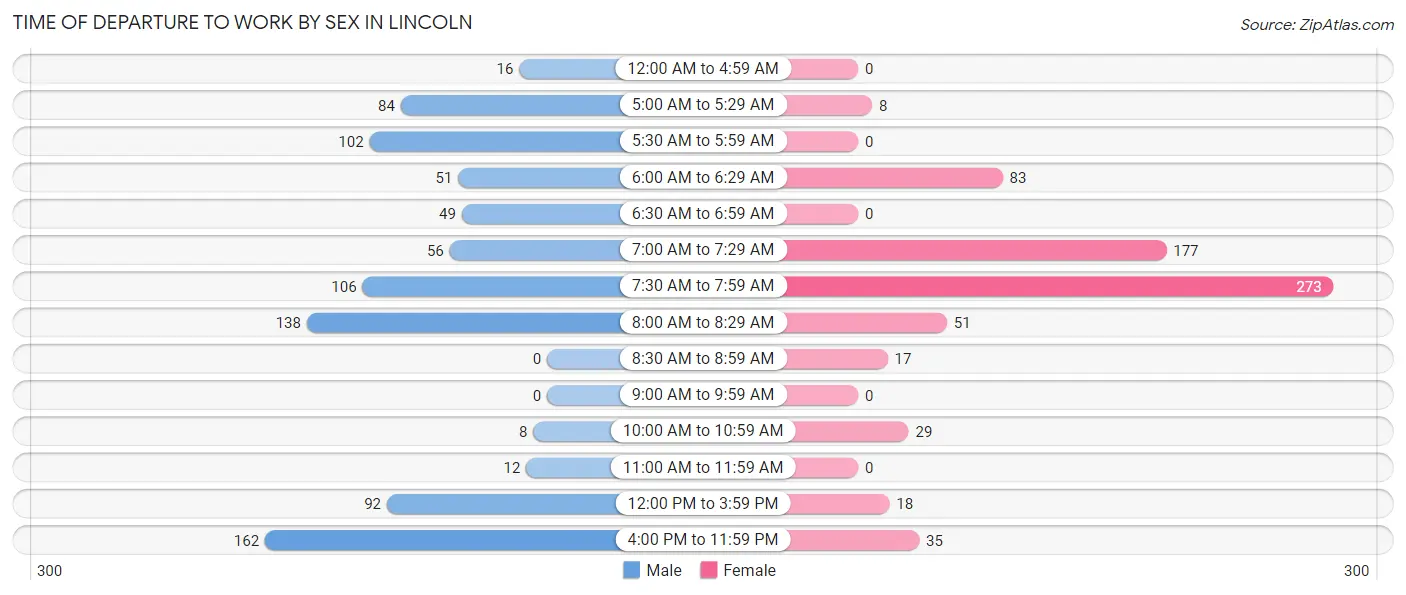
| Time of Departure | Male | Female |
| 12:00 AM to 4:59 AM | 16 (1.8%) | 0 (0.0%) |
| 5:00 AM to 5:29 AM | 84 (9.6%) | 8 (1.2%) |
| 5:30 AM to 5:59 AM | 102 (11.6%) | 0 (0.0%) |
| 6:00 AM to 6:29 AM | 51 (5.8%) | 83 (12.0%) |
| 6:30 AM to 6:59 AM | 49 (5.6%) | 0 (0.0%) |
| 7:00 AM to 7:29 AM | 56 (6.4%) | 177 (25.6%) |
| 7:30 AM to 7:59 AM | 106 (12.1%) | 273 (39.5%) |
| 8:00 AM to 8:29 AM | 138 (15.8%) | 51 (7.4%) |
| 8:30 AM to 8:59 AM | 0 (0.0%) | 17 (2.5%) |
| 9:00 AM to 9:59 AM | 0 (0.0%) | 0 (0.0%) |
| 10:00 AM to 10:59 AM | 8 (0.9%) | 29 (4.2%) |
| 11:00 AM to 11:59 AM | 12 (1.4%) | 0 (0.0%) |
| 12:00 PM to 3:59 PM | 92 (10.5%) | 18 (2.6%) |
| 4:00 PM to 11:59 PM | 162 (18.5%) | 35 (5.1%) |
| Total | 876 (100.0%) | 691 (100.0%) |
Housing Occupancy in Lincoln
Occupancy by Ownership in Lincoln
Of the total 1,154 dwellings in Lincoln, owner-occupied units account for 941 (81.5%), while renter-occupied units make up 213 (18.5%).
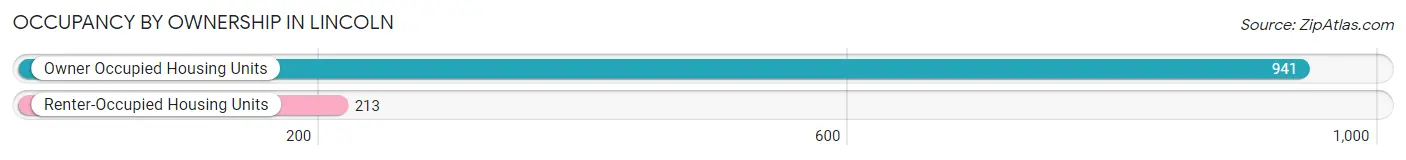
| Occupancy | # Housing Units | % Housing Units |
| Owner Occupied Housing Units | 941 | 81.5% |
| Renter-Occupied Housing Units | 213 | 18.5% |
| Total Occupied Housing Units | 1,154 | 100.0% |
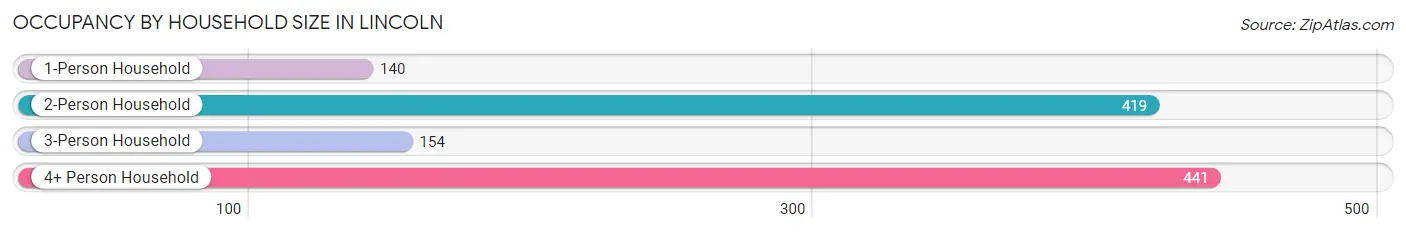
Occupancy by Household Size in Lincoln
| Household Size | # Housing Units | % Housing Units |
| 1-Person Household | 140 | 12.1% |
| 2-Person Household | 419 | 36.3% |
| 3-Person Household | 154 | 13.3% |
| 4+ Person Household | 441 | 38.2% |
| Total Housing Units | 1,154 | 100.0% |
Occupancy by Ownership by Household Size in Lincoln
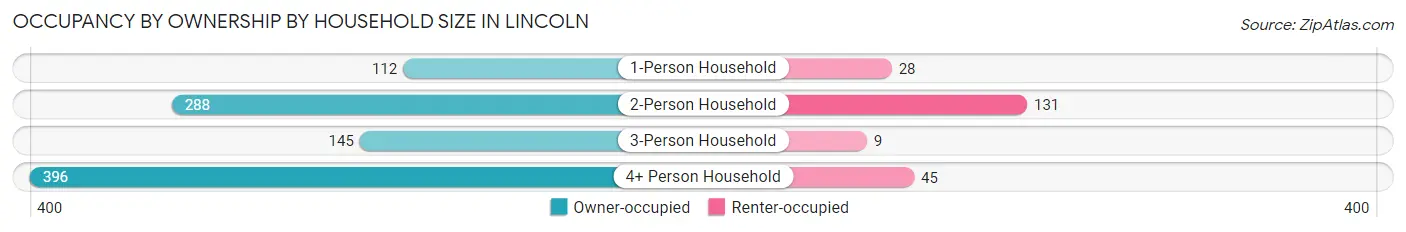
| Household Size | Owner-occupied | Renter-occupied |
| 1-Person Household | 112 (80.0%) | 28 (20.0%) |
| 2-Person Household | 288 (68.7%) | 131 (31.3%) |
| 3-Person Household | 145 (94.2%) | 9 (5.8%) |
| 4+ Person Household | 396 (89.8%) | 45 (10.2%) |
| Total Housing Units | 941 (81.5%) | 213 (18.5%) |
Occupancy by Educational Attainment in Lincoln
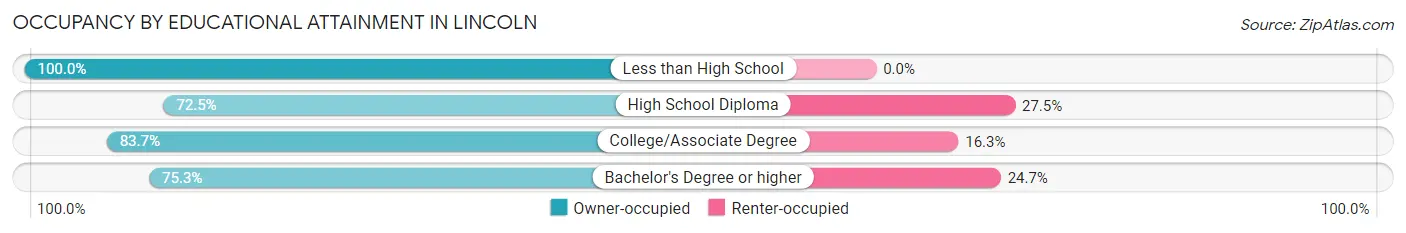
| Household Size | Owner-occupied | Renter-occupied |
| Less than High School | 184 (100.0%) | 0 (0.0%) |
| High School Diploma | 179 (72.5%) | 68 (27.5%) |
| College/Associate Degree | 334 (83.7%) | 65 (16.3%) |
| Bachelor's Degree or higher | 244 (75.3%) | 80 (24.7%) |
Occupancy by Age of Householder in Lincoln
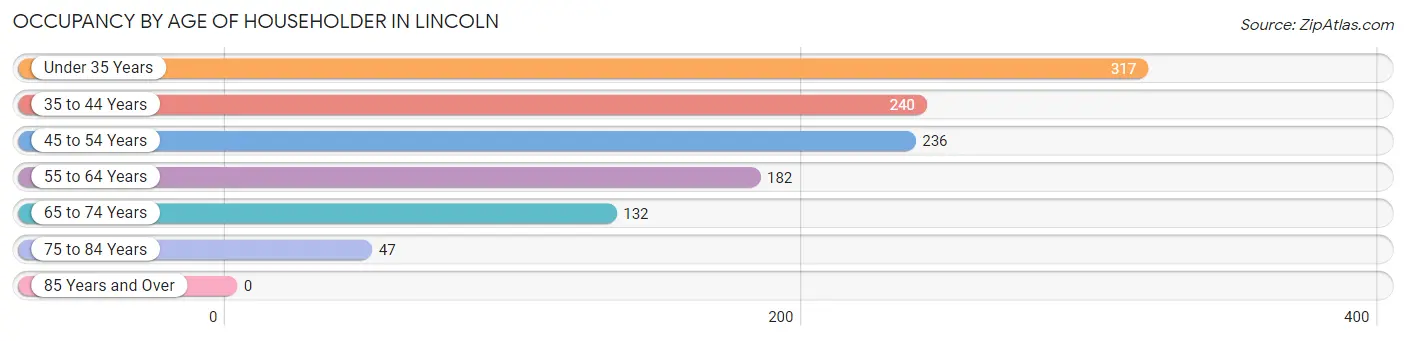
| Age Bracket | # Households | % Households |
| Under 35 Years | 317 | 27.5% |
| 35 to 44 Years | 240 | 20.8% |
| 45 to 54 Years | 236 | 20.4% |
| 55 to 64 Years | 182 | 15.8% |
| 65 to 74 Years | 132 | 11.4% |
| 75 to 84 Years | 47 | 4.1% |
| 85 Years and Over | 0 | 0.0% |
| Total | 1,154 | 100.0% |
Housing Finances in Lincoln
Median Income by Occupancy in Lincoln
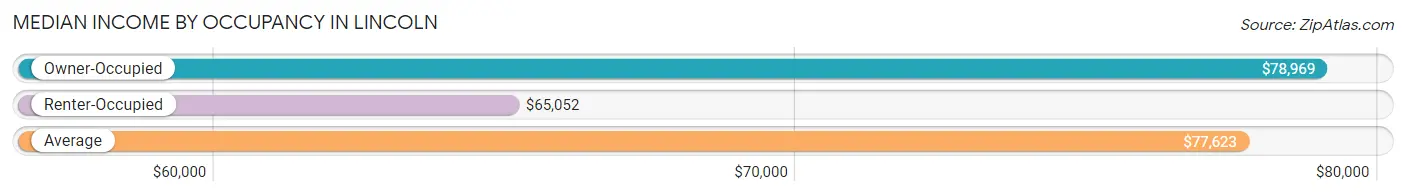
| Occupancy Type | # Households | Median Income |
| Owner-Occupied | 941 (81.5%) | $78,969 |
| Renter-Occupied | 213 (18.5%) | $65,052 |
| Average | 1,154 (100.0%) | $77,623 |
Occupancy by Householder Income Bracket in Lincoln
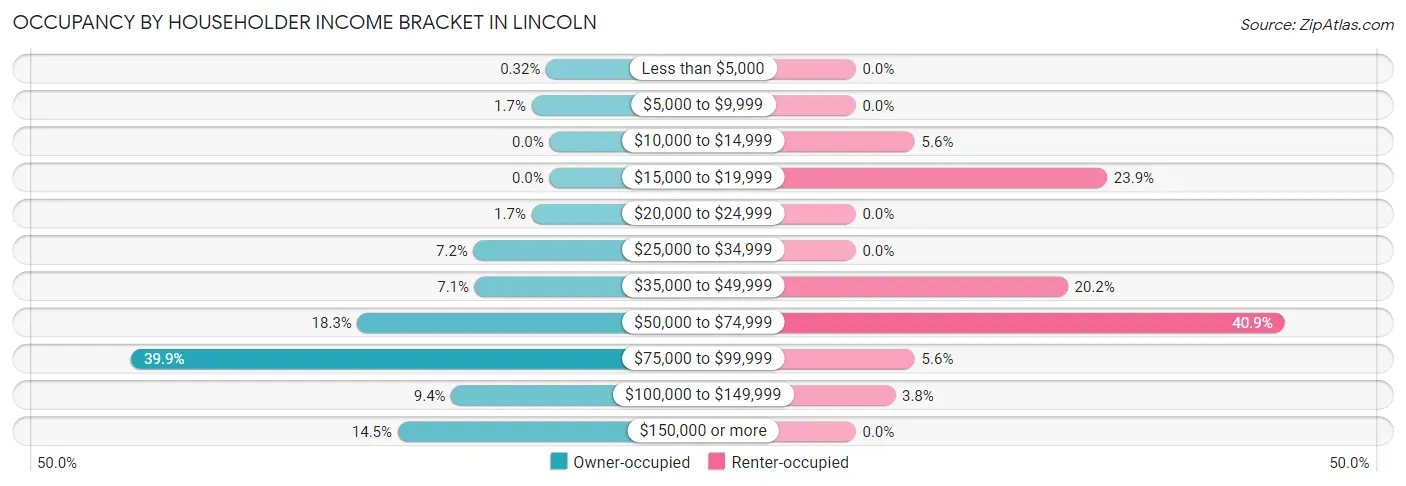
| Income Bracket | Owner-occupied | Renter-occupied |
| Less than $5,000 | 3 (0.3%) | 0 (0.0%) |
| $5,000 to $9,999 | 16 (1.7%) | 0 (0.0%) |
| $10,000 to $14,999 | 0 (0.0%) | 12 (5.6%) |
| $15,000 to $19,999 | 0 (0.0%) | 51 (23.9%) |
| $20,000 to $24,999 | 16 (1.7%) | 0 (0.0%) |
| $25,000 to $34,999 | 68 (7.2%) | 0 (0.0%) |
| $35,000 to $49,999 | 67 (7.1%) | 43 (20.2%) |
| $50,000 to $74,999 | 172 (18.3%) | 87 (40.8%) |
| $75,000 to $99,999 | 375 (39.9%) | 12 (5.6%) |
| $100,000 to $149,999 | 88 (9.3%) | 8 (3.8%) |
| $150,000 or more | 136 (14.4%) | 0 (0.0%) |
| Total | 941 (100.0%) | 213 (100.0%) |
Monthly Housing Cost Tiers in Lincoln

| Monthly Cost | Owner-occupied | Renter-occupied |
| Less than $300 | 75 (8.0%) | 0 (0.0%) |
| $300 to $499 | 45 (4.8%) | 0 (0.0%) |
| $500 to $799 | 85 (9.0%) | 28 (13.2%) |
| $800 to $999 | 95 (10.1%) | 64 (30.0%) |
| $1,000 to $1,499 | 287 (30.5%) | 65 (30.5%) |
| $1,500 to $1,999 | 354 (37.6%) | 44 (20.7%) |
| $2,000 to $2,499 | 0 (0.0%) | 0 (0.0%) |
| $2,500 to $2,999 | 0 (0.0%) | 0 (0.0%) |
| $3,000 or more | 0 (0.0%) | 0 (0.0%) |
| Total | 941 (100.0%) | 213 (100.0%) |
Physical Housing Characteristics in Lincoln
Housing Structures in Lincoln
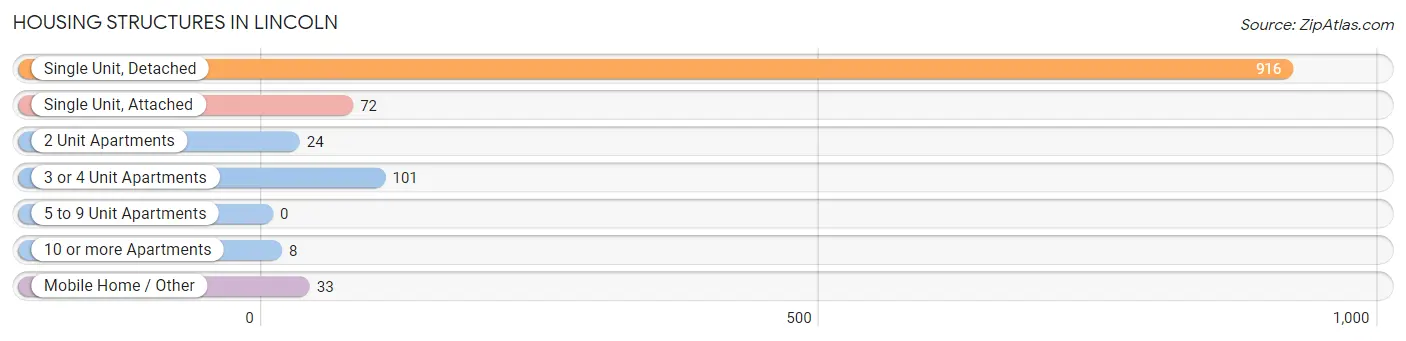
| Structure Type | # Housing Units | % Housing Units |
| Single Unit, Detached | 916 | 79.4% |
| Single Unit, Attached | 72 | 6.2% |
| 2 Unit Apartments | 24 | 2.1% |
| 3 or 4 Unit Apartments | 101 | 8.7% |
| 5 to 9 Unit Apartments | 0 | 0.0% |
| 10 or more Apartments | 8 | 0.7% |
| Mobile Home / Other | 33 | 2.9% |
| Total | 1,154 | 100.0% |
Housing Structures by Occupancy in Lincoln
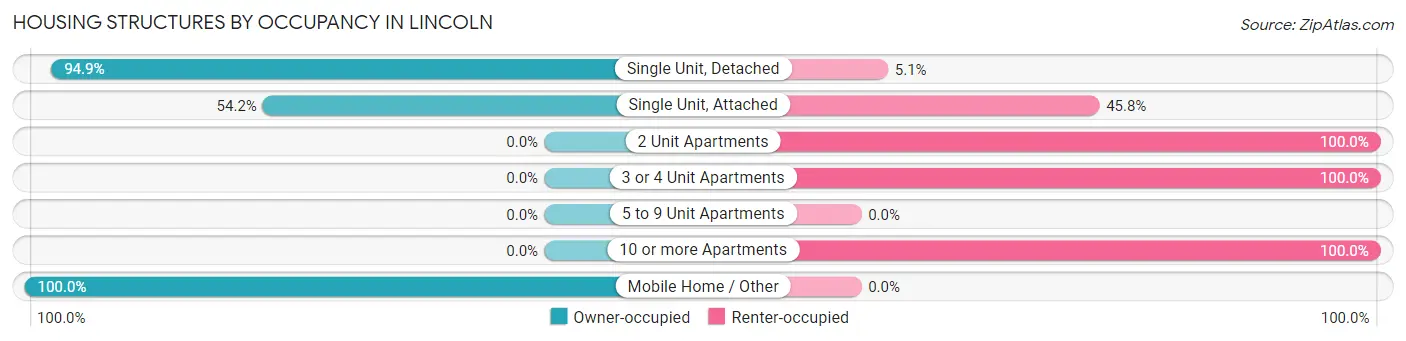
| Structure Type | Owner-occupied | Renter-occupied |
| Single Unit, Detached | 869 (94.9%) | 47 (5.1%) |
| Single Unit, Attached | 39 (54.2%) | 33 (45.8%) |
| 2 Unit Apartments | 0 (0.0%) | 24 (100.0%) |
| 3 or 4 Unit Apartments | 0 (0.0%) | 101 (100.0%) |
| 5 to 9 Unit Apartments | 0 (0.0%) | 0 (0.0%) |
| 10 or more Apartments | 0 (0.0%) | 8 (100.0%) |
| Mobile Home / Other | 33 (100.0%) | 0 (0.0%) |
| Total | 941 (81.5%) | 213 (18.5%) |
Housing Structures by Number of Rooms in Lincoln
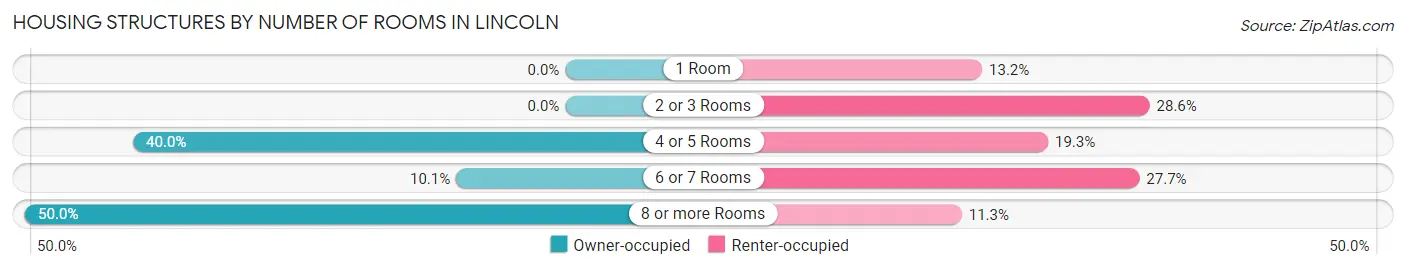
| Number of Rooms | Owner-occupied | Renter-occupied |
| 1 Room | 0 (0.0%) | 28 (13.2%) |
| 2 or 3 Rooms | 0 (0.0%) | 61 (28.6%) |
| 4 or 5 Rooms | 376 (40.0%) | 41 (19.3%) |
| 6 or 7 Rooms | 95 (10.1%) | 59 (27.7%) |
| 8 or more Rooms | 470 (49.9%) | 24 (11.3%) |
| Total | 941 (100.0%) | 213 (100.0%) |
Housing Structure by Heating Type in Lincoln
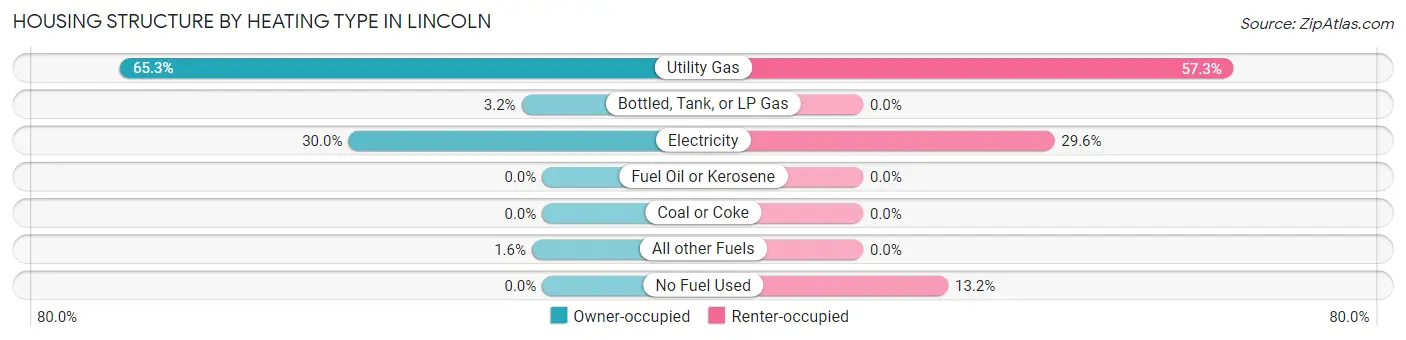
| Heating Type | Owner-occupied | Renter-occupied |
| Utility Gas | 614 (65.2%) | 122 (57.3%) |
| Bottled, Tank, or LP Gas | 30 (3.2%) | 0 (0.0%) |
| Electricity | 282 (30.0%) | 63 (29.6%) |
| Fuel Oil or Kerosene | 0 (0.0%) | 0 (0.0%) |
| Coal or Coke | 0 (0.0%) | 0 (0.0%) |
| All other Fuels | 15 (1.6%) | 0 (0.0%) |
| No Fuel Used | 0 (0.0%) | 28 (13.2%) |
| Total | 941 (100.0%) | 213 (100.0%) |
Household Vehicle Usage in Lincoln
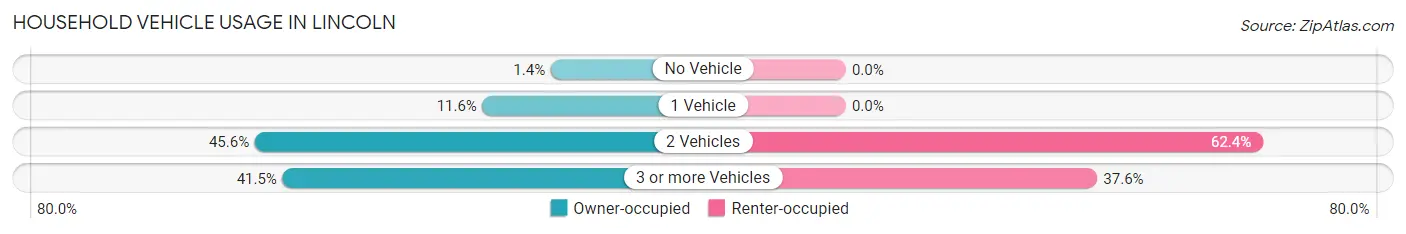
| Vehicles per Household | Owner-occupied | Renter-occupied |
| No Vehicle | 13 (1.4%) | 0 (0.0%) |
| 1 Vehicle | 109 (11.6%) | 0 (0.0%) |
| 2 Vehicles | 429 (45.6%) | 133 (62.4%) |
| 3 or more Vehicles | 390 (41.4%) | 80 (37.6%) |
| Total | 941 (100.0%) | 213 (100.0%) |
Real Estate & Mortgages in Lincoln
Real Estate and Mortgage Overview in Lincoln
| Characteristic | Without Mortgage | With Mortgage |
| Housing Units | 123 | 818 |
| Median Property Value | - | - |
| Median Household Income | - | - |
| Monthly Housing Costs | $278 | $0 |
| Real Estate Taxes | $1,175 | $14 |
Property Value by Mortgage Status in Lincoln
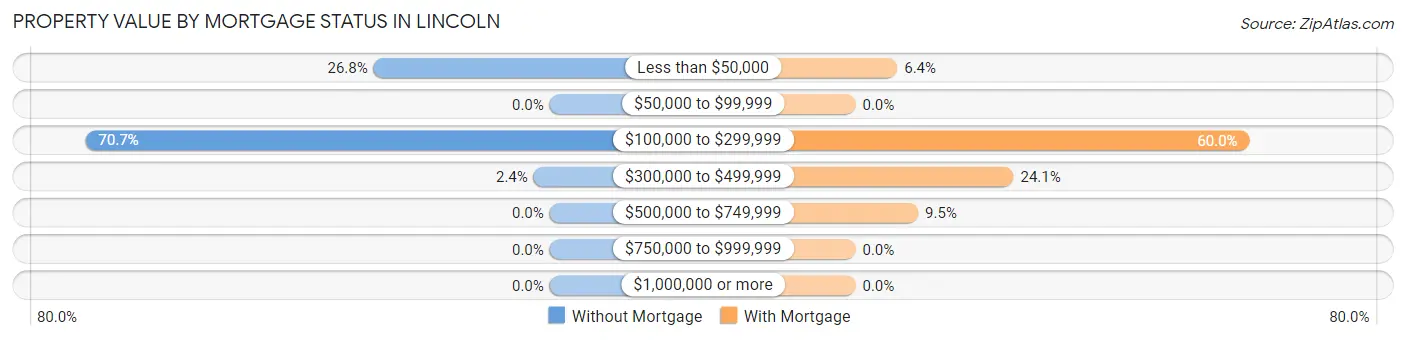
| Property Value | Without Mortgage | With Mortgage |
| Less than $50,000 | 33 (26.8%) | 52 (6.4%) |
| $50,000 to $99,999 | 0 (0.0%) | 0 (0.0%) |
| $100,000 to $299,999 | 87 (70.7%) | 491 (60.0%) |
| $300,000 to $499,999 | 3 (2.4%) | 197 (24.1%) |
| $500,000 to $749,999 | 0 (0.0%) | 78 (9.5%) |
| $750,000 to $999,999 | 0 (0.0%) | 0 (0.0%) |
| $1,000,000 or more | 0 (0.0%) | 0 (0.0%) |
| Total | 123 (100.0%) | 818 (100.0%) |
Household Income by Mortgage Status in Lincoln
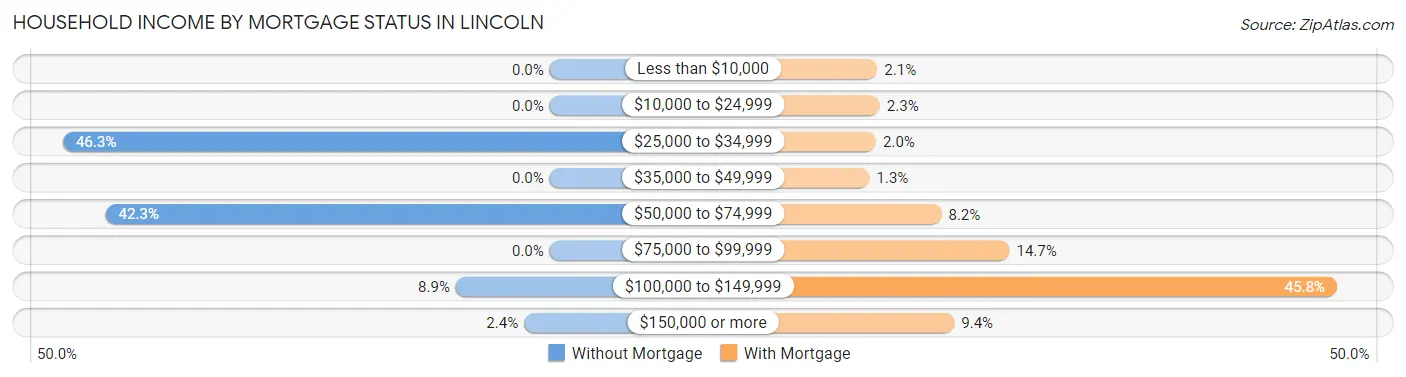
| Household Income | Without Mortgage | With Mortgage |
| Less than $10,000 | 0 (0.0%) | 17 (2.1%) |
| $10,000 to $24,999 | 0 (0.0%) | 19 (2.3%) |
| $25,000 to $34,999 | 57 (46.3%) | 16 (2.0%) |
| $35,000 to $49,999 | 0 (0.0%) | 11 (1.3%) |
| $50,000 to $74,999 | 52 (42.3%) | 67 (8.2%) |
| $75,000 to $99,999 | 0 (0.0%) | 120 (14.7%) |
| $100,000 to $149,999 | 11 (8.9%) | 375 (45.8%) |
| $150,000 or more | 3 (2.4%) | 77 (9.4%) |
| Total | 123 (100.0%) | 818 (100.0%) |
Property Value to Household Income Ratio in Lincoln
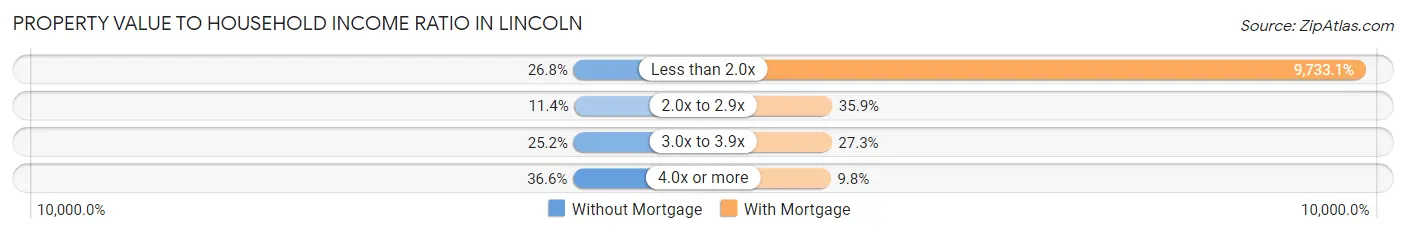
| Value-to-Income Ratio | Without Mortgage | With Mortgage |
| Less than 2.0x | 33 (26.8%) | 79,617 (9,733.1%) |
| 2.0x to 2.9x | 14 (11.4%) | 294 (35.9%) |
| 3.0x to 3.9x | 31 (25.2%) | 223 (27.3%) |
| 4.0x or more | 45 (36.6%) | 80 (9.8%) |
| Total | 123 (100.0%) | 818 (100.0%) |
Real Estate Taxes by Mortgage Status in Lincoln
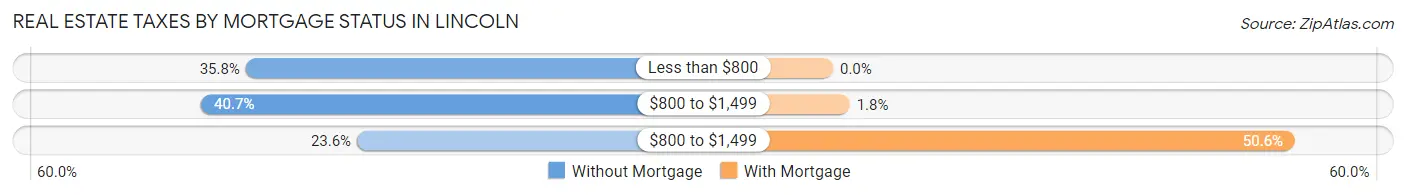
| Property Taxes | Without Mortgage | With Mortgage |
| Less than $800 | 44 (35.8%) | 0 (0.0%) |
| $800 to $1,499 | 50 (40.6%) | 15 (1.8%) |
| $800 to $1,499 | 29 (23.6%) | 414 (50.6%) |
| Total | 123 (100.0%) | 818 (100.0%) |
Health & Disability in Lincoln
Health Insurance Coverage by Age in Lincoln
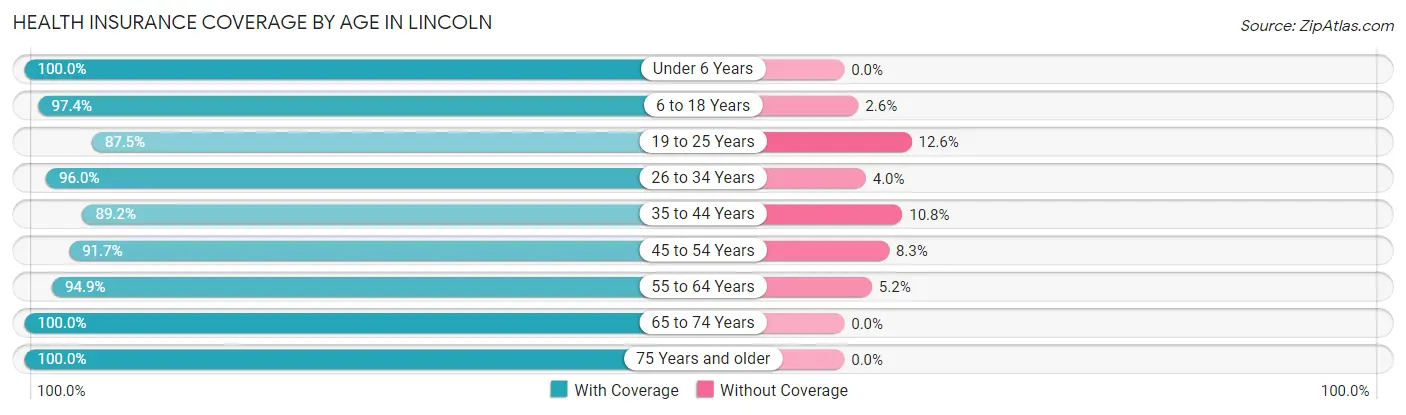
| Age Bracket | With Coverage | Without Coverage |
| Under 6 Years | 350 (100.0%) | 0 (0.0%) |
| 6 to 18 Years | 1,038 (97.4%) | 28 (2.6%) |
| 19 to 25 Years | 230 (87.5%) | 33 (12.6%) |
| 26 to 34 Years | 503 (96.0%) | 21 (4.0%) |
| 35 to 44 Years | 346 (89.2%) | 42 (10.8%) |
| 45 to 54 Years | 374 (91.7%) | 34 (8.3%) |
| 55 to 64 Years | 368 (94.9%) | 20 (5.1%) |
| 65 to 74 Years | 204 (100.0%) | 0 (0.0%) |
| 75 Years and older | 47 (100.0%) | 0 (0.0%) |
| Total | 3,460 (95.1%) | 178 (4.9%) |
Health Insurance Coverage by Citizenship Status in Lincoln
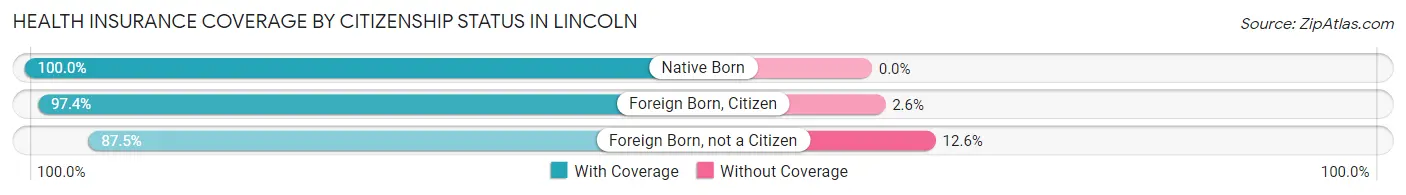
| Citizenship Status | With Coverage | Without Coverage |
| Native Born | 350 (100.0%) | 0 (0.0%) |
| Foreign Born, Citizen | 1,038 (97.4%) | 28 (2.6%) |
| Foreign Born, not a Citizen | 230 (87.5%) | 33 (12.6%) |
Health Insurance Coverage by Household Income in Lincoln
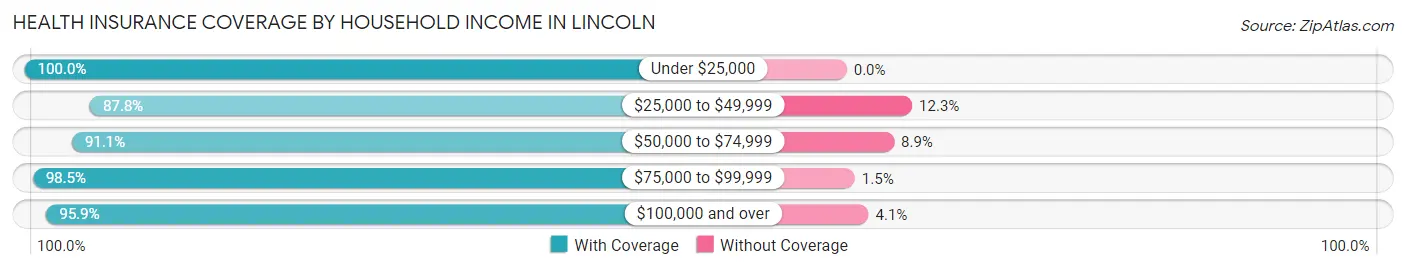
| Household Income | With Coverage | Without Coverage |
| Under $25,000 | 253 (100.0%) | 0 (0.0%) |
| $25,000 to $49,999 | 444 (87.7%) | 62 (12.2%) |
| $50,000 to $74,999 | 679 (91.1%) | 66 (8.9%) |
| $75,000 to $99,999 | 1,425 (98.5%) | 22 (1.5%) |
| $100,000 and over | 659 (95.9%) | 28 (4.1%) |
Public vs Private Health Insurance Coverage by Age in Lincoln
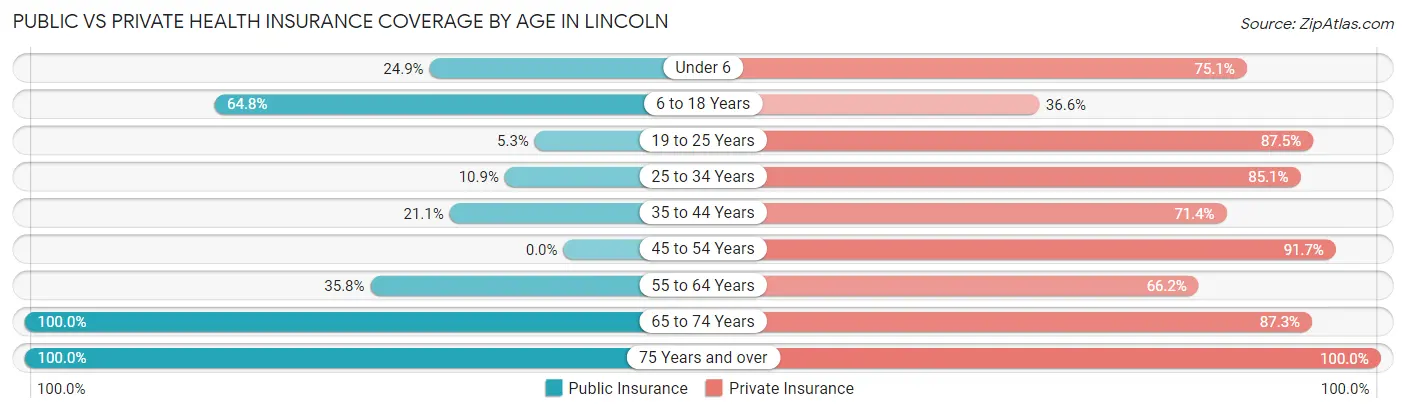
| Age Bracket | Public Insurance | Private Insurance |
| Under 6 | 87 (24.9%) | 263 (75.1%) |
| 6 to 18 Years | 691 (64.8%) | 390 (36.6%) |
| 19 to 25 Years | 14 (5.3%) | 230 (87.5%) |
| 25 to 34 Years | 57 (10.9%) | 446 (85.1%) |
| 35 to 44 Years | 82 (21.1%) | 277 (71.4%) |
| 45 to 54 Years | 0 (0.0%) | 374 (91.7%) |
| 55 to 64 Years | 139 (35.8%) | 257 (66.2%) |
| 65 to 74 Years | 204 (100.0%) | 178 (87.3%) |
| 75 Years and over | 47 (100.0%) | 47 (100.0%) |
| Total | 1,321 (36.3%) | 2,462 (67.7%) |
Disability Status by Sex by Age in Lincoln
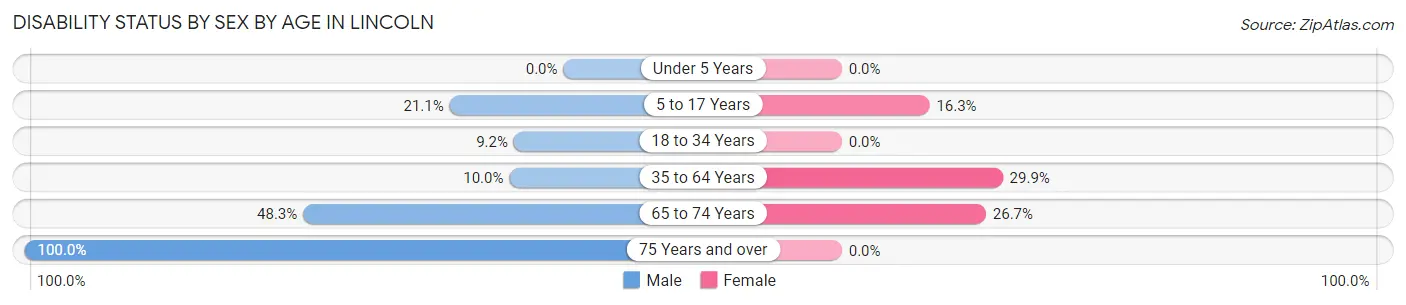
| Age Bracket | Male | Female |
| Under 5 Years | 0 (0.0%) | 0 (0.0%) |
| 5 to 17 Years | 124 (21.1%) | 88 (16.3%) |
| 18 to 34 Years | 38 (9.2%) | 0 (0.0%) |
| 35 to 64 Years | 61 (10.0%) | 172 (29.9%) |
| 65 to 74 Years | 57 (48.3%) | 23 (26.7%) |
| 75 Years and over | 31 (100.0%) | 0 (0.0%) |
Disability Class by Sex by Age in Lincoln
Disability Class: Hearing Difficulty
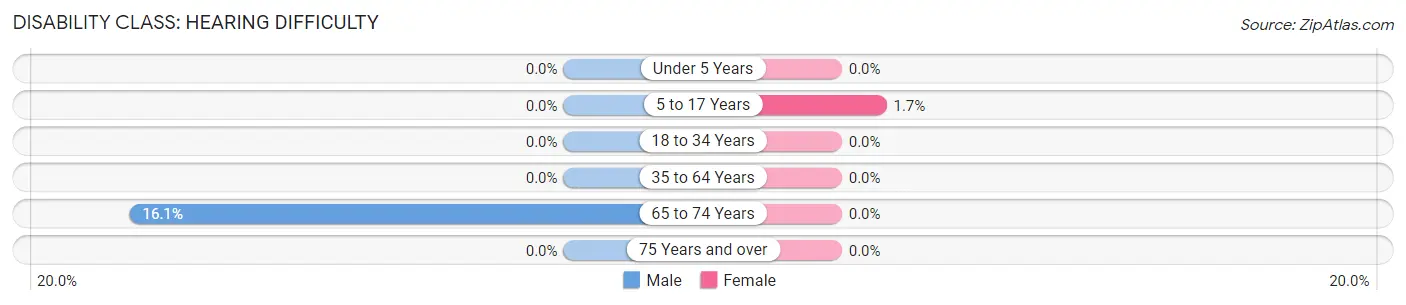
| Age Bracket | Male | Female |
| Under 5 Years | 0 (0.0%) | 0 (0.0%) |
| 5 to 17 Years | 0 (0.0%) | 9 (1.7%) |
| 18 to 34 Years | 0 (0.0%) | 0 (0.0%) |
| 35 to 64 Years | 0 (0.0%) | 0 (0.0%) |
| 65 to 74 Years | 19 (16.1%) | 0 (0.0%) |
| 75 Years and over | 0 (0.0%) | 0 (0.0%) |
Disability Class: Vision Difficulty
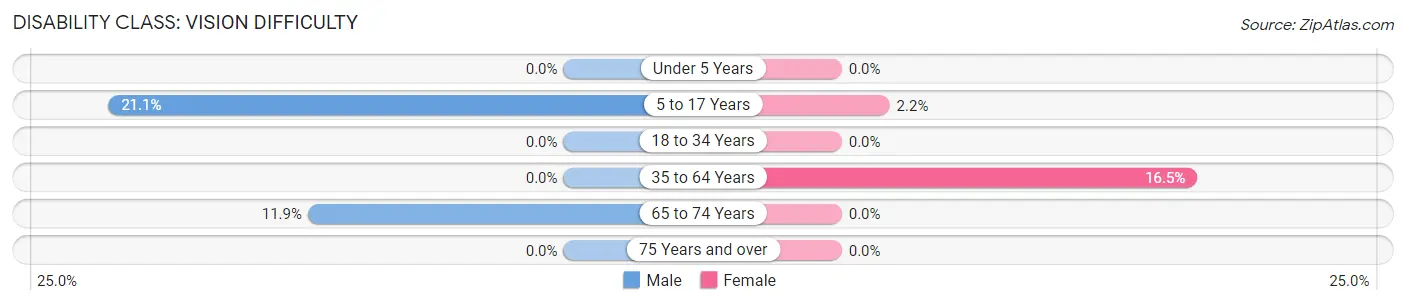
| Age Bracket | Male | Female |
| Under 5 Years | 0 (0.0%) | 0 (0.0%) |
| 5 to 17 Years | 124 (21.1%) | 12 (2.2%) |
| 18 to 34 Years | 0 (0.0%) | 0 (0.0%) |
| 35 to 64 Years | 0 (0.0%) | 95 (16.5%) |
| 65 to 74 Years | 14 (11.9%) | 0 (0.0%) |
| 75 Years and over | 0 (0.0%) | 0 (0.0%) |
Disability Class: Cognitive Difficulty
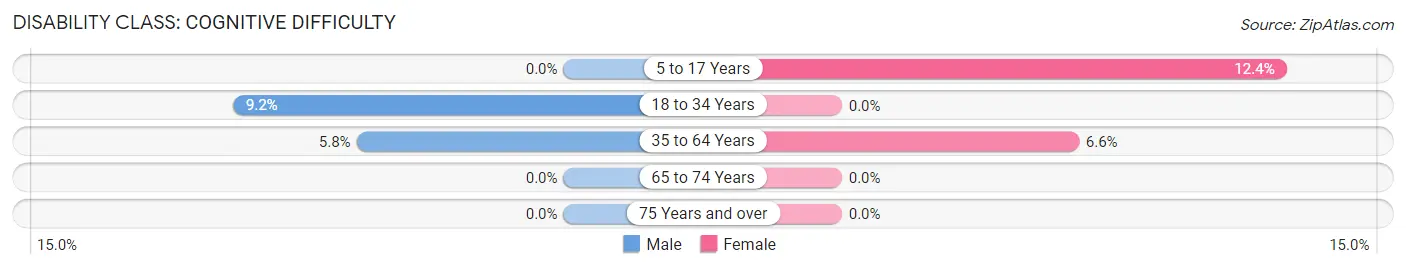
| Age Bracket | Male | Female |
| 5 to 17 Years | 0 (0.0%) | 67 (12.4%) |
| 18 to 34 Years | 38 (9.2%) | 0 (0.0%) |
| 35 to 64 Years | 35 (5.8%) | 38 (6.6%) |
| 65 to 74 Years | 0 (0.0%) | 0 (0.0%) |
| 75 Years and over | 0 (0.0%) | 0 (0.0%) |
Disability Class: Ambulatory Difficulty
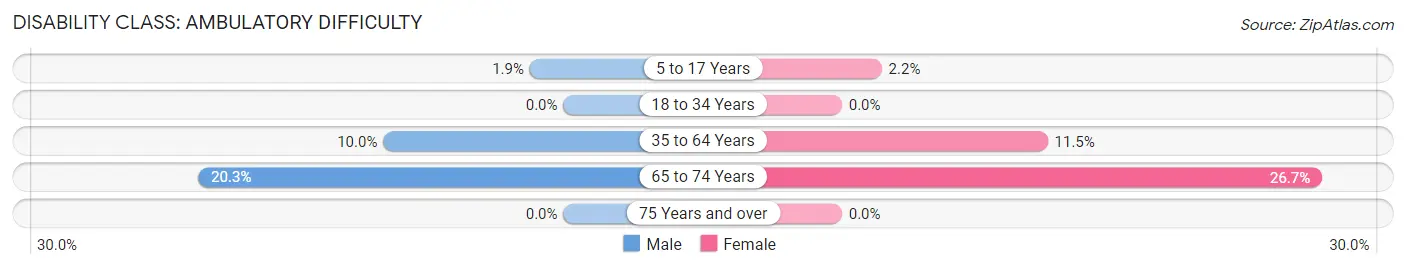
| Age Bracket | Male | Female |
| 5 to 17 Years | 11 (1.9%) | 12 (2.2%) |
| 18 to 34 Years | 0 (0.0%) | 0 (0.0%) |
| 35 to 64 Years | 61 (10.0%) | 66 (11.5%) |
| 65 to 74 Years | 24 (20.3%) | 23 (26.7%) |
| 75 Years and over | 0 (0.0%) | 0 (0.0%) |
Disability Class: Self-Care Difficulty
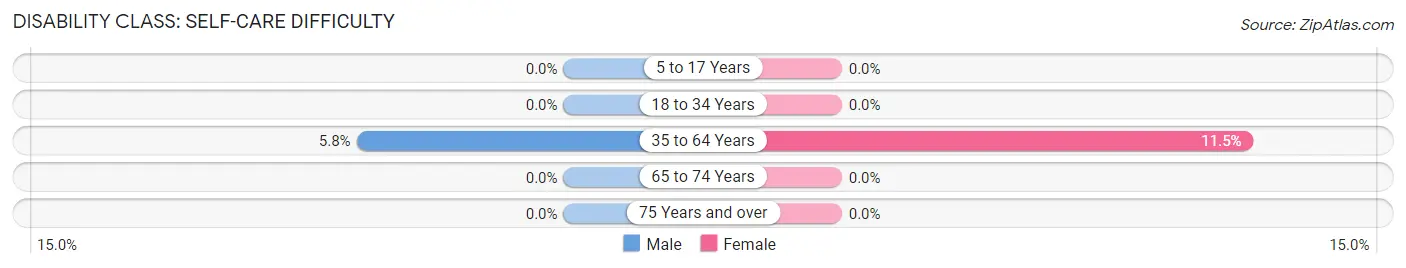
| Age Bracket | Male | Female |
| 5 to 17 Years | 0 (0.0%) | 0 (0.0%) |
| 18 to 34 Years | 0 (0.0%) | 0 (0.0%) |
| 35 to 64 Years | 35 (5.8%) | 66 (11.5%) |
| 65 to 74 Years | 0 (0.0%) | 0 (0.0%) |
| 75 Years and over | 0 (0.0%) | 0 (0.0%) |
Technology Access in Lincoln
Computing Device Access in Lincoln
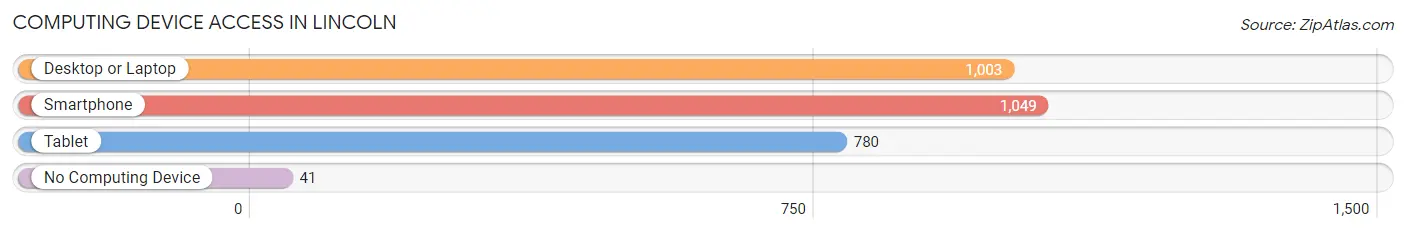
| Device Type | # Households | % Households |
| Desktop or Laptop | 1,003 | 86.9% |
| Smartphone | 1,049 | 90.9% |
| Tablet | 780 | 67.6% |
| No Computing Device | 41 | 3.5% |
| Total | 1,154 | 100.0% |
Internet Access in Lincoln
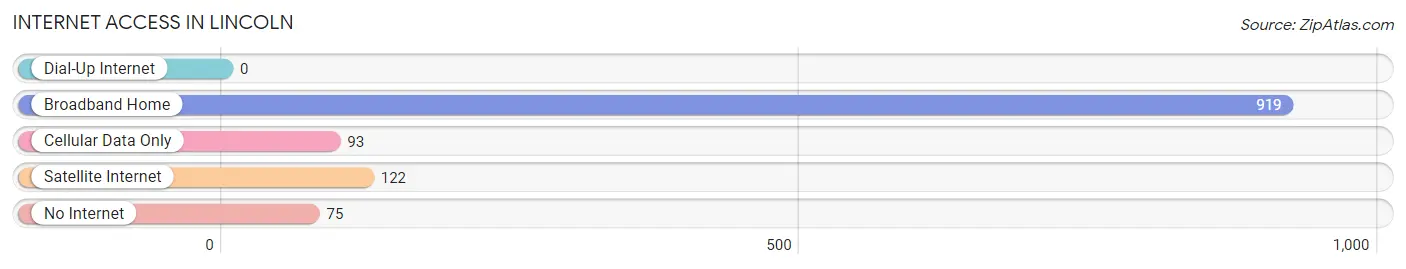
| Internet Type | # Households | % Households |
| Dial-Up Internet | 0 | 0.0% |
| Broadband Home | 919 | 79.6% |
| Cellular Data Only | 93 | 8.1% |
| Satellite Internet | 122 | 10.6% |
| No Internet | 75 | 6.5% |
| Total | 1,154 | 100.0% |
Lincoln Summary
Lincoln, Idaho is a small city located in the northern part of the state, in the county of Bonner. It is situated on the banks of the Pend Oreille River, and is surrounded by the Selkirk Mountains. The city has a population of just over 1,000 people, and is the county seat of Bonner County.
History
Lincoln was first settled in the late 1800s by a group of homesteaders who were drawn to the area by the abundance of natural resources. The city was officially incorporated in 1909, and was named after Abraham Lincoln, the 16th President of the United States.
In the early 1900s, the city was a hub for logging and mining operations, and the population grew rapidly. The city was also home to a number of sawmills, which provided employment for many of the residents.
In the 1950s, the city began to experience a decline in population as the logging and mining industries began to decline. However, the city was able to remain afloat due to its proximity to the Pend Oreille River, which provided a steady source of income for the city through tourism and recreation.
Geography
Lincoln is located in the northern part of Idaho, in the county of Bonner. It is situated on the banks of the Pend Oreille River, and is surrounded by the Selkirk Mountains. The city has a total area of 1.2 square miles, and is located at an elevation of 2,717 feet.
The climate in Lincoln is generally mild, with warm summers and cold winters. The average annual temperature is around 45 degrees Fahrenheit, and the average annual precipitation is around 20 inches.
Economy
The economy of Lincoln is largely based on tourism and recreation. The city is home to a number of resorts and campgrounds, which attract visitors from all over the country. The city is also home to a number of small businesses, including restaurants, retail stores, and service providers.
The city is also home to a number of manufacturing companies, which produce a variety of products, including furniture, clothing, and electronics. The city is also home to a number of agricultural operations, which produce a variety of crops, including wheat, barley, and hay.
Demographics
As of the 2010 census, the population of Lincoln was 1,037. The racial makeup of the city was 95.3% White, 0.7% Native American, 0.3% Asian, 0.2% African American, 0.1% Pacific Islander, and 3.4% from other races. The median household income was $37,917, and the median family income was $45,938.
The city is home to a number of churches, including the Church of Jesus Christ of Latter-day Saints, the United Methodist Church, and the Catholic Church. The city is also home to a number of schools, including Lincoln Elementary School, Lincoln Middle School, and Lincoln High School.
Conclusion
Lincoln, Idaho is a small city located in the northern part of the state, in the county of Bonner. It is situated on the banks of the Pend Oreille River, and is surrounded by the Selkirk Mountains. The city has a population of just over 1,000 people, and is the county seat of Bonner County. The economy of Lincoln is largely based on tourism and recreation, and the city is home to a number of small businesses, manufacturing companies, and agricultural operations. The city is also home to a number of churches and schools.
Common Questions
What is the Total Population of Lincoln?
Total Population of Lincoln is 3,638.
What is the Total Male Population of Lincoln?
Total Male Population of Lincoln is 1,854.
What is the Total Female Population of Lincoln?
Total Female Population of Lincoln is 1,784.
What is the Ratio of Males per 100 Females in Lincoln?
There are 103.92 Males per 100 Females in Lincoln.
What is the Ratio of Females per 100 Males in Lincoln?
There are 96.22 Females per 100 Males in Lincoln.
What is the Median Population Age in Lincoln?
Median Population Age in Lincoln is 29.4 Years.
What is the Average Family Size in Lincoln
Average Family Size in Lincoln is 3.4 People.
What is the Average Household Size in Lincoln
Average Household Size in Lincoln is 3.1 People.
What is Per Capita Income in Lincoln?
Per Capita income in Lincoln is $27,405.
What is the Median Family Income in Lincoln?
Median Family Income in Lincoln is $78,013.
What is the Median Household income in Lincoln?
Median Household Income in Lincoln is $77,623.
What is Income or Wage Gap in Lincoln?
Income or Wage Gap in Lincoln is 45.0%.
Women in Lincoln earn 55.0 cents for every dollar earned by a man.
What is Inequality or Gini Index in Lincoln?
Inequality or Gini Index in Lincoln is 0.33.
How Large is the Labor Force in Lincoln?
There are 1,769 People in the Labor Forcein in Lincoln.
What is the Percentage of People in the Labor Force in Lincoln?
77.6% of People are in the Labor Force in Lincoln.
What is the Unemployment Rate in Lincoln?
Unemployment Rate in Lincoln is 5.7%.