Boise City, ID
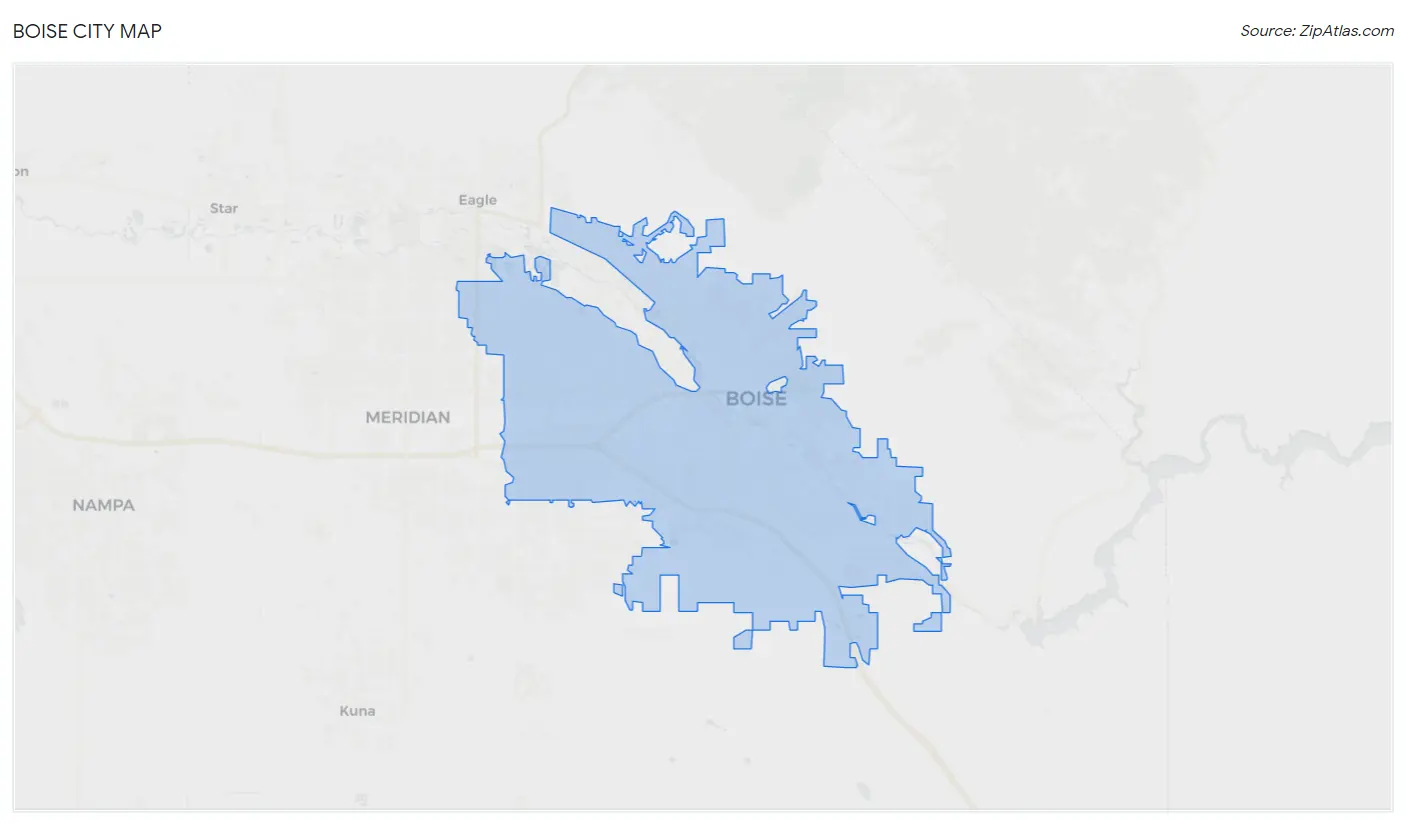
Boise City Map
Boise City Overview
234,192
TOTAL POPULATION
118,618
MALE POPULATION
115,574
FEMALE POPULATION
102.63
MALES / 100 FEMALES
97.43
FEMALES / 100 MALES
37.9
MEDIAN AGE
2.9
AVG FAMILY SIZE
2.3
AVG HOUSEHOLD SIZE
$44,728
PER CAPITA INCOME
$95,461
AVG FAMILY INCOME
$76,402
AVG HOUSEHOLD INCOME
23.7%
WAGE / INCOME GAP [ % ]
76.3¢/ $1
WAGE / INCOME GAP [ $ ]
$10,700
FAMILY INCOME DEFICIT
0.46
INEQUALITY / GINI INDEX
133,769
LABOR FORCE [ PEOPLE ]
68.5%
PERCENT IN LABOR FORCE
3.8%
UNEMPLOYMENT RATE
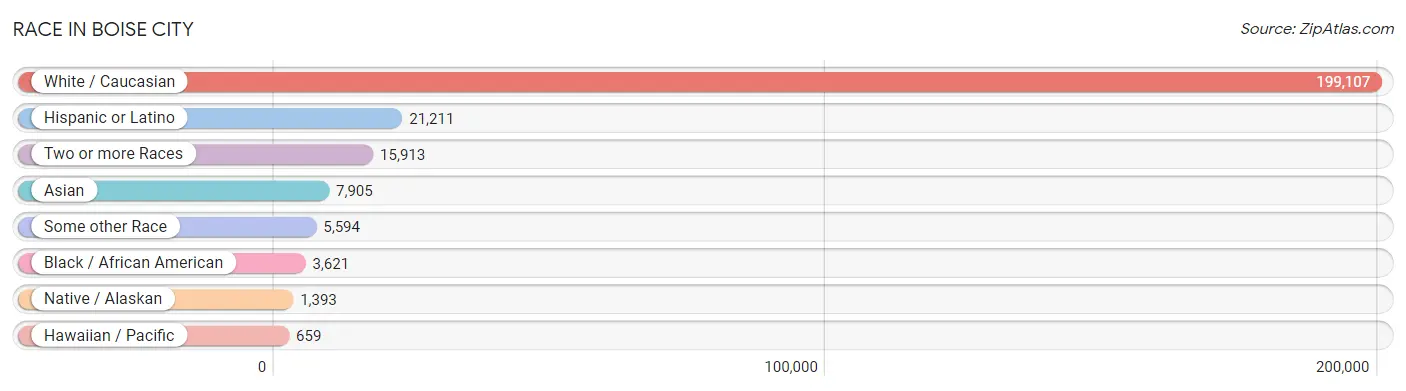
Race in Boise City
The most populous races in Boise City are White / Caucasian (199,107 | 85.0%), Hispanic or Latino (21,211 | 9.1%), and Two or more Races (15,913 | 6.8%).
| Race | # Population | % Population |
| Asian | 7,905 | 3.4% |
| Black / African American | 3,621 | 1.5% |
| Hawaiian / Pacific | 659 | 0.3% |
| Hispanic or Latino | 21,211 | 9.1% |
| Native / Alaskan | 1,393 | 0.6% |
| White / Caucasian | 199,107 | 85.0% |
| Two or more Races | 15,913 | 6.8% |
| Some other Race | 5,594 | 2.4% |
| Total | 234,192 | 100.0% |
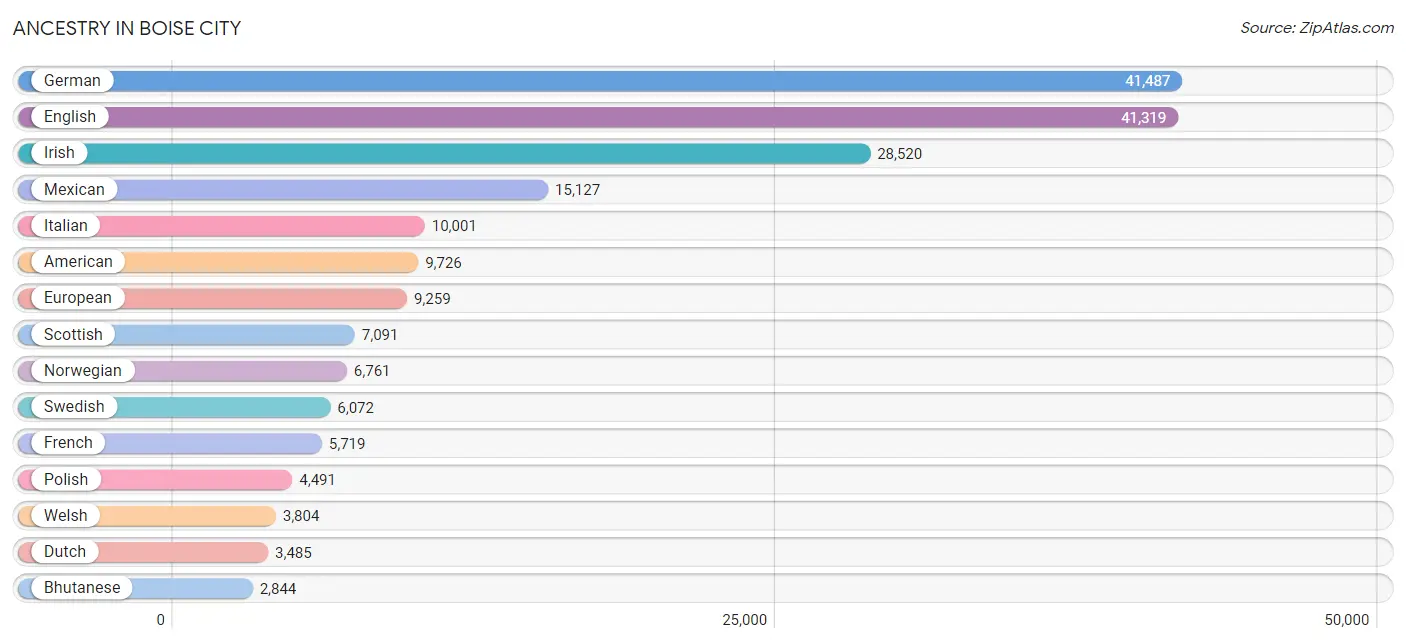
Ancestry in Boise City
The most populous ancestries reported in Boise City are German (41,487 | 17.7%), English (41,319 | 17.6%), Irish (28,520 | 12.2%), Mexican (15,127 | 6.5%), and Italian (10,001 | 4.3%), together accounting for 58.3% of all Boise City residents.
| Ancestry | # Population | % Population |
| Afghan | 117 | 0.1% |
| African | 411 | 0.2% |
| Alaska Native | 21 | 0.0% |
| Alaskan Athabascan | 9 | 0.0% |
| Albanian | 13 | 0.0% |
| American | 9,726 | 4.2% |
| Apache | 91 | 0.0% |
| Arab | 2,284 | 1.0% |
| Argentinean | 183 | 0.1% |
| Armenian | 184 | 0.1% |
| Assyrian / Chaldean / Syriac | 14 | 0.0% |
| Australian | 178 | 0.1% |
| Austrian | 453 | 0.2% |
| Basque | 2,808 | 1.2% |
| Belgian | 203 | 0.1% |
| Bhutanese | 2,844 | 1.2% |
| Blackfeet | 71 | 0.0% |
| Bolivian | 14 | 0.0% |
| Brazilian | 229 | 0.1% |
| British | 2,216 | 0.9% |
| Bulgarian | 133 | 0.1% |
| Burmese | 1,090 | 0.5% |
| Cajun | 36 | 0.0% |
| Cambodian | 7 | 0.0% |
| Canadian | 359 | 0.2% |
| Cape Verdean | 43 | 0.0% |
| Carpatho Rusyn | 36 | 0.0% |
| Celtic | 89 | 0.0% |
| Central American | 493 | 0.2% |
| Central American Indian | 171 | 0.1% |
| Cherokee | 875 | 0.4% |
| Chinese | 24 | 0.0% |
| Chippewa | 650 | 0.3% |
| Choctaw | 82 | 0.0% |
| Colombian | 325 | 0.1% |
| Comanche | 18 | 0.0% |
| Costa Rican | 128 | 0.1% |
| Cree | 476 | 0.2% |
| Creek | 6 | 0.0% |
| Croatian | 439 | 0.2% |
| Cuban | 225 | 0.1% |
| Czech | 1,222 | 0.5% |
| Czechoslovakian | 296 | 0.1% |
| Danish | 2,613 | 1.1% |
| Delaware | 17 | 0.0% |
| Dominican | 348 | 0.2% |
| Dutch | 3,485 | 1.5% |
| Eastern European | 718 | 0.3% |
| Ecuadorian | 241 | 0.1% |
| Egyptian | 57 | 0.0% |
| English | 41,319 | 17.6% |
| Ethiopian | 148 | 0.1% |
| European | 9,259 | 4.0% |
| Fijian | 177 | 0.1% |
| Filipino | 73 | 0.0% |
| Finnish | 490 | 0.2% |
| French | 5,719 | 2.4% |
| French American Indian | 92 | 0.0% |
| French Canadian | 1,609 | 0.7% |
| German | 41,487 | 17.7% |
| German Russian | 28 | 0.0% |
| Greek | 852 | 0.4% |
| Guamanian / Chamorro | 225 | 0.1% |
| Guatemalan | 170 | 0.1% |
| Haitian | 84 | 0.0% |
| Honduran | 13 | 0.0% |
| Houma | 7 | 0.0% |
| Hungarian | 966 | 0.4% |
| Icelander | 114 | 0.1% |
| Indian (Asian) | 2,452 | 1.1% |
| Indonesian | 62 | 0.0% |
| Iranian | 169 | 0.1% |
| Iraqi | 743 | 0.3% |
| Irish | 28,520 | 12.2% |
| Iroquois | 36 | 0.0% |
| Israeli | 14 | 0.0% |
| Italian | 10,001 | 4.3% |
| Jamaican | 101 | 0.0% |
| Japanese | 37 | 0.0% |
| Jordanian | 57 | 0.0% |
| Korean | 2,012 | 0.9% |
| Laotian | 139 | 0.1% |
| Latvian | 61 | 0.0% |
| Lebanese | 541 | 0.2% |
| Lithuanian | 496 | 0.2% |
| Luxembourger | 37 | 0.0% |
| Malaysian | 564 | 0.2% |
| Mexican | 15,127 | 6.5% |
| Mexican American Indian | 431 | 0.2% |
| Mongolian | 16 | 0.0% |
| Moroccan | 29 | 0.0% |
| Native Hawaiian | 430 | 0.2% |
| Navajo | 91 | 0.0% |
| Nicaraguan | 34 | 0.0% |
| Nigerian | 128 | 0.1% |
| Northern European | 1,546 | 0.7% |
| Norwegian | 6,761 | 2.9% |
| Osage | 11 | 0.0% |
| Ottawa | 7 | 0.0% |
| Paiute | 7 | 0.0% |
| Pakistani | 196 | 0.1% |
| Panamanian | 99 | 0.0% |
| Paraguayan | 58 | 0.0% |
| Pennsylvania German | 49 | 0.0% |
| Peruvian | 152 | 0.1% |
| Polish | 4,491 | 1.9% |
| Portuguese | 829 | 0.4% |
| Pueblo | 108 | 0.1% |
| Puerto Rican | 1,032 | 0.4% |
| Puget Sound Salish | 29 | 0.0% |
| Romanian | 422 | 0.2% |
| Russian | 1,158 | 0.5% |
| Salvadoran | 45 | 0.0% |
| Samoan | 112 | 0.1% |
| Scandinavian | 2,620 | 1.1% |
| Scotch-Irish | 2,146 | 0.9% |
| Scottish | 7,091 | 3.0% |
| Seminole | 6 | 0.0% |
| Senegalese | 21 | 0.0% |
| Serbian | 183 | 0.1% |
| Shoshone | 76 | 0.0% |
| Sioux | 235 | 0.1% |
| Slavic | 123 | 0.1% |
| Slovak | 326 | 0.1% |
| Slovene | 91 | 0.0% |
| Somali | 360 | 0.2% |
| South African | 57 | 0.0% |
| South American | 1,055 | 0.4% |
| South American Indian | 5 | 0.0% |
| Spaniard | 903 | 0.4% |
| Spanish | 1,073 | 0.5% |
| Sri Lankan | 818 | 0.4% |
| Subsaharan African | 1,804 | 0.8% |
| Sudanese | 477 | 0.2% |
| Swedish | 6,072 | 2.6% |
| Swiss | 1,348 | 0.6% |
| Syrian | 187 | 0.1% |
| Taiwanese | 72 | 0.0% |
| Thai | 1,776 | 0.8% |
| Turkish | 47 | 0.0% |
| Ukrainian | 909 | 0.4% |
| Venezuelan | 82 | 0.0% |
| Welsh | 3,804 | 1.6% |
| West Indian | 31 | 0.0% |
| Yaqui | 57 | 0.0% |
| Yugoslavian | 266 | 0.1% | View All 146 Rows |
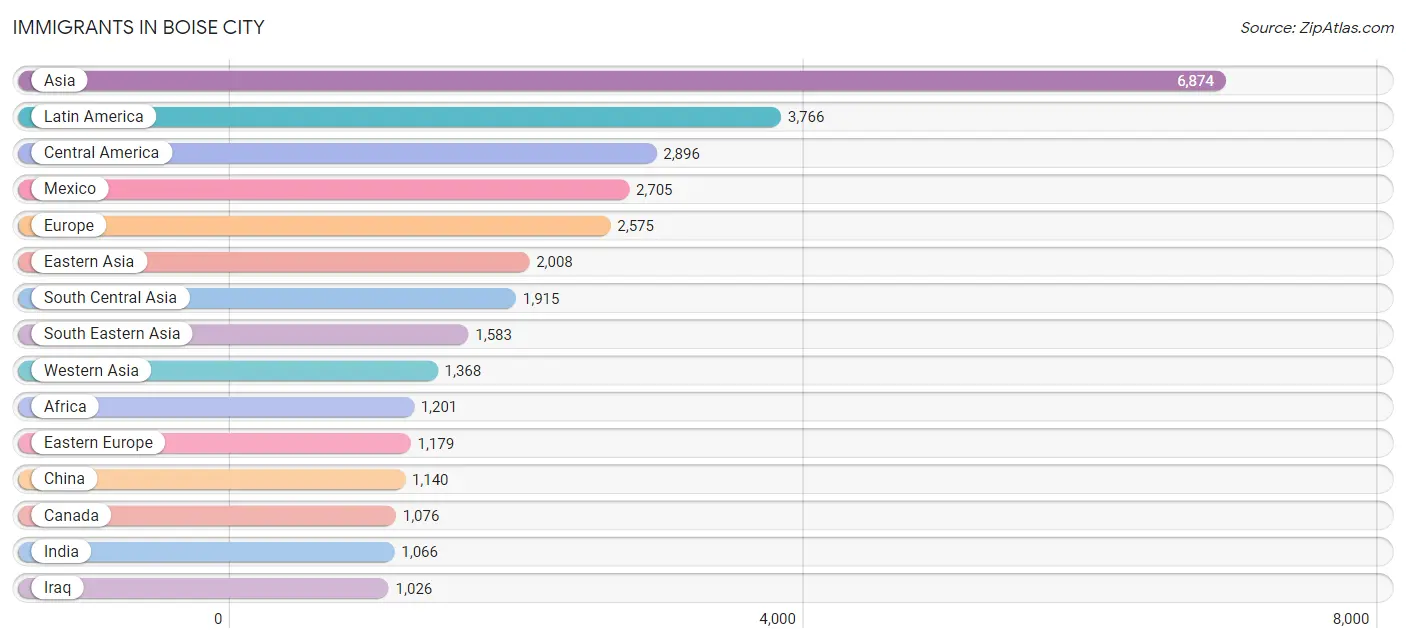
Immigrants in Boise City
The most numerous immigrant groups reported in Boise City came from Asia (6,874 | 2.9%), Latin America (3,766 | 1.6%), Central America (2,896 | 1.2%), Mexico (2,705 | 1.2%), and Europe (2,575 | 1.1%), together accounting for 8.1% of all Boise City residents.
| Immigration Origin | # Population | % Population |
| Afghanistan | 130 | 0.1% |
| Africa | 1,201 | 0.5% |
| Albania | 13 | 0.0% |
| Argentina | 5 | 0.0% |
| Asia | 6,874 | 2.9% |
| Australia | 160 | 0.1% |
| Bangladesh | 55 | 0.0% |
| Belarus | 2 | 0.0% |
| Belgium | 52 | 0.0% |
| Bosnia and Herzegovina | 112 | 0.1% |
| Brazil | 149 | 0.1% |
| Bulgaria | 64 | 0.0% |
| Cabo Verde | 12 | 0.0% |
| Canada | 1,076 | 0.5% |
| Caribbean | 174 | 0.1% |
| Central America | 2,896 | 1.2% |
| Chile | 43 | 0.0% |
| China | 1,140 | 0.5% |
| Colombia | 327 | 0.1% |
| Congo | 145 | 0.1% |
| Costa Rica | 41 | 0.0% |
| Croatia | 136 | 0.1% |
| Cuba | 85 | 0.0% |
| Czechoslovakia | 116 | 0.1% |
| Denmark | 30 | 0.0% |
| Dominican Republic | 41 | 0.0% |
| Eastern Africa | 714 | 0.3% |
| Eastern Asia | 2,008 | 0.9% |
| Eastern Europe | 1,179 | 0.5% |
| Ecuador | 18 | 0.0% |
| Egypt | 128 | 0.1% |
| El Salvador | 21 | 0.0% |
| England | 248 | 0.1% |
| Eritrea | 65 | 0.0% |
| Ethiopia | 135 | 0.1% |
| Europe | 2,575 | 1.1% |
| France | 28 | 0.0% |
| Germany | 484 | 0.2% |
| Ghana | 10 | 0.0% |
| Guatemala | 94 | 0.0% |
| Haiti | 39 | 0.0% |
| Honduras | 9 | 0.0% |
| Hong Kong | 95 | 0.0% |
| Hungary | 65 | 0.0% |
| India | 1,066 | 0.5% |
| Indonesia | 49 | 0.0% |
| Iran | 111 | 0.1% |
| Iraq | 1,026 | 0.4% |
| Ireland | 22 | 0.0% |
| Israel | 32 | 0.0% |
| Italy | 100 | 0.0% |
| Jamaica | 9 | 0.0% |
| Japan | 370 | 0.2% |
| Jordan | 13 | 0.0% |
| Kenya | 47 | 0.0% |
| Korea | 498 | 0.2% |
| Kuwait | 16 | 0.0% |
| Laos | 459 | 0.2% |
| Latin America | 3,766 | 1.6% |
| Lebanon | 10 | 0.0% |
| Lithuania | 16 | 0.0% |
| Malaysia | 49 | 0.0% |
| Mexico | 2,705 | 1.2% |
| Middle Africa | 198 | 0.1% |
| Moldova | 13 | 0.0% |
| Morocco | 7 | 0.0% |
| Nepal | 279 | 0.1% |
| Netherlands | 30 | 0.0% |
| Nigeria | 35 | 0.0% |
| Northern Africa | 175 | 0.1% |
| Northern Europe | 529 | 0.2% |
| Norway | 11 | 0.0% |
| Oceania | 196 | 0.1% |
| Pakistan | 163 | 0.1% |
| Panama | 26 | 0.0% |
| Peru | 110 | 0.1% |
| Philippines | 431 | 0.2% |
| Poland | 20 | 0.0% |
| Romania | 183 | 0.1% |
| Russia | 196 | 0.1% |
| Saudi Arabia | 79 | 0.0% |
| Scotland | 31 | 0.0% |
| Serbia | 53 | 0.0% |
| Singapore | 49 | 0.0% |
| Somalia | 185 | 0.1% |
| South Africa | 57 | 0.0% |
| South America | 696 | 0.3% |
| South Central Asia | 1,915 | 0.8% |
| South Eastern Asia | 1,583 | 0.7% |
| Southern Europe | 226 | 0.1% |
| Spain | 126 | 0.1% |
| Sudan | 11 | 0.0% |
| Switzerland | 20 | 0.0% |
| Syria | 160 | 0.1% |
| Taiwan | 145 | 0.1% |
| Thailand | 92 | 0.0% |
| Turkey | 32 | 0.0% |
| Ukraine | 157 | 0.1% |
| Uzbekistan | 22 | 0.0% |
| Venezuela | 25 | 0.0% |
| Vietnam | 371 | 0.2% |
| Western Africa | 57 | 0.0% |
| Western Asia | 1,368 | 0.6% |
| Western Europe | 614 | 0.3% |
| Zaire | 53 | 0.0% |
| Zimbabwe | 13 | 0.0% | View All 106 Rows |
Sex and Age in Boise City
Sex and Age in Boise City
The most populous age groups in Boise City are 25 to 29 Years (9,868 | 8.3%) for men and 30 to 34 Years (9,236 | 8.0%) for women.
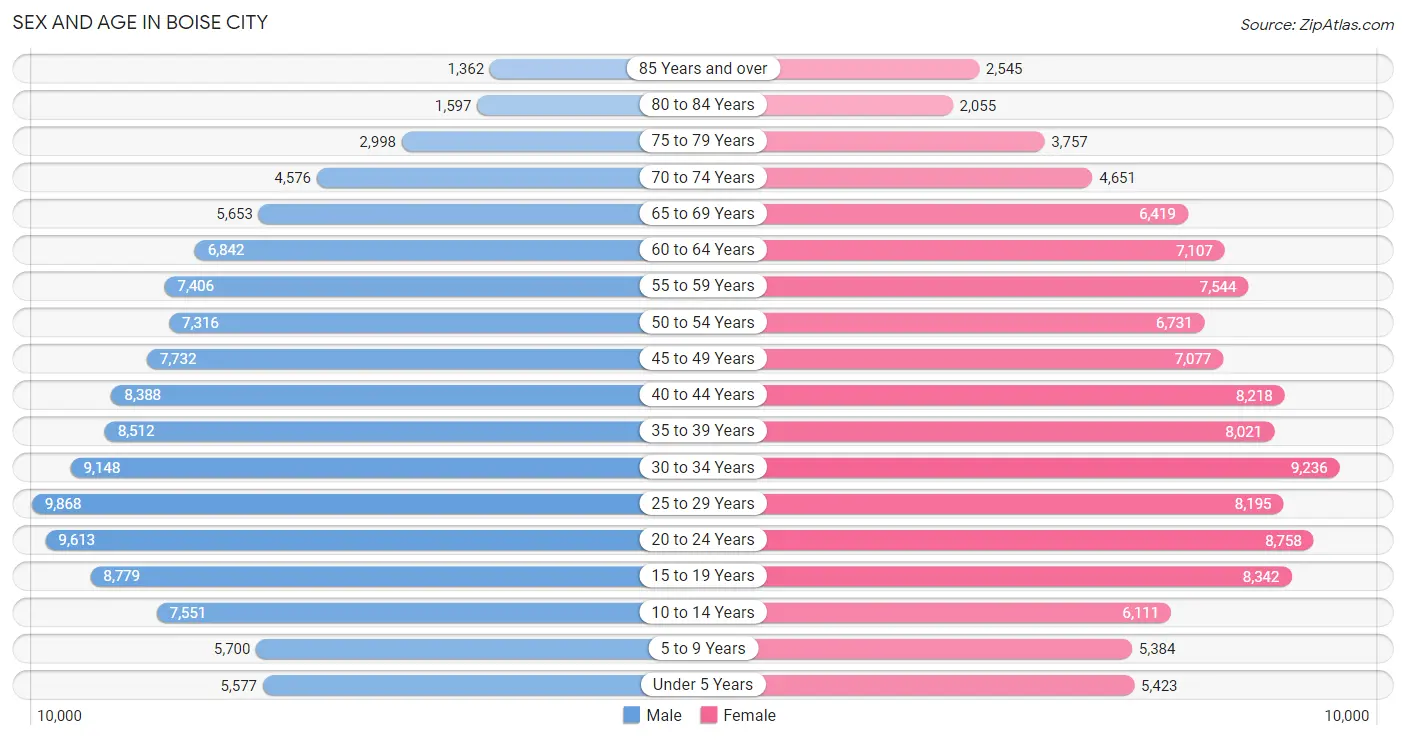
| Age Bracket | Male | Female |
| Under 5 Years | 5,577 (4.7%) | 5,423 (4.7%) |
| 5 to 9 Years | 5,700 (4.8%) | 5,384 (4.7%) |
| 10 to 14 Years | 7,551 (6.4%) | 6,111 (5.3%) |
| 15 to 19 Years | 8,779 (7.4%) | 8,342 (7.2%) |
| 20 to 24 Years | 9,613 (8.1%) | 8,758 (7.6%) |
| 25 to 29 Years | 9,868 (8.3%) | 8,195 (7.1%) |
| 30 to 34 Years | 9,148 (7.7%) | 9,236 (8.0%) |
| 35 to 39 Years | 8,512 (7.2%) | 8,021 (6.9%) |
| 40 to 44 Years | 8,388 (7.1%) | 8,218 (7.1%) |
| 45 to 49 Years | 7,732 (6.5%) | 7,077 (6.1%) |
| 50 to 54 Years | 7,316 (6.2%) | 6,731 (5.8%) |
| 55 to 59 Years | 7,406 (6.2%) | 7,544 (6.5%) |
| 60 to 64 Years | 6,842 (5.8%) | 7,107 (6.1%) |
| 65 to 69 Years | 5,653 (4.8%) | 6,419 (5.6%) |
| 70 to 74 Years | 4,576 (3.9%) | 4,651 (4.0%) |
| 75 to 79 Years | 2,998 (2.5%) | 3,757 (3.3%) |
| 80 to 84 Years | 1,597 (1.3%) | 2,055 (1.8%) |
| 85 Years and over | 1,362 (1.1%) | 2,545 (2.2%) |
| Total | 118,618 (100.0%) | 115,574 (100.0%) |
Families and Households in Boise City
Median Family Size in Boise City
The median family size in Boise City is 2.91 persons per family, with married-couple families (43,768 | 77.9%) accounting for the largest median family size of 2.94 persons per family. On the other hand, single male/father families (4,049 | 7.2%) represent the smallest median family size with 2.62 persons per family.
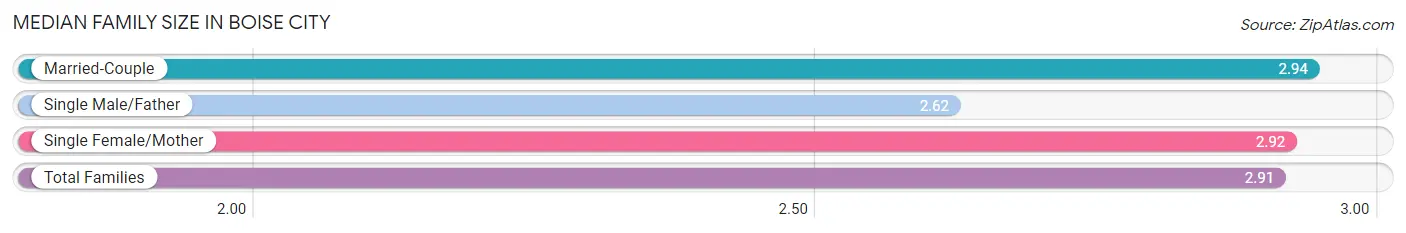
| Family Type | # Families | Family Size |
| Married-Couple | 43,768 (77.9%) | 2.94 |
| Single Male/Father | 4,049 (7.2%) | 2.62 |
| Single Female/Mother | 8,351 (14.9%) | 2.92 |
| Total Families | 56,168 (100.0%) | 2.91 |
Median Household Size in Boise City
The median household size in Boise City is 2.33 persons per household, with single female/mother households (8,351 | 8.5%) accounting for the largest median household size of 3.19 persons per household. non-family households (41,658 | 42.6%) represent the smallest median household size with 1.41 persons per household.
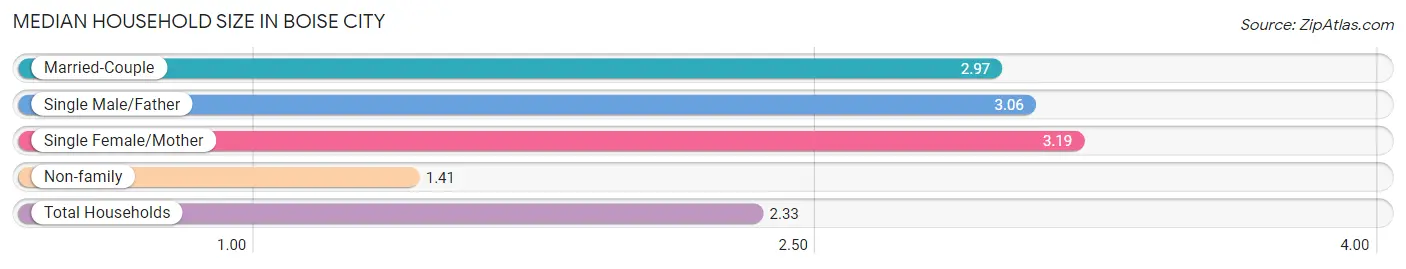
| Household Type | # Households | Household Size |
| Married-Couple | 43,768 (44.7%) | 2.97 |
| Single Male/Father | 4,049 (4.1%) | 3.06 |
| Single Female/Mother | 8,351 (8.5%) | 3.19 |
| Non-family | 41,658 (42.6%) | 1.41 |
| Total Households | 97,826 (100.0%) | 2.33 |
Household Size by Marriage Status in Boise City
Out of a total of 97,826 households in Boise City, 56,168 (57.4%) are family households, while 41,658 (42.6%) are nonfamily households. The most numerous type of family households are 2-person households, comprising 27,566, and the most common type of nonfamily households are 1-person households, comprising 30,344.
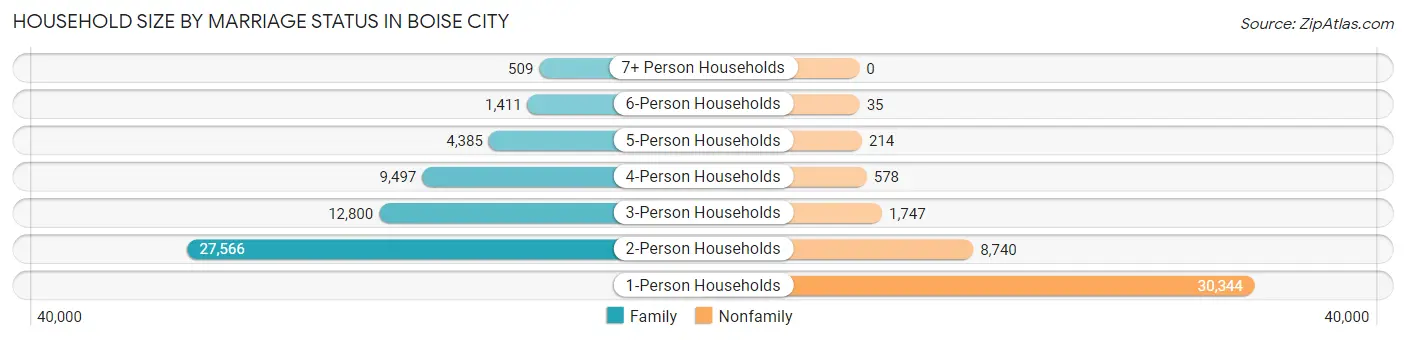
| Household Size | Family Households | Nonfamily Households |
| 1-Person Households | - | 30,344 (31.0%) |
| 2-Person Households | 27,566 (28.2%) | 8,740 (8.9%) |
| 3-Person Households | 12,800 (13.1%) | 1,747 (1.8%) |
| 4-Person Households | 9,497 (9.7%) | 578 (0.6%) |
| 5-Person Households | 4,385 (4.5%) | 214 (0.2%) |
| 6-Person Households | 1,411 (1.4%) | 35 (0.0%) |
| 7+ Person Households | 509 (0.5%) | 0 (0.0%) |
| Total | 56,168 (57.4%) | 41,658 (42.6%) |
Female Fertility in Boise City
Fertility by Age in Boise City
Average fertility rate in Boise City is 41.0 births per 1,000 women. Women in the age bracket of 20 to 34 years have the highest fertility rate with 64.0 births per 1,000 women. Women in the age bracket of 20 to 34 years acount for 69.2% of all women with births.
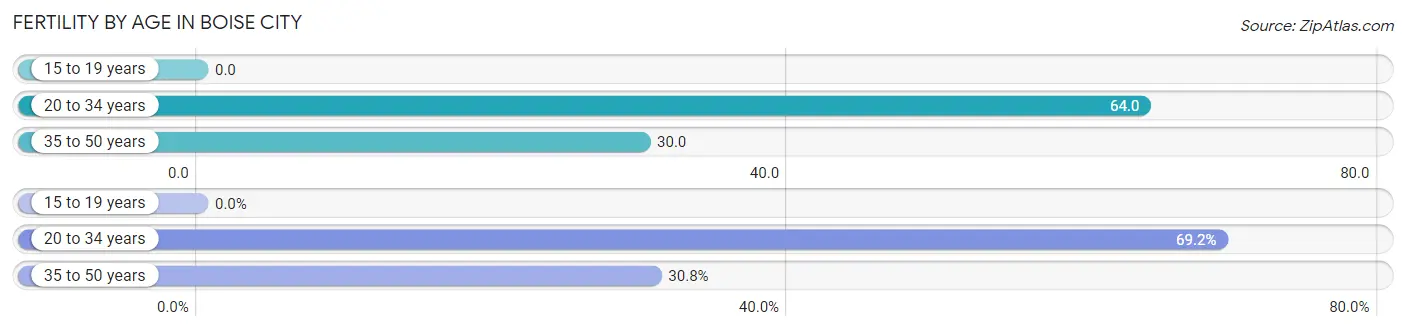
| Age Bracket | Women with Births | Births / 1,000 Women |
| 15 to 19 years | 0 (0.0%) | 0.0 |
| 20 to 34 years | 1,667 (69.2%) | 64.0 |
| 35 to 50 years | 741 (30.8%) | 30.0 |
| Total | 2,408 (100.0%) | 41.0 |
Fertility by Age by Marriage Status in Boise City
83.0% of women with births (2,408) in Boise City are married. The highest percentage of unmarried women with births falls into 20 to 34 years age bracket with 18.9% of them unmarried at the time of birth, while the lowest percentage of unmarried women with births belong to 35 to 50 years age bracket with 12.8% of them unmarried.
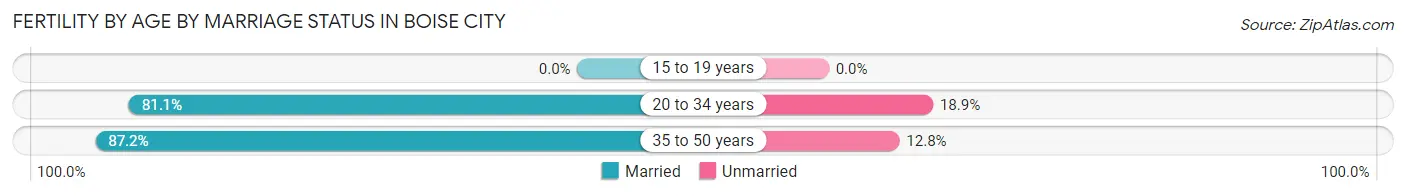
| Age Bracket | Married | Unmarried |
| 15 to 19 years | 0 (0.0%) | 0 (0.0%) |
| 20 to 34 years | 1,352 (81.1%) | 315 (18.9%) |
| 35 to 50 years | 646 (87.2%) | 95 (12.8%) |
| Total | 1,999 (83.0%) | 409 (17.0%) |
Fertility by Education in Boise City
Average fertility rate in Boise City is 41.0 births per 1,000 women. Women with the education attainment of bachelor's degree have the highest fertility rate of 62.0 births per 1,000 women, while women with the education attainment of less than high school have the lowest fertility at 16.0 births per 1,000 women. Women with the education attainment of bachelor's degree represent 42.3% of all women with births.
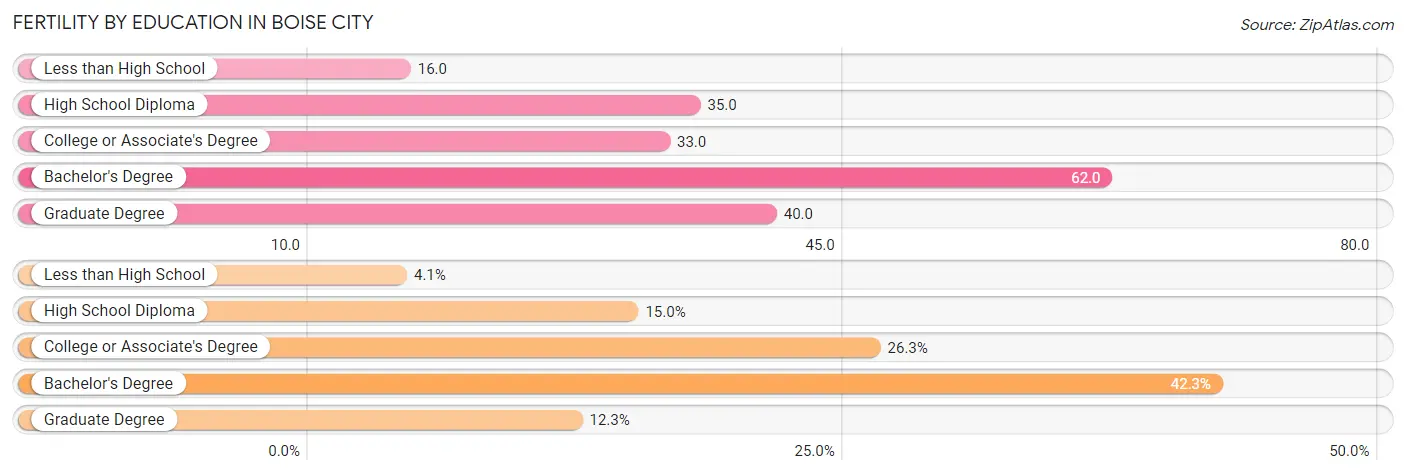
| Educational Attainment | Women with Births | Births / 1,000 Women |
| Less than High School | 99 (4.1%) | 16.0 |
| High School Diploma | 360 (14.9%) | 35.0 |
| College or Associate's Degree | 633 (26.3%) | 33.0 |
| Bachelor's Degree | 1,019 (42.3%) | 62.0 |
| Graduate Degree | 297 (12.3%) | 40.0 |
| Total | 2,408 (100.0%) | 41.0 |
Fertility by Education by Marriage Status in Boise City
17.0% of women with births in Boise City are unmarried. Women with the educational attainment of less than high school are most likely to be married with 100.0% of them married at childbirth, while women with the educational attainment of high school diploma are least likely to be married with 49.7% of them unmarried at childbirth.
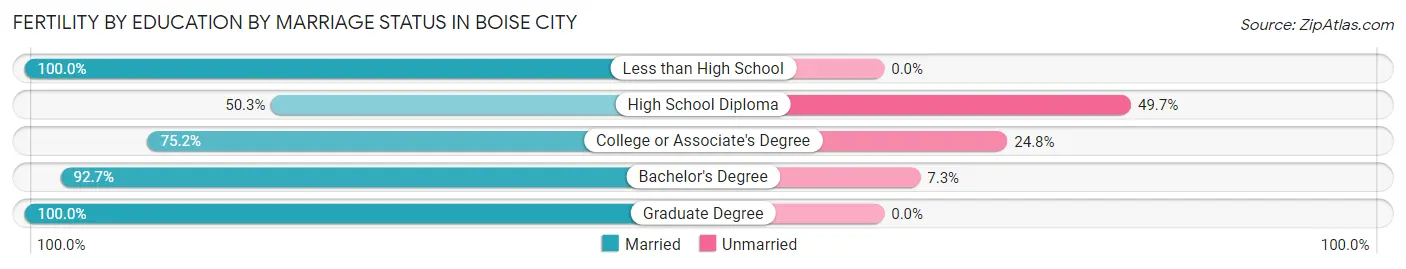
| Educational Attainment | Married | Unmarried |
| Less than High School | 99 (100.0%) | 0 (0.0%) |
| High School Diploma | 181 (50.3%) | 179 (49.7%) |
| College or Associate's Degree | 476 (75.2%) | 157 (24.8%) |
| Bachelor's Degree | 945 (92.7%) | 74 (7.3%) |
| Graduate Degree | 297 (100.0%) | 0 (0.0%) |
| Total | 1,999 (83.0%) | 409 (17.0%) |
Income in Boise City
Income Overview in Boise City
Per Capita Income in Boise City is $44,728, while median incomes of families and households are $95,461 and $76,402 respectively.
| Characteristic | Number | Measure |
| Per Capita Income | 234,192 | $44,728 |
| Median Family Income | 56,168 | $95,461 |
| Mean Family Income | 56,168 | $129,612 |
| Median Household Income | 97,826 | $76,402 |
| Mean Household Income | 97,826 | $104,532 |
| Income Deficit | 56,168 | $10,700 |
| Wage / Income Gap (%) | 234,192 | 23.70% |
| Wage / Income Gap ($) | 234,192 | 76.30¢ per $1 |
| Gini / Inequality Index | 234,192 | 0.46 |
Earnings by Sex in Boise City
Average Earnings in Boise City are $40,067, $45,518 for men and $34,731 for women, a difference of 23.7%.
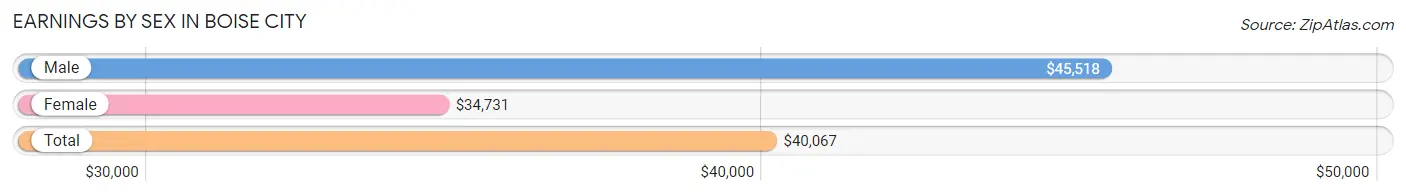
| Sex | Number | Average Earnings |
| Male | 76,756 (53.7%) | $45,518 |
| Female | 66,174 (46.3%) | $34,731 |
| Total | 142,930 (100.0%) | $40,067 |
Earnings by Sex by Income Bracket in Boise City
The most common earnings brackets in Boise City are $100,000+ for men (13,902 | 18.1%) and $100,000+ for women (6,116 | 9.2%).
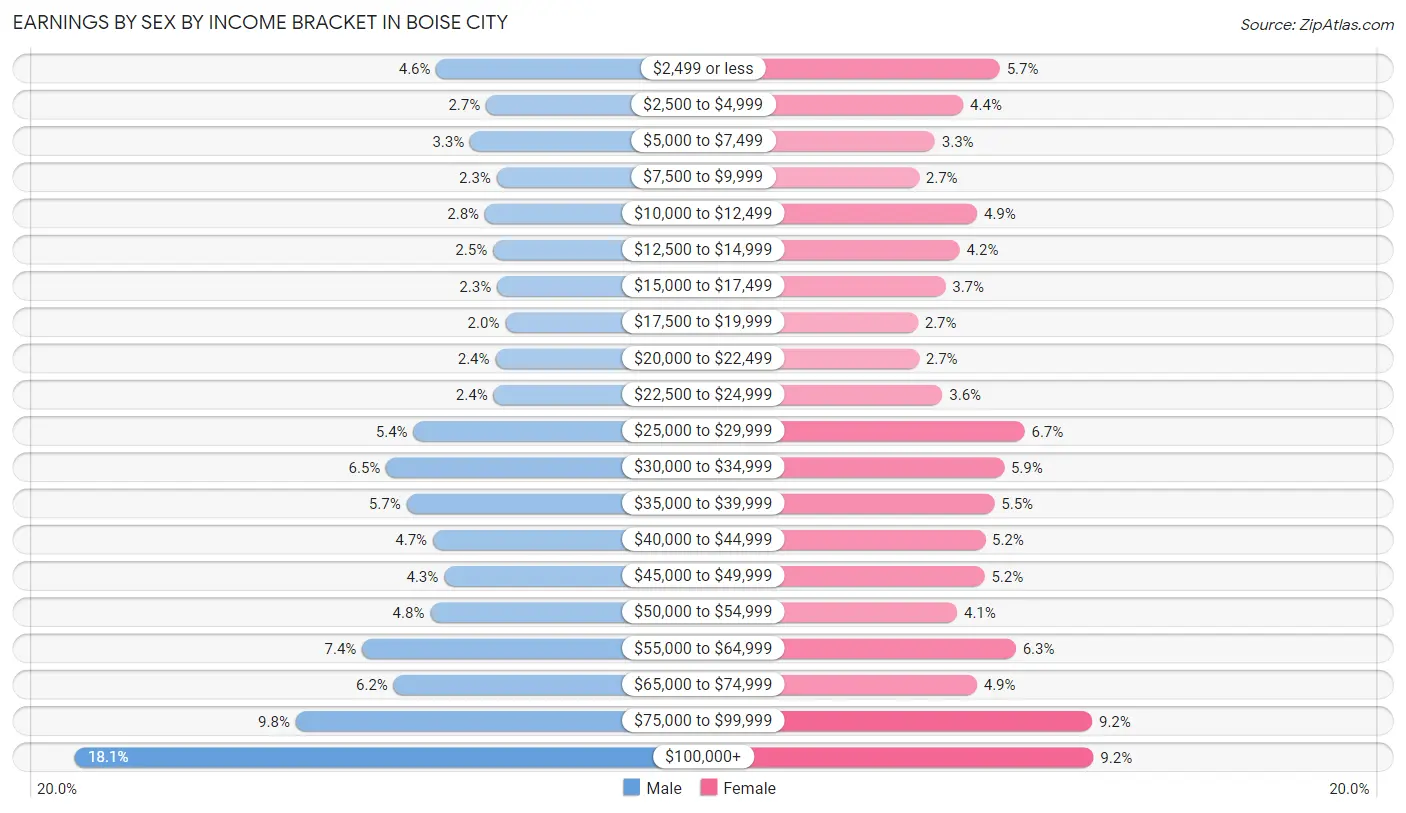
| Income | Male | Female |
| $2,499 or less | 3,508 (4.6%) | 3,789 (5.7%) |
| $2,500 to $4,999 | 2,081 (2.7%) | 2,887 (4.4%) |
| $5,000 to $7,499 | 2,540 (3.3%) | 2,184 (3.3%) |
| $7,500 to $9,999 | 1,774 (2.3%) | 1,784 (2.7%) |
| $10,000 to $12,499 | 2,109 (2.8%) | 3,229 (4.9%) |
| $12,500 to $14,999 | 1,878 (2.5%) | 2,800 (4.2%) |
| $15,000 to $17,499 | 1,767 (2.3%) | 2,445 (3.7%) |
| $17,500 to $19,999 | 1,526 (2.0%) | 1,759 (2.7%) |
| $20,000 to $22,499 | 1,813 (2.4%) | 1,786 (2.7%) |
| $22,500 to $24,999 | 1,866 (2.4%) | 2,366 (3.6%) |
| $25,000 to $29,999 | 4,166 (5.4%) | 4,405 (6.7%) |
| $30,000 to $34,999 | 4,952 (6.5%) | 3,899 (5.9%) |
| $35,000 to $39,999 | 4,371 (5.7%) | 3,659 (5.5%) |
| $40,000 to $44,999 | 3,607 (4.7%) | 3,425 (5.2%) |
| $45,000 to $49,999 | 3,283 (4.3%) | 3,413 (5.2%) |
| $50,000 to $54,999 | 3,688 (4.8%) | 2,735 (4.1%) |
| $55,000 to $64,999 | 5,638 (7.3%) | 4,186 (6.3%) |
| $65,000 to $74,999 | 4,733 (6.2%) | 3,224 (4.9%) |
| $75,000 to $99,999 | 7,554 (9.8%) | 6,083 (9.2%) |
| $100,000+ | 13,902 (18.1%) | 6,116 (9.2%) |
| Total | 76,756 (100.0%) | 66,174 (100.0%) |
Earnings by Sex by Educational Attainment in Boise City
Average earnings in Boise City are $54,461 for men and $42,152 for women, a difference of 22.6%. Men with an educational attainment of graduate degree enjoy the highest average annual earnings of $89,758, while those with less than high school education earn the least with $33,884. Women with an educational attainment of graduate degree earn the most with the average annual earnings of $68,971, while those with less than high school education have the smallest earnings of $25,511.
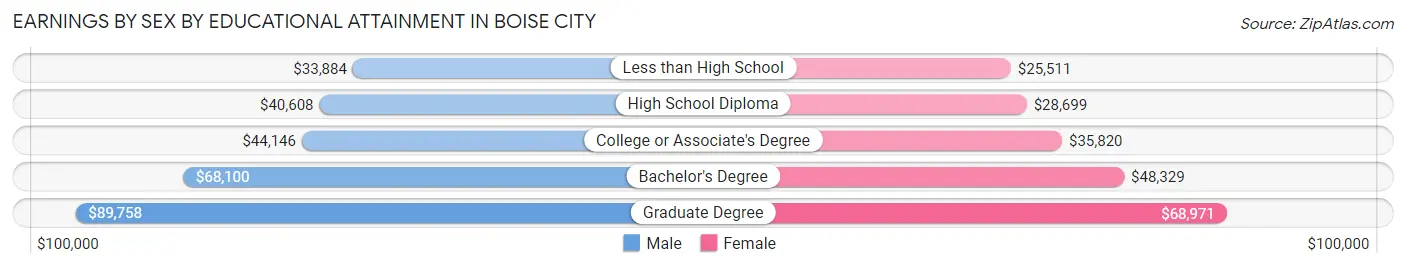
| Educational Attainment | Male Income | Female Income |
| Less than High School | $33,884 | $25,511 |
| High School Diploma | $40,608 | $28,699 |
| College or Associate's Degree | $44,146 | $35,820 |
| Bachelor's Degree | $68,100 | $48,329 |
| Graduate Degree | $89,758 | $68,971 |
| Total | $54,461 | $42,152 |
Family Income in Boise City
Family Income Brackets in Boise City
According to the Boise City family income data, there are 11,851 families falling into the $100,000 to $149,999 income range, which is the most common income bracket and makes up 21.1% of all families. Conversely, the $10,000 to $14,999 income bracket is the least frequent group with only 674 families (1.2%) belonging to this category.
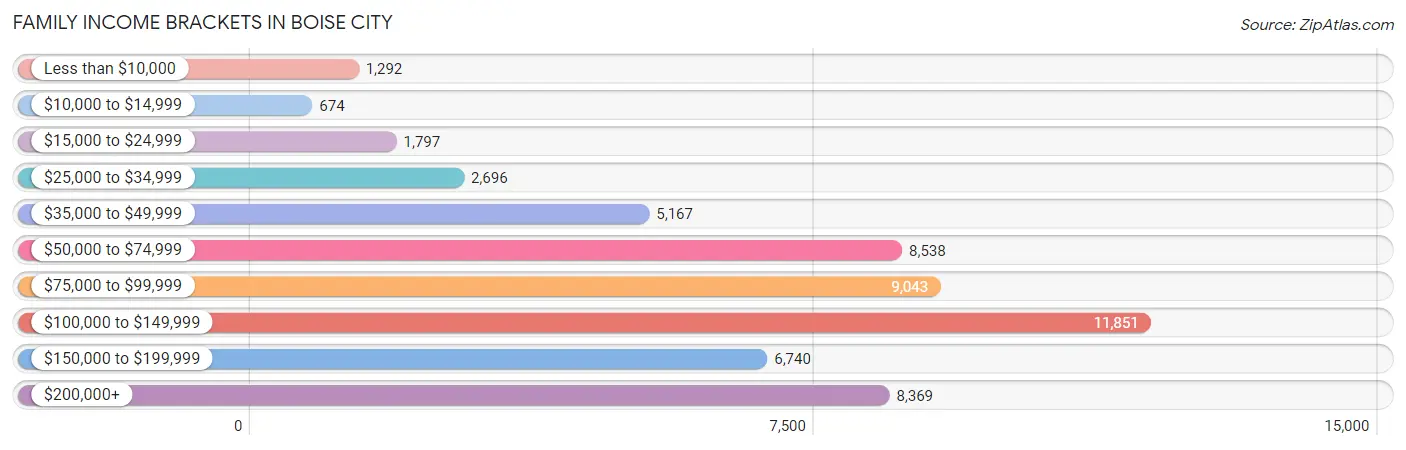
| Income Bracket | # Families | % Families |
| Less than $10,000 | 1,292 | 2.3% |
| $10,000 to $14,999 | 674 | 1.2% |
| $15,000 to $24,999 | 1,797 | 3.2% |
| $25,000 to $34,999 | 2,696 | 4.8% |
| $35,000 to $49,999 | 5,167 | 9.2% |
| $50,000 to $74,999 | 8,538 | 15.2% |
| $75,000 to $99,999 | 9,043 | 16.1% |
| $100,000 to $149,999 | 11,851 | 21.1% |
| $150,000 to $199,999 | 6,740 | 12.0% |
| $200,000+ | 8,369 | 14.9% |
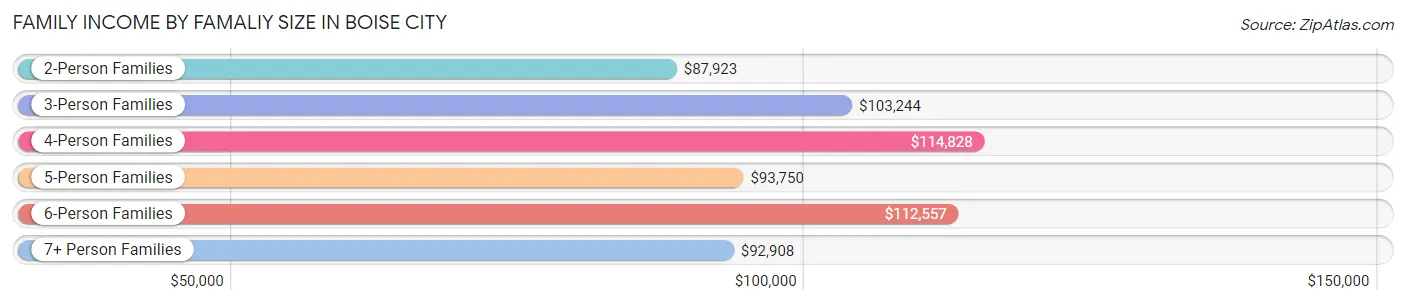
Family Income by Famaliy Size in Boise City
4-person families (9,038 | 16.1%) account for the highest median family income in Boise City with $114,828 per family, while 2-person families (29,601 | 52.7%) have the highest median income of $43,962 per family member.
| Income Bracket | # Families | Median Income |
| 2-Person Families | 29,601 (52.7%) | $87,923 |
| 3-Person Families | 12,190 (21.7%) | $103,244 |
| 4-Person Families | 9,038 (16.1%) | $114,828 |
| 5-Person Families | 3,730 (6.6%) | $93,750 |
| 6-Person Families | 1,153 (2.1%) | $112,557 |
| 7+ Person Families | 456 (0.8%) | $92,908 |
| Total | 56,168 (100.0%) | $95,461 |
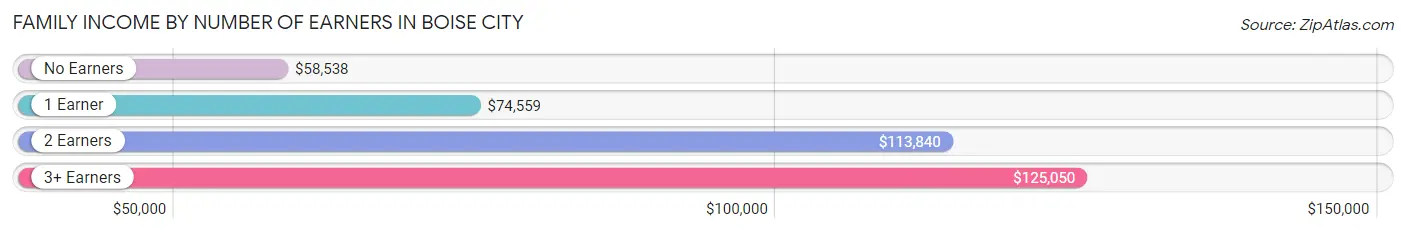
Family Income by Number of Earners in Boise City
The median family income in Boise City is $95,461, with families comprising 3+ earners (6,401) having the highest median family income of $125,050, while families with no earners (7,196) have the lowest median family income of $58,538, accounting for 11.4% and 12.8% of families, respectively.
| Number of Earners | # Families | Median Income |
| No Earners | 7,196 (12.8%) | $58,538 |
| 1 Earner | 16,878 (30.0%) | $74,559 |
| 2 Earners | 25,693 (45.7%) | $113,840 |
| 3+ Earners | 6,401 (11.4%) | $125,050 |
| Total | 56,168 (100.0%) | $95,461 |
Household Income in Boise City
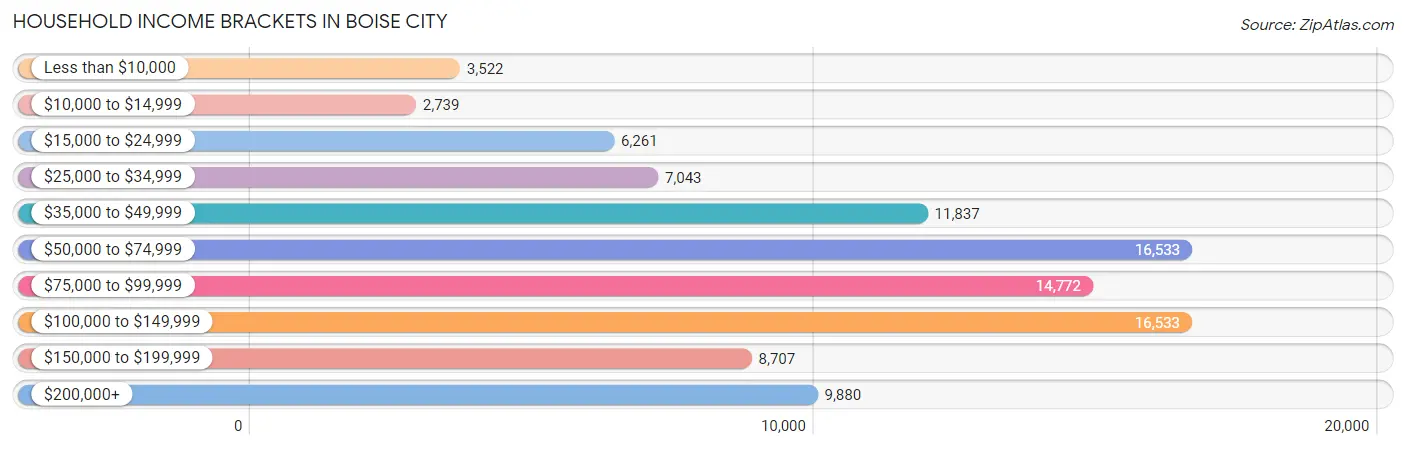
Household Income Brackets in Boise City
With 16,533 households falling in the category, the $50,000 to $74,999 income range is the most frequent in Boise City, accounting for 16.9% of all households. In contrast, only 2,739 households (2.8%) fall into the $10,000 to $14,999 income bracket, making it the least populous group.
| Income Bracket | # Households | % Households |
| Less than $10,000 | 3,522 | 3.6% |
| $10,000 to $14,999 | 2,739 | 2.8% |
| $15,000 to $24,999 | 6,261 | 6.4% |
| $25,000 to $34,999 | 7,043 | 7.2% |
| $35,000 to $49,999 | 11,837 | 12.1% |
| $50,000 to $74,999 | 16,533 | 16.9% |
| $75,000 to $99,999 | 14,772 | 15.1% |
| $100,000 to $149,999 | 16,533 | 16.9% |
| $150,000 to $199,999 | 8,707 | 8.9% |
| $200,000+ | 9,880 | 10.1% |
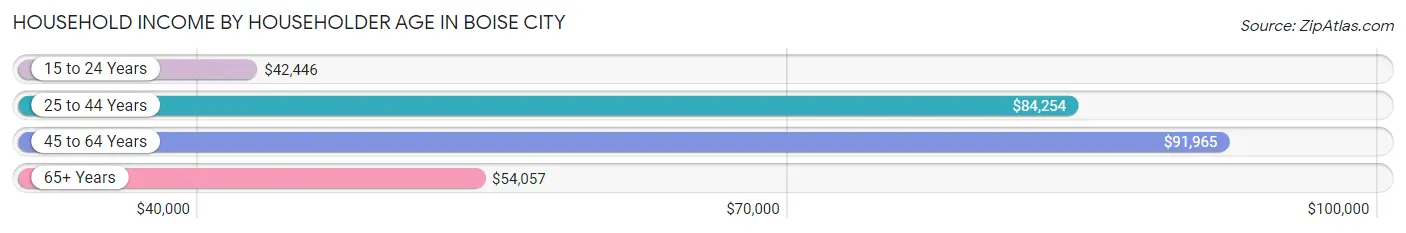
Household Income by Householder Age in Boise City
The median household income in Boise City is $76,402, with the highest median household income of $91,965 found in the 45 to 64 years age bracket for the primary householder. A total of 34,061 households (34.8%) fall into this category. Meanwhile, the 15 to 24 years age bracket for the primary householder has the lowest median household income of $42,446, with 6,092 households (6.2%) in this group.
| Income Bracket | # Households | Median Income |
| 15 to 24 Years | 6,092 (6.2%) | $42,446 |
| 25 to 44 Years | 35,250 (36.0%) | $84,254 |
| 45 to 64 Years | 34,061 (34.8%) | $91,965 |
| 65+ Years | 22,423 (22.9%) | $54,057 |
| Total | 97,826 (100.0%) | $76,402 |
Poverty in Boise City
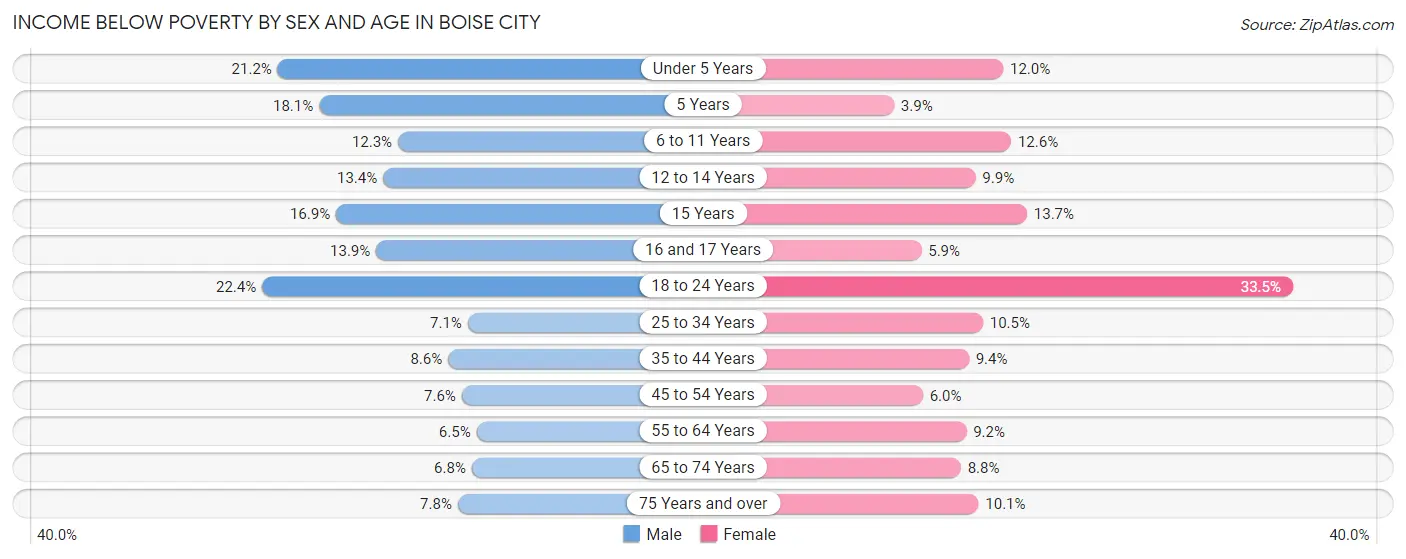
Income Below Poverty by Sex and Age in Boise City
With 10.6% poverty level for males and 11.7% for females among the residents of Boise City, 18 to 24 year old males and 18 to 24 year old females are the most vulnerable to poverty, with 2,718 males (22.4%) and 3,590 females (33.5%) in their respective age groups living below the poverty level.
| Age Bracket | Male | Female |
| Under 5 Years | 1,160 (21.2%) | 648 (12.0%) |
| 5 Years | 257 (18.1%) | 39 (3.9%) |
| 6 to 11 Years | 835 (12.3%) | 822 (12.6%) |
| 12 to 14 Years | 652 (13.4%) | 370 (9.9%) |
| 15 Years | 274 (16.9%) | 211 (13.7%) |
| 16 and 17 Years | 407 (13.9%) | 146 (5.9%) |
| 18 to 24 Years | 2,718 (22.4%) | 3,590 (33.5%) |
| 25 to 34 Years | 1,332 (7.1%) | 1,813 (10.5%) |
| 35 to 44 Years | 1,441 (8.6%) | 1,524 (9.4%) |
| 45 to 54 Years | 1,132 (7.5%) | 828 (6.0%) |
| 55 to 64 Years | 914 (6.5%) | 1,350 (9.2%) |
| 65 to 74 Years | 683 (6.8%) | 965 (8.8%) |
| 75 Years and over | 434 (7.8%) | 791 (10.1%) |
| Total | 12,239 (10.6%) | 13,097 (11.7%) |
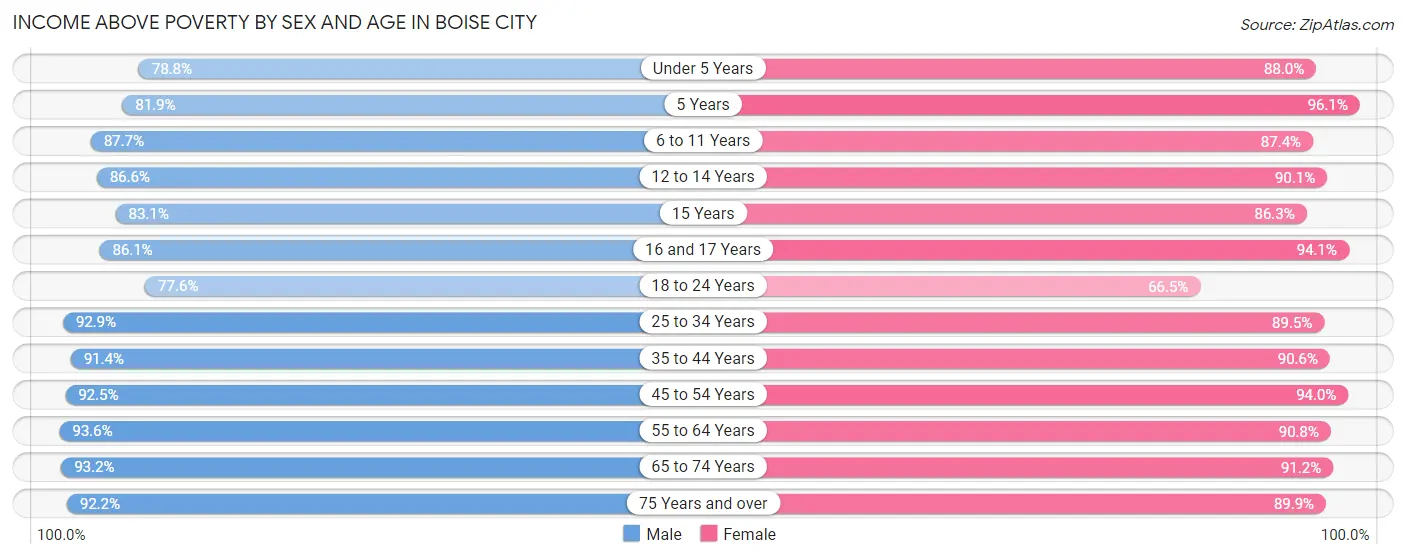
Income Above Poverty by Sex and Age in Boise City
According to the poverty statistics in Boise City, males aged 55 to 64 years and females aged 5 years are the age groups that are most secure financially, with 93.5% of males and 96.1% of females in these age groups living above the poverty line.
| Age Bracket | Male | Female |
| Under 5 Years | 4,309 (78.8%) | 4,766 (88.0%) |
| 5 Years | 1,160 (81.9%) | 969 (96.1%) |
| 6 to 11 Years | 5,964 (87.7%) | 5,723 (87.4%) |
| 12 to 14 Years | 4,219 (86.6%) | 3,361 (90.1%) |
| 15 Years | 1,349 (83.1%) | 1,325 (86.3%) |
| 16 and 17 Years | 2,521 (86.1%) | 2,327 (94.1%) |
| 18 to 24 Years | 9,431 (77.6%) | 7,133 (66.5%) |
| 25 to 34 Years | 17,421 (92.9%) | 15,496 (89.5%) |
| 35 to 44 Years | 15,402 (91.4%) | 14,656 (90.6%) |
| 45 to 54 Years | 13,865 (92.4%) | 12,942 (94.0%) |
| 55 to 64 Years | 13,257 (93.5%) | 13,253 (90.8%) |
| 65 to 74 Years | 9,364 (93.2%) | 9,966 (91.2%) |
| 75 Years and over | 5,102 (92.2%) | 7,007 (89.9%) |
| Total | 103,364 (89.4%) | 98,924 (88.3%) |
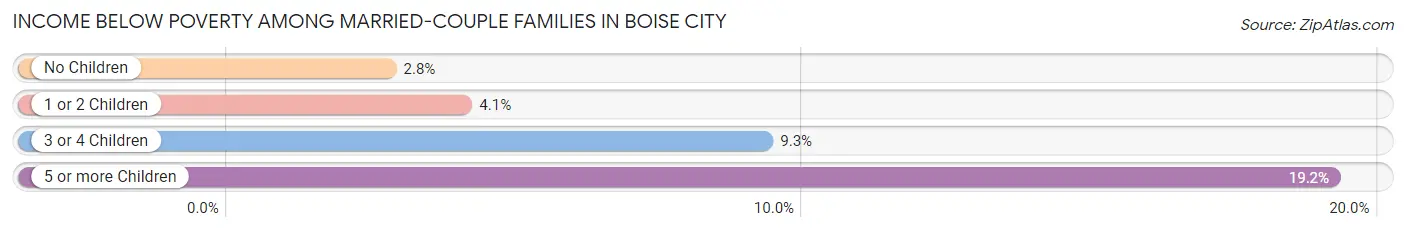
Income Below Poverty Among Married-Couple Families in Boise City
The poverty statistics for married-couple families in Boise City show that 3.7% or 1,632 of the total 43,768 families live below the poverty line. Families with 5 or more children have the highest poverty rate of 19.2%, comprising of 53 families. On the other hand, families with no children have the lowest poverty rate of 2.8%, which includes 725 families.
| Children | Above Poverty | Below Poverty |
| No Children | 25,546 (97.2%) | 725 (2.8%) |
| 1 or 2 Children | 13,740 (95.9%) | 584 (4.1%) |
| 3 or 4 Children | 2,627 (90.7%) | 270 (9.3%) |
| 5 or more Children | 223 (80.8%) | 53 (19.2%) |
| Total | 42,136 (96.3%) | 1,632 (3.7%) |
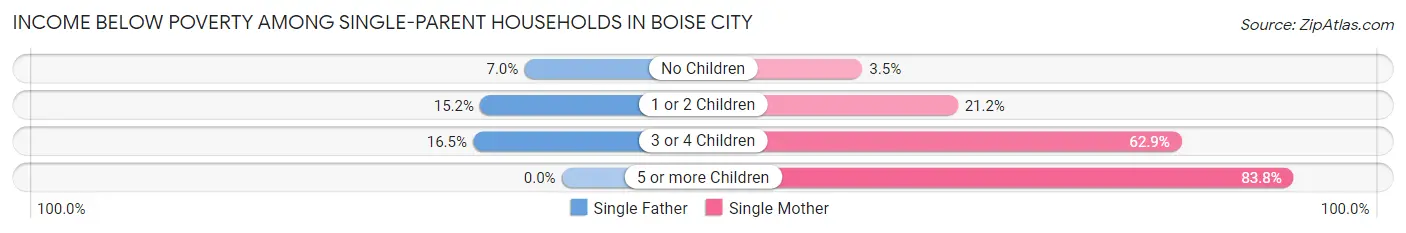
Income Below Poverty Among Single-Parent Households in Boise City
According to the poverty data in Boise City, 11.7% or 474 single-father households and 17.7% or 1,482 single-mother households are living below the poverty line. Among single-father households, those with 3 or 4 children have the highest poverty rate, with 36 households (16.5%) experiencing poverty. Likewise, among single-mother households, those with 5 or more children have the highest poverty rate, with 62 households (83.8%) falling below the poverty line.
| Children | Single Father | Single Mother |
| No Children | 122 (7.0%) | 117 (3.5%) |
| 1 or 2 Children | 316 (15.2%) | 914 (21.2%) |
| 3 or 4 Children | 36 (16.5%) | 389 (62.9%) |
| 5 or more Children | 0 (0.0%) | 62 (83.8%) |
| Total | 474 (11.7%) | 1,482 (17.7%) |
Income Below Poverty Among Married-Couple vs Single-Parent Households in Boise City
The poverty data for Boise City shows that 1,632 of the married-couple family households (3.7%) and 1,956 of the single-parent households (15.8%) are living below the poverty level. Within the married-couple family households, those with 5 or more children have the highest poverty rate, with 53 households (19.2%) falling below the poverty line. Among the single-parent households, those with 5 or more children have the highest poverty rate, with 62 household (83.8%) living below poverty.
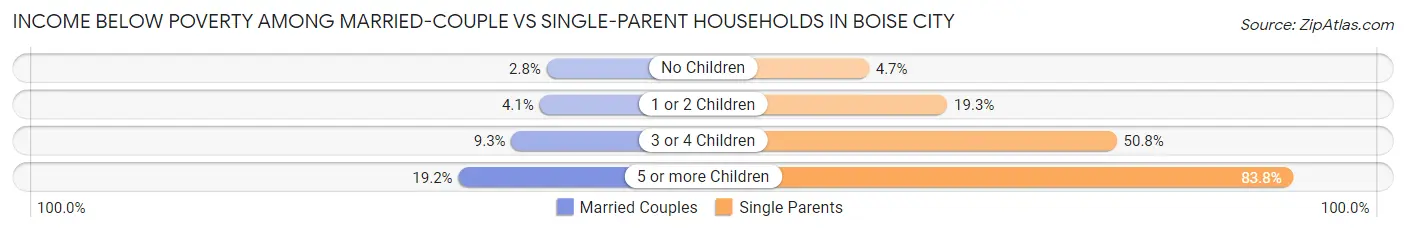
| Children | Married-Couple Families | Single-Parent Households |
| No Children | 725 (2.8%) | 239 (4.7%) |
| 1 or 2 Children | 584 (4.1%) | 1,230 (19.3%) |
| 3 or 4 Children | 270 (9.3%) | 425 (50.8%) |
| 5 or more Children | 53 (19.2%) | 62 (83.8%) |
| Total | 1,632 (3.7%) | 1,956 (15.8%) |
Employment Characteristics in Boise City
Employment by Class of Employer in Boise City
Among the 126,602 employed individuals in Boise City, private company employees (81,698 | 64.5%), not-for-profit organizations (11,661 | 9.2%), and self-employed (not incorporated) (8,275 | 6.5%) make up the most common classes of employment.
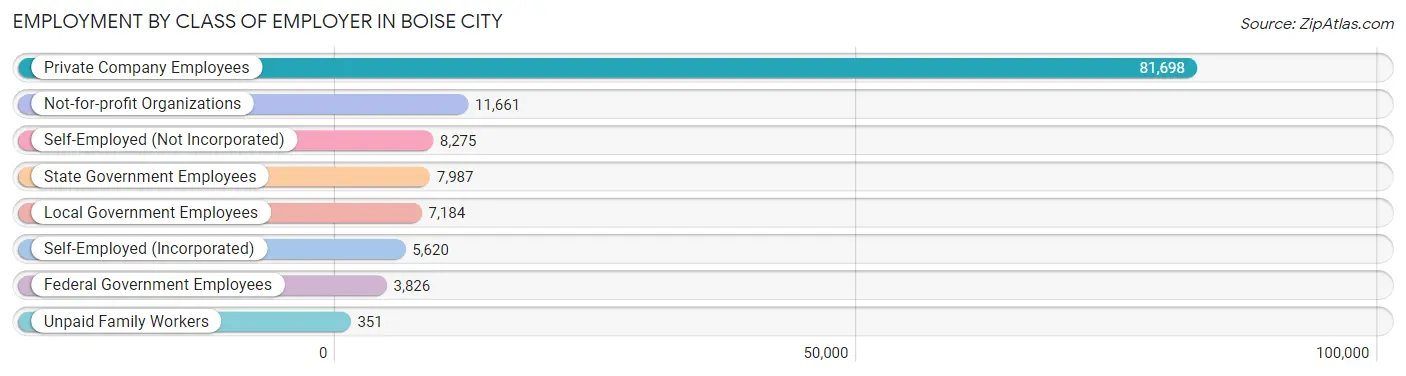
| Employer Class | # Employees | % Employees |
| Private Company Employees | 81,698 | 64.5% |
| Self-Employed (Incorporated) | 5,620 | 4.4% |
| Self-Employed (Not Incorporated) | 8,275 | 6.5% |
| Not-for-profit Organizations | 11,661 | 9.2% |
| Local Government Employees | 7,184 | 5.7% |
| State Government Employees | 7,987 | 6.3% |
| Federal Government Employees | 3,826 | 3.0% |
| Unpaid Family Workers | 351 | 0.3% |
| Total | 126,602 | 100.0% |
Employment Status by Age in Boise City
According to the labor force statistics for Boise City, out of the total population over 16 years of age (195,283), 68.5% or 133,769 individuals are in the labor force, with 3.8% or 5,083 of them unemployed. The age group with the highest labor force participation rate is 25 to 29 years, with 88.6% or 16,004 individuals in the labor force. Within the labor force, the 16 to 19 years age range has the highest percentage of unemployed individuals, with 11.2% or 728 of them being unemployed.
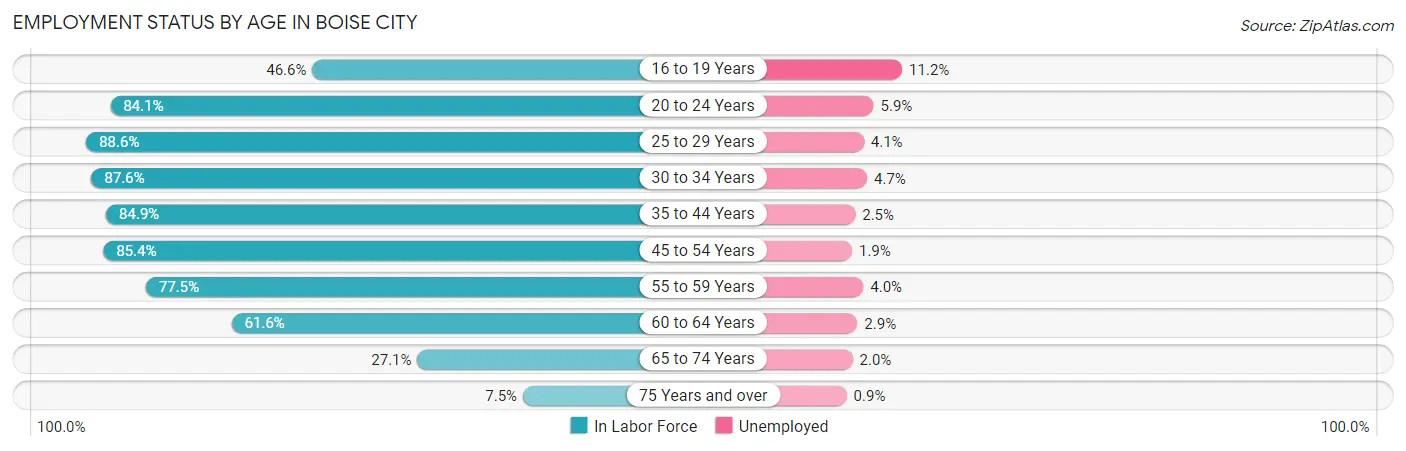
| Age Bracket | In Labor Force | Unemployed |
| 16 to 19 Years | 6,504 (46.6%) | 728 (11.2%) |
| 20 to 24 Years | 15,450 (84.1%) | 912 (5.9%) |
| 25 to 29 Years | 16,004 (88.6%) | 656 (4.1%) |
| 30 to 34 Years | 16,104 (87.6%) | 757 (4.7%) |
| 35 to 44 Years | 28,135 (84.9%) | 703 (2.5%) |
| 45 to 54 Years | 24,643 (85.4%) | 468 (1.9%) |
| 55 to 59 Years | 11,586 (77.5%) | 463 (4.0%) |
| 60 to 64 Years | 8,593 (61.6%) | 249 (2.9%) |
| 65 to 74 Years | 5,772 (27.1%) | 115 (2.0%) |
| 75 Years and over | 1,074 (7.5%) | 10 (0.9%) |
| Total | 133,769 (68.5%) | 5,083 (3.8%) |
Employment Status by Educational Attainment in Boise City
According to labor force statistics for Boise City, 82.5% of individuals (105,056) out of the total population between 25 and 64 years of age (127,341) are in the labor force, with 3.1% or 3,257 of them being unemployed. The group with the highest labor force participation rate are those with the educational attainment of bachelor's degree or higher, with 87.0% or 52,231 individuals in the labor force. Within the labor force, individuals with less than high school education have the highest percentage of unemployment, with 7.6% or 303 of them being unemployed.
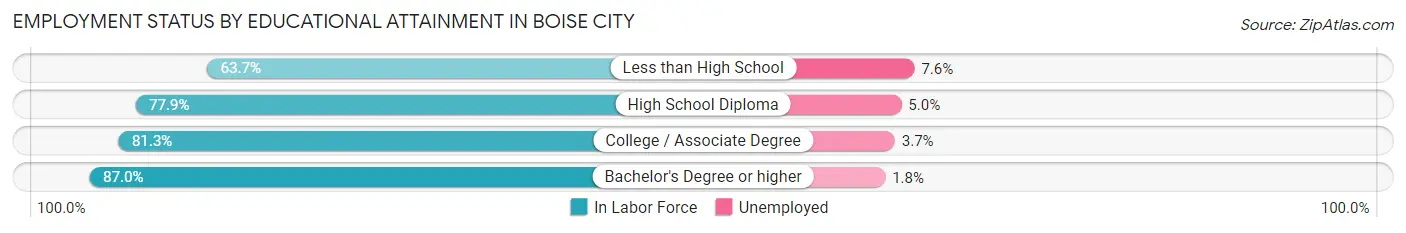
| Educational Attainment | In Labor Force | Unemployed |
| Less than High School | 3,988 (63.7%) | 476 (7.6%) |
| High School Diploma | 18,211 (77.9%) | 1,169 (5.0%) |
| College / Associate Degree | 30,622 (81.3%) | 1,394 (3.7%) |
| Bachelor's Degree or higher | 52,231 (87.0%) | 1,081 (1.8%) |
| Total | 105,056 (82.5%) | 3,948 (3.1%) |
Employment Occupations by Sex in Boise City
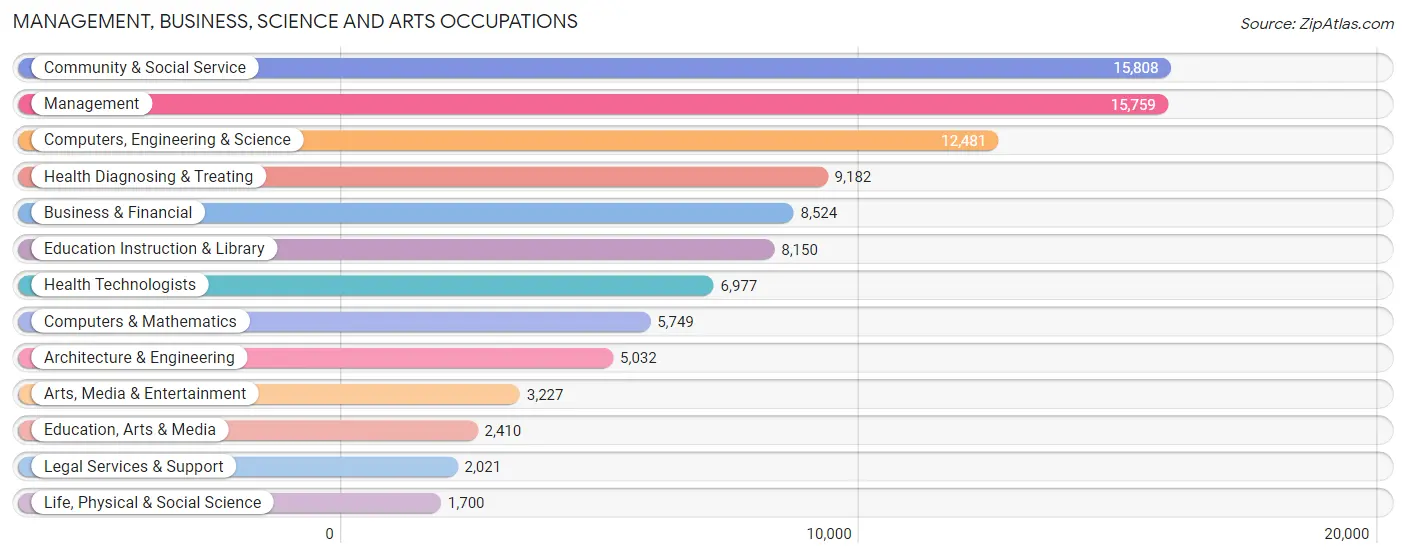
Management, Business, Science and Arts Occupations
The most common Management, Business, Science and Arts occupations in Boise City are Community & Social Service (15,808 | 12.3%), Management (15,759 | 12.3%), Computers, Engineering & Science (12,481 | 9.7%), Health Diagnosing & Treating (9,182 | 7.1%), and Business & Financial (8,524 | 6.6%).
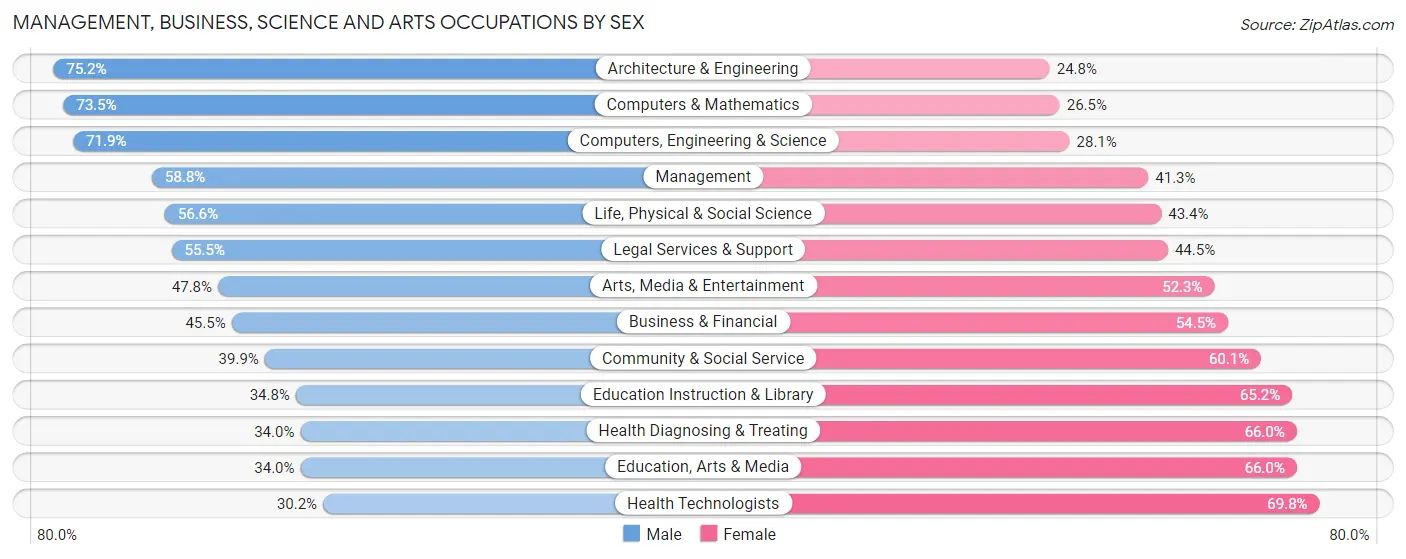
Management, Business, Science and Arts Occupations by Sex
Within the Management, Business, Science and Arts occupations in Boise City, the most male-oriented occupations are Architecture & Engineering (75.2%), Computers & Mathematics (73.5%), and Computers, Engineering & Science (71.9%), while the most female-oriented occupations are Health Technologists (69.8%), Education, Arts & Media (66.0%), and Health Diagnosing & Treating (66.0%).
| Occupation | Male | Female |
| Management | 9,258 (58.8%) | 6,501 (41.2%) |
| Business & Financial | 3,876 (45.5%) | 4,648 (54.5%) |
| Computers, Engineering & Science | 8,973 (71.9%) | 3,508 (28.1%) |
| Computers & Mathematics | 4,227 (73.5%) | 1,522 (26.5%) |
| Architecture & Engineering | 3,784 (75.2%) | 1,248 (24.8%) |
| Life, Physical & Social Science | 962 (56.6%) | 738 (43.4%) |
| Community & Social Service | 6,314 (39.9%) | 9,494 (60.1%) |
| Education, Arts & Media | 819 (34.0%) | 1,591 (66.0%) |
| Legal Services & Support | 1,121 (55.5%) | 900 (44.5%) |
| Education Instruction & Library | 2,833 (34.8%) | 5,317 (65.2%) |
| Arts, Media & Entertainment | 1,541 (47.7%) | 1,686 (52.2%) |
| Health Diagnosing & Treating | 3,122 (34.0%) | 6,060 (66.0%) |
| Health Technologists | 2,108 (30.2%) | 4,869 (69.8%) |
| Total (Category) | 31,543 (51.1%) | 30,211 (48.9%) |
| Total (Overall) | 68,822 (53.6%) | 59,517 (46.4%) |
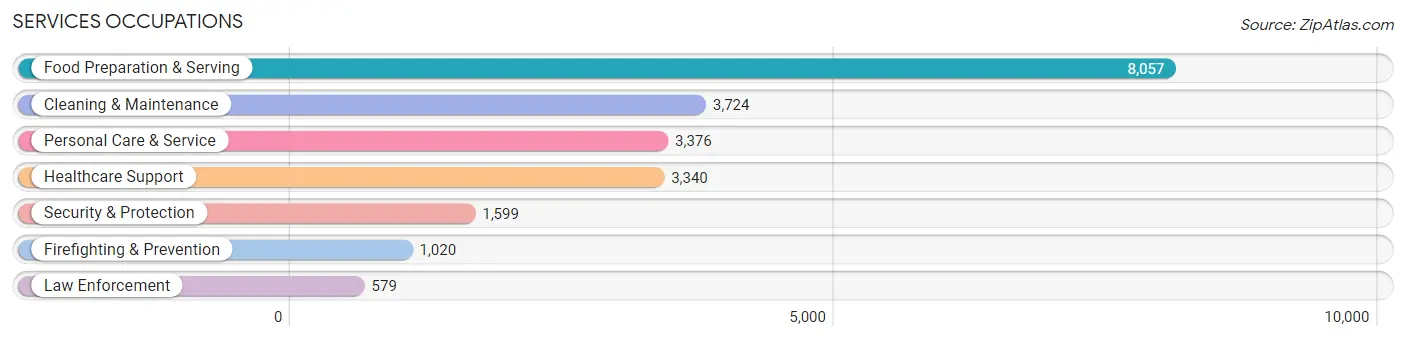
Services Occupations
The most common Services occupations in Boise City are Food Preparation & Serving (8,057 | 6.3%), Cleaning & Maintenance (3,724 | 2.9%), Personal Care & Service (3,376 | 2.6%), Healthcare Support (3,340 | 2.6%), and Security & Protection (1,599 | 1.3%).
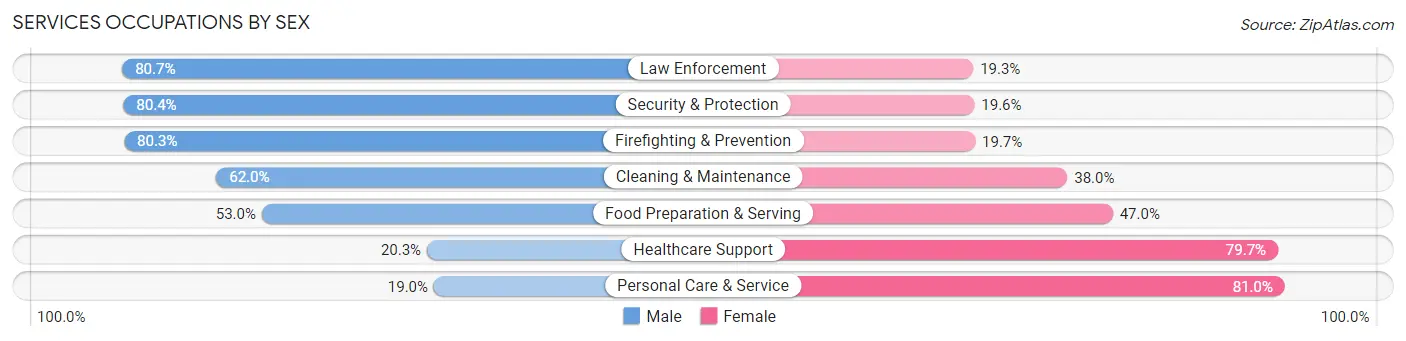
Services Occupations by Sex
Within the Services occupations in Boise City, the most male-oriented occupations are Law Enforcement (80.7%), Security & Protection (80.4%), and Firefighting & Prevention (80.3%), while the most female-oriented occupations are Personal Care & Service (81.0%), Healthcare Support (79.7%), and Food Preparation & Serving (47.0%).
| Occupation | Male | Female |
| Healthcare Support | 679 (20.3%) | 2,661 (79.7%) |
| Security & Protection | 1,286 (80.4%) | 313 (19.6%) |
| Firefighting & Prevention | 819 (80.3%) | 201 (19.7%) |
| Law Enforcement | 467 (80.7%) | 112 (19.3%) |
| Food Preparation & Serving | 4,273 (53.0%) | 3,784 (47.0%) |
| Cleaning & Maintenance | 2,310 (62.0%) | 1,414 (38.0%) |
| Personal Care & Service | 640 (19.0%) | 2,736 (81.0%) |
| Total (Category) | 9,188 (45.7%) | 10,908 (54.3%) |
| Total (Overall) | 68,822 (53.6%) | 59,517 (46.4%) |
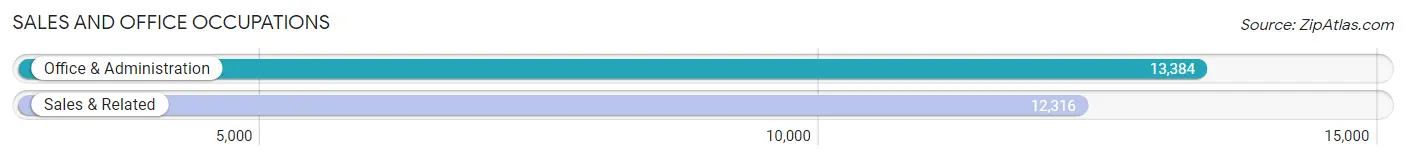
Sales and Office Occupations
The most common Sales and Office occupations in Boise City are Office & Administration (13,384 | 10.4%), and Sales & Related (12,316 | 9.6%).
Sales and Office Occupations by Sex
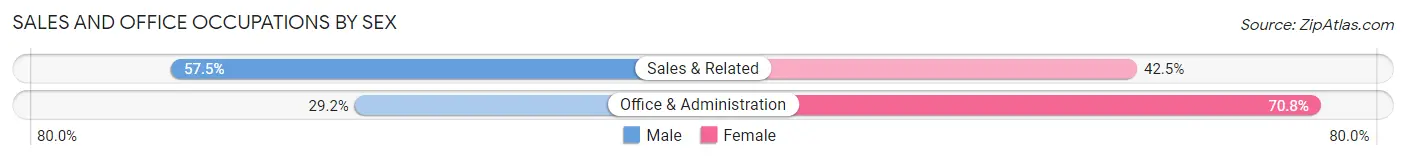
| Occupation | Male | Female |
| Sales & Related | 7,077 (57.5%) | 5,239 (42.5%) |
| Office & Administration | 3,911 (29.2%) | 9,473 (70.8%) |
| Total (Category) | 10,988 (42.7%) | 14,712 (57.3%) |
| Total (Overall) | 68,822 (53.6%) | 59,517 (46.4%) |
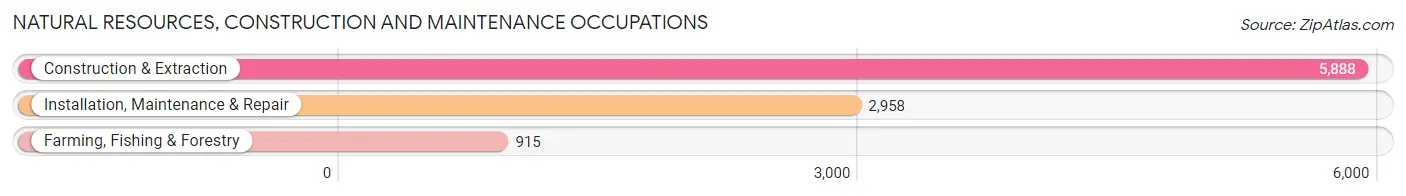
Natural Resources, Construction and Maintenance Occupations
The most common Natural Resources, Construction and Maintenance occupations in Boise City are Construction & Extraction (5,888 | 4.6%), Installation, Maintenance & Repair (2,958 | 2.3%), and Farming, Fishing & Forestry (915 | 0.7%).
Natural Resources, Construction and Maintenance Occupations by Sex
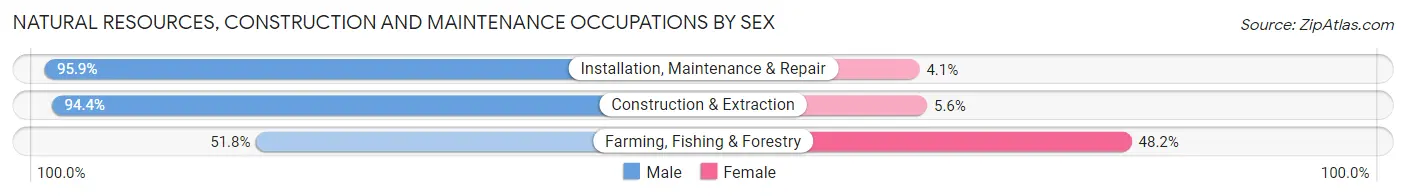
| Occupation | Male | Female |
| Farming, Fishing & Forestry | 474 (51.8%) | 441 (48.2%) |
| Construction & Extraction | 5,556 (94.4%) | 332 (5.6%) |
| Installation, Maintenance & Repair | 2,838 (95.9%) | 120 (4.1%) |
| Total (Category) | 8,868 (90.8%) | 893 (9.1%) |
| Total (Overall) | 68,822 (53.6%) | 59,517 (46.4%) |
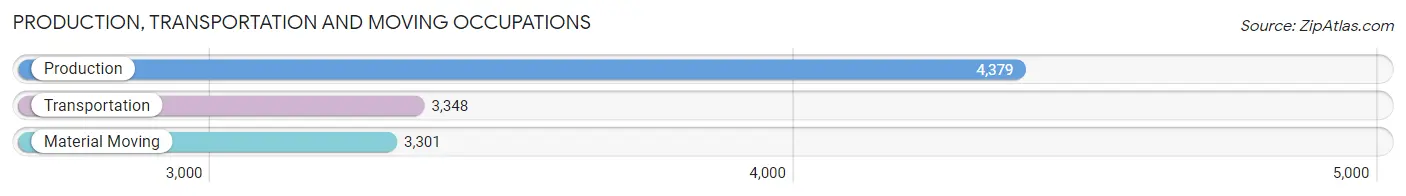
Production, Transportation and Moving Occupations
The most common Production, Transportation and Moving occupations in Boise City are Production (4,379 | 3.4%), Transportation (3,348 | 2.6%), and Material Moving (3,301 | 2.6%).
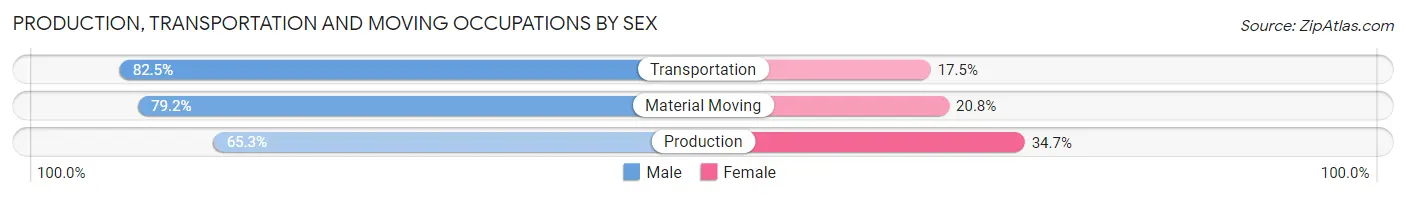
Production, Transportation and Moving Occupations by Sex
| Occupation | Male | Female |
| Production | 2,859 (65.3%) | 1,520 (34.7%) |
| Transportation | 2,763 (82.5%) | 585 (17.5%) |
| Material Moving | 2,613 (79.2%) | 688 (20.8%) |
| Total (Category) | 8,235 (74.7%) | 2,793 (25.3%) |
| Total (Overall) | 68,822 (53.6%) | 59,517 (46.4%) |
Employment Industries by Sex in Boise City
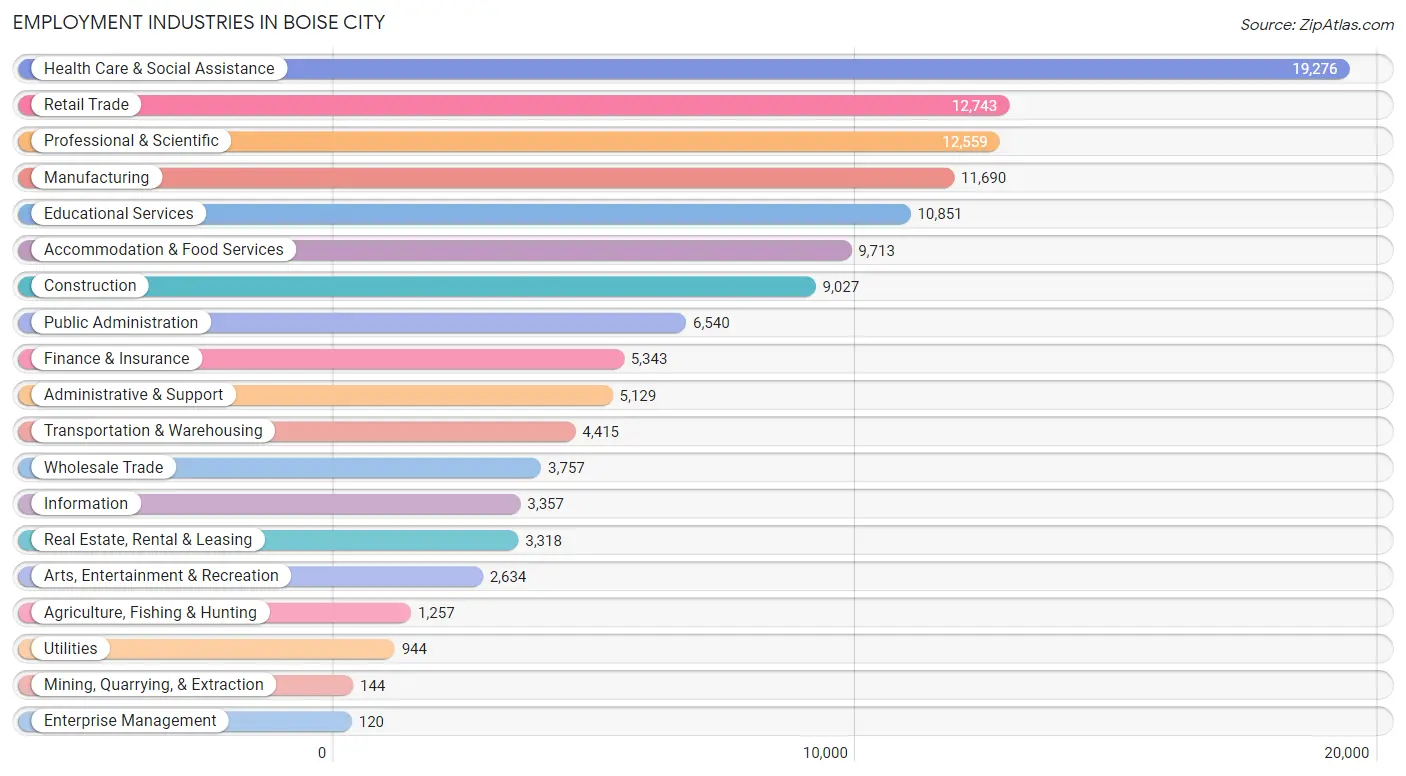
Employment Industries in Boise City
The major employment industries in Boise City include Health Care & Social Assistance (19,276 | 15.0%), Retail Trade (12,743 | 9.9%), Professional & Scientific (12,559 | 9.8%), Manufacturing (11,690 | 9.1%), and Educational Services (10,851 | 8.5%).
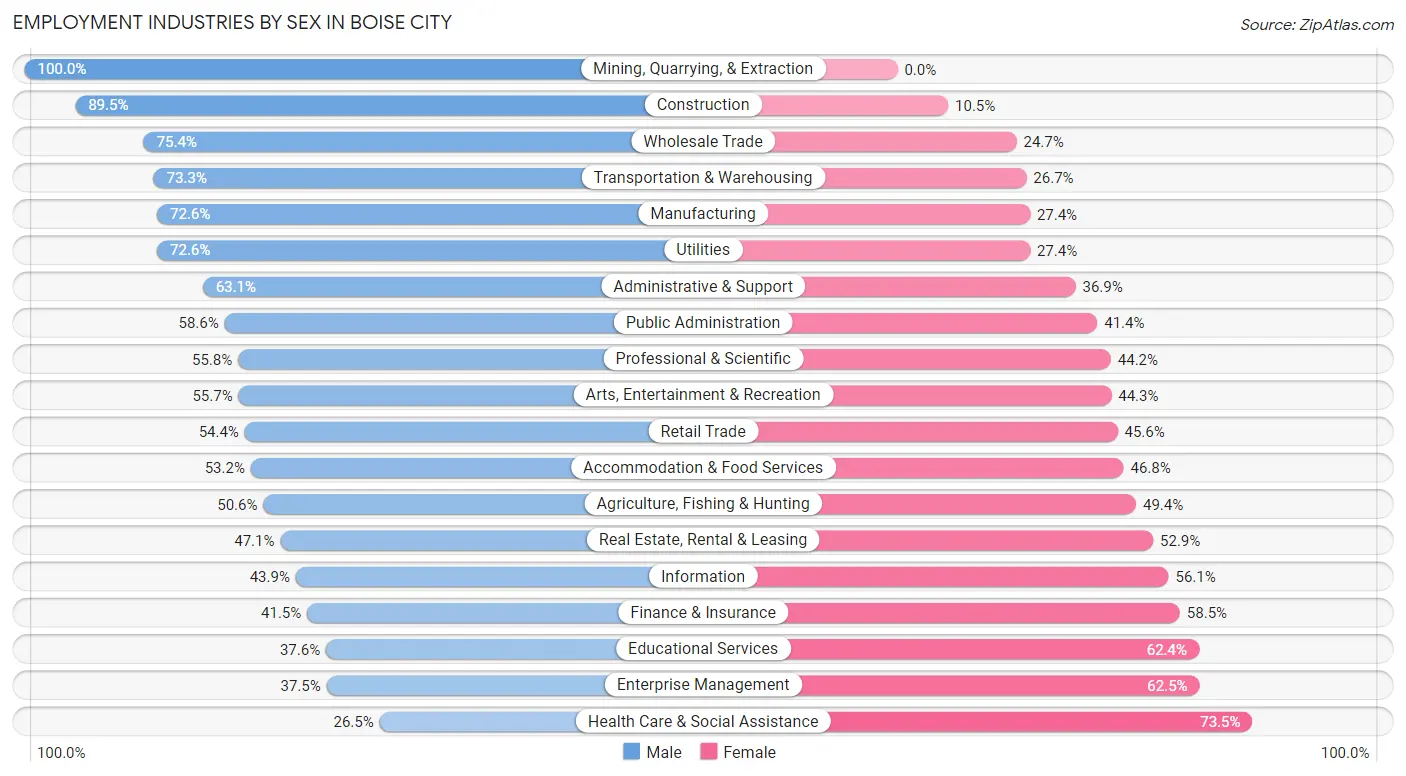
Employment Industries by Sex in Boise City
The Boise City industries that see more men than women are Mining, Quarrying, & Extraction (100.0%), Construction (89.5%), and Wholesale Trade (75.3%), whereas the industries that tend to have a higher number of women are Health Care & Social Assistance (73.5%), Enterprise Management (62.5%), and Educational Services (62.4%).
| Industry | Male | Female |
| Agriculture, Fishing & Hunting | 636 (50.6%) | 621 (49.4%) |
| Mining, Quarrying, & Extraction | 144 (100.0%) | 0 (0.0%) |
| Construction | 8,080 (89.5%) | 947 (10.5%) |
| Manufacturing | 8,484 (72.6%) | 3,206 (27.4%) |
| Wholesale Trade | 2,831 (75.3%) | 926 (24.6%) |
| Retail Trade | 6,937 (54.4%) | 5,806 (45.6%) |
| Transportation & Warehousing | 3,236 (73.3%) | 1,179 (26.7%) |
| Utilities | 685 (72.6%) | 259 (27.4%) |
| Information | 1,473 (43.9%) | 1,884 (56.1%) |
| Finance & Insurance | 2,219 (41.5%) | 3,124 (58.5%) |
| Real Estate, Rental & Leasing | 1,562 (47.1%) | 1,756 (52.9%) |
| Professional & Scientific | 7,010 (55.8%) | 5,549 (44.2%) |
| Enterprise Management | 45 (37.5%) | 75 (62.5%) |
| Administrative & Support | 3,238 (63.1%) | 1,891 (36.9%) |
| Educational Services | 4,082 (37.6%) | 6,769 (62.4%) |
| Health Care & Social Assistance | 5,115 (26.5%) | 14,161 (73.5%) |
| Arts, Entertainment & Recreation | 1,468 (55.7%) | 1,166 (44.3%) |
| Accommodation & Food Services | 5,166 (53.2%) | 4,547 (46.8%) |
| Public Administration | 3,834 (58.6%) | 2,706 (41.4%) |
| Total | 68,822 (53.6%) | 59,517 (46.4%) |
Education in Boise City
School Enrollment in Boise City
The most common levels of schooling among the 57,819 students in Boise City are college / undergraduate (18,015 | 31.2%), high school (11,098 | 19.2%), and middle school (10,808 | 18.7%).
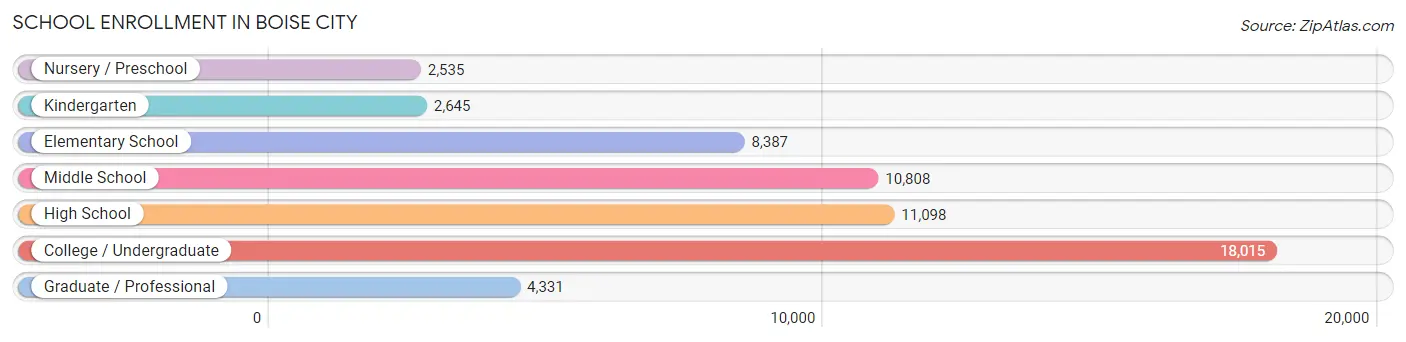
| School Level | # Students | % Students |
| Nursery / Preschool | 2,535 | 4.4% |
| Kindergarten | 2,645 | 4.6% |
| Elementary School | 8,387 | 14.5% |
| Middle School | 10,808 | 18.7% |
| High School | 11,098 | 19.2% |
| College / Undergraduate | 18,015 | 31.2% |
| Graduate / Professional | 4,331 | 7.5% |
| Total | 57,819 | 100.0% |
School Enrollment by Age by Funding Source in Boise City
Out of a total of 57,819 students who are enrolled in schools in Boise City, 8,095 (14.0%) attend a private institution, while the remaining 49,724 (86.0%) are enrolled in public schools. The age group of 3 to 4 year olds has the highest likelihood of being enrolled in private schools, with 1,456 (70.2% in the age bracket) enrolled. Conversely, the age group of 20 to 24 year olds has the lowest likelihood of being enrolled in a private school, with 7,714 (93.1% in the age bracket) attending a public institution.
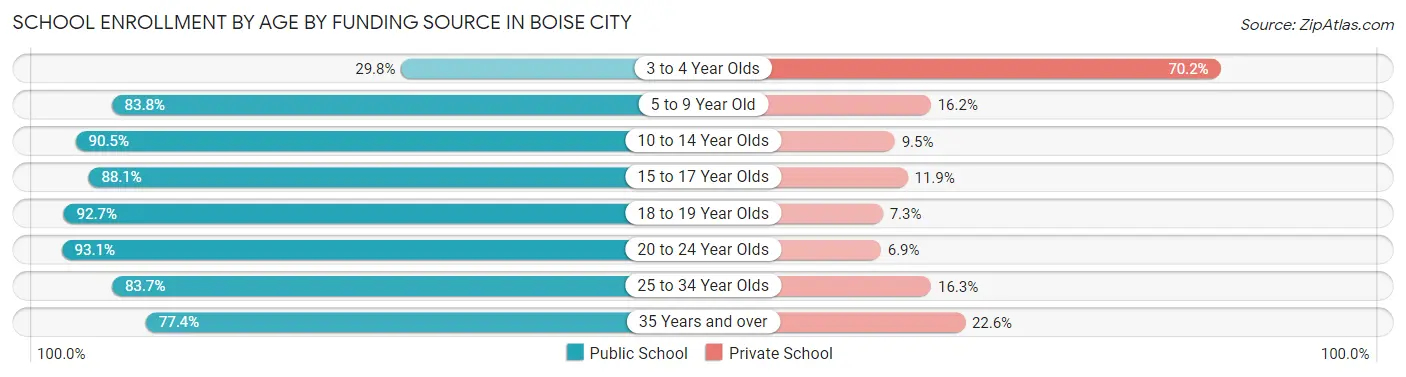
| Age Bracket | Public School | Private School |
| 3 to 4 Year Olds | 619 (29.8%) | 1,456 (70.2%) |
| 5 to 9 Year Old | 8,630 (83.8%) | 1,671 (16.2%) |
| 10 to 14 Year Olds | 12,019 (90.5%) | 1,263 (9.5%) |
| 15 to 17 Year Olds | 7,465 (88.1%) | 1,008 (11.9%) |
| 18 to 19 Year Olds | 6,310 (92.7%) | 495 (7.3%) |
| 20 to 24 Year Olds | 7,714 (93.1%) | 573 (6.9%) |
| 25 to 34 Year Olds | 4,525 (83.7%) | 880 (16.3%) |
| 35 Years and over | 2,470 (77.4%) | 721 (22.6%) |
| Total | 49,724 (86.0%) | 8,095 (14.0%) |
Educational Attainment by Field of Study in Boise City
Business (15,480 | 18.8%), science & technology (8,786 | 10.7%), education (7,581 | 9.2%), social sciences (6,826 | 8.3%), and engineering (6,701 | 8.1%) are the most common fields of study among 82,286 individuals in Boise City who have obtained a bachelor's degree or higher.
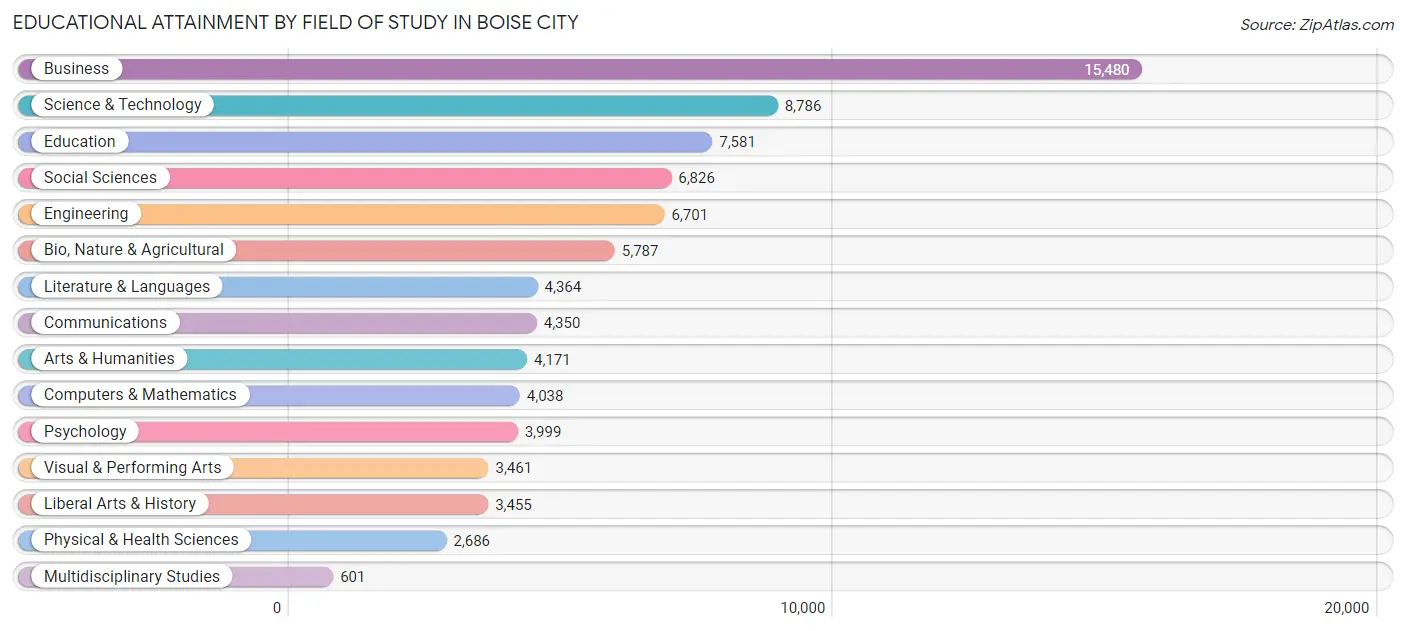
| Field of Study | # Graduates | % Graduates |
| Computers & Mathematics | 4,038 | 4.9% |
| Bio, Nature & Agricultural | 5,787 | 7.0% |
| Physical & Health Sciences | 2,686 | 3.3% |
| Psychology | 3,999 | 4.9% |
| Social Sciences | 6,826 | 8.3% |
| Engineering | 6,701 | 8.1% |
| Multidisciplinary Studies | 601 | 0.7% |
| Science & Technology | 8,786 | 10.7% |
| Business | 15,480 | 18.8% |
| Education | 7,581 | 9.2% |
| Literature & Languages | 4,364 | 5.3% |
| Liberal Arts & History | 3,455 | 4.2% |
| Visual & Performing Arts | 3,461 | 4.2% |
| Communications | 4,350 | 5.3% |
| Arts & Humanities | 4,171 | 5.1% |
| Total | 82,286 | 100.0% |
Transportation & Commute in Boise City
Vehicle Availability by Sex in Boise City
The most prevalent vehicle ownership categories in Boise City are males with 2 vehicles (29,475, accounting for 43.5%) and females with 2 vehicles (24,139, making up 51.5%).
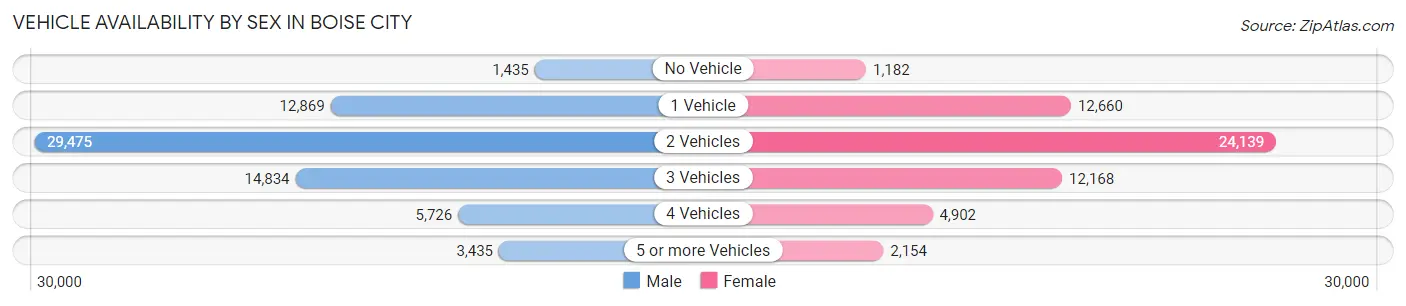
| Vehicles Available | Male | Female |
| No Vehicle | 1,435 (2.1%) | 1,182 (2.1%) |
| 1 Vehicle | 12,869 (19.0%) | 12,660 (22.1%) |
| 2 Vehicles | 29,475 (43.5%) | 24,139 (42.2%) |
| 3 Vehicles | 14,834 (21.9%) | 12,168 (21.3%) |
| 4 Vehicles | 5,726 (8.5%) | 4,902 (8.6%) |
| 5 or more Vehicles | 3,435 (5.1%) | 2,154 (3.8%) |
| Total | 67,774 (100.0%) | 57,205 (100.0%) |
Commute Time in Boise City
The most frequently occuring commute durations in Boise City are 15 to 19 minutes (26,070 commuters, 24.1%), 10 to 14 minutes (22,232 commuters, 20.5%), and 20 to 24 minutes (21,410 commuters, 19.8%).
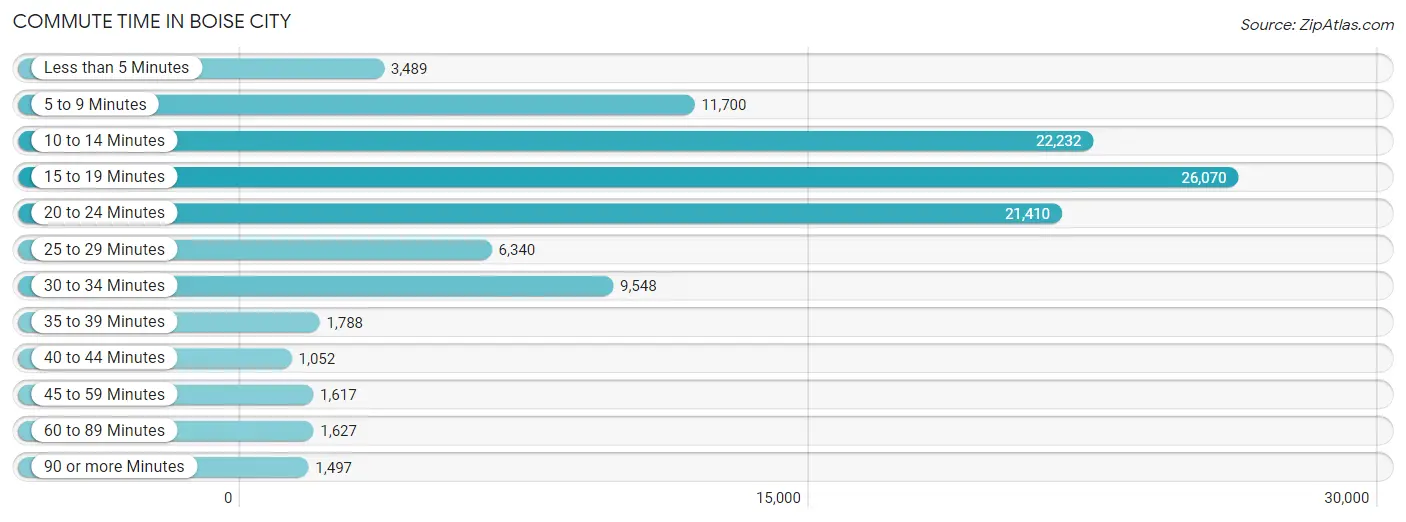
| Commute Time | # Commuters | % Commuters |
| Less than 5 Minutes | 3,489 | 3.2% |
| 5 to 9 Minutes | 11,700 | 10.8% |
| 10 to 14 Minutes | 22,232 | 20.5% |
| 15 to 19 Minutes | 26,070 | 24.1% |
| 20 to 24 Minutes | 21,410 | 19.8% |
| 25 to 29 Minutes | 6,340 | 5.9% |
| 30 to 34 Minutes | 9,548 | 8.8% |
| 35 to 39 Minutes | 1,788 | 1.7% |
| 40 to 44 Minutes | 1,052 | 1.0% |
| 45 to 59 Minutes | 1,617 | 1.5% |
| 60 to 89 Minutes | 1,627 | 1.5% |
| 90 or more Minutes | 1,497 | 1.4% |
Commute Time by Sex in Boise City
The most common commute times in Boise City are 15 to 19 minutes (13,959 commuters, 23.2%) for males and 15 to 19 minutes (12,111 commuters, 25.1%) for females.
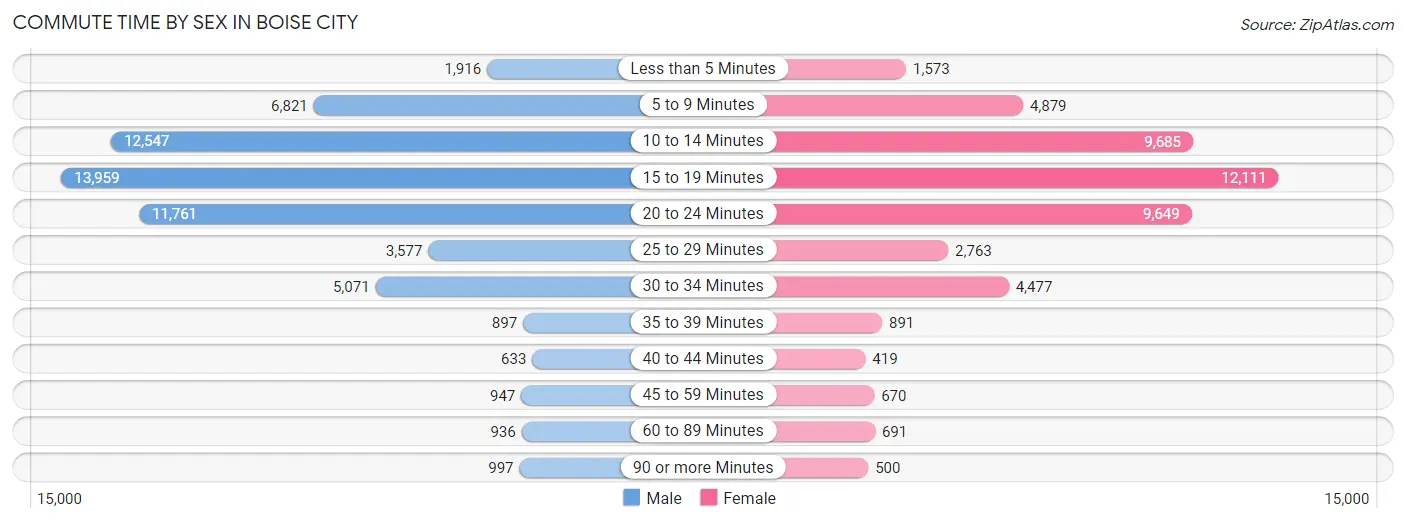
| Commute Time | Male | Female |
| Less than 5 Minutes | 1,916 (3.2%) | 1,573 (3.3%) |
| 5 to 9 Minutes | 6,821 (11.4%) | 4,879 (10.1%) |
| 10 to 14 Minutes | 12,547 (20.9%) | 9,685 (20.1%) |
| 15 to 19 Minutes | 13,959 (23.2%) | 12,111 (25.1%) |
| 20 to 24 Minutes | 11,761 (19.6%) | 9,649 (20.0%) |
| 25 to 29 Minutes | 3,577 (6.0%) | 2,763 (5.7%) |
| 30 to 34 Minutes | 5,071 (8.4%) | 4,477 (9.3%) |
| 35 to 39 Minutes | 897 (1.5%) | 891 (1.8%) |
| 40 to 44 Minutes | 633 (1.1%) | 419 (0.9%) |
| 45 to 59 Minutes | 947 (1.6%) | 670 (1.4%) |
| 60 to 89 Minutes | 936 (1.6%) | 691 (1.4%) |
| 90 or more Minutes | 997 (1.7%) | 500 (1.0%) |
Time of Departure to Work by Sex in Boise City
The most frequent times of departure to work in Boise City are 7:30 AM to 7:59 AM (9,428, 15.7%) for males and 7:30 AM to 7:59 AM (8,064, 16.7%) for females.
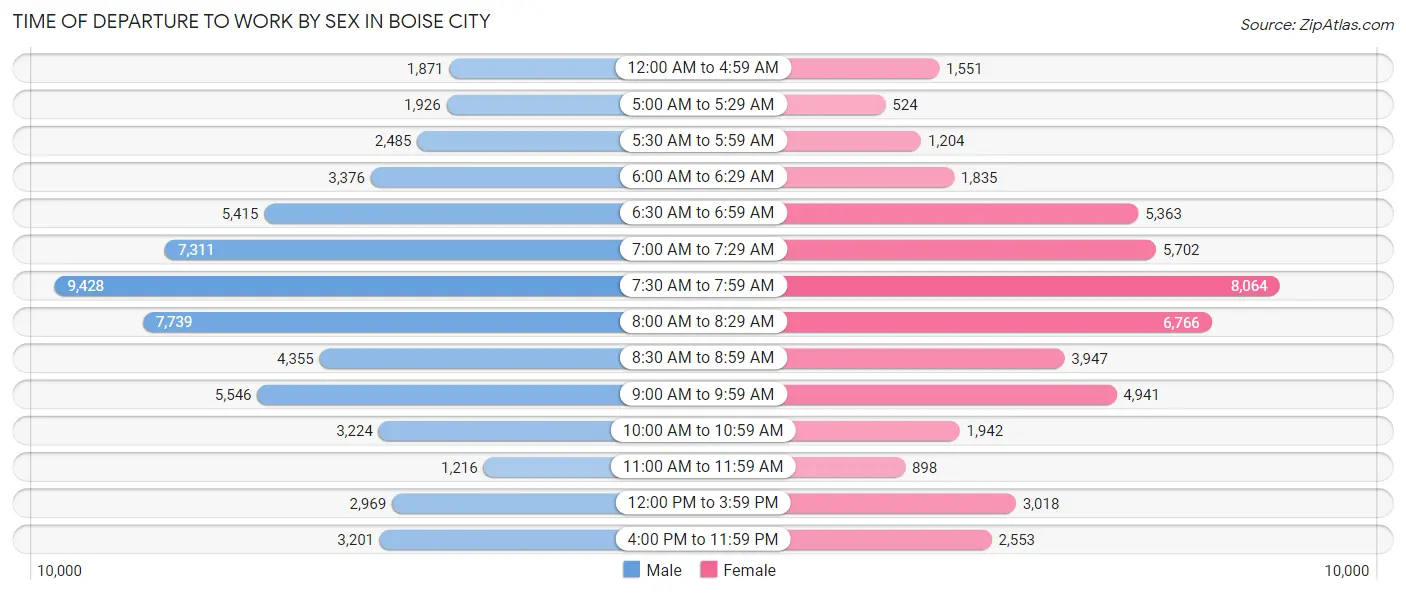
| Time of Departure | Male | Female |
| 12:00 AM to 4:59 AM | 1,871 (3.1%) | 1,551 (3.2%) |
| 5:00 AM to 5:29 AM | 1,926 (3.2%) | 524 (1.1%) |
| 5:30 AM to 5:59 AM | 2,485 (4.1%) | 1,204 (2.5%) |
| 6:00 AM to 6:29 AM | 3,376 (5.6%) | 1,835 (3.8%) |
| 6:30 AM to 6:59 AM | 5,415 (9.0%) | 5,363 (11.1%) |
| 7:00 AM to 7:29 AM | 7,311 (12.2%) | 5,702 (11.8%) |
| 7:30 AM to 7:59 AM | 9,428 (15.7%) | 8,064 (16.7%) |
| 8:00 AM to 8:29 AM | 7,739 (12.9%) | 6,766 (14.0%) |
| 8:30 AM to 8:59 AM | 4,355 (7.2%) | 3,947 (8.2%) |
| 9:00 AM to 9:59 AM | 5,546 (9.2%) | 4,941 (10.2%) |
| 10:00 AM to 10:59 AM | 3,224 (5.4%) | 1,942 (4.0%) |
| 11:00 AM to 11:59 AM | 1,216 (2.0%) | 898 (1.9%) |
| 12:00 PM to 3:59 PM | 2,969 (4.9%) | 3,018 (6.2%) |
| 4:00 PM to 11:59 PM | 3,201 (5.3%) | 2,553 (5.3%) |
| Total | 60,062 (100.0%) | 48,308 (100.0%) |
Housing Occupancy in Boise City
Occupancy by Ownership in Boise City
Of the total 97,826 dwellings in Boise City, owner-occupied units account for 61,534 (62.9%), while renter-occupied units make up 36,292 (37.1%).
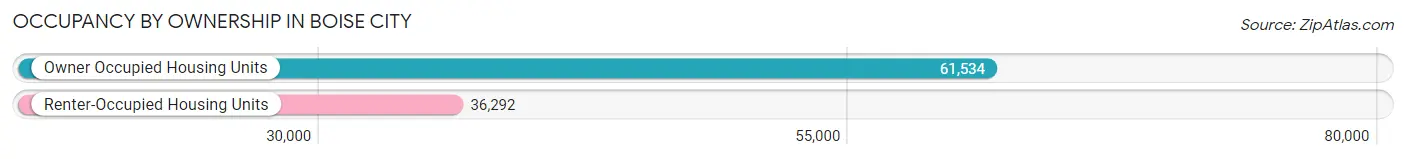
| Occupancy | # Housing Units | % Housing Units |
| Owner Occupied Housing Units | 61,534 | 62.9% |
| Renter-Occupied Housing Units | 36,292 | 37.1% |
| Total Occupied Housing Units | 97,826 | 100.0% |
Occupancy by Household Size in Boise City
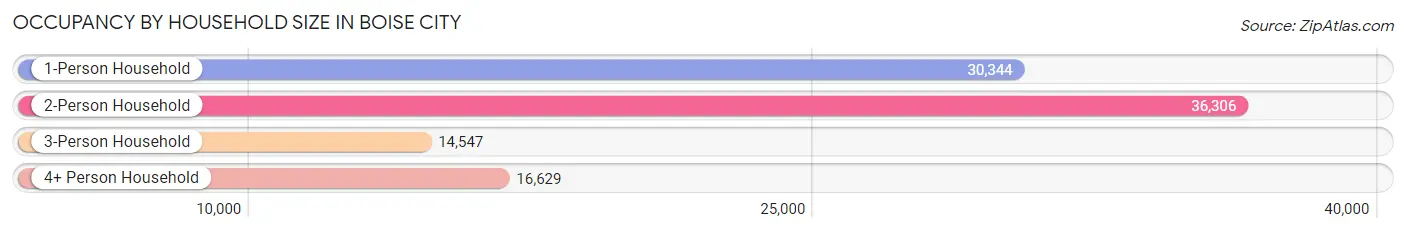
| Household Size | # Housing Units | % Housing Units |
| 1-Person Household | 30,344 | 31.0% |
| 2-Person Household | 36,306 | 37.1% |
| 3-Person Household | 14,547 | 14.9% |
| 4+ Person Household | 16,629 | 17.0% |
| Total Housing Units | 97,826 | 100.0% |
Occupancy by Ownership by Household Size in Boise City
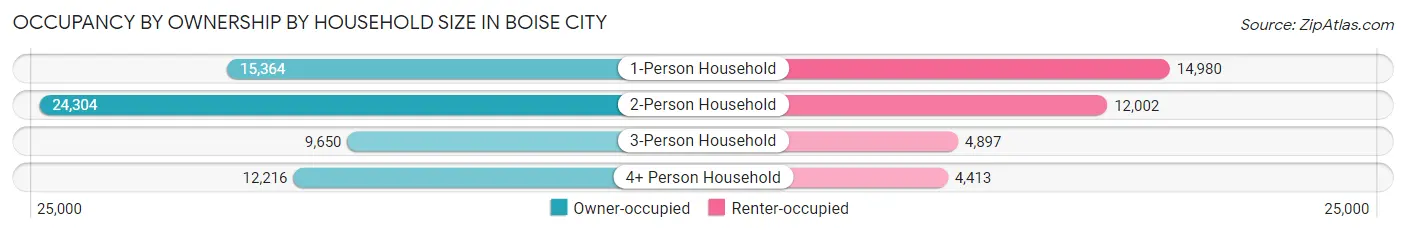
| Household Size | Owner-occupied | Renter-occupied |
| 1-Person Household | 15,364 (50.6%) | 14,980 (49.4%) |
| 2-Person Household | 24,304 (66.9%) | 12,002 (33.1%) |
| 3-Person Household | 9,650 (66.3%) | 4,897 (33.7%) |
| 4+ Person Household | 12,216 (73.5%) | 4,413 (26.5%) |
| Total Housing Units | 61,534 (62.9%) | 36,292 (37.1%) |
Occupancy by Educational Attainment in Boise City
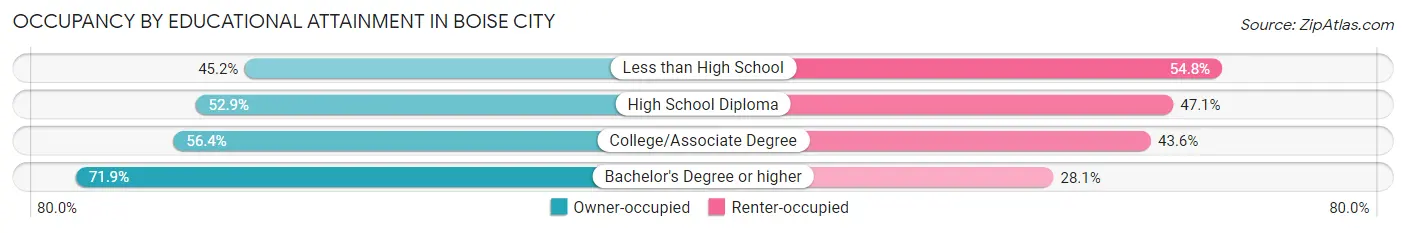
| Household Size | Owner-occupied | Renter-occupied |
| Less than High School | 1,631 (45.2%) | 1,980 (54.8%) |
| High School Diploma | 8,783 (52.9%) | 7,833 (47.1%) |
| College/Associate Degree | 16,925 (56.4%) | 13,090 (43.6%) |
| Bachelor's Degree or higher | 34,195 (71.9%) | 13,389 (28.1%) |
Occupancy by Age of Householder in Boise City
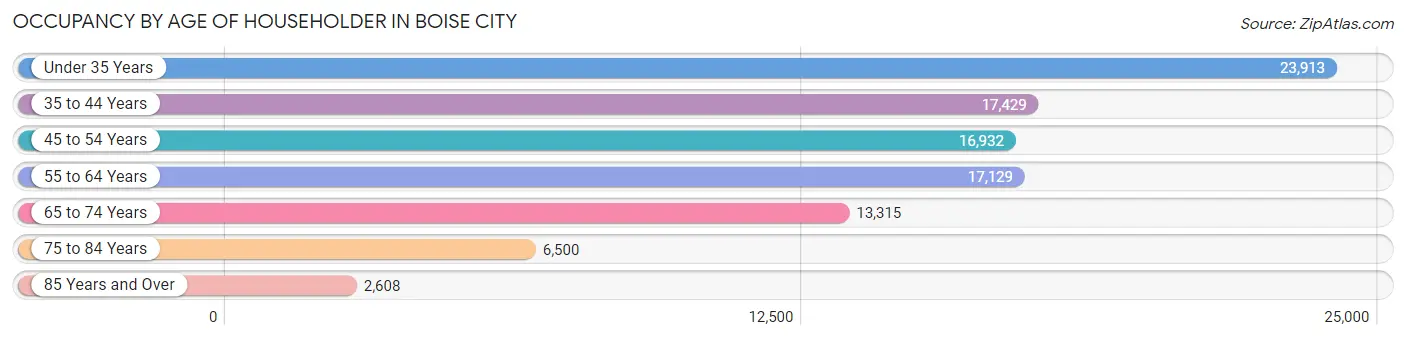
| Age Bracket | # Households | % Households |
| Under 35 Years | 23,913 | 24.4% |
| 35 to 44 Years | 17,429 | 17.8% |
| 45 to 54 Years | 16,932 | 17.3% |
| 55 to 64 Years | 17,129 | 17.5% |
| 65 to 74 Years | 13,315 | 13.6% |
| 75 to 84 Years | 6,500 | 6.6% |
| 85 Years and Over | 2,608 | 2.7% |
| Total | 97,826 | 100.0% |
Housing Finances in Boise City
Median Income by Occupancy in Boise City
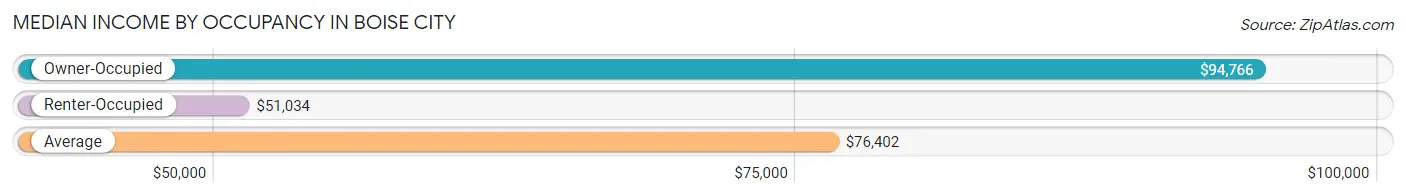
| Occupancy Type | # Households | Median Income |
| Owner-Occupied | 61,534 (62.9%) | $94,766 |
| Renter-Occupied | 36,292 (37.1%) | $51,034 |
| Average | 97,826 (100.0%) | $76,402 |
Occupancy by Householder Income Bracket in Boise City
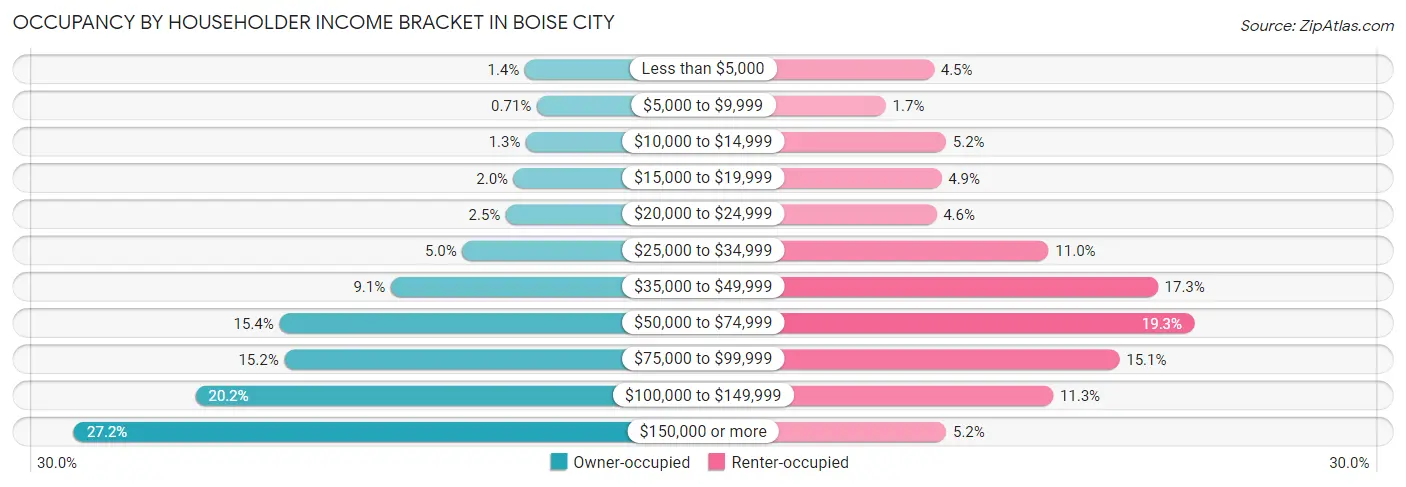
| Income Bracket | Owner-occupied | Renter-occupied |
| Less than $5,000 | 863 (1.4%) | 1,624 (4.5%) |
| $5,000 to $9,999 | 438 (0.7%) | 626 (1.7%) |
| $10,000 to $14,999 | 818 (1.3%) | 1,874 (5.2%) |
| $15,000 to $19,999 | 1,258 (2.0%) | 1,778 (4.9%) |
| $20,000 to $24,999 | 1,523 (2.5%) | 1,672 (4.6%) |
| $25,000 to $34,999 | 3,058 (5.0%) | 3,998 (11.0%) |
| $35,000 to $49,999 | 5,574 (9.1%) | 6,263 (17.3%) |
| $50,000 to $74,999 | 9,495 (15.4%) | 7,016 (19.3%) |
| $75,000 to $99,999 | 9,324 (15.1%) | 5,468 (15.1%) |
| $100,000 to $149,999 | 12,457 (20.2%) | 4,095 (11.3%) |
| $150,000 or more | 16,726 (27.2%) | 1,878 (5.2%) |
| Total | 61,534 (100.0%) | 36,292 (100.0%) |
Monthly Housing Cost Tiers in Boise City
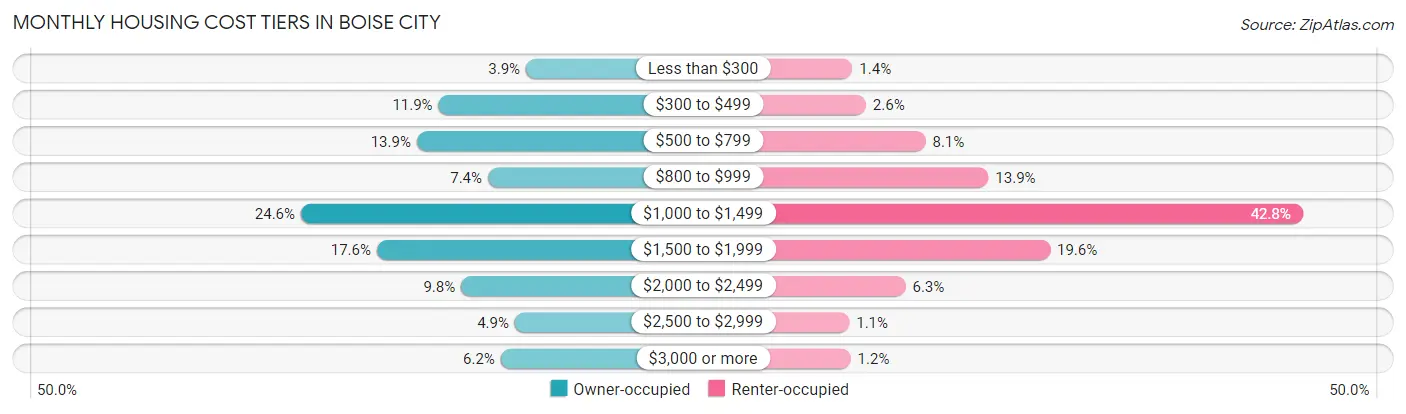
| Monthly Cost | Owner-occupied | Renter-occupied |
| Less than $300 | 2,367 (3.8%) | 502 (1.4%) |
| $300 to $499 | 7,323 (11.9%) | 950 (2.6%) |
| $500 to $799 | 8,553 (13.9%) | 2,945 (8.1%) |
| $800 to $999 | 4,520 (7.3%) | 5,046 (13.9%) |
| $1,000 to $1,499 | 15,120 (24.6%) | 15,543 (42.8%) |
| $1,500 to $1,999 | 10,817 (17.6%) | 7,101 (19.6%) |
| $2,000 to $2,499 | 6,041 (9.8%) | 2,274 (6.3%) |
| $2,500 to $2,999 | 2,994 (4.9%) | 395 (1.1%) |
| $3,000 or more | 3,799 (6.2%) | 443 (1.2%) |
| Total | 61,534 (100.0%) | 36,292 (100.0%) |
Physical Housing Characteristics in Boise City
Housing Structures in Boise City
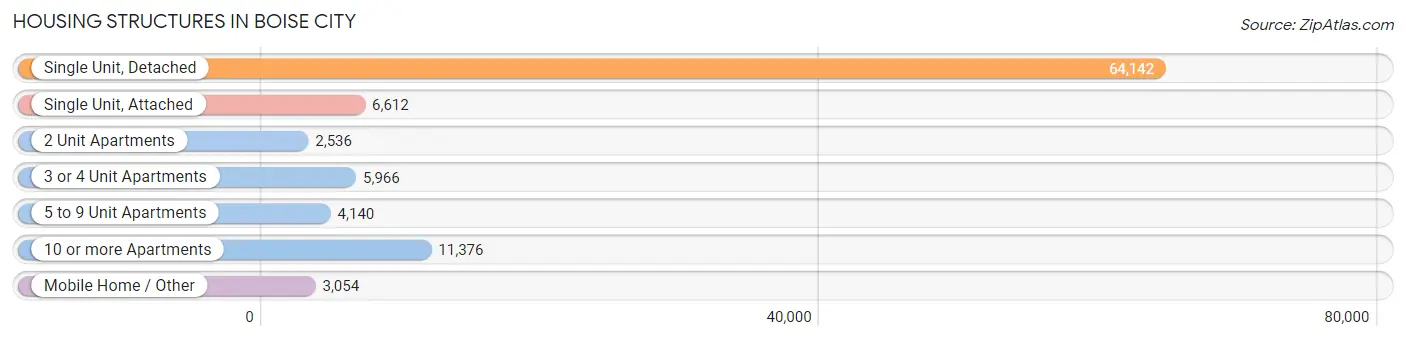
| Structure Type | # Housing Units | % Housing Units |
| Single Unit, Detached | 64,142 | 65.6% |
| Single Unit, Attached | 6,612 | 6.8% |
| 2 Unit Apartments | 2,536 | 2.6% |
| 3 or 4 Unit Apartments | 5,966 | 6.1% |
| 5 to 9 Unit Apartments | 4,140 | 4.2% |
| 10 or more Apartments | 11,376 | 11.6% |
| Mobile Home / Other | 3,054 | 3.1% |
| Total | 97,826 | 100.0% |
Housing Structures by Occupancy in Boise City
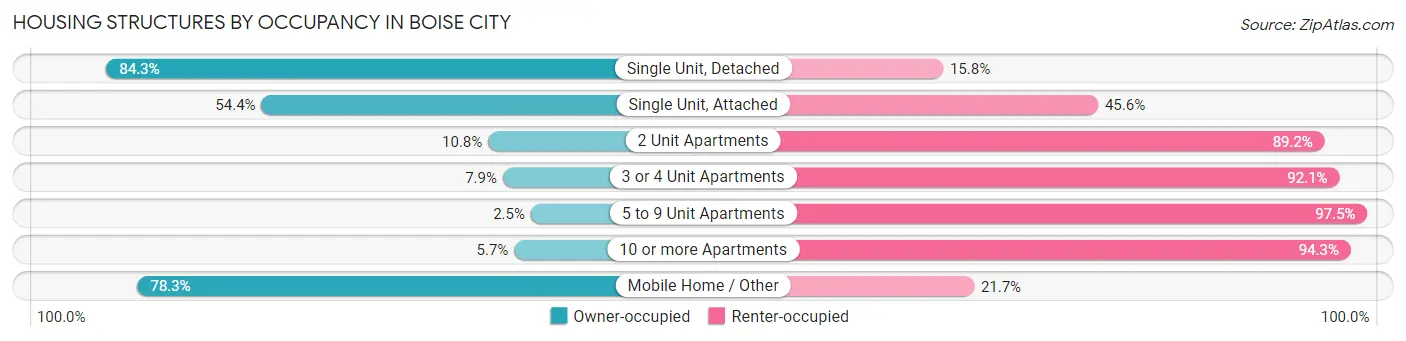
| Structure Type | Owner-occupied | Renter-occupied |
| Single Unit, Detached | 54,042 (84.3%) | 10,100 (15.8%) |
| Single Unit, Attached | 3,597 (54.4%) | 3,015 (45.6%) |
| 2 Unit Apartments | 273 (10.8%) | 2,263 (89.2%) |
| 3 or 4 Unit Apartments | 473 (7.9%) | 5,493 (92.1%) |
| 5 to 9 Unit Apartments | 105 (2.5%) | 4,035 (97.5%) |
| 10 or more Apartments | 653 (5.7%) | 10,723 (94.3%) |
| Mobile Home / Other | 2,391 (78.3%) | 663 (21.7%) |
| Total | 61,534 (62.9%) | 36,292 (37.1%) |
Housing Structures by Number of Rooms in Boise City
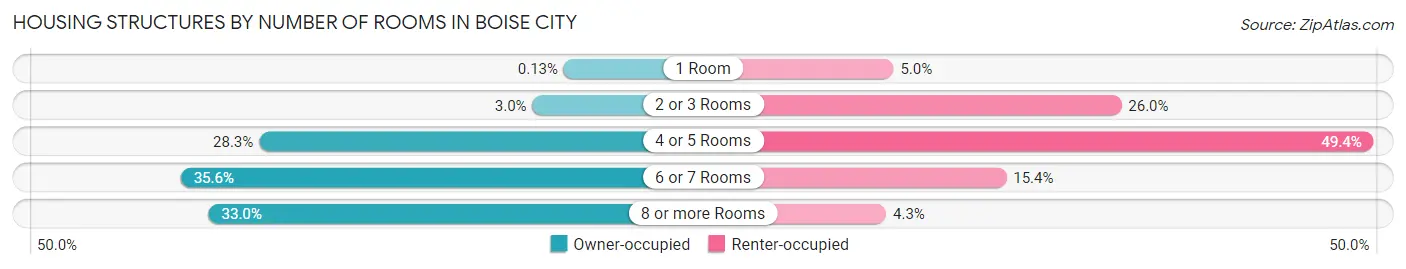
| Number of Rooms | Owner-occupied | Renter-occupied |
| 1 Room | 81 (0.1%) | 1,796 (5.0%) |
| 2 or 3 Rooms | 1,865 (3.0%) | 9,445 (26.0%) |
| 4 or 5 Rooms | 17,418 (28.3%) | 17,915 (49.4%) |
| 6 or 7 Rooms | 21,879 (35.6%) | 5,587 (15.4%) |
| 8 or more Rooms | 20,291 (33.0%) | 1,549 (4.3%) |
| Total | 61,534 (100.0%) | 36,292 (100.0%) |
Housing Structure by Heating Type in Boise City
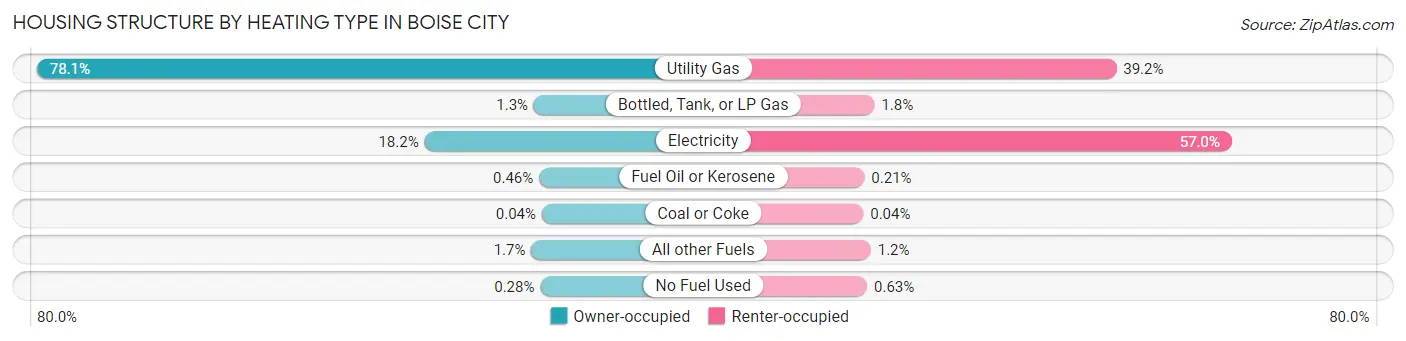
| Heating Type | Owner-occupied | Renter-occupied |
| Utility Gas | 48,064 (78.1%) | 14,207 (39.2%) |
| Bottled, Tank, or LP Gas | 777 (1.3%) | 644 (1.8%) |
| Electricity | 11,184 (18.2%) | 20,687 (57.0%) |
| Fuel Oil or Kerosene | 285 (0.5%) | 78 (0.2%) |
| Coal or Coke | 27 (0.0%) | 14 (0.0%) |
| All other Fuels | 1,025 (1.7%) | 434 (1.2%) |
| No Fuel Used | 172 (0.3%) | 228 (0.6%) |
| Total | 61,534 (100.0%) | 36,292 (100.0%) |
Household Vehicle Usage in Boise City
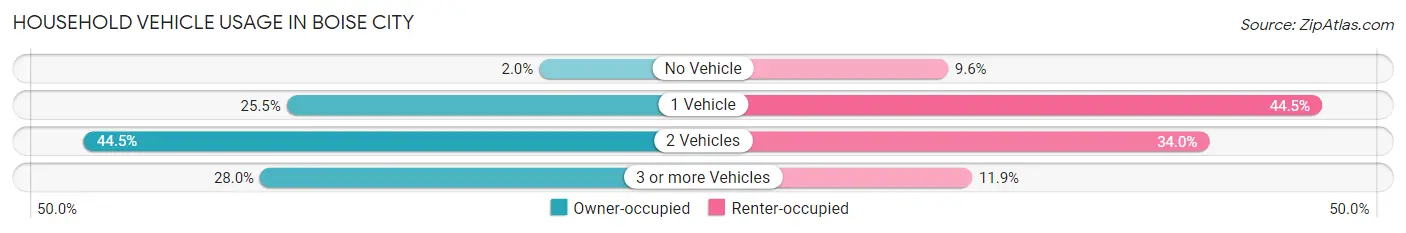
| Vehicles per Household | Owner-occupied | Renter-occupied |
| No Vehicle | 1,211 (2.0%) | 3,488 (9.6%) |
| 1 Vehicle | 15,714 (25.5%) | 16,158 (44.5%) |
| 2 Vehicles | 27,361 (44.5%) | 12,340 (34.0%) |
| 3 or more Vehicles | 17,248 (28.0%) | 4,306 (11.9%) |
| Total | 61,534 (100.0%) | 36,292 (100.0%) |
Real Estate & Mortgages in Boise City
Real Estate and Mortgage Overview in Boise City
| Characteristic | Without Mortgage | With Mortgage |
| Housing Units | 20,246 | 41,288 |
| Median Property Value | $385,600 | $410,100 |
| Median Household Income | $75,982 | $12,357 |
| Monthly Housing Costs | $527 | $3,744 |
| Real Estate Taxes | $2,788 | $614 |
Property Value by Mortgage Status in Boise City
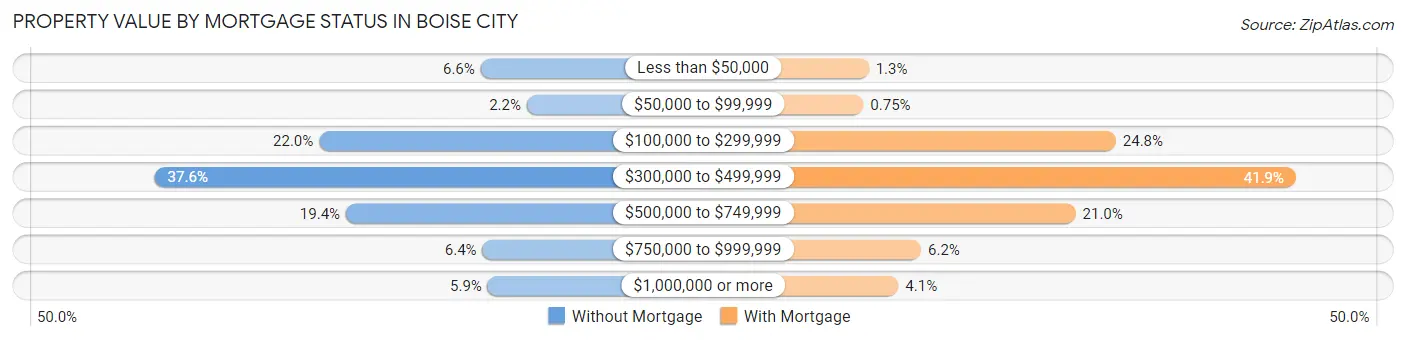
| Property Value | Without Mortgage | With Mortgage |
| Less than $50,000 | 1,330 (6.6%) | 517 (1.3%) |
| $50,000 to $99,999 | 439 (2.2%) | 311 (0.7%) |
| $100,000 to $299,999 | 4,445 (22.0%) | 10,235 (24.8%) |
| $300,000 to $499,999 | 7,614 (37.6%) | 17,312 (41.9%) |
| $500,000 to $749,999 | 3,928 (19.4%) | 8,654 (21.0%) |
| $750,000 to $999,999 | 1,296 (6.4%) | 2,576 (6.2%) |
| $1,000,000 or more | 1,194 (5.9%) | 1,683 (4.1%) |
| Total | 20,246 (100.0%) | 41,288 (100.0%) |
Household Income by Mortgage Status in Boise City
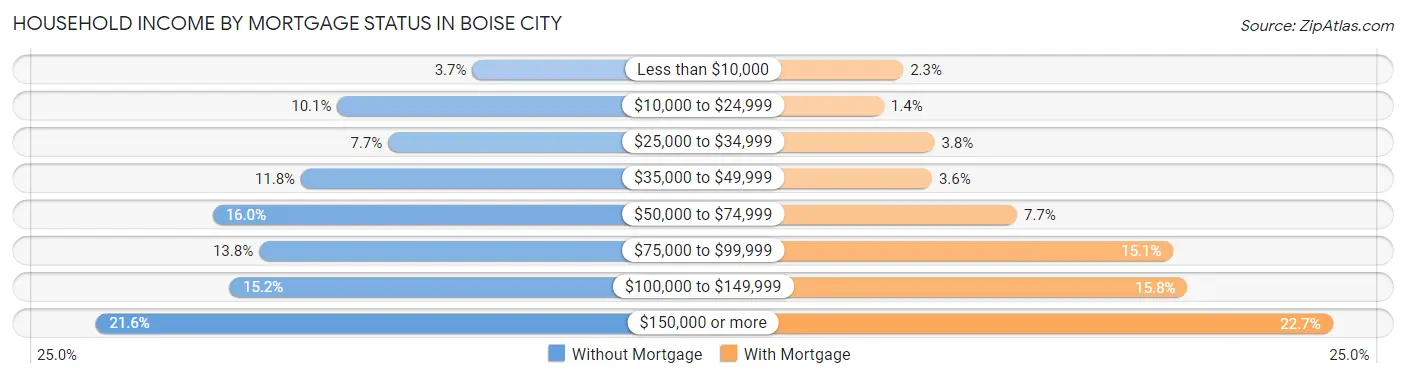
| Household Income | Without Mortgage | With Mortgage |
| Less than $10,000 | 745 (3.7%) | 937 (2.3%) |
| $10,000 to $24,999 | 2,047 (10.1%) | 556 (1.3%) |
| $25,000 to $34,999 | 1,556 (7.7%) | 1,552 (3.8%) |
| $35,000 to $49,999 | 2,398 (11.8%) | 1,502 (3.6%) |
| $50,000 to $74,999 | 3,247 (16.0%) | 3,176 (7.7%) |
| $75,000 to $99,999 | 2,802 (13.8%) | 6,248 (15.1%) |
| $100,000 to $149,999 | 3,082 (15.2%) | 6,522 (15.8%) |
| $150,000 or more | 4,369 (21.6%) | 9,375 (22.7%) |
| Total | 20,246 (100.0%) | 41,288 (100.0%) |
Property Value to Household Income Ratio in Boise City
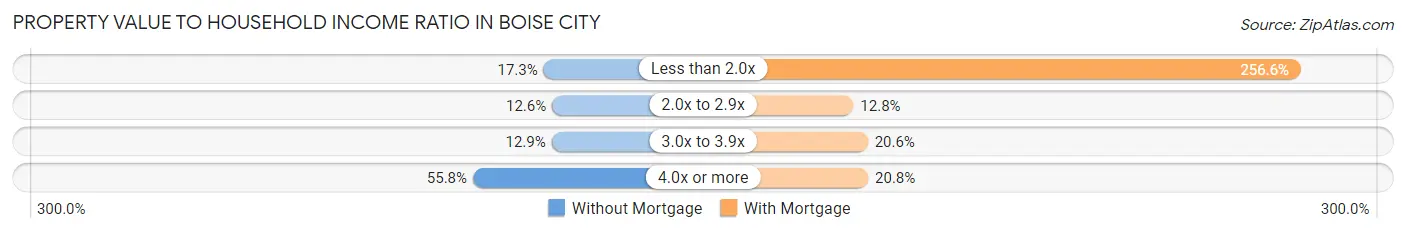
| Value-to-Income Ratio | Without Mortgage | With Mortgage |
| Less than 2.0x | 3,495 (17.3%) | 105,937 (256.6%) |
| 2.0x to 2.9x | 2,560 (12.6%) | 5,284 (12.8%) |
| 3.0x to 3.9x | 2,608 (12.9%) | 8,500 (20.6%) |
| 4.0x or more | 11,291 (55.8%) | 8,598 (20.8%) |
| Total | 20,246 (100.0%) | 41,288 (100.0%) |
Real Estate Taxes by Mortgage Status in Boise City
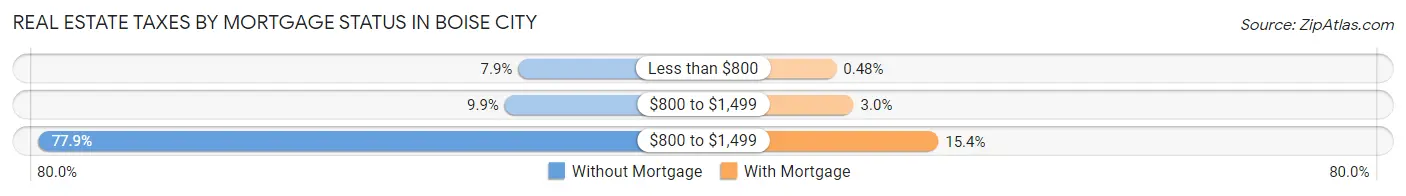
| Property Taxes | Without Mortgage | With Mortgage |
| Less than $800 | 1,596 (7.9%) | 197 (0.5%) |
| $800 to $1,499 | 1,995 (9.9%) | 1,243 (3.0%) |
| $800 to $1,499 | 15,778 (77.9%) | 6,352 (15.4%) |
| Total | 20,246 (100.0%) | 41,288 (100.0%) |
Health & Disability in Boise City
Health Insurance Coverage by Age in Boise City
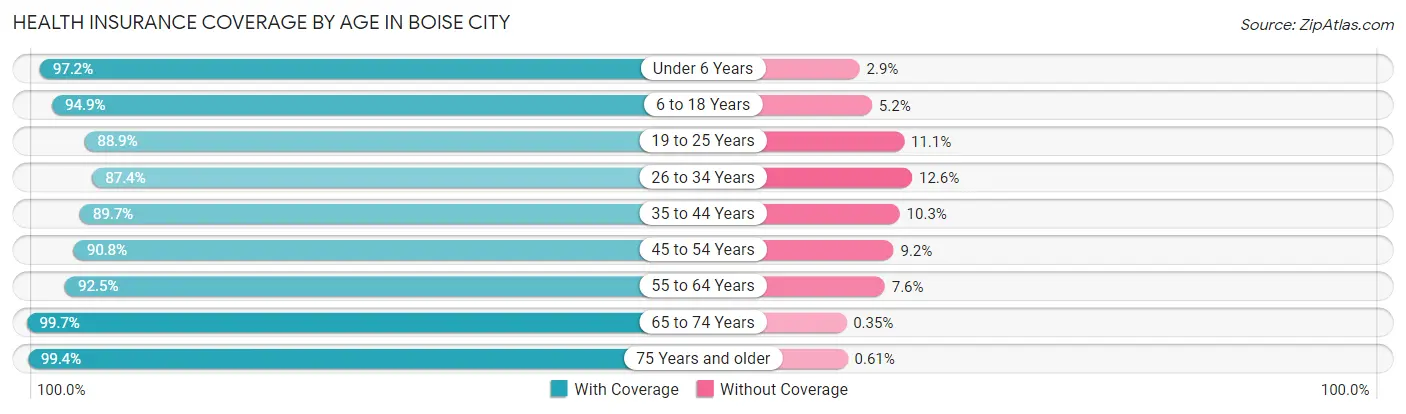
| Age Bracket | With Coverage | Without Coverage |
| Under 6 Years | 13,053 (97.2%) | 383 (2.9%) |
| 6 to 18 Years | 33,694 (94.9%) | 1,829 (5.1%) |
| 19 to 25 Years | 22,840 (88.9%) | 2,864 (11.1%) |
| 26 to 34 Years | 28,419 (87.4%) | 4,111 (12.6%) |
| 35 to 44 Years | 29,523 (89.7%) | 3,396 (10.3%) |
| 45 to 54 Years | 26,056 (90.8%) | 2,634 (9.2%) |
| 55 to 64 Years | 26,602 (92.4%) | 2,172 (7.5%) |
| 65 to 74 Years | 20,905 (99.7%) | 73 (0.4%) |
| 75 Years and older | 13,253 (99.4%) | 81 (0.6%) |
| Total | 214,345 (92.4%) | 17,543 (7.6%) |
Health Insurance Coverage by Citizenship Status in Boise City
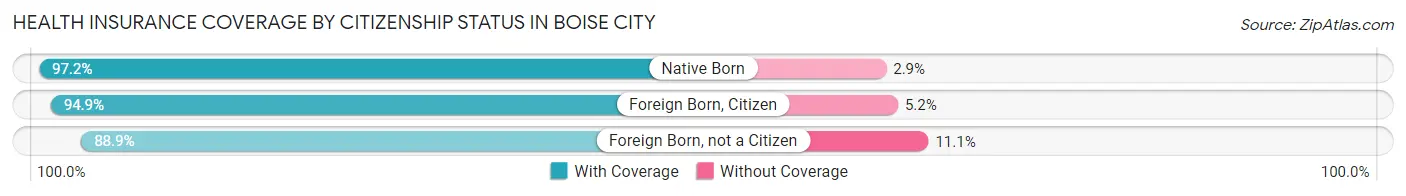
| Citizenship Status | With Coverage | Without Coverage |
| Native Born | 13,053 (97.2%) | 383 (2.9%) |
| Foreign Born, Citizen | 33,694 (94.9%) | 1,829 (5.1%) |
| Foreign Born, not a Citizen | 22,840 (88.9%) | 2,864 (11.1%) |
Health Insurance Coverage by Household Income in Boise City
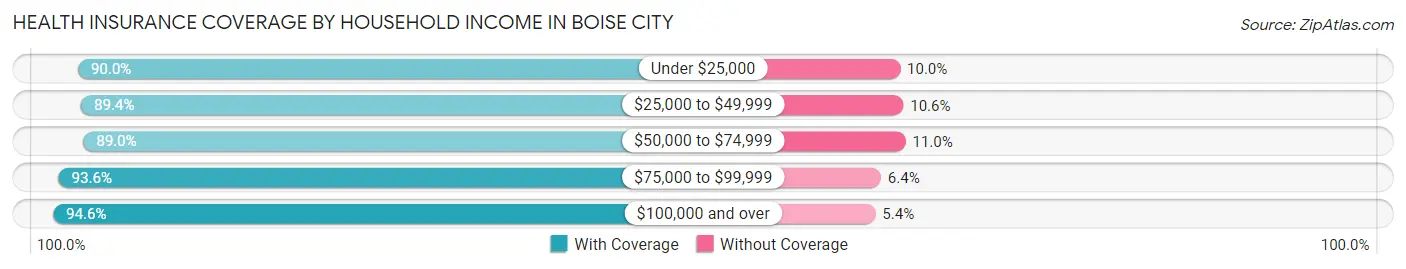
| Household Income | With Coverage | Without Coverage |
| Under $25,000 | 17,903 (90.0%) | 1,987 (10.0%) |
| $25,000 to $49,999 | 32,458 (89.4%) | 3,842 (10.6%) |
| $50,000 to $74,999 | 31,876 (89.0%) | 3,942 (11.0%) |
| $75,000 to $99,999 | 33,069 (93.6%) | 2,256 (6.4%) |
| $100,000 and over | 94,405 (94.6%) | 5,342 (5.4%) |
Public vs Private Health Insurance Coverage by Age in Boise City
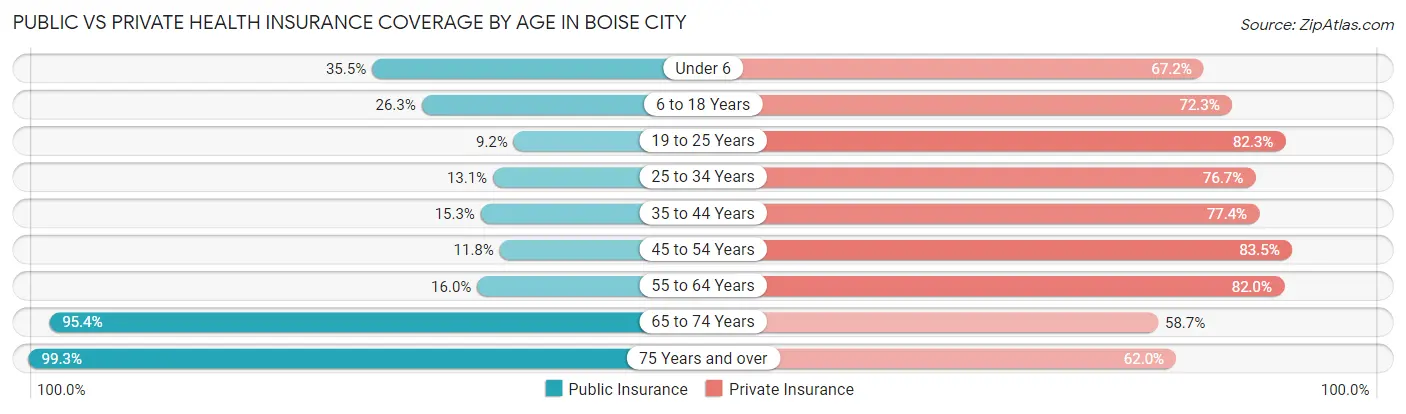
| Age Bracket | Public Insurance | Private Insurance |
| Under 6 | 4,772 (35.5%) | 9,022 (67.1%) |
| 6 to 18 Years | 9,351 (26.3%) | 25,693 (72.3%) |
| 19 to 25 Years | 2,372 (9.2%) | 21,152 (82.3%) |
| 25 to 34 Years | 4,253 (13.1%) | 24,954 (76.7%) |
| 35 to 44 Years | 5,050 (15.3%) | 25,485 (77.4%) |
| 45 to 54 Years | 3,393 (11.8%) | 23,945 (83.5%) |
| 55 to 64 Years | 4,605 (16.0%) | 23,605 (82.0%) |
| 65 to 74 Years | 20,017 (95.4%) | 12,314 (58.7%) |
| 75 Years and over | 13,234 (99.3%) | 8,268 (62.0%) |
| Total | 67,047 (28.9%) | 174,438 (75.2%) |
Disability Status by Sex by Age in Boise City
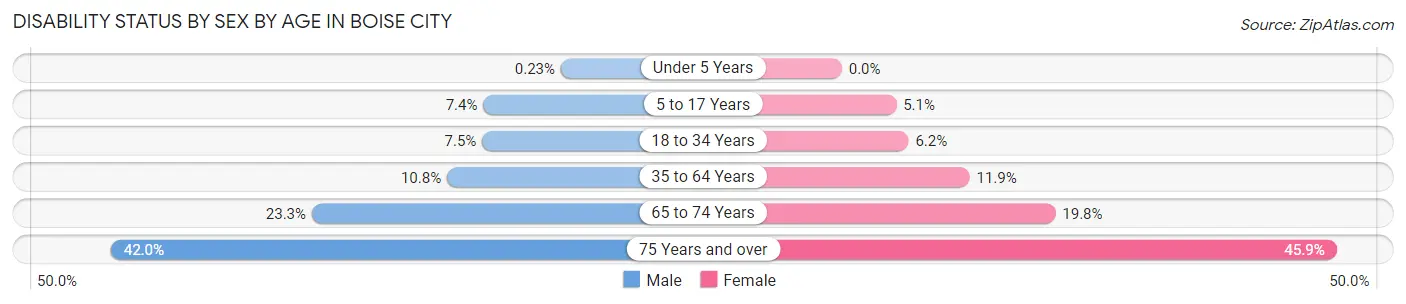
| Age Bracket | Male | Female |
| Under 5 Years | 13 (0.2%) | 0 (0.0%) |
| 5 to 17 Years | 1,322 (7.4%) | 784 (5.1%) |
| 18 to 34 Years | 2,451 (7.5%) | 1,878 (6.2%) |
| 35 to 64 Years | 4,950 (10.8%) | 5,285 (11.9%) |
| 65 to 74 Years | 2,345 (23.3%) | 2,166 (19.8%) |
| 75 Years and over | 2,325 (42.0%) | 3,581 (45.9%) |
Disability Class by Sex by Age in Boise City
Disability Class: Hearing Difficulty
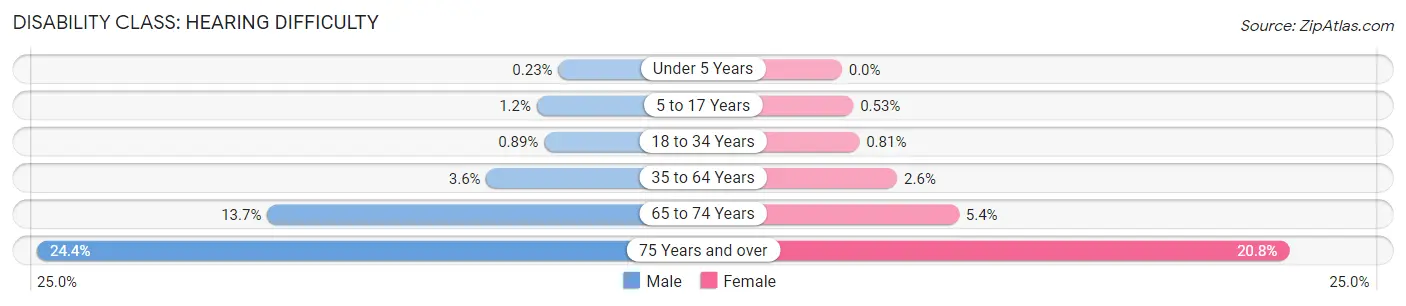
| Age Bracket | Male | Female |
| Under 5 Years | 13 (0.2%) | 0 (0.0%) |
| 5 to 17 Years | 219 (1.2%) | 82 (0.5%) |
| 18 to 34 Years | 290 (0.9%) | 247 (0.8%) |
| 35 to 64 Years | 1,634 (3.6%) | 1,144 (2.6%) |
| 65 to 74 Years | 1,380 (13.7%) | 594 (5.4%) |
| 75 Years and over | 1,352 (24.4%) | 1,619 (20.8%) |
Disability Class: Vision Difficulty
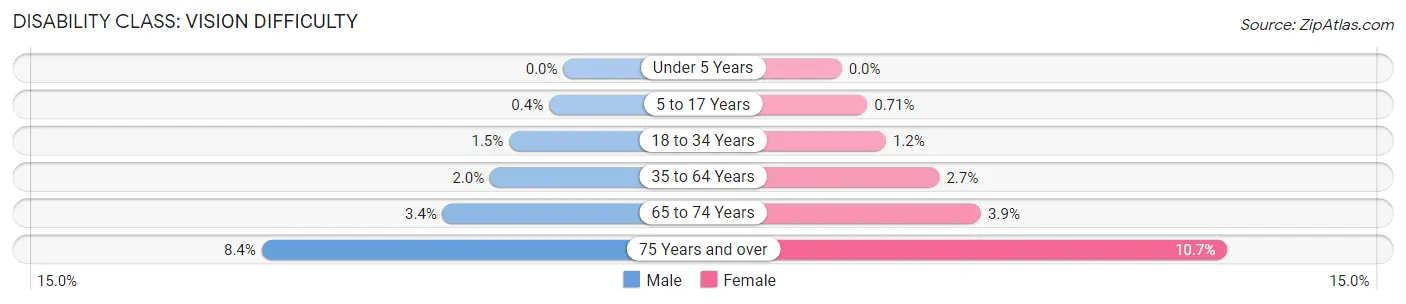
| Age Bracket | Male | Female |
| Under 5 Years | 0 (0.0%) | 0 (0.0%) |
| 5 to 17 Years | 71 (0.4%) | 111 (0.7%) |
| 18 to 34 Years | 492 (1.5%) | 374 (1.2%) |
| 35 to 64 Years | 933 (2.0%) | 1,211 (2.7%) |
| 65 to 74 Years | 338 (3.4%) | 424 (3.9%) |
| 75 Years and over | 465 (8.4%) | 837 (10.7%) |
Disability Class: Cognitive Difficulty
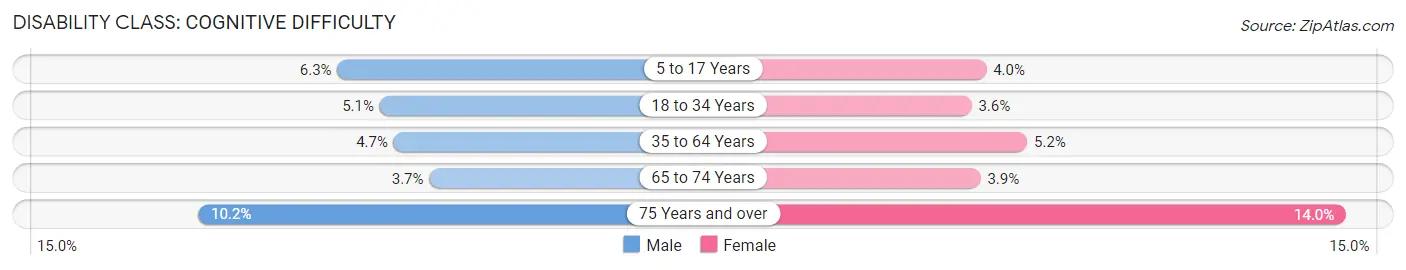
| Age Bracket | Male | Female |
| 5 to 17 Years | 1,120 (6.3%) | 624 (4.0%) |
| 18 to 34 Years | 1,662 (5.1%) | 1,095 (3.6%) |
| 35 to 64 Years | 2,165 (4.7%) | 2,300 (5.2%) |
| 65 to 74 Years | 375 (3.7%) | 422 (3.9%) |
| 75 Years and over | 563 (10.2%) | 1,095 (14.0%) |
Disability Class: Ambulatory Difficulty
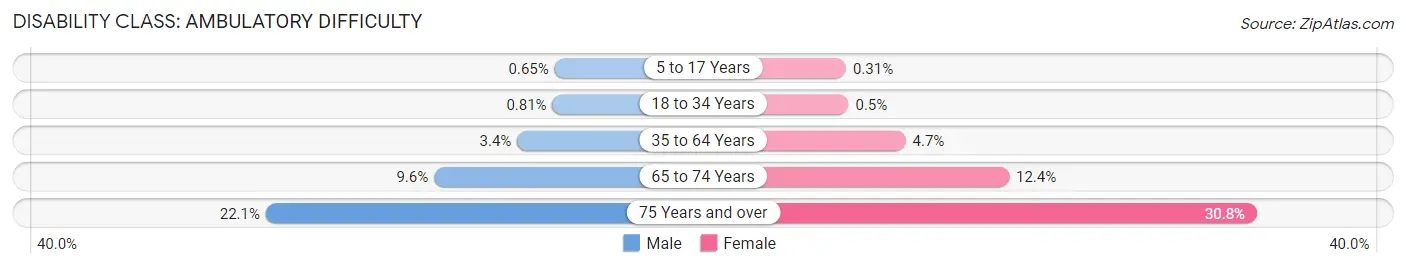
| Age Bracket | Male | Female |
| 5 to 17 Years | 116 (0.6%) | 48 (0.3%) |
| 18 to 34 Years | 262 (0.8%) | 151 (0.5%) |
| 35 to 64 Years | 1,570 (3.4%) | 2,114 (4.7%) |
| 65 to 74 Years | 965 (9.6%) | 1,358 (12.4%) |
| 75 Years and over | 1,223 (22.1%) | 2,403 (30.8%) |
Disability Class: Self-Care Difficulty
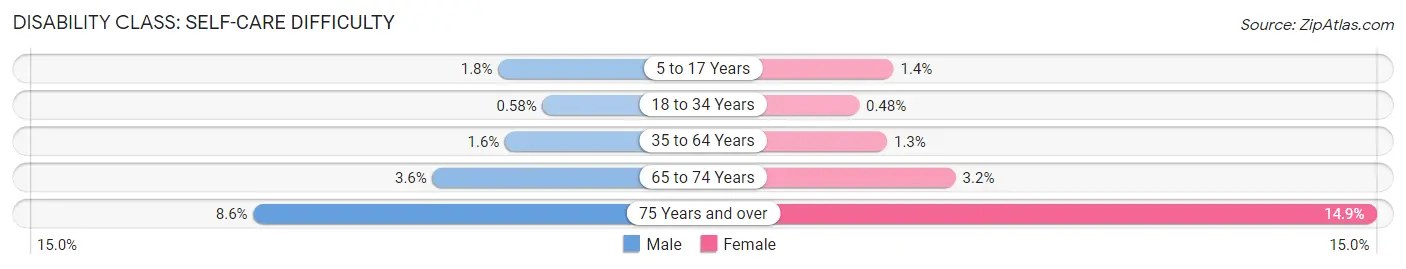
| Age Bracket | Male | Female |
| 5 to 17 Years | 322 (1.8%) | 223 (1.4%) |
| 18 to 34 Years | 190 (0.6%) | 145 (0.5%) |
| 35 to 64 Years | 744 (1.6%) | 560 (1.3%) |
| 65 to 74 Years | 366 (3.6%) | 346 (3.2%) |
| 75 Years and over | 478 (8.6%) | 1,160 (14.9%) |
Technology Access in Boise City
Computing Device Access in Boise City
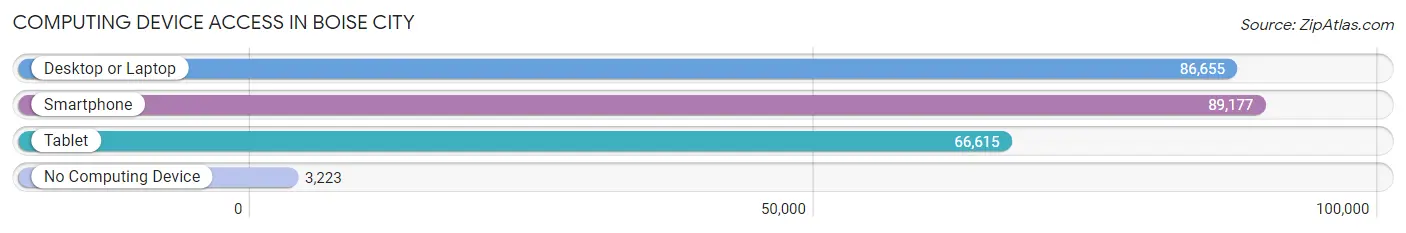
| Device Type | # Households | % Households |
| Desktop or Laptop | 86,655 | 88.6% |
| Smartphone | 89,177 | 91.2% |
| Tablet | 66,615 | 68.1% |
| No Computing Device | 3,223 | 3.3% |
| Total | 97,826 | 100.0% |
Internet Access in Boise City
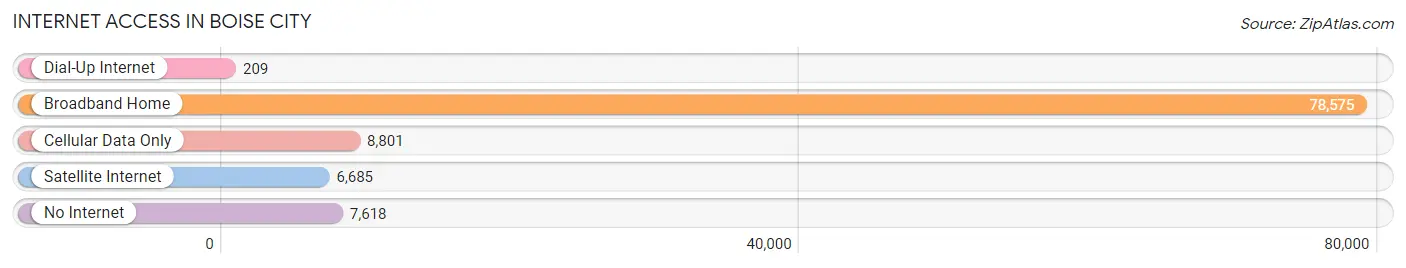
| Internet Type | # Households | % Households |
| Dial-Up Internet | 209 | 0.2% |
| Broadband Home | 78,575 | 80.3% |
| Cellular Data Only | 8,801 | 9.0% |
| Satellite Internet | 6,685 | 6.8% |
| No Internet | 7,618 | 7.8% |
| Total | 97,826 | 100.0% |
Boise City Summary
Boise City, Idaho is the capital and most populous city of the state of Idaho. Located in the southwestern part of the state, Boise City is the county seat of Ada County and the principal city of the Boise City-Nampa metropolitan area. As of the 2010 census, the population of Boise City was 205,671, making it the third-largest city in the Pacific Northwest region of the United States.
Geography
Boise City is located in the southwestern part of Idaho, in the foothills of the Rocky Mountains. The city is situated on the Boise River, which flows through the city from east to west. The city is surrounded by the Boise National Forest to the north and east, and the Owyhee Mountains to the south. The city is located at an elevation of 2,730 feet (830 m) above sea level.
Economy
Boise City is the economic and cultural center of the Boise City-Nampa metropolitan area, which is the largest metropolitan area in Idaho. The city is home to a number of major employers, including Hewlett-Packard, Micron Technology, and Boise State University. The city is also a major center for the technology industry, with a number of software and hardware companies located in the city.
The city is also a major center for the agricultural industry, with a number of farms and ranches located in the surrounding area. The city is home to a number of food processing companies, including J.R. Simplot Company, which is the largest potato processor in the world.
Demographics
As of the 2010 census, the population of Boise City was 205,671. The racial makeup of the city was 87.2% White, 4.2% African American, 1.2% Native American, 2.7% Asian, 0.2% Pacific Islander, 2.3% from other races, and 2.4% from two or more races. Hispanic or Latino of any race were 6.7% of the population.
The median income for a household in the city was $41,919, and the median income for a family was $50,945. The per capita income for the city was $23,845. About 13.2% of families and 17.2% of the population were below the poverty line, including 24.3% of those under age 18 and 8.2% of those age 65 or over.
Boise City is a major center for education, with a number of public and private schools located in the city. The city is home to Boise State University, a public research university, and the College of Idaho, a private liberal arts college. The city is also home to a number of private schools, including Bishop Kelly High School, a Catholic high school.
Common Questions
What is the Total Population of Boise City?
Total Population of Boise City is 234,192.
What is the Total Male Population of Boise City?
Total Male Population of Boise City is 118,618.
What is the Total Female Population of Boise City?
Total Female Population of Boise City is 115,574.
What is the Ratio of Males per 100 Females in Boise City?
There are 102.63 Males per 100 Females in Boise City.
What is the Ratio of Females per 100 Males in Boise City?
There are 97.43 Females per 100 Males in Boise City.
What is the Median Population Age in Boise City?
Median Population Age in Boise City is 37.9 Years.
What is the Average Family Size in Boise City
Average Family Size in Boise City is 2.9 People.
What is the Average Household Size in Boise City
Average Household Size in Boise City is 2.3 People.
What is Per Capita Income in Boise City?
Per Capita income in Boise City is $44,728.
What is the Median Family Income in Boise City?
Median Family Income in Boise City is $95,461.
What is the Median Household income in Boise City?
Median Household Income in Boise City is $76,402.
What is Income or Wage Gap in Boise City?
Income or Wage Gap in Boise City is 23.7%.
Women in Boise City earn 76.3 cents for every dollar earned by a man.
What is Family Income Deficit in Boise City?
Family Income Deficit in Boise City is $10,700.
Families that are below poverty line in Boise City earn $10,700 less on average than the poverty threshold level.
What is Inequality or Gini Index in Boise City?
Inequality or Gini Index in Boise City is 0.46.
How Large is the Labor Force in Boise City?
There are 133,769 People in the Labor Forcein in Boise City.
What is the Percentage of People in the Labor Force in Boise City?
68.5% of People are in the Labor Force in Boise City.
What is the Unemployment Rate in Boise City?
Unemployment Rate in Boise City is 3.8%.