Weiser, ID
Weiser Map
Weiser Overview
5,678
TOTAL POPULATION
2,736
MALE POPULATION
2,942
FEMALE POPULATION
93.00
MALES / 100 FEMALES
107.53
FEMALES / 100 MALES
39.3
MEDIAN AGE
2.7
AVG FAMILY SIZE
2.3
AVG HOUSEHOLD SIZE
$23,799
PER CAPITA INCOME
$48,646
AVG FAMILY INCOME
$41,491
AVG HOUSEHOLD INCOME
54.4%
WAGE / INCOME GAP [ % ]
45.6¢/ $1
WAGE / INCOME GAP [ $ ]
0.45
INEQUALITY / GINI INDEX
2,254
LABOR FORCE [ PEOPLE ]
49.9%
PERCENT IN LABOR FORCE
5.8%
UNEMPLOYMENT RATE
Weiser Zip Codes
Weiser Area Codes
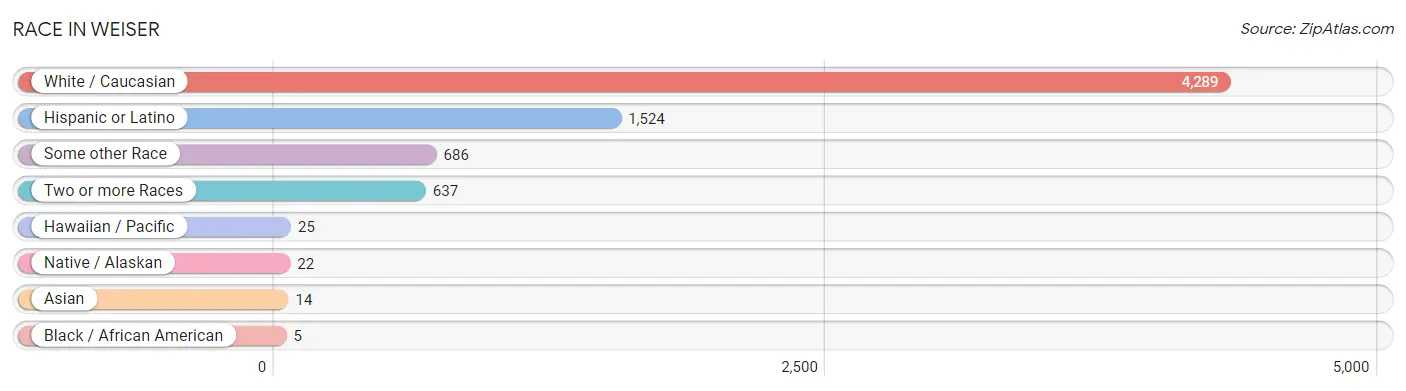
Race in Weiser
The most populous races in Weiser are White / Caucasian (4,289 | 75.5%), Hispanic or Latino (1,524 | 26.8%), and Some other Race (686 | 12.1%).
| Race | # Population | % Population |
| Asian | 14 | 0.3% |
| Black / African American | 5 | 0.1% |
| Hawaiian / Pacific | 25 | 0.4% |
| Hispanic or Latino | 1,524 | 26.8% |
| Native / Alaskan | 22 | 0.4% |
| White / Caucasian | 4,289 | 75.5% |
| Two or more Races | 637 | 11.2% |
| Some other Race | 686 | 12.1% |
| Total | 5,678 | 100.0% |
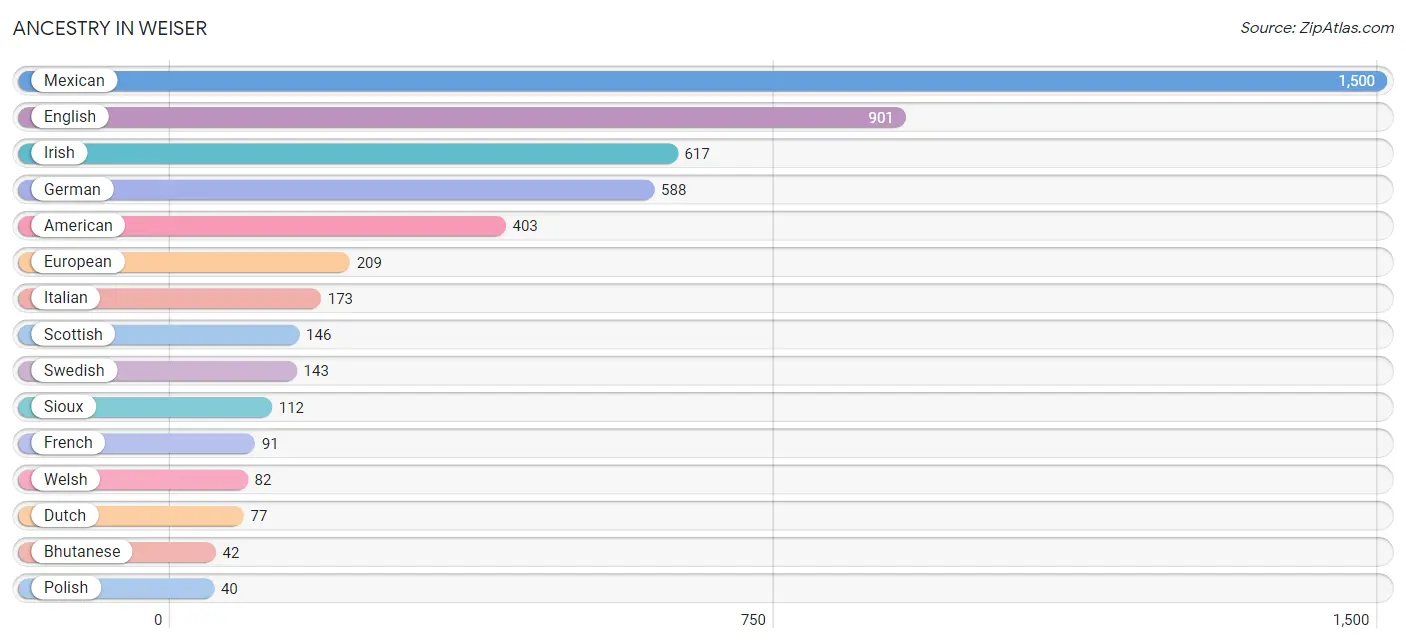
Ancestry in Weiser
The most populous ancestries reported in Weiser are Mexican (1,500 | 26.4%), English (901 | 15.9%), Irish (617 | 10.9%), German (588 | 10.4%), and American (403 | 7.1%), together accounting for 70.6% of all Weiser residents.
| Ancestry | # Population | % Population |
| American | 403 | 7.1% |
| Armenian | 6 | 0.1% |
| Bhutanese | 42 | 0.7% |
| Blackfeet | 1 | 0.0% |
| British | 8 | 0.1% |
| Burmese | 1 | 0.0% |
| Cherokee | 12 | 0.2% |
| Chickasaw | 10 | 0.2% |
| Danish | 9 | 0.2% |
| Dutch | 77 | 1.4% |
| English | 901 | 15.9% |
| European | 209 | 3.7% |
| French | 91 | 1.6% |
| German | 588 | 10.4% |
| Greek | 32 | 0.6% |
| Irish | 617 | 10.9% |
| Italian | 173 | 3.0% |
| Mexican | 1,500 | 26.4% |
| Northern European | 7 | 0.1% |
| Norwegian | 36 | 0.6% |
| Polish | 40 | 0.7% |
| Russian | 30 | 0.5% |
| Scotch-Irish | 23 | 0.4% |
| Scottish | 146 | 2.6% |
| Sioux | 112 | 2.0% |
| Slovak | 9 | 0.2% |
| Spaniard | 20 | 0.4% |
| Spanish | 2 | 0.0% |
| Sri Lankan | 6 | 0.1% |
| Swedish | 143 | 2.5% |
| Welsh | 82 | 1.4% |
| Yugoslavian | 20 | 0.4% | View All 32 Rows |
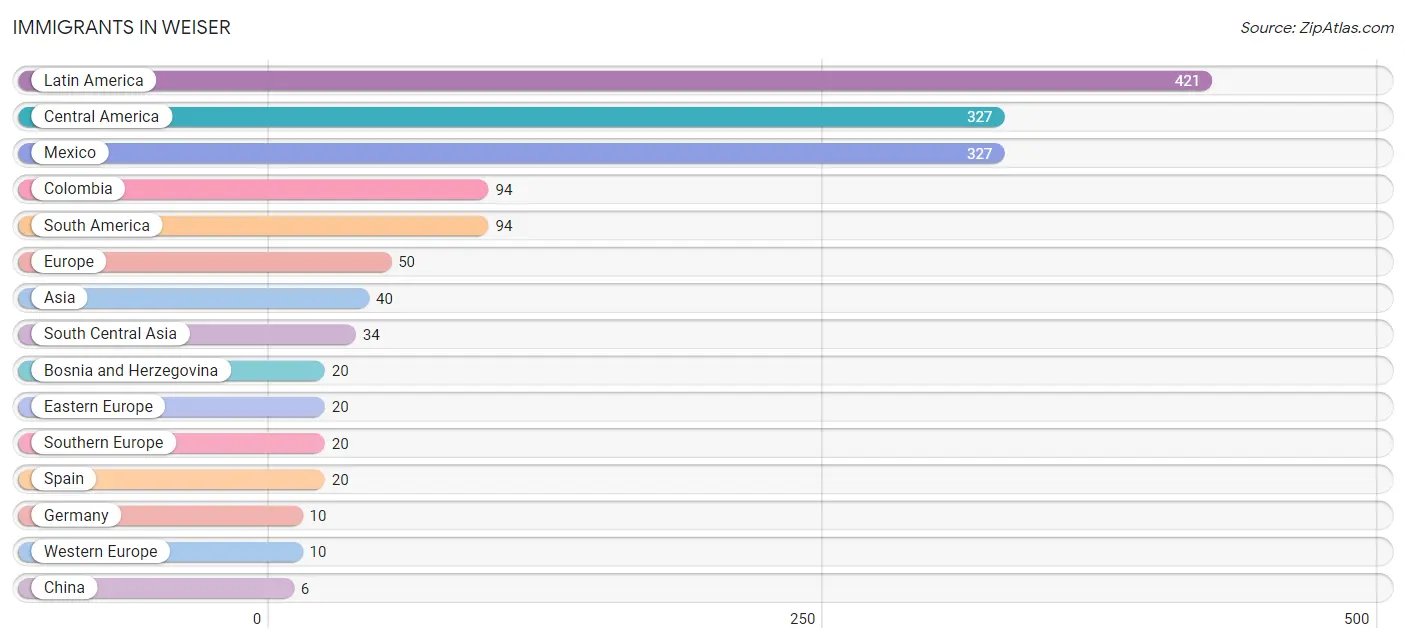
Immigrants in Weiser
The most numerous immigrant groups reported in Weiser came from Latin America (421 | 7.4%), Central America (327 | 5.8%), Mexico (327 | 5.8%), Colombia (94 | 1.7%), and South America (94 | 1.7%), together accounting for 22.2% of all Weiser residents.
| Immigration Origin | # Population | % Population |
| Asia | 40 | 0.7% |
| Bosnia and Herzegovina | 20 | 0.4% |
| Central America | 327 | 5.8% |
| China | 6 | 0.1% |
| Colombia | 94 | 1.7% |
| Eastern Asia | 6 | 0.1% |
| Eastern Europe | 20 | 0.4% |
| Europe | 50 | 0.9% |
| Germany | 10 | 0.2% |
| Latin America | 421 | 7.4% |
| Mexico | 327 | 5.8% |
| South America | 94 | 1.7% |
| South Central Asia | 34 | 0.6% |
| Southern Europe | 20 | 0.4% |
| Spain | 20 | 0.4% |
| Taiwan | 6 | 0.1% |
| Western Europe | 10 | 0.2% | View All 17 Rows |
Sex and Age in Weiser
Sex and Age in Weiser
The most populous age groups in Weiser are 5 to 9 Years (275 | 10.1%) for men and 65 to 69 Years (270 | 9.2%) for women.
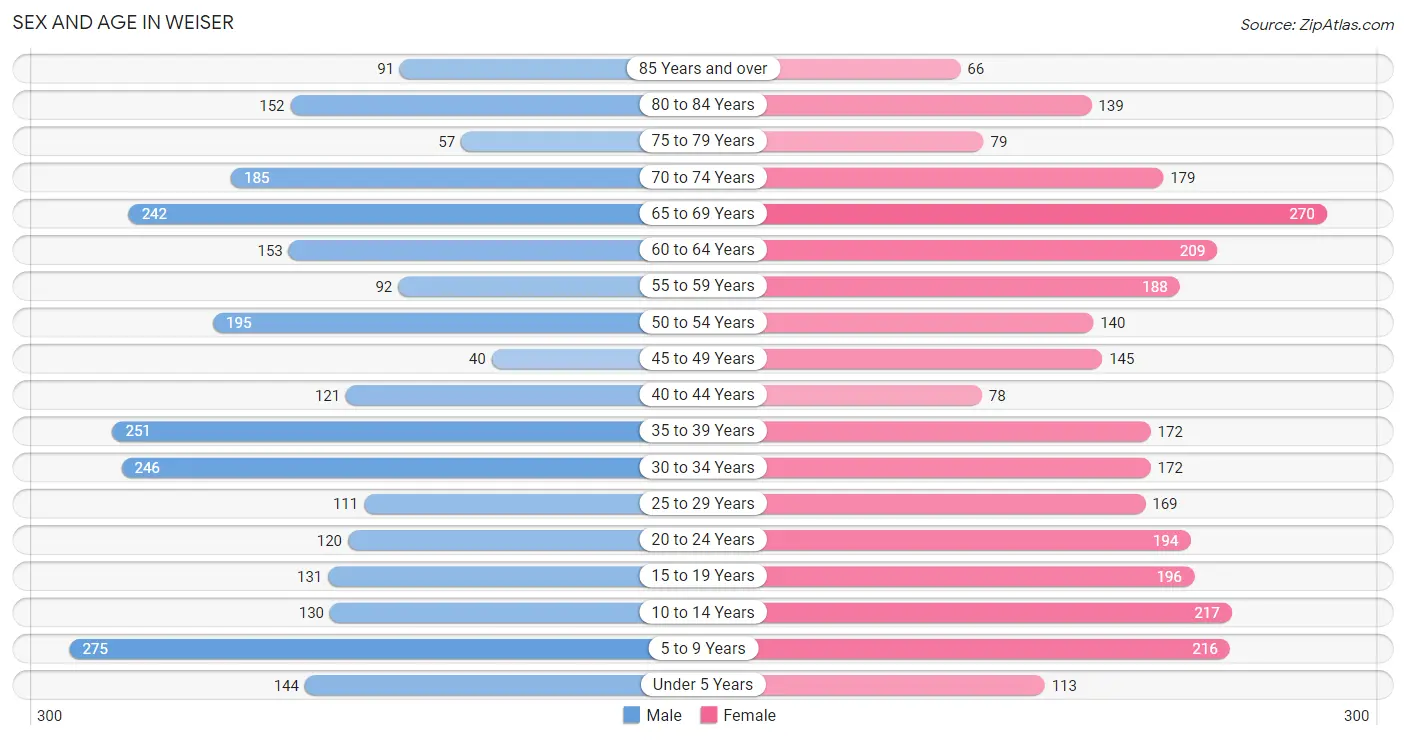
| Age Bracket | Male | Female |
| Under 5 Years | 144 (5.3%) | 113 (3.8%) |
| 5 to 9 Years | 275 (10.1%) | 216 (7.3%) |
| 10 to 14 Years | 130 (4.8%) | 217 (7.4%) |
| 15 to 19 Years | 131 (4.8%) | 196 (6.7%) |
| 20 to 24 Years | 120 (4.4%) | 194 (6.6%) |
| 25 to 29 Years | 111 (4.1%) | 169 (5.7%) |
| 30 to 34 Years | 246 (9.0%) | 172 (5.9%) |
| 35 to 39 Years | 251 (9.2%) | 172 (5.9%) |
| 40 to 44 Years | 121 (4.4%) | 78 (2.6%) |
| 45 to 49 Years | 40 (1.5%) | 145 (4.9%) |
| 50 to 54 Years | 195 (7.1%) | 140 (4.8%) |
| 55 to 59 Years | 92 (3.4%) | 188 (6.4%) |
| 60 to 64 Years | 153 (5.6%) | 209 (7.1%) |
| 65 to 69 Years | 242 (8.8%) | 270 (9.2%) |
| 70 to 74 Years | 185 (6.8%) | 179 (6.1%) |
| 75 to 79 Years | 57 (2.1%) | 79 (2.7%) |
| 80 to 84 Years | 152 (5.6%) | 139 (4.7%) |
| 85 Years and over | 91 (3.3%) | 66 (2.2%) |
| Total | 2,736 (100.0%) | 2,942 (100.0%) |
Families and Households in Weiser
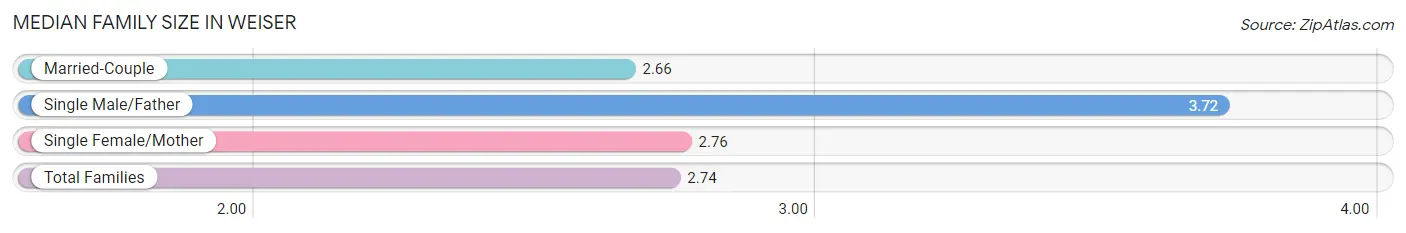
Median Family Size in Weiser
The median family size in Weiser is 2.74 persons per family, with single male/father families (68 | 4.3%) accounting for the largest median family size of 3.72 persons per family. On the other hand, married-couple families (959 | 61.4%) represent the smallest median family size with 2.66 persons per family.
| Family Type | # Families | Family Size |
| Married-Couple | 959 (61.4%) | 2.66 |
| Single Male/Father | 68 (4.3%) | 3.72 |
| Single Female/Mother | 535 (34.3%) | 2.76 |
| Total Families | 1,562 (100.0%) | 2.74 |
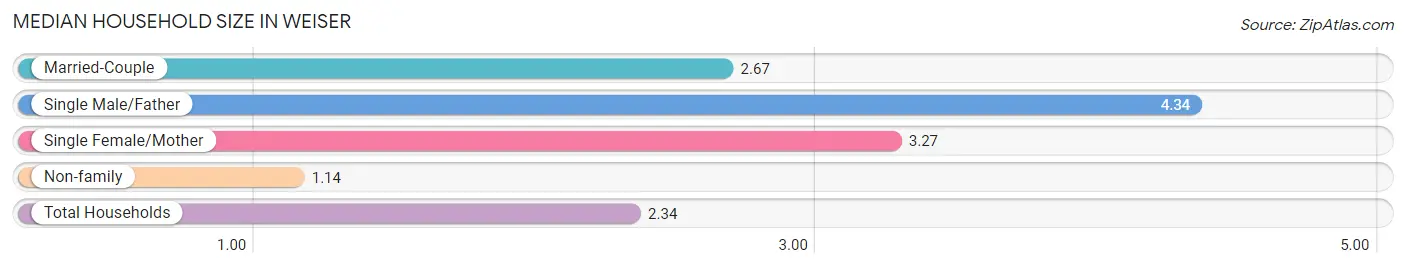
Median Household Size in Weiser
The median household size in Weiser is 2.34 persons per household, with single male/father households (68 | 2.9%) accounting for the largest median household size of 4.34 persons per household. non-family households (790 | 33.6%) represent the smallest median household size with 1.14 persons per household.
| Household Type | # Households | Household Size |
| Married-Couple | 959 (40.8%) | 2.67 |
| Single Male/Father | 68 (2.9%) | 4.34 |
| Single Female/Mother | 535 (22.8%) | 3.27 |
| Non-family | 790 (33.6%) | 1.14 |
| Total Households | 2,352 (100.0%) | 2.34 |
Household Size by Marriage Status in Weiser
Out of a total of 2,352 households in Weiser, 1,562 (66.4%) are family households, while 790 (33.6%) are nonfamily households. The most numerous type of family households are 2-person households, comprising 804, and the most common type of nonfamily households are 1-person households, comprising 700.
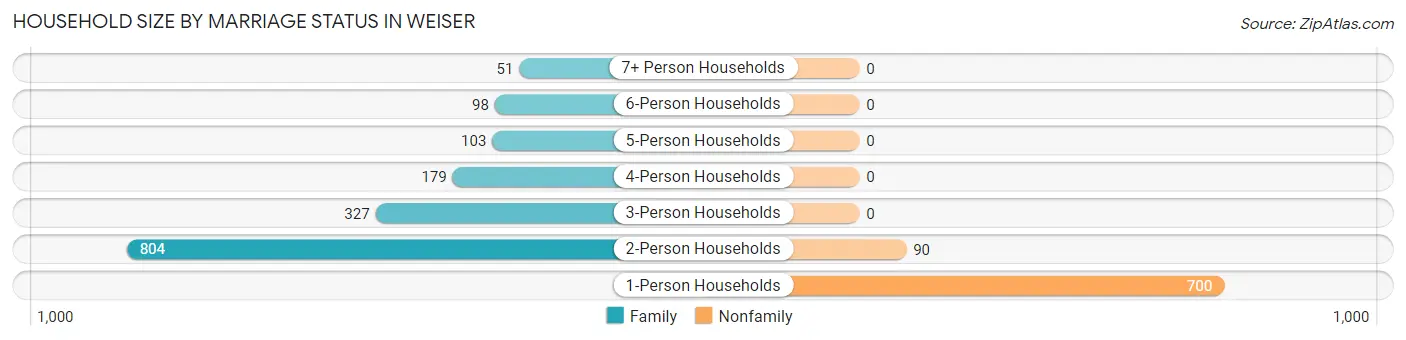
| Household Size | Family Households | Nonfamily Households |
| 1-Person Households | - | 700 (29.8%) |
| 2-Person Households | 804 (34.2%) | 90 (3.8%) |
| 3-Person Households | 327 (13.9%) | 0 (0.0%) |
| 4-Person Households | 179 (7.6%) | 0 (0.0%) |
| 5-Person Households | 103 (4.4%) | 0 (0.0%) |
| 6-Person Households | 98 (4.2%) | 0 (0.0%) |
| 7+ Person Households | 51 (2.2%) | 0 (0.0%) |
| Total | 1,562 (66.4%) | 790 (33.6%) |
Female Fertility in Weiser
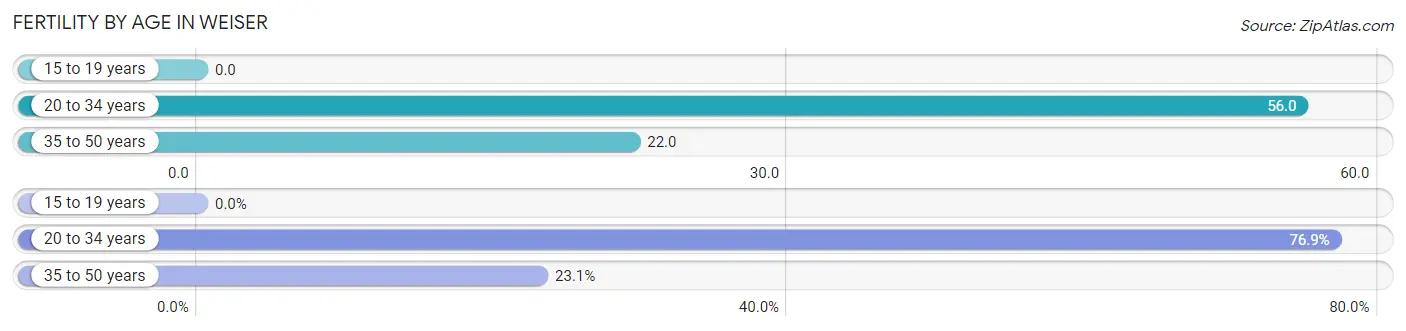
Fertility by Age in Weiser
Average fertility rate in Weiser is 34.0 births per 1,000 women. Women in the age bracket of 20 to 34 years have the highest fertility rate with 56.0 births per 1,000 women. Women in the age bracket of 20 to 34 years acount for 76.9% of all women with births.
| Age Bracket | Women with Births | Births / 1,000 Women |
| 15 to 19 years | 0 (0.0%) | 0.0 |
| 20 to 34 years | 30 (76.9%) | 56.0 |
| 35 to 50 years | 9 (23.1%) | 22.0 |
| Total | 39 (100.0%) | 34.0 |
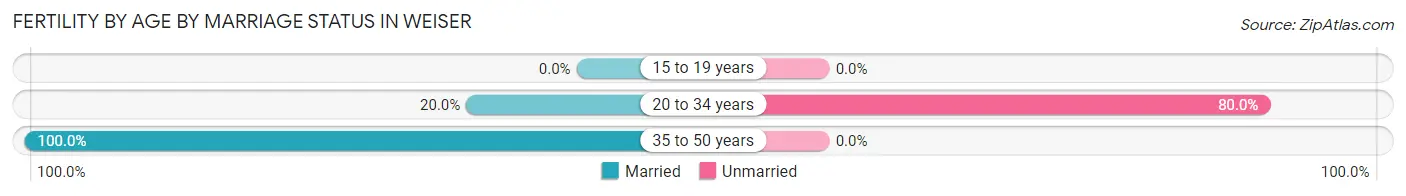
Fertility by Age by Marriage Status in Weiser
38.5% of women with births (39) in Weiser are married. The highest percentage of unmarried women with births falls into 20 to 34 years age bracket with 80.0% of them unmarried at the time of birth, while the lowest percentage of unmarried women with births belong to 35 to 50 years age bracket with 0.0% of them unmarried.
| Age Bracket | Married | Unmarried |
| 15 to 19 years | 0 (0.0%) | 0 (0.0%) |
| 20 to 34 years | 6 (20.0%) | 24 (80.0%) |
| 35 to 50 years | 9 (100.0%) | 0 (0.0%) |
| Total | 15 (38.5%) | 24 (61.5%) |
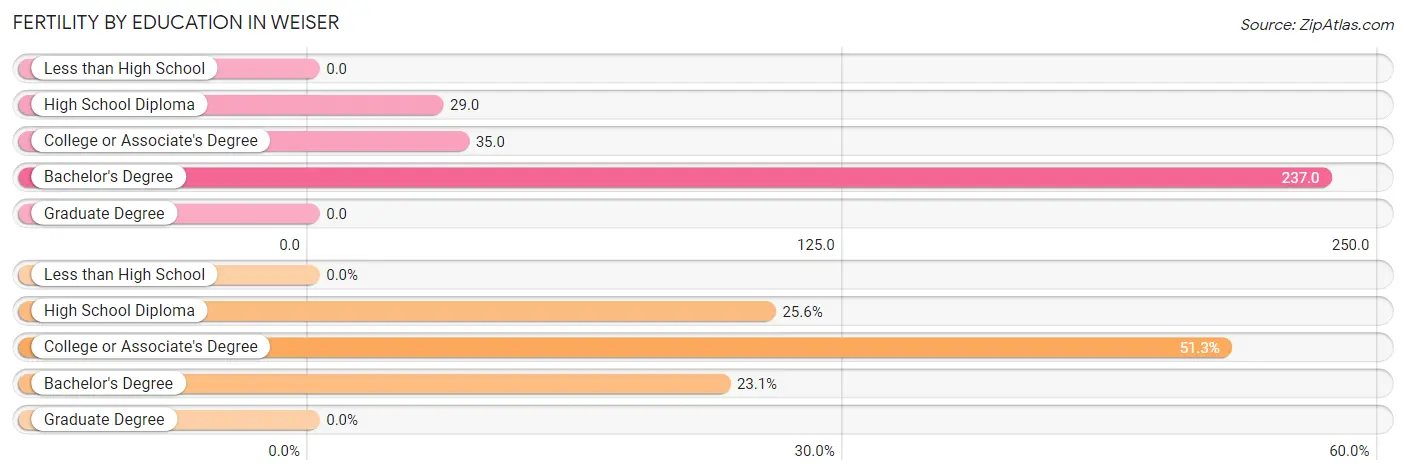
Fertility by Education in Weiser
| Educational Attainment | Women with Births | Births / 1,000 Women |
| Less than High School | 0 (0.0%) | 0.0 |
| High School Diploma | 10 (25.6%) | 29.0 |
| College or Associate's Degree | 20 (51.3%) | 35.0 |
| Bachelor's Degree | 9 (23.1%) | 237.0 |
| Graduate Degree | 0 (0.0%) | 0.0 |
| Total | 39 (100.0%) | 34.0 |
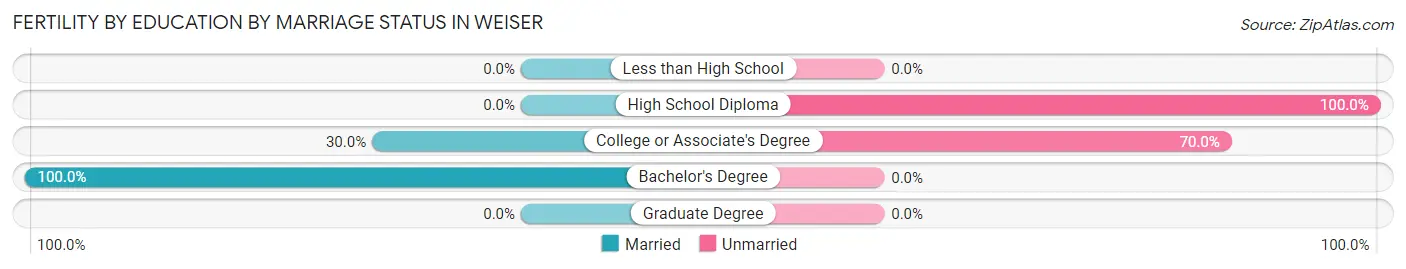
Fertility by Education by Marriage Status in Weiser
61.5% of women with births in Weiser are unmarried. Women with the educational attainment of bachelor's degree are most likely to be married with 100.0% of them married at childbirth, while women with the educational attainment of high school diploma are least likely to be married with 100.0% of them unmarried at childbirth.
| Educational Attainment | Married | Unmarried |
| Less than High School | 0 (0.0%) | 0 (0.0%) |
| High School Diploma | 0 (0.0%) | 10 (100.0%) |
| College or Associate's Degree | 6 (30.0%) | 14 (70.0%) |
| Bachelor's Degree | 9 (100.0%) | 0 (0.0%) |
| Graduate Degree | 0 (0.0%) | 0 (0.0%) |
| Total | 15 (38.5%) | 24 (61.5%) |
Income in Weiser
Income Overview in Weiser
Per Capita Income in Weiser is $23,799, while median incomes of families and households are $48,646 and $41,491 respectively.
| Characteristic | Number | Measure |
| Per Capita Income | 5,678 | $23,799 |
| Median Family Income | 1,562 | $48,646 |
| Mean Family Income | 1,562 | $61,418 |
| Median Household Income | 2,352 | $41,491 |
| Mean Household Income | 2,352 | $54,397 |
| Income Deficit | 1,562 | $0 |
| Wage / Income Gap (%) | 5,678 | 54.43% |
| Wage / Income Gap ($) | 5,678 | 45.57¢ per $1 |
| Gini / Inequality Index | 5,678 | 0.45 |
Earnings by Sex in Weiser
Average Earnings in Weiser are $29,726, $40,865 for men and $18,621 for women, a difference of 54.4%.
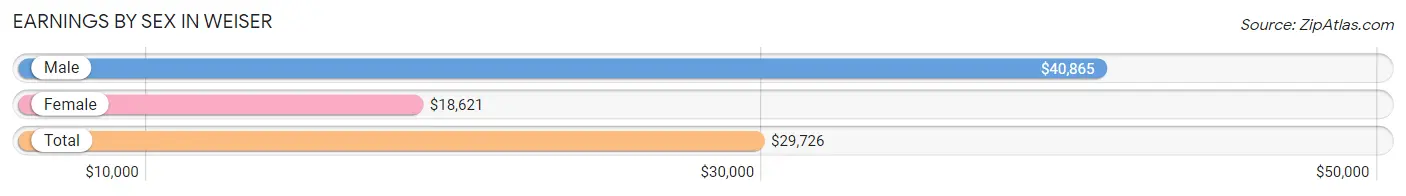
| Sex | Number | Average Earnings |
| Male | 1,316 (56.1%) | $40,865 |
| Female | 1,028 (43.9%) | $18,621 |
| Total | 2,344 (100.0%) | $29,726 |
Earnings by Sex by Income Bracket in Weiser
The most common earnings brackets in Weiser are $100,000+ for men (165 | 12.5%) and $25,000 to $29,999 for women (167 | 16.3%).
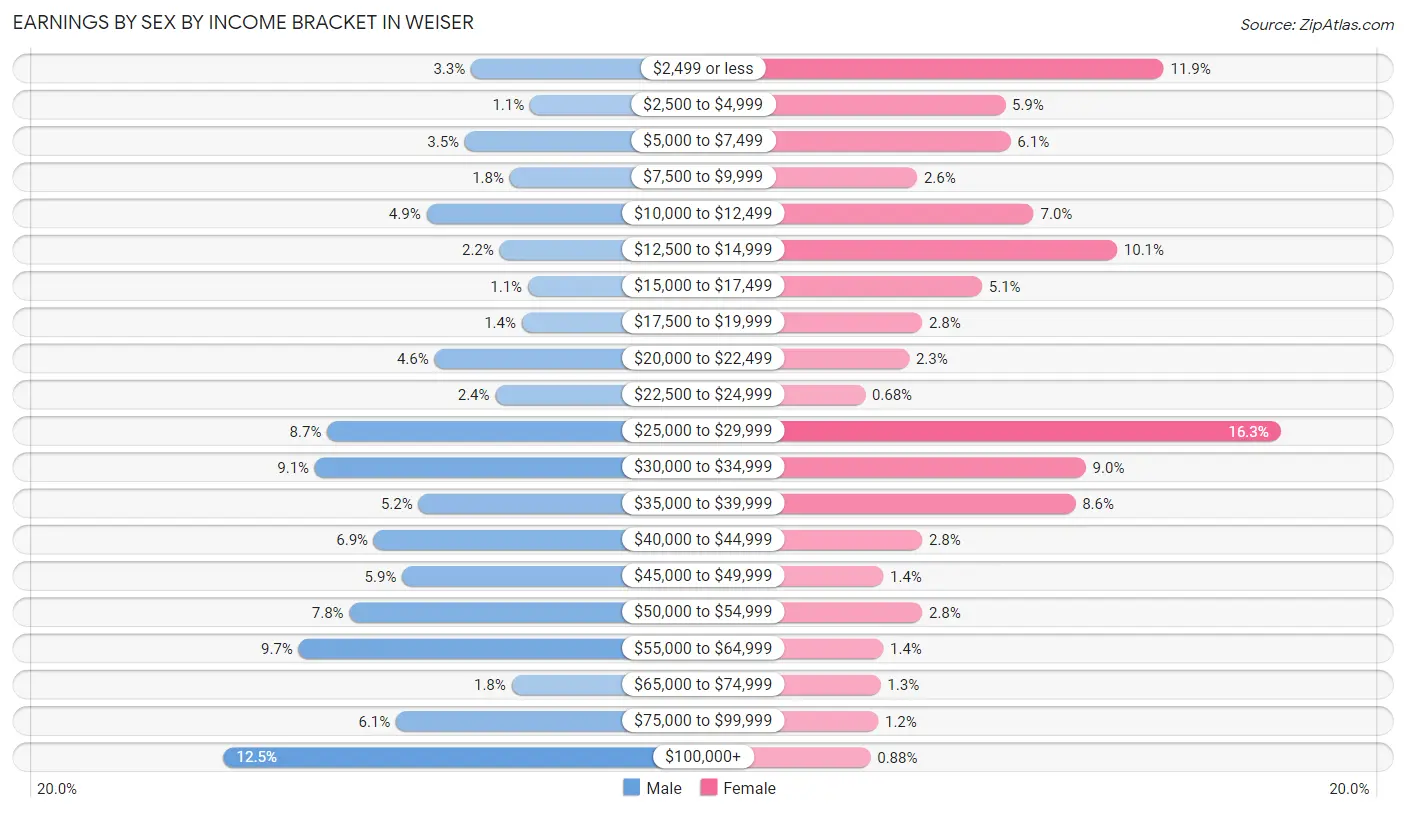
| Income | Male | Female |
| $2,499 or less | 43 (3.3%) | 122 (11.9%) |
| $2,500 to $4,999 | 14 (1.1%) | 61 (5.9%) |
| $5,000 to $7,499 | 46 (3.5%) | 63 (6.1%) |
| $7,500 to $9,999 | 24 (1.8%) | 27 (2.6%) |
| $10,000 to $12,499 | 65 (4.9%) | 72 (7.0%) |
| $12,500 to $14,999 | 29 (2.2%) | 104 (10.1%) |
| $15,000 to $17,499 | 15 (1.1%) | 52 (5.1%) |
| $17,500 to $19,999 | 18 (1.4%) | 29 (2.8%) |
| $20,000 to $22,499 | 61 (4.6%) | 24 (2.3%) |
| $22,500 to $24,999 | 31 (2.4%) | 7 (0.7%) |
| $25,000 to $29,999 | 114 (8.7%) | 167 (16.3%) |
| $30,000 to $34,999 | 120 (9.1%) | 92 (8.9%) |
| $35,000 to $39,999 | 69 (5.2%) | 88 (8.6%) |
| $40,000 to $44,999 | 91 (6.9%) | 29 (2.8%) |
| $45,000 to $49,999 | 77 (5.9%) | 14 (1.4%) |
| $50,000 to $54,999 | 103 (7.8%) | 29 (2.8%) |
| $55,000 to $64,999 | 128 (9.7%) | 14 (1.4%) |
| $65,000 to $74,999 | 23 (1.8%) | 13 (1.3%) |
| $75,000 to $99,999 | 80 (6.1%) | 12 (1.2%) |
| $100,000+ | 165 (12.5%) | 9 (0.9%) |
| Total | 1,316 (100.0%) | 1,028 (100.0%) |
Earnings by Sex by Educational Attainment in Weiser
Average earnings in Weiser are $44,394 for men and $19,957 for women, a difference of 55.0%. Men with an educational attainment of graduate degree enjoy the highest average annual earnings of $51,025, while those with less than high school education earn the least with $27,829. Women with an educational attainment of college or associate's degree earn the most with the average annual earnings of $26,942, while those with high school diploma education have the smallest earnings of $13,276.
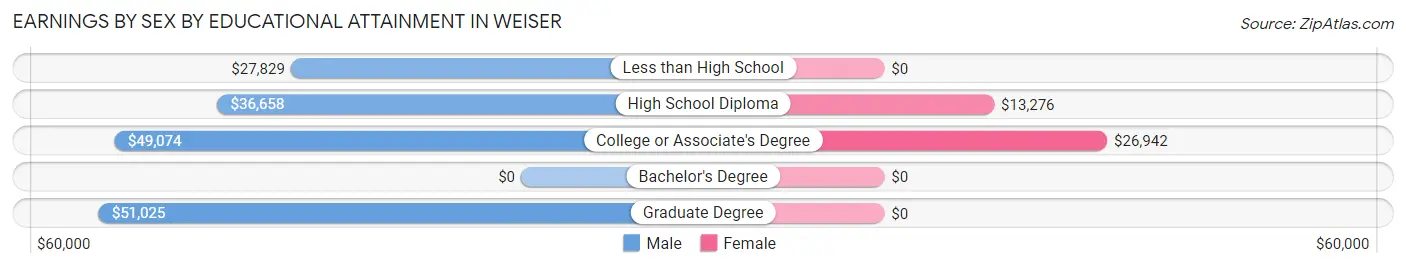
| Educational Attainment | Male Income | Female Income |
| Less than High School | $27,829 | $0 |
| High School Diploma | $36,658 | $13,276 |
| College or Associate's Degree | $49,074 | $26,942 |
| Bachelor's Degree | - | - |
| Graduate Degree | $51,025 | $0 |
| Total | $44,394 | $19,957 |
Family Income in Weiser
Family Income Brackets in Weiser
According to the Weiser family income data, there are 394 families falling into the $50,000 to $74,999 income range, which is the most common income bracket and makes up 25.2% of all families. Conversely, the $10,000 to $14,999 income bracket is the least frequent group with only 36 families (2.3%) belonging to this category.
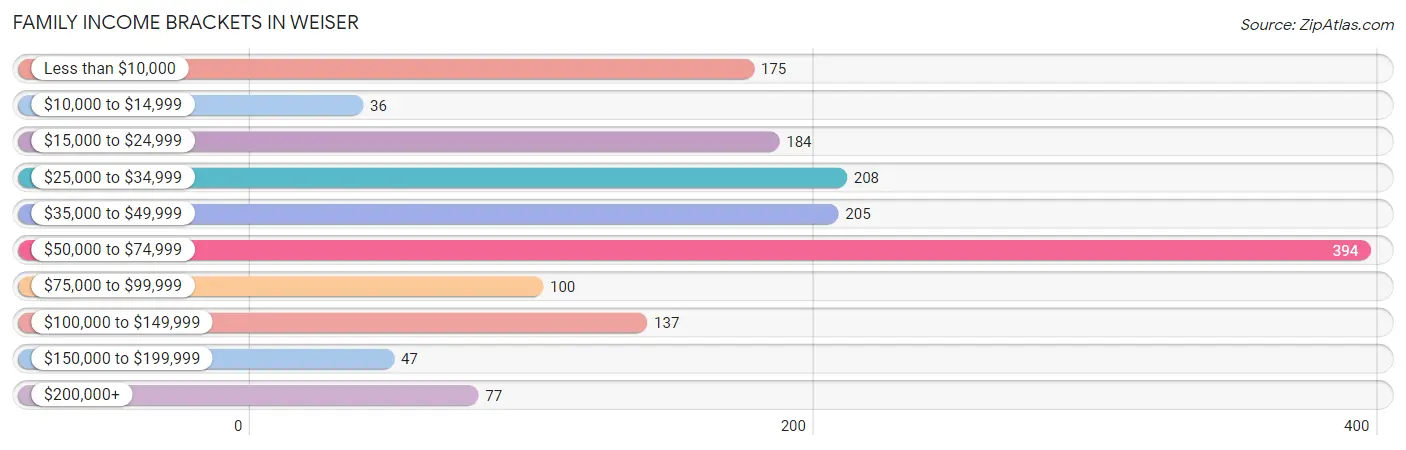
| Income Bracket | # Families | % Families |
| Less than $10,000 | 175 | 11.2% |
| $10,000 to $14,999 | 36 | 2.3% |
| $15,000 to $24,999 | 184 | 11.8% |
| $25,000 to $34,999 | 208 | 13.3% |
| $35,000 to $49,999 | 205 | 13.1% |
| $50,000 to $74,999 | 394 | 25.2% |
| $75,000 to $99,999 | 100 | 6.4% |
| $100,000 to $149,999 | 137 | 8.8% |
| $150,000 to $199,999 | 47 | 3.0% |
| $200,000+ | 77 | 4.9% |
Family Income by Famaliy Size in Weiser
6-person families (98 | 6.3%) account for the highest median family income in Weiser with $66,518 per family, while 2-person families (876 | 56.1%) have the highest median income of $20,028 per family member.
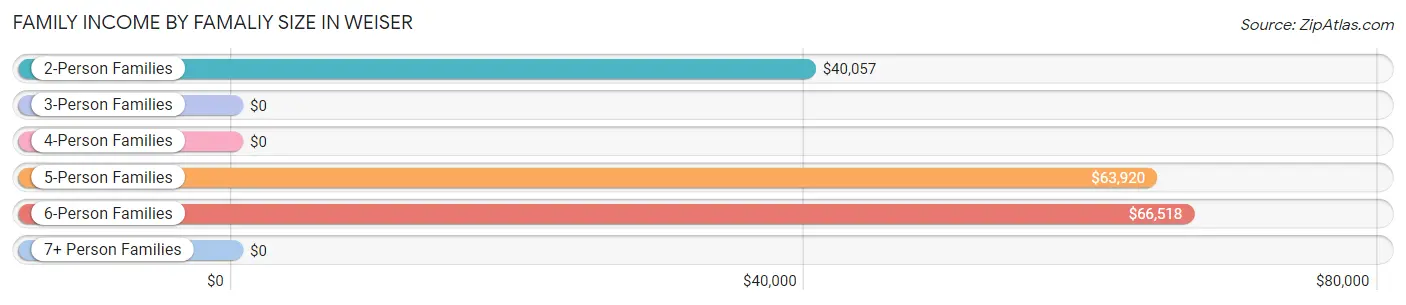
| Income Bracket | # Families | Median Income |
| 2-Person Families | 876 (56.1%) | $40,057 |
| 3-Person Families | 307 (19.7%) | $0 |
| 4-Person Families | 152 (9.7%) | $0 |
| 5-Person Families | 106 (6.8%) | $63,920 |
| 6-Person Families | 98 (6.3%) | $66,518 |
| 7+ Person Families | 23 (1.5%) | $0 |
| Total | 1,562 (100.0%) | $48,646 |
Family Income by Number of Earners in Weiser
The median family income in Weiser is $48,646, with families comprising 3+ earners (83) having the highest median family income of $148,365, while families with no earners (408) have the lowest median family income of $26,161, accounting for 5.3% and 26.1% of families, respectively.
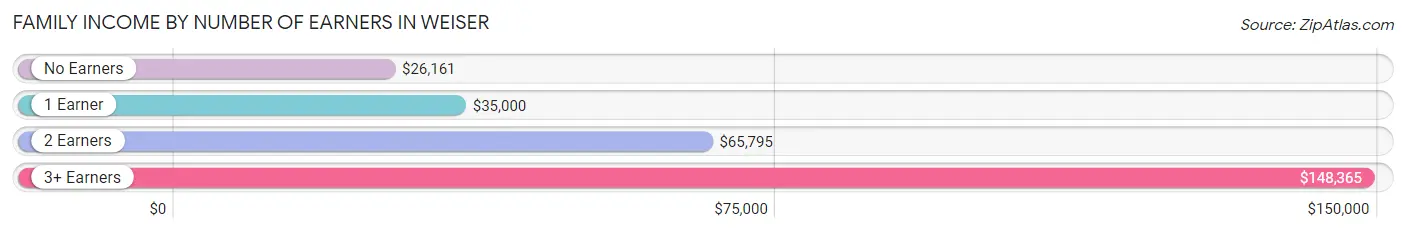
| Number of Earners | # Families | Median Income |
| No Earners | 408 (26.1%) | $26,161 |
| 1 Earner | 686 (43.9%) | $35,000 |
| 2 Earners | 385 (24.6%) | $65,795 |
| 3+ Earners | 83 (5.3%) | $148,365 |
| Total | 1,562 (100.0%) | $48,646 |
Household Income in Weiser
Household Income Brackets in Weiser
With 515 households falling in the category, the $50,000 to $74,999 income range is the most frequent in Weiser, accounting for 21.9% of all households. In contrast, only 47 households (2.0%) fall into the $150,000 to $199,999 income bracket, making it the least populous group.
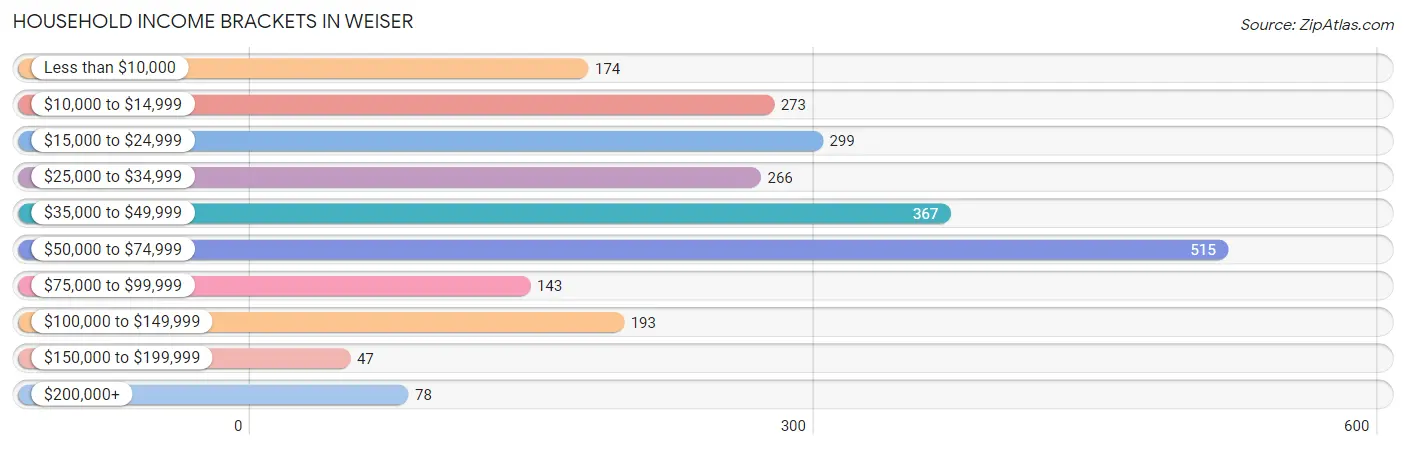
| Income Bracket | # Households | % Households |
| Less than $10,000 | 174 | 7.4% |
| $10,000 to $14,999 | 273 | 11.6% |
| $15,000 to $24,999 | 299 | 12.7% |
| $25,000 to $34,999 | 266 | 11.3% |
| $35,000 to $49,999 | 367 | 15.6% |
| $50,000 to $74,999 | 515 | 21.9% |
| $75,000 to $99,999 | 143 | 6.1% |
| $100,000 to $149,999 | 193 | 8.2% |
| $150,000 to $199,999 | 47 | 2.0% |
| $200,000+ | 78 | 3.3% |
Household Income by Householder Age in Weiser
The median household income in Weiser is $41,491, with the highest median household income of $52,212 found in the 25 to 44 years age bracket for the primary householder. A total of 659 households (28.0%) fall into this category. Meanwhile, the 15 to 24 years age bracket for the primary householder has the lowest median household income of $0, with 65 households (2.8%) in this group.
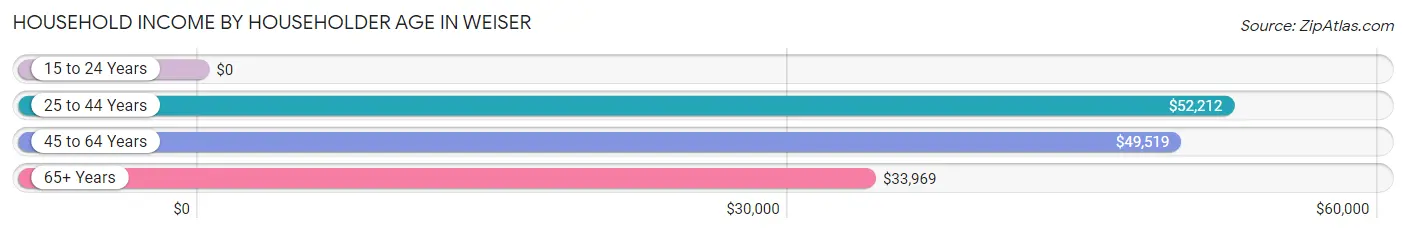
| Income Bracket | # Households | Median Income |
| 15 to 24 Years | 65 (2.8%) | $0 |
| 25 to 44 Years | 659 (28.0%) | $52,212 |
| 45 to 64 Years | 683 (29.0%) | $49,519 |
| 65+ Years | 945 (40.2%) | $33,969 |
| Total | 2,352 (100.0%) | $41,491 |
Poverty in Weiser
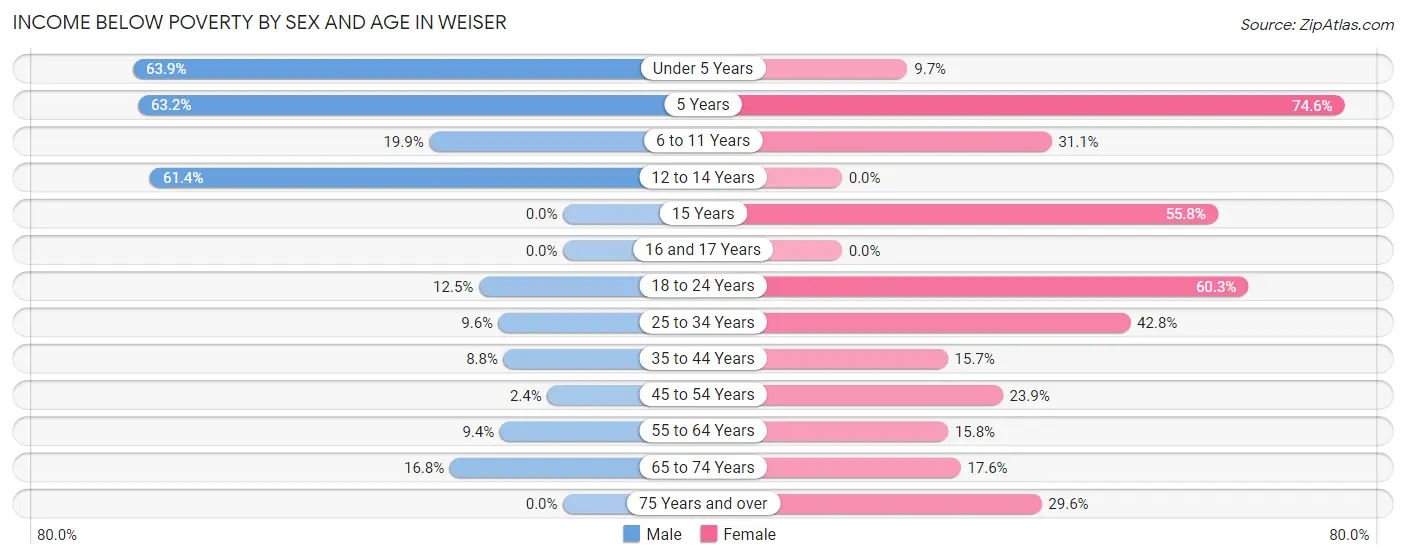
Income Below Poverty by Sex and Age in Weiser
With 14.4% poverty level for males and 27.5% for females among the residents of Weiser, under 5 year old males and 5 year old females are the most vulnerable to poverty, with 92 males (63.9%) and 50 females (74.6%) in their respective age groups living below the poverty level.
| Age Bracket | Male | Female |
| Under 5 Years | 92 (63.9%) | 11 (9.7%) |
| 5 Years | 12 (63.2%) | 50 (74.6%) |
| 6 to 11 Years | 68 (19.9%) | 66 (31.1%) |
| 12 to 14 Years | 27 (61.4%) | 0 (0.0%) |
| 15 Years | 0 (0.0%) | 24 (55.8%) |
| 16 and 17 Years | 0 (0.0%) | 0 (0.0%) |
| 18 to 24 Years | 21 (12.5%) | 175 (60.3%) |
| 25 to 34 Years | 33 (9.6%) | 146 (42.8%) |
| 35 to 44 Years | 32 (8.8%) | 36 (15.7%) |
| 45 to 54 Years | 5 (2.4%) | 68 (23.9%) |
| 55 to 64 Years | 22 (9.4%) | 61 (15.8%) |
| 65 to 74 Years | 70 (16.8%) | 77 (17.6%) |
| 75 Years and over | 0 (0.0%) | 75 (29.6%) |
| Total | 382 (14.4%) | 789 (27.5%) |
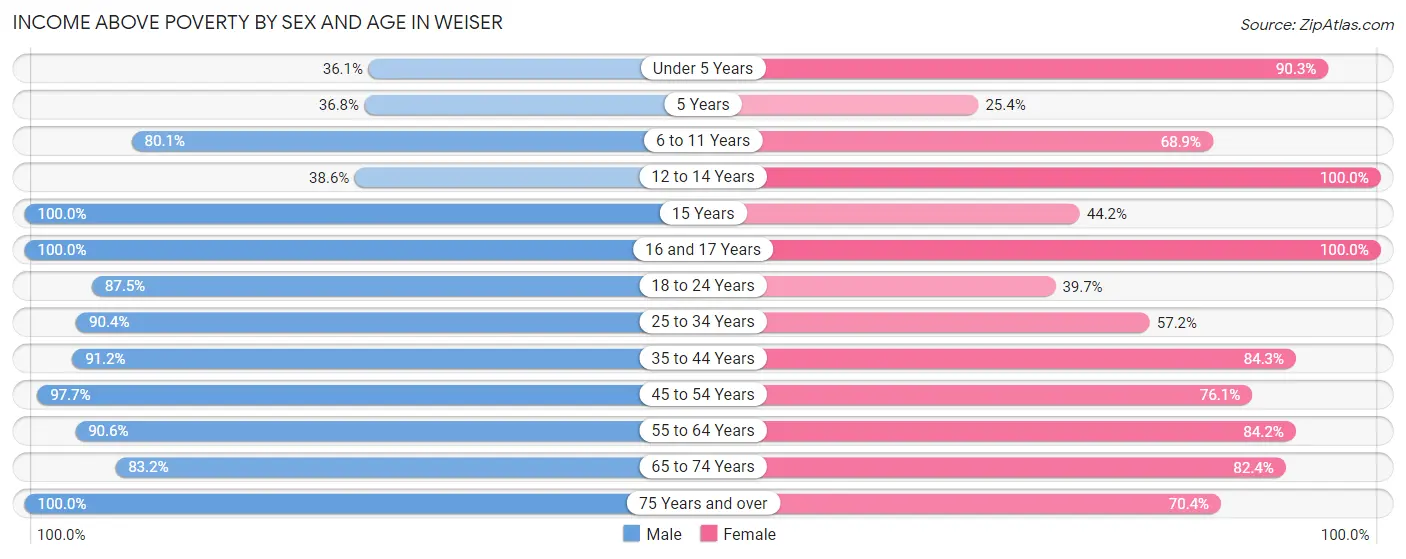
Income Above Poverty by Sex and Age in Weiser
According to the poverty statistics in Weiser, males aged 15 years and females aged 12 to 14 years are the age groups that are most secure financially, with 100.0% of males and 100.0% of females in these age groups living above the poverty line.
| Age Bracket | Male | Female |
| Under 5 Years | 52 (36.1%) | 102 (90.3%) |
| 5 Years | 7 (36.8%) | 17 (25.4%) |
| 6 to 11 Years | 274 (80.1%) | 146 (68.9%) |
| 12 to 14 Years | 17 (38.6%) | 154 (100.0%) |
| 15 Years | 22 (100.0%) | 19 (44.2%) |
| 16 and 17 Years | 52 (100.0%) | 57 (100.0%) |
| 18 to 24 Years | 147 (87.5%) | 115 (39.7%) |
| 25 to 34 Years | 312 (90.4%) | 195 (57.2%) |
| 35 to 44 Years | 330 (91.2%) | 193 (84.3%) |
| 45 to 54 Years | 208 (97.7%) | 217 (76.1%) |
| 55 to 64 Years | 212 (90.6%) | 326 (84.2%) |
| 65 to 74 Years | 346 (83.2%) | 360 (82.4%) |
| 75 Years and over | 300 (100.0%) | 178 (70.4%) |
| Total | 2,279 (85.6%) | 2,079 (72.5%) |
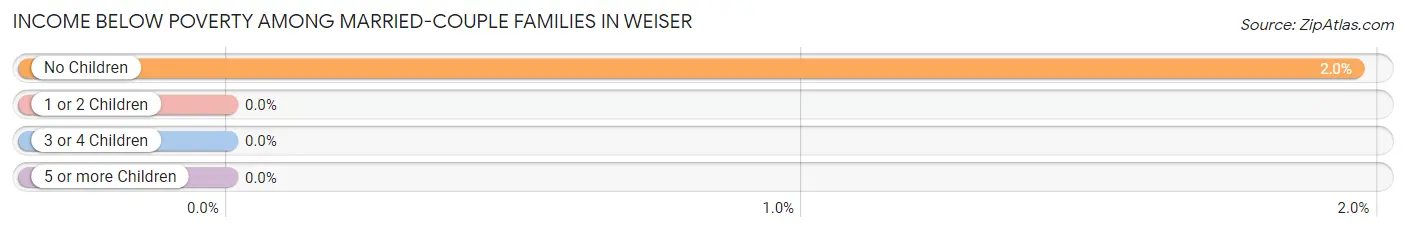
Income Below Poverty Among Married-Couple Families in Weiser
The poverty statistics for married-couple families in Weiser show that 1.4% or 13 of the total 959 families live below the poverty line. Families with no children have the highest poverty rate of 2.0%, comprising of 13 families. On the other hand, families with 1 or 2 children have the lowest poverty rate of 0.0%, which includes 0 families.
| Children | Above Poverty | Below Poverty |
| No Children | 649 (98.0%) | 13 (2.0%) |
| 1 or 2 Children | 141 (100.0%) | 0 (0.0%) |
| 3 or 4 Children | 151 (100.0%) | 0 (0.0%) |
| 5 or more Children | 5 (100.0%) | 0 (0.0%) |
| Total | 946 (98.6%) | 13 (1.4%) |
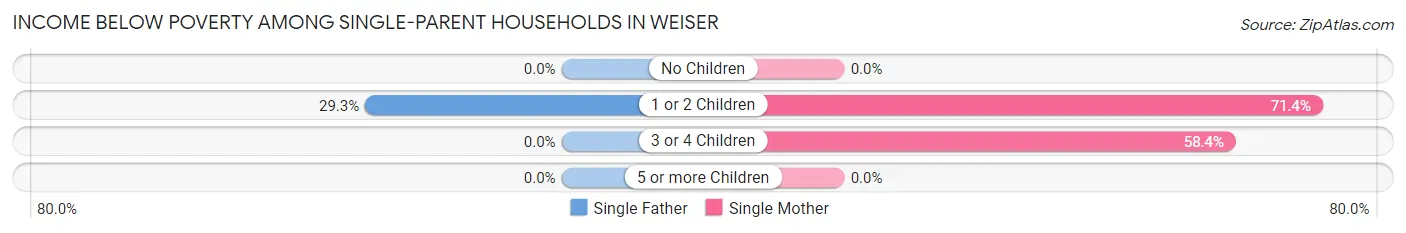
Income Below Poverty Among Single-Parent Households in Weiser
According to the poverty data in Weiser, 17.6% or 12 single-father households and 54.0% or 289 single-mother households are living below the poverty line. Among single-father households, those with 1 or 2 children have the highest poverty rate, with 12 households (29.3%) experiencing poverty. Likewise, among single-mother households, those with 1 or 2 children have the highest poverty rate, with 237 households (71.4%) falling below the poverty line.
| Children | Single Father | Single Mother |
| No Children | 0 (0.0%) | 0 (0.0%) |
| 1 or 2 Children | 12 (29.3%) | 237 (71.4%) |
| 3 or 4 Children | 0 (0.0%) | 52 (58.4%) |
| 5 or more Children | 0 (0.0%) | 0 (0.0%) |
| Total | 12 (17.6%) | 289 (54.0%) |
Income Below Poverty Among Married-Couple vs Single-Parent Households in Weiser
The poverty data for Weiser shows that 13 of the married-couple family households (1.4%) and 301 of the single-parent households (49.9%) are living below the poverty level. Within the married-couple family households, those with no children have the highest poverty rate, with 13 households (2.0%) falling below the poverty line. Among the single-parent households, those with 1 or 2 children have the highest poverty rate, with 249 household (66.8%) living below poverty.
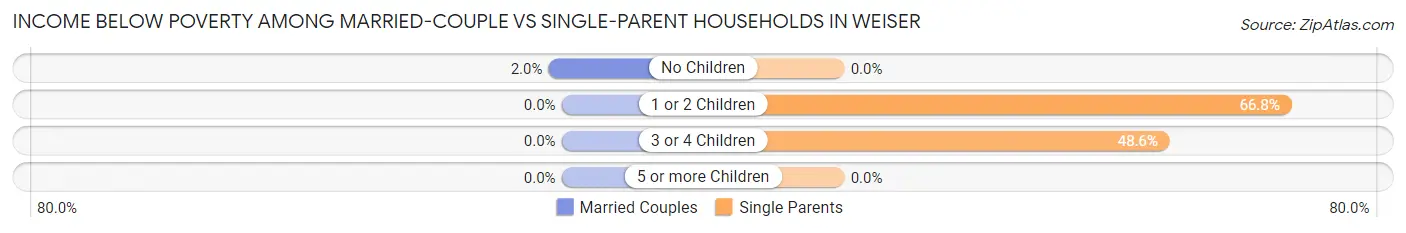
| Children | Married-Couple Families | Single-Parent Households |
| No Children | 13 (2.0%) | 0 (0.0%) |
| 1 or 2 Children | 0 (0.0%) | 249 (66.8%) |
| 3 or 4 Children | 0 (0.0%) | 52 (48.6%) |
| 5 or more Children | 0 (0.0%) | 0 (0.0%) |
| Total | 13 (1.4%) | 301 (49.9%) |
Employment Characteristics in Weiser
Employment by Class of Employer in Weiser
Among the 2,075 employed individuals in Weiser, private company employees (1,298 | 62.5%), local government employees (215 | 10.4%), and self-employed (incorporated) (170 | 8.2%) make up the most common classes of employment.
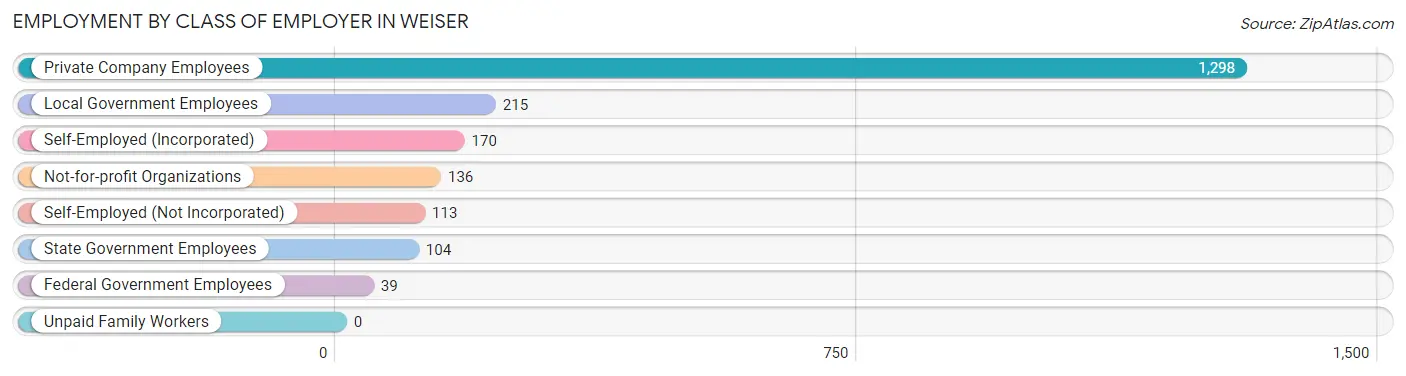
| Employer Class | # Employees | % Employees |
| Private Company Employees | 1,298 | 62.5% |
| Self-Employed (Incorporated) | 170 | 8.2% |
| Self-Employed (Not Incorporated) | 113 | 5.4% |
| Not-for-profit Organizations | 136 | 6.6% |
| Local Government Employees | 215 | 10.4% |
| State Government Employees | 104 | 5.0% |
| Federal Government Employees | 39 | 1.9% |
| Unpaid Family Workers | 0 | 0.0% |
| Total | 2,075 | 100.0% |
Employment Status by Age in Weiser
According to the labor force statistics for Weiser, out of the total population over 16 years of age (4,518), 49.9% or 2,254 individuals are in the labor force, with 5.8% or 131 of them unemployed. The age group with the highest labor force participation rate is 30 to 34 years, with 87.6% or 366 individuals in the labor force. Within the labor force, the 20 to 24 years age range has the highest percentage of unemployed individuals, with 44.3% or 109 of them being unemployed.
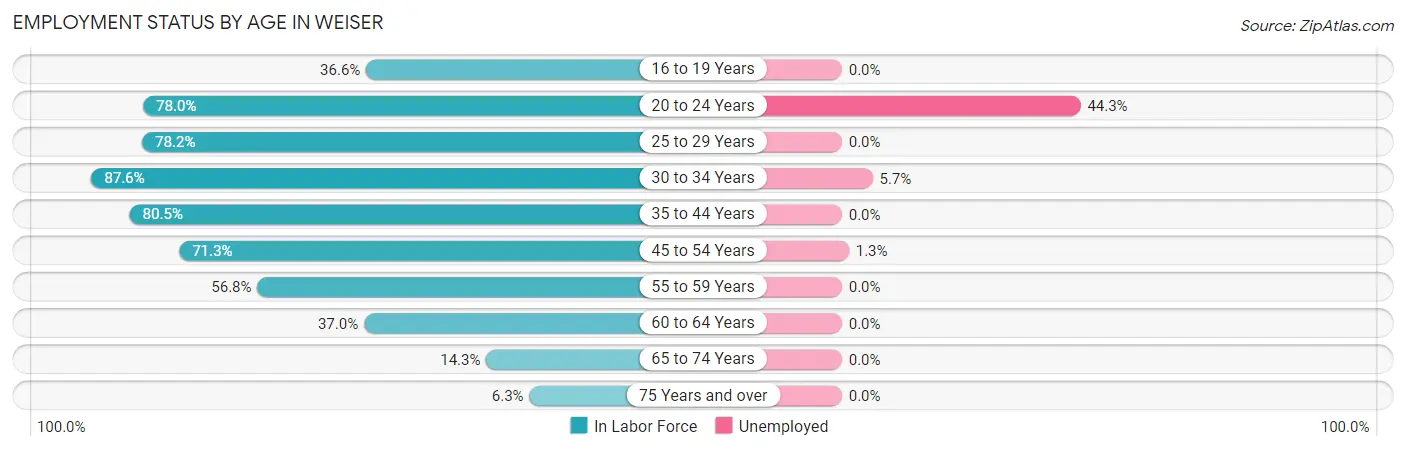
| Age Bracket | In Labor Force | Unemployed |
| 16 to 19 Years | 96 (36.6%) | 0 (0.0%) |
| 20 to 24 Years | 245 (78.0%) | 109 (44.3%) |
| 25 to 29 Years | 219 (78.2%) | 0 (0.0%) |
| 30 to 34 Years | 366 (87.6%) | 21 (5.7%) |
| 35 to 44 Years | 501 (80.5%) | 0 (0.0%) |
| 45 to 54 Years | 371 (71.3%) | 5 (1.3%) |
| 55 to 59 Years | 159 (56.8%) | 0 (0.0%) |
| 60 to 64 Years | 134 (37.0%) | 0 (0.0%) |
| 65 to 74 Years | 125 (14.3%) | 0 (0.0%) |
| 75 Years and over | 37 (6.3%) | 0 (0.0%) |
| Total | 2,254 (49.9%) | 131 (5.8%) |
Employment Status by Educational Attainment in Weiser
According to labor force statistics for Weiser, 70.5% of individuals (1,750) out of the total population between 25 and 64 years of age (2,482) are in the labor force, with 1.5% or 26 of them being unemployed. The group with the highest labor force participation rate are those with the educational attainment of high school diploma, with 72.7% or 651 individuals in the labor force. Within the labor force, individuals with less than high school education have the highest percentage of unemployment, with 15.1% or 21 of them being unemployed.
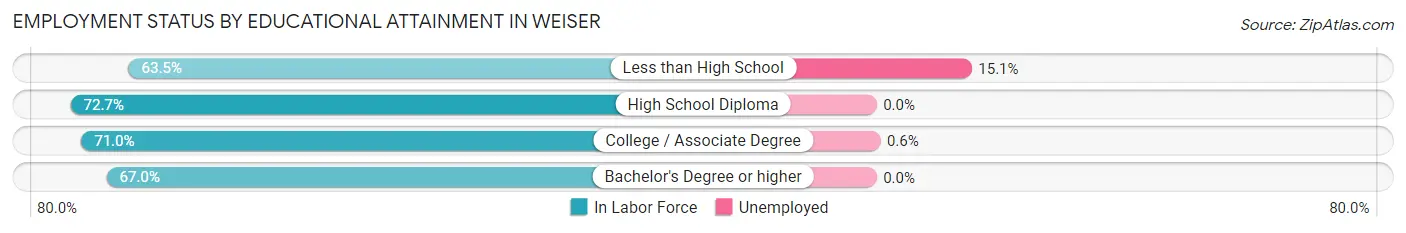
| Educational Attainment | In Labor Force | Unemployed |
| Less than High School | 139 (63.5%) | 33 (15.1%) |
| High School Diploma | 651 (72.7%) | 0 (0.0%) |
| College / Associate Degree | 785 (71.0%) | 7 (0.6%) |
| Bachelor's Degree or higher | 175 (67.0%) | 0 (0.0%) |
| Total | 1,750 (70.5%) | 37 (1.5%) |
Employment Occupations by Sex in Weiser
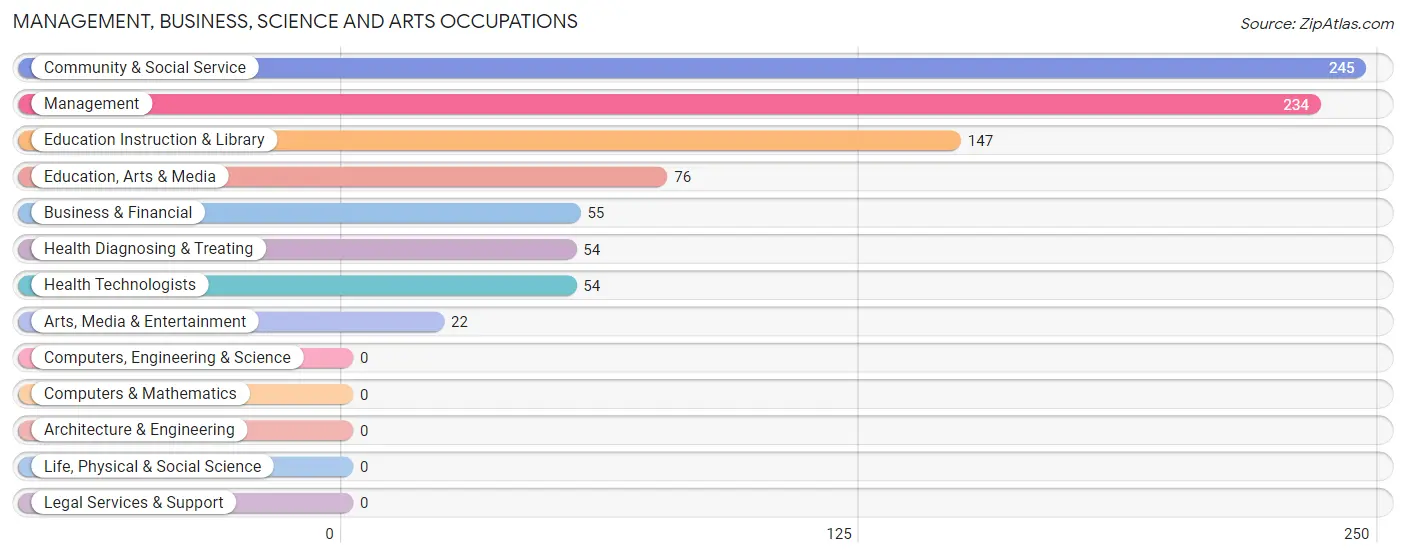
Management, Business, Science and Arts Occupations
The most common Management, Business, Science and Arts occupations in Weiser are Community & Social Service (245 | 11.6%), Management (234 | 11.1%), Education Instruction & Library (147 | 7.0%), Education, Arts & Media (76 | 3.6%), and Business & Financial (55 | 2.6%).
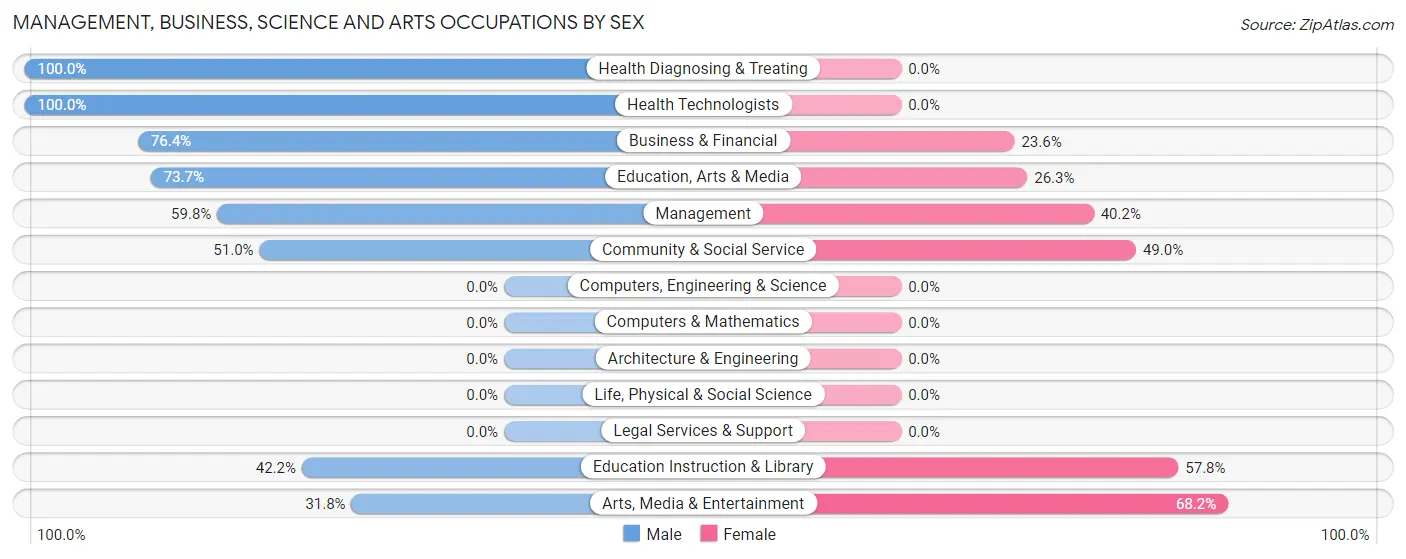
Management, Business, Science and Arts Occupations by Sex
Within the Management, Business, Science and Arts occupations in Weiser, the most male-oriented occupations are Health Diagnosing & Treating (100.0%), Health Technologists (100.0%), and Business & Financial (76.4%), while the most female-oriented occupations are Arts, Media & Entertainment (68.2%), Education Instruction & Library (57.8%), and Community & Social Service (49.0%).
| Occupation | Male | Female |
| Management | 140 (59.8%) | 94 (40.2%) |
| Business & Financial | 42 (76.4%) | 13 (23.6%) |
| Computers, Engineering & Science | 0 (0.0%) | 0 (0.0%) |
| Computers & Mathematics | 0 (0.0%) | 0 (0.0%) |
| Architecture & Engineering | 0 (0.0%) | 0 (0.0%) |
| Life, Physical & Social Science | 0 (0.0%) | 0 (0.0%) |
| Community & Social Service | 125 (51.0%) | 120 (49.0%) |
| Education, Arts & Media | 56 (73.7%) | 20 (26.3%) |
| Legal Services & Support | 0 (0.0%) | 0 (0.0%) |
| Education Instruction & Library | 62 (42.2%) | 85 (57.8%) |
| Arts, Media & Entertainment | 7 (31.8%) | 15 (68.2%) |
| Health Diagnosing & Treating | 54 (100.0%) | 0 (0.0%) |
| Health Technologists | 54 (100.0%) | 0 (0.0%) |
| Total (Category) | 361 (61.4%) | 227 (38.6%) |
| Total (Overall) | 1,195 (56.6%) | 918 (43.4%) |
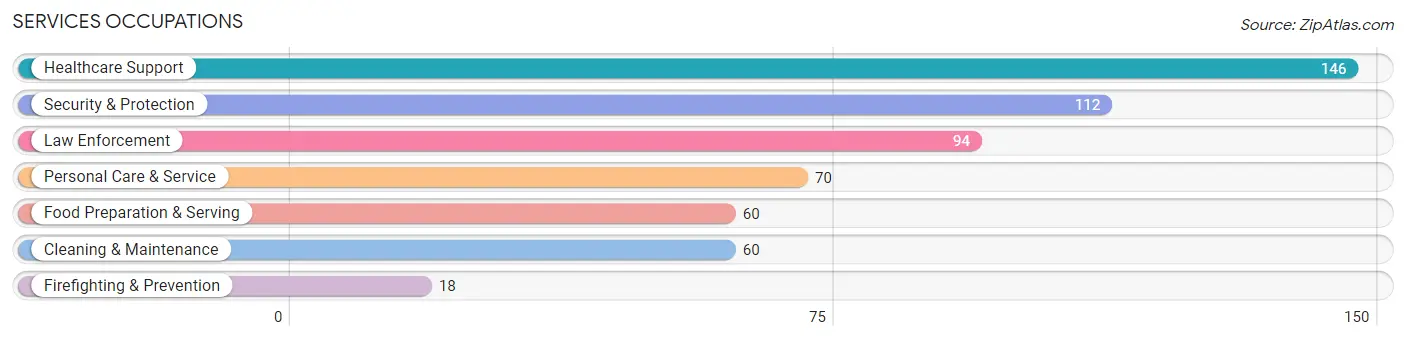
Services Occupations
The most common Services occupations in Weiser are Healthcare Support (146 | 6.9%), Security & Protection (112 | 5.3%), Law Enforcement (94 | 4.4%), Personal Care & Service (70 | 3.3%), and Food Preparation & Serving (60 | 2.8%).
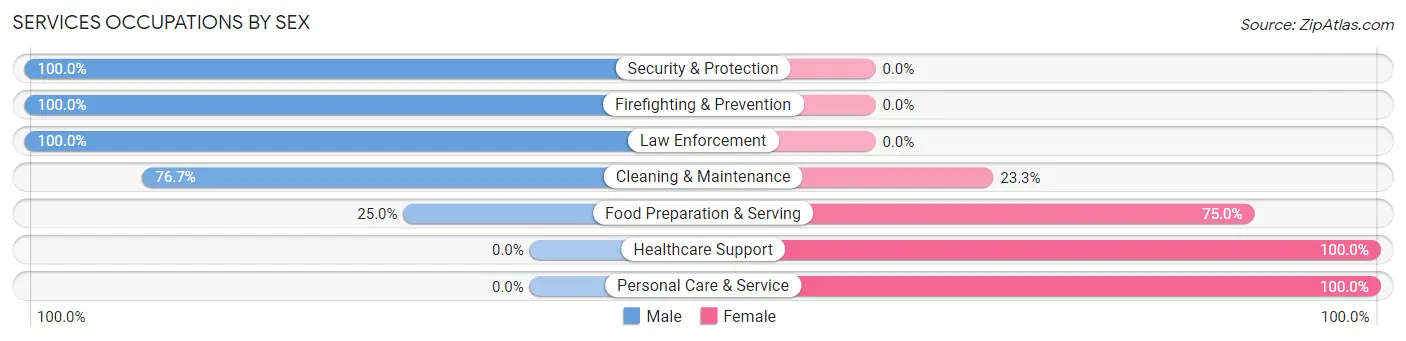
Services Occupations by Sex
Within the Services occupations in Weiser, the most male-oriented occupations are Security & Protection (100.0%), Firefighting & Prevention (100.0%), and Law Enforcement (100.0%), while the most female-oriented occupations are Healthcare Support (100.0%), Personal Care & Service (100.0%), and Food Preparation & Serving (75.0%).
| Occupation | Male | Female |
| Healthcare Support | 0 (0.0%) | 146 (100.0%) |
| Security & Protection | 112 (100.0%) | 0 (0.0%) |
| Firefighting & Prevention | 18 (100.0%) | 0 (0.0%) |
| Law Enforcement | 94 (100.0%) | 0 (0.0%) |
| Food Preparation & Serving | 15 (25.0%) | 45 (75.0%) |
| Cleaning & Maintenance | 46 (76.7%) | 14 (23.3%) |
| Personal Care & Service | 0 (0.0%) | 70 (100.0%) |
| Total (Category) | 173 (38.6%) | 275 (61.4%) |
| Total (Overall) | 1,195 (56.6%) | 918 (43.4%) |
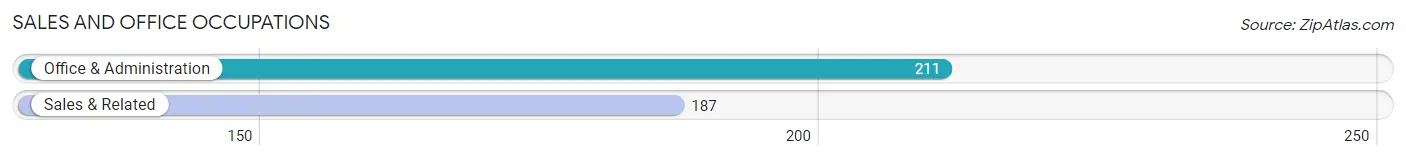
Sales and Office Occupations
The most common Sales and Office occupations in Weiser are Office & Administration (211 | 10.0%), and Sales & Related (187 | 8.8%).
Sales and Office Occupations by Sex
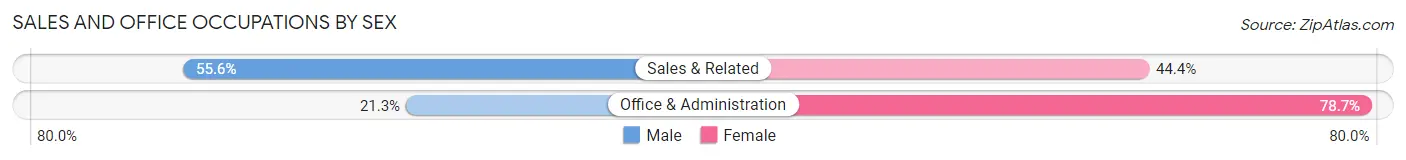
| Occupation | Male | Female |
| Sales & Related | 104 (55.6%) | 83 (44.4%) |
| Office & Administration | 45 (21.3%) | 166 (78.7%) |
| Total (Category) | 149 (37.4%) | 249 (62.6%) |
| Total (Overall) | 1,195 (56.6%) | 918 (43.4%) |
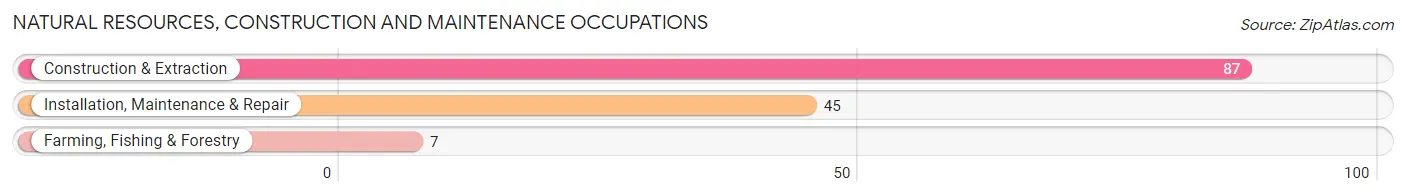
Natural Resources, Construction and Maintenance Occupations
The most common Natural Resources, Construction and Maintenance occupations in Weiser are Construction & Extraction (87 | 4.1%), Installation, Maintenance & Repair (45 | 2.1%), and Farming, Fishing & Forestry (7 | 0.3%).
Natural Resources, Construction and Maintenance Occupations by Sex
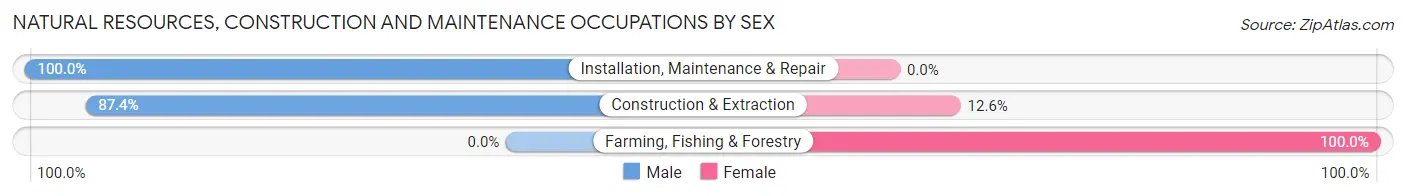
| Occupation | Male | Female |
| Farming, Fishing & Forestry | 0 (0.0%) | 7 (100.0%) |
| Construction & Extraction | 76 (87.4%) | 11 (12.6%) |
| Installation, Maintenance & Repair | 45 (100.0%) | 0 (0.0%) |
| Total (Category) | 121 (87.1%) | 18 (13.0%) |
| Total (Overall) | 1,195 (56.6%) | 918 (43.4%) |
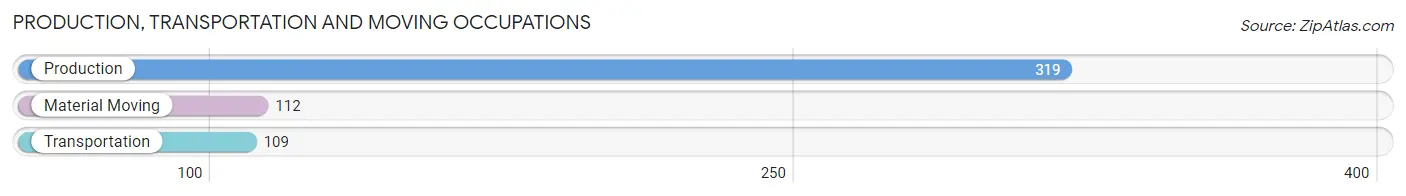
Production, Transportation and Moving Occupations
The most common Production, Transportation and Moving occupations in Weiser are Production (319 | 15.1%), Material Moving (112 | 5.3%), and Transportation (109 | 5.2%).
Production, Transportation and Moving Occupations by Sex
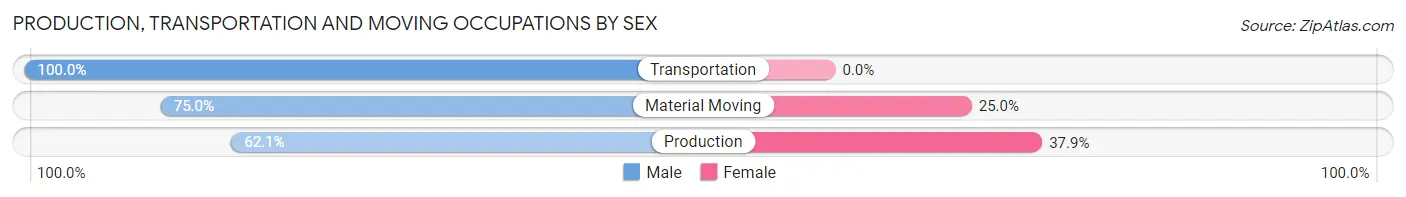
| Occupation | Male | Female |
| Production | 198 (62.1%) | 121 (37.9%) |
| Transportation | 109 (100.0%) | 0 (0.0%) |
| Material Moving | 84 (75.0%) | 28 (25.0%) |
| Total (Category) | 391 (72.4%) | 149 (27.6%) |
| Total (Overall) | 1,195 (56.6%) | 918 (43.4%) |
Employment Industries by Sex in Weiser
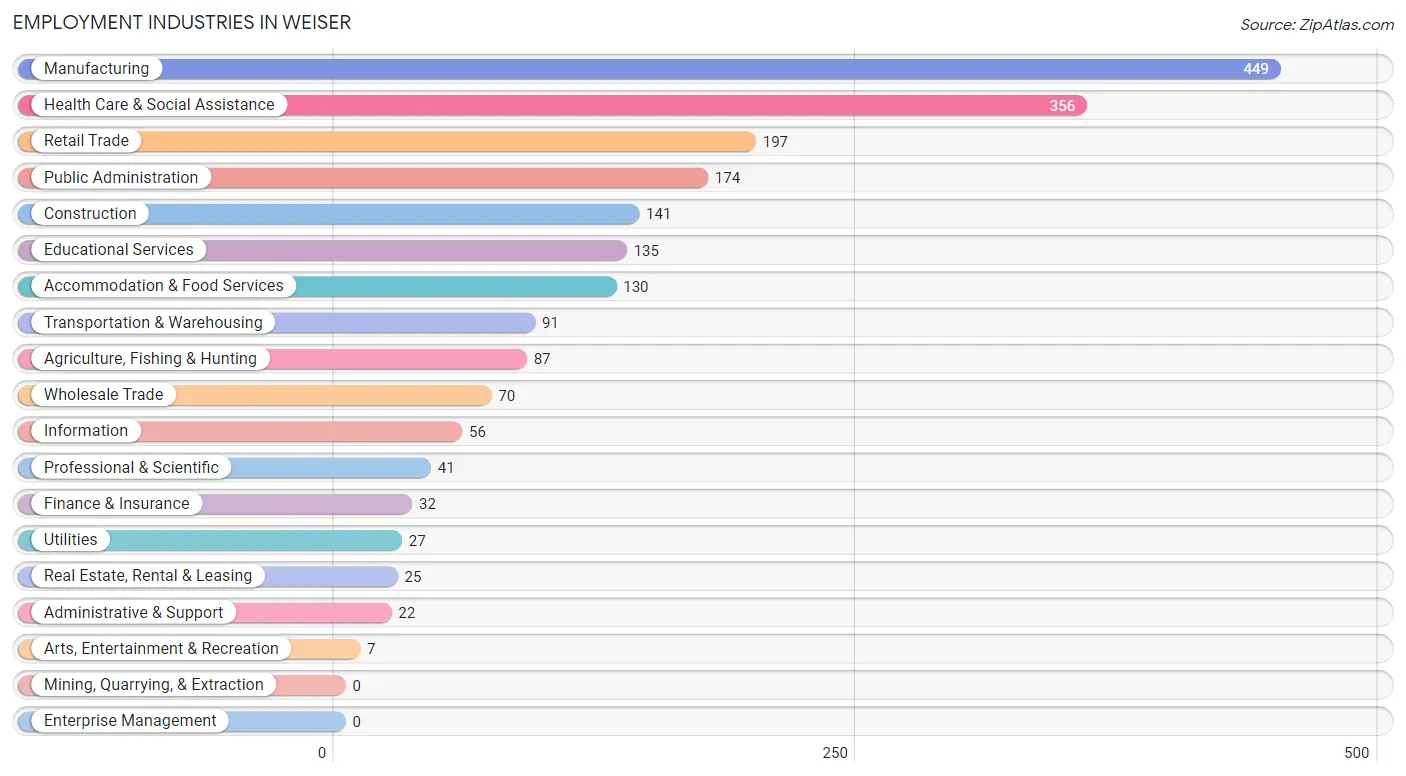
Employment Industries in Weiser
The major employment industries in Weiser include Manufacturing (449 | 21.2%), Health Care & Social Assistance (356 | 16.9%), Retail Trade (197 | 9.3%), Public Administration (174 | 8.2%), and Construction (141 | 6.7%).
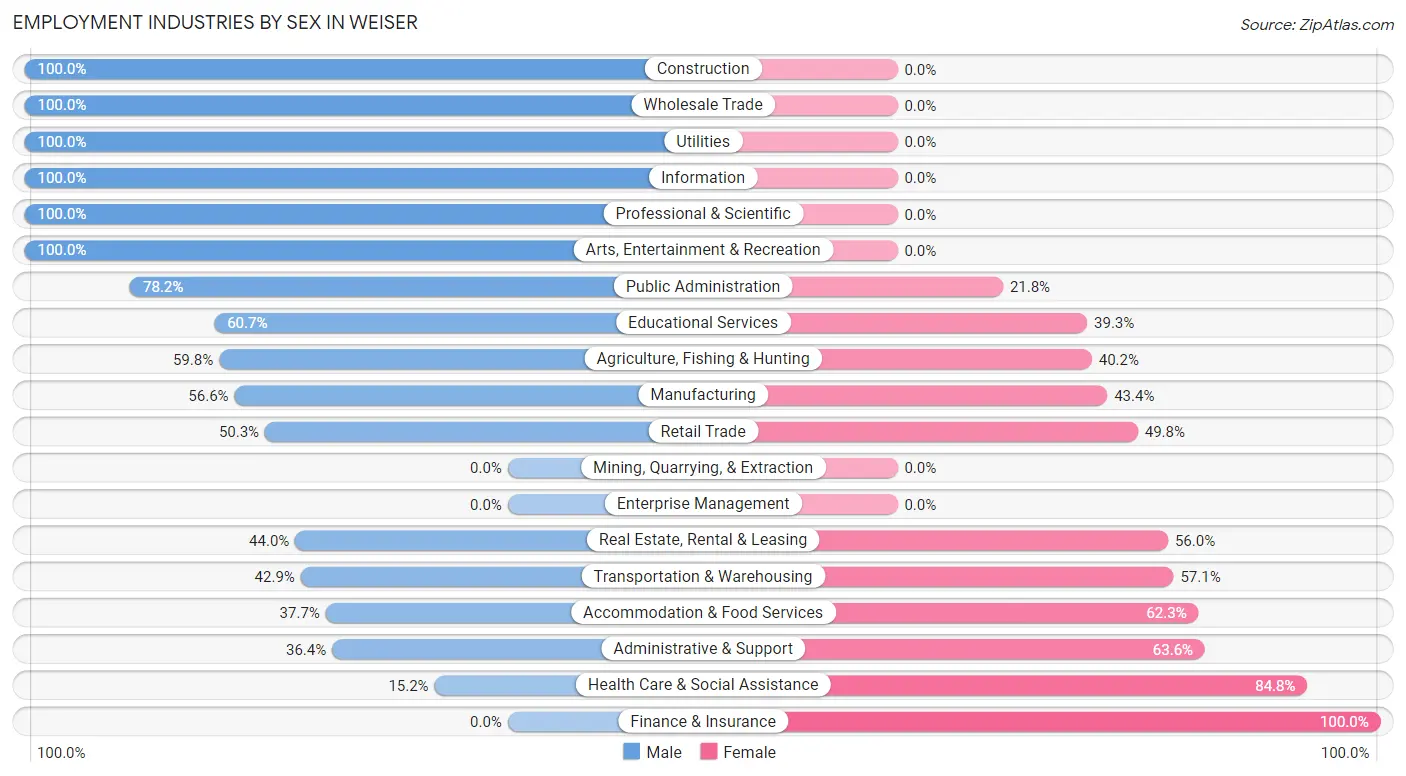
Employment Industries by Sex in Weiser
The Weiser industries that see more men than women are Construction (100.0%), Wholesale Trade (100.0%), and Utilities (100.0%), whereas the industries that tend to have a higher number of women are Finance & Insurance (100.0%), Health Care & Social Assistance (84.8%), and Administrative & Support (63.6%).
| Industry | Male | Female |
| Agriculture, Fishing & Hunting | 52 (59.8%) | 35 (40.2%) |
| Mining, Quarrying, & Extraction | 0 (0.0%) | 0 (0.0%) |
| Construction | 141 (100.0%) | 0 (0.0%) |
| Manufacturing | 254 (56.6%) | 195 (43.4%) |
| Wholesale Trade | 70 (100.0%) | 0 (0.0%) |
| Retail Trade | 99 (50.2%) | 98 (49.7%) |
| Transportation & Warehousing | 39 (42.9%) | 52 (57.1%) |
| Utilities | 27 (100.0%) | 0 (0.0%) |
| Information | 56 (100.0%) | 0 (0.0%) |
| Finance & Insurance | 0 (0.0%) | 32 (100.0%) |
| Real Estate, Rental & Leasing | 11 (44.0%) | 14 (56.0%) |
| Professional & Scientific | 41 (100.0%) | 0 (0.0%) |
| Enterprise Management | 0 (0.0%) | 0 (0.0%) |
| Administrative & Support | 8 (36.4%) | 14 (63.6%) |
| Educational Services | 82 (60.7%) | 53 (39.3%) |
| Health Care & Social Assistance | 54 (15.2%) | 302 (84.8%) |
| Arts, Entertainment & Recreation | 7 (100.0%) | 0 (0.0%) |
| Accommodation & Food Services | 49 (37.7%) | 81 (62.3%) |
| Public Administration | 136 (78.2%) | 38 (21.8%) |
| Total | 1,195 (56.6%) | 918 (43.4%) |
Education in Weiser
School Enrollment in Weiser
The most common levels of schooling among the 1,131 students in Weiser are elementary school (438 | 38.7%), high school (278 | 24.6%), and middle school (222 | 19.6%).
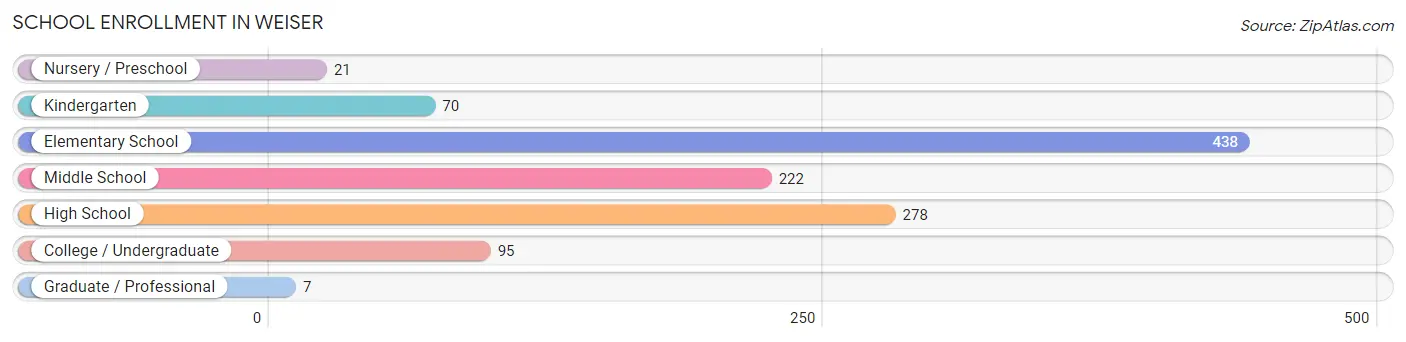
| School Level | # Students | % Students |
| Nursery / Preschool | 21 | 1.9% |
| Kindergarten | 70 | 6.2% |
| Elementary School | 438 | 38.7% |
| Middle School | 222 | 19.6% |
| High School | 278 | 24.6% |
| College / Undergraduate | 95 | 8.4% |
| Graduate / Professional | 7 | 0.6% |
| Total | 1,131 | 100.0% |
School Enrollment by Age by Funding Source in Weiser
Out of a total of 1,131 students who are enrolled in schools in Weiser, 41 (3.6%) attend a private institution, while the remaining 1,090 (96.4%) are enrolled in public schools. The age group of 25 to 34 year olds has the highest likelihood of being enrolled in private schools, with 8 (100.0% in the age bracket) enrolled. Conversely, the age group of 3 to 4 year olds has the lowest likelihood of being enrolled in a private school, with 21 (100.0% in the age bracket) attending a public institution.
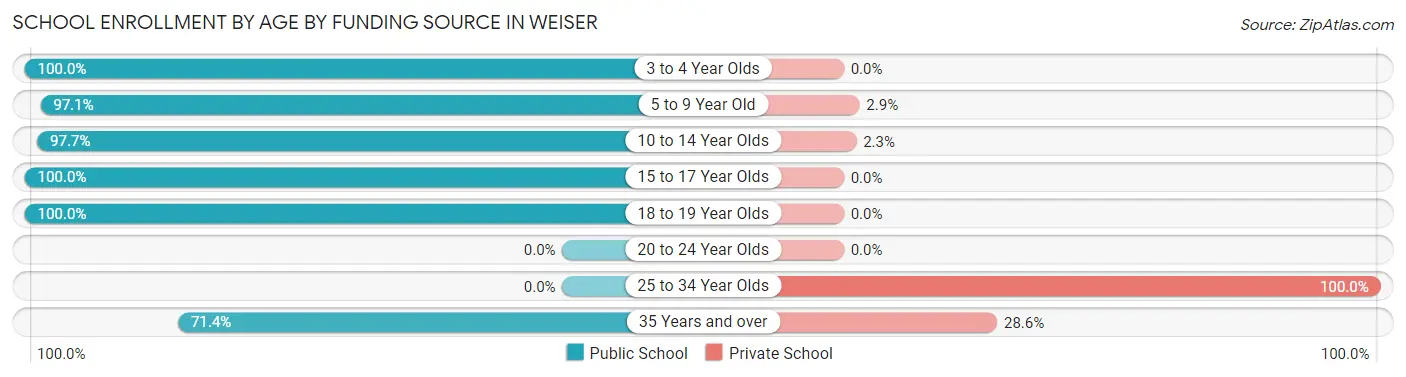
| Age Bracket | Public School | Private School |
| 3 to 4 Year Olds | 21 (100.0%) | 0 (0.0%) |
| 5 to 9 Year Old | 431 (97.1%) | 13 (2.9%) |
| 10 to 14 Year Olds | 334 (97.7%) | 8 (2.3%) |
| 15 to 17 Year Olds | 174 (100.0%) | 0 (0.0%) |
| 18 to 19 Year Olds | 100 (100.0%) | 0 (0.0%) |
| 20 to 24 Year Olds | 0 (0.0%) | 0 (0.0%) |
| 25 to 34 Year Olds | 0 (0.0%) | 8 (100.0%) |
| 35 Years and over | 30 (71.4%) | 12 (28.6%) |
| Total | 1,090 (96.4%) | 41 (3.6%) |
Educational Attainment by Field of Study in Weiser
Education (177 | 25.8%), business (108 | 15.7%), bio, nature & agricultural (72 | 10.5%), science & technology (72 | 10.5%), and liberal arts & history (71 | 10.3%) are the most common fields of study among 686 individuals in Weiser who have obtained a bachelor's degree or higher.
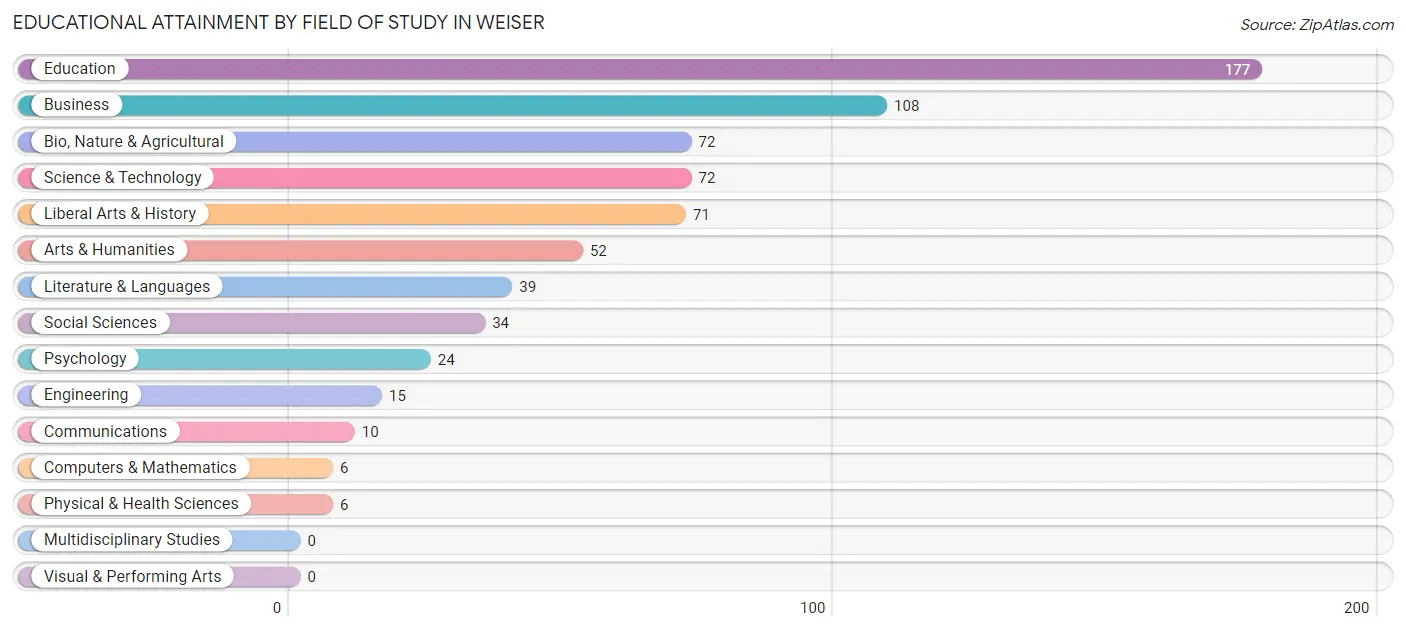
| Field of Study | # Graduates | % Graduates |
| Computers & Mathematics | 6 | 0.9% |
| Bio, Nature & Agricultural | 72 | 10.5% |
| Physical & Health Sciences | 6 | 0.9% |
| Psychology | 24 | 3.5% |
| Social Sciences | 34 | 5.0% |
| Engineering | 15 | 2.2% |
| Multidisciplinary Studies | 0 | 0.0% |
| Science & Technology | 72 | 10.5% |
| Business | 108 | 15.7% |
| Education | 177 | 25.8% |
| Literature & Languages | 39 | 5.7% |
| Liberal Arts & History | 71 | 10.3% |
| Visual & Performing Arts | 0 | 0.0% |
| Communications | 10 | 1.5% |
| Arts & Humanities | 52 | 7.6% |
| Total | 686 | 100.0% |
Transportation & Commute in Weiser
Vehicle Availability by Sex in Weiser
The most prevalent vehicle ownership categories in Weiser are males with 2 vehicles (532, accounting for 46.0%) and females with 2 vehicles (249, making up 58.0%).
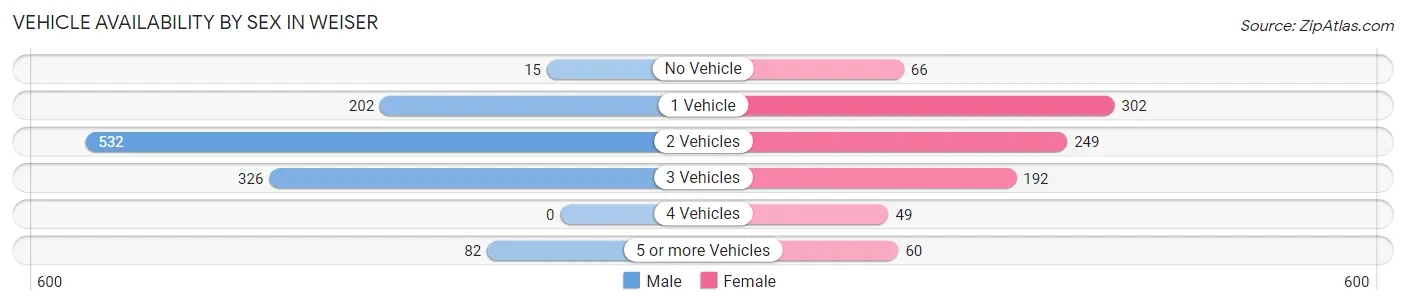
| Vehicles Available | Male | Female |
| No Vehicle | 15 (1.3%) | 66 (7.2%) |
| 1 Vehicle | 202 (17.5%) | 302 (32.9%) |
| 2 Vehicles | 532 (46.0%) | 249 (27.1%) |
| 3 Vehicles | 326 (28.2%) | 192 (20.9%) |
| 4 Vehicles | 0 (0.0%) | 49 (5.3%) |
| 5 or more Vehicles | 82 (7.1%) | 60 (6.5%) |
| Total | 1,157 (100.0%) | 918 (100.0%) |
Commute Time in Weiser
The most frequently occuring commute durations in Weiser are 5 to 9 minutes (596 commuters, 30.6%), 10 to 14 minutes (403 commuters, 20.7%), and less than 5 minutes (244 commuters, 12.5%).
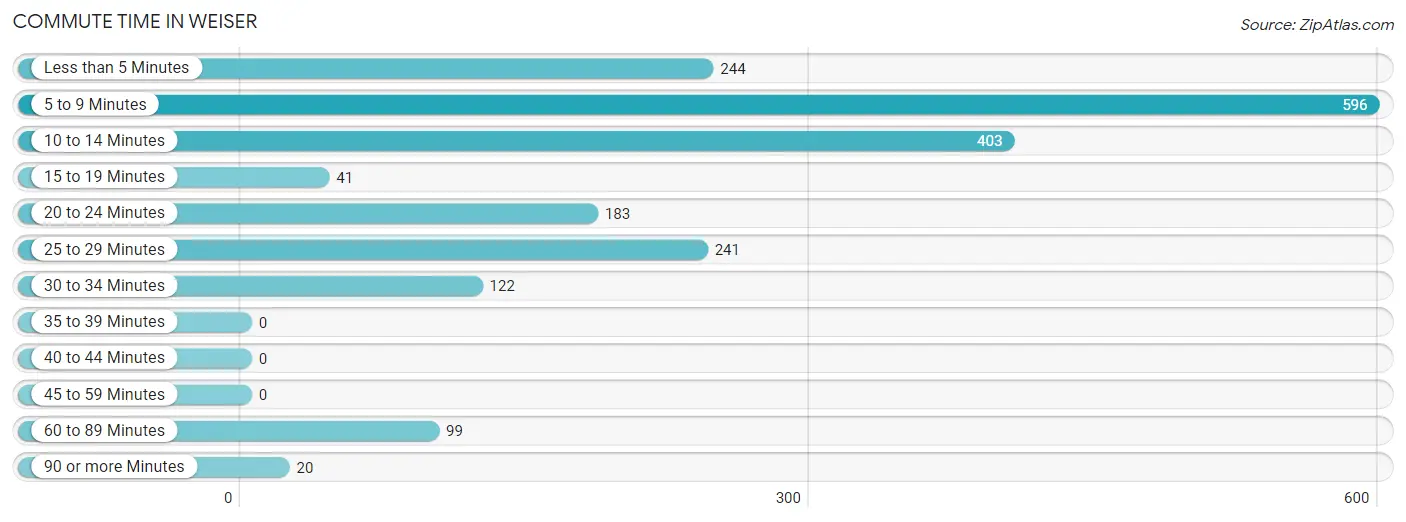
| Commute Time | # Commuters | % Commuters |
| Less than 5 Minutes | 244 | 12.5% |
| 5 to 9 Minutes | 596 | 30.6% |
| 10 to 14 Minutes | 403 | 20.7% |
| 15 to 19 Minutes | 41 | 2.1% |
| 20 to 24 Minutes | 183 | 9.4% |
| 25 to 29 Minutes | 241 | 12.4% |
| 30 to 34 Minutes | 122 | 6.3% |
| 35 to 39 Minutes | 0 | 0.0% |
| 40 to 44 Minutes | 0 | 0.0% |
| 45 to 59 Minutes | 0 | 0.0% |
| 60 to 89 Minutes | 99 | 5.1% |
| 90 or more Minutes | 20 | 1.0% |
Commute Time by Sex in Weiser
The most common commute times in Weiser are 5 to 9 minutes (334 commuters, 29.3%) for males and 5 to 9 minutes (262 commuters, 32.4%) for females.
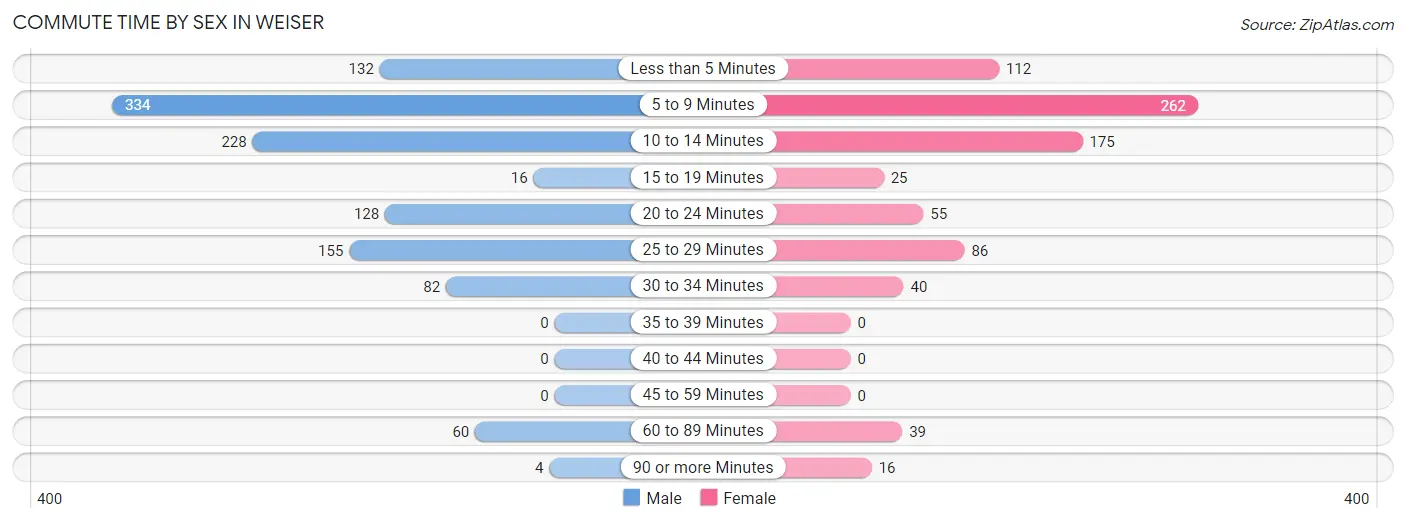
| Commute Time | Male | Female |
| Less than 5 Minutes | 132 (11.6%) | 112 (13.8%) |
| 5 to 9 Minutes | 334 (29.3%) | 262 (32.4%) |
| 10 to 14 Minutes | 228 (20.0%) | 175 (21.6%) |
| 15 to 19 Minutes | 16 (1.4%) | 25 (3.1%) |
| 20 to 24 Minutes | 128 (11.2%) | 55 (6.8%) |
| 25 to 29 Minutes | 155 (13.6%) | 86 (10.6%) |
| 30 to 34 Minutes | 82 (7.2%) | 40 (4.9%) |
| 35 to 39 Minutes | 0 (0.0%) | 0 (0.0%) |
| 40 to 44 Minutes | 0 (0.0%) | 0 (0.0%) |
| 45 to 59 Minutes | 0 (0.0%) | 0 (0.0%) |
| 60 to 89 Minutes | 60 (5.3%) | 39 (4.8%) |
| 90 or more Minutes | 4 (0.4%) | 16 (2.0%) |
Time of Departure to Work by Sex in Weiser
The most frequent times of departure to work in Weiser are 6:30 AM to 6:59 AM (209, 18.3%) for males and 6:30 AM to 6:59 AM (151, 18.6%) for females.
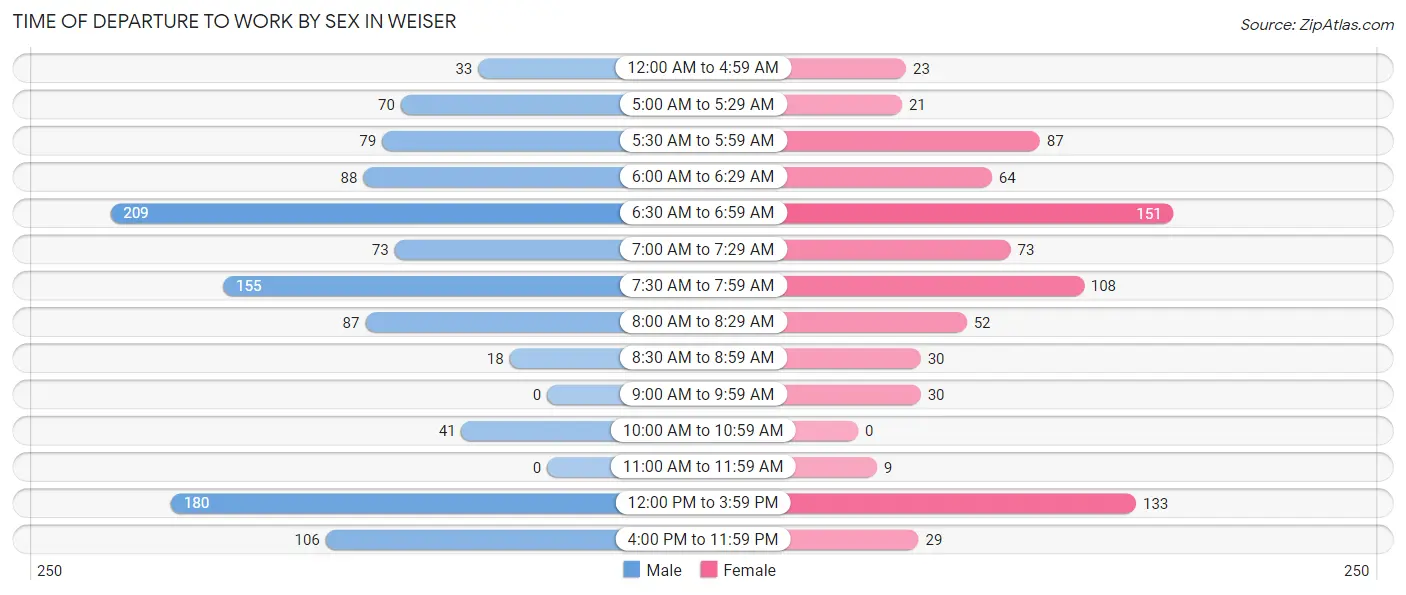
| Time of Departure | Male | Female |
| 12:00 AM to 4:59 AM | 33 (2.9%) | 23 (2.8%) |
| 5:00 AM to 5:29 AM | 70 (6.1%) | 21 (2.6%) |
| 5:30 AM to 5:59 AM | 79 (6.9%) | 87 (10.7%) |
| 6:00 AM to 6:29 AM | 88 (7.7%) | 64 (7.9%) |
| 6:30 AM to 6:59 AM | 209 (18.3%) | 151 (18.6%) |
| 7:00 AM to 7:29 AM | 73 (6.4%) | 73 (9.0%) |
| 7:30 AM to 7:59 AM | 155 (13.6%) | 108 (13.3%) |
| 8:00 AM to 8:29 AM | 87 (7.6%) | 52 (6.4%) |
| 8:30 AM to 8:59 AM | 18 (1.6%) | 30 (3.7%) |
| 9:00 AM to 9:59 AM | 0 (0.0%) | 30 (3.7%) |
| 10:00 AM to 10:59 AM | 41 (3.6%) | 0 (0.0%) |
| 11:00 AM to 11:59 AM | 0 (0.0%) | 9 (1.1%) |
| 12:00 PM to 3:59 PM | 180 (15.8%) | 133 (16.4%) |
| 4:00 PM to 11:59 PM | 106 (9.3%) | 29 (3.6%) |
| Total | 1,139 (100.0%) | 810 (100.0%) |
Housing Occupancy in Weiser
Occupancy by Ownership in Weiser
Of the total 2,352 dwellings in Weiser, owner-occupied units account for 1,432 (60.9%), while renter-occupied units make up 920 (39.1%).
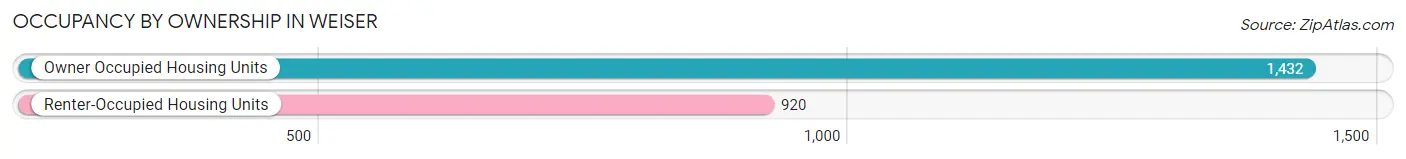
| Occupancy | # Housing Units | % Housing Units |
| Owner Occupied Housing Units | 1,432 | 60.9% |
| Renter-Occupied Housing Units | 920 | 39.1% |
| Total Occupied Housing Units | 2,352 | 100.0% |
Occupancy by Household Size in Weiser
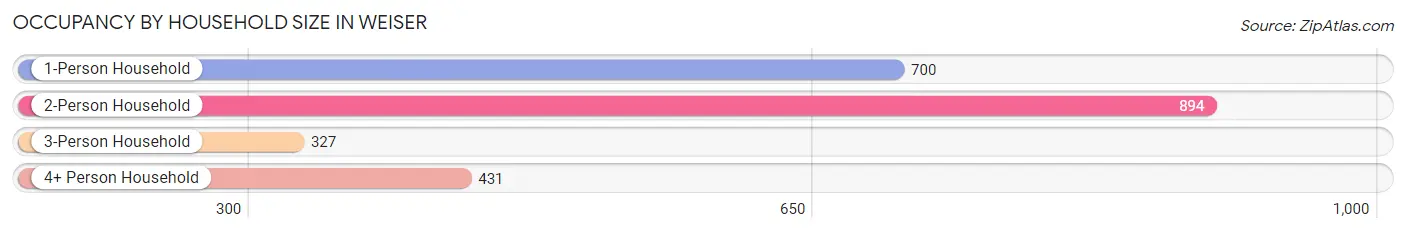
| Household Size | # Housing Units | % Housing Units |
| 1-Person Household | 700 | 29.8% |
| 2-Person Household | 894 | 38.0% |
| 3-Person Household | 327 | 13.9% |
| 4+ Person Household | 431 | 18.3% |
| Total Housing Units | 2,352 | 100.0% |
Occupancy by Ownership by Household Size in Weiser
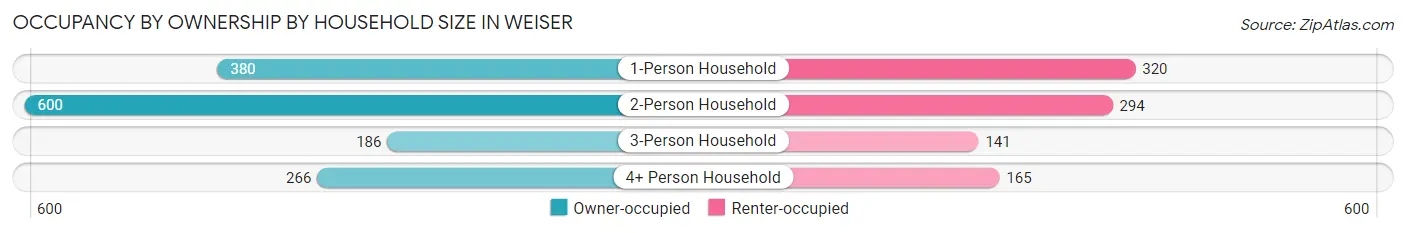
| Household Size | Owner-occupied | Renter-occupied |
| 1-Person Household | 380 (54.3%) | 320 (45.7%) |
| 2-Person Household | 600 (67.1%) | 294 (32.9%) |
| 3-Person Household | 186 (56.9%) | 141 (43.1%) |
| 4+ Person Household | 266 (61.7%) | 165 (38.3%) |
| Total Housing Units | 1,432 (60.9%) | 920 (39.1%) |
Occupancy by Educational Attainment in Weiser
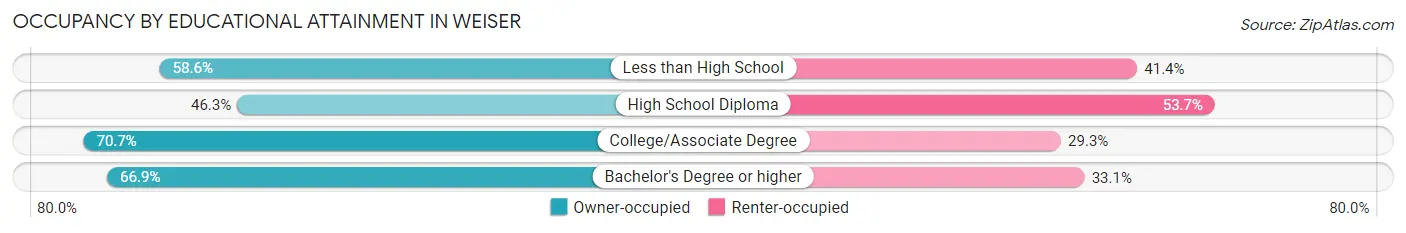
| Household Size | Owner-occupied | Renter-occupied |
| Less than High School | 164 (58.6%) | 116 (41.4%) |
| High School Diploma | 344 (46.3%) | 399 (53.7%) |
| College/Associate Degree | 655 (70.7%) | 272 (29.3%) |
| Bachelor's Degree or higher | 269 (66.9%) | 133 (33.1%) |
Occupancy by Age of Householder in Weiser
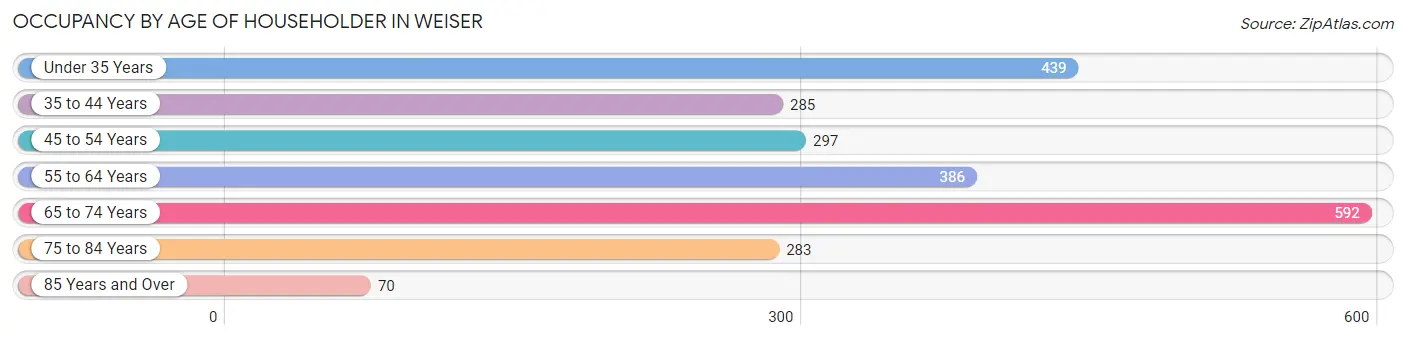
| Age Bracket | # Households | % Households |
| Under 35 Years | 439 | 18.7% |
| 35 to 44 Years | 285 | 12.1% |
| 45 to 54 Years | 297 | 12.6% |
| 55 to 64 Years | 386 | 16.4% |
| 65 to 74 Years | 592 | 25.2% |
| 75 to 84 Years | 283 | 12.0% |
| 85 Years and Over | 70 | 3.0% |
| Total | 2,352 | 100.0% |
Housing Finances in Weiser
Median Income by Occupancy in Weiser
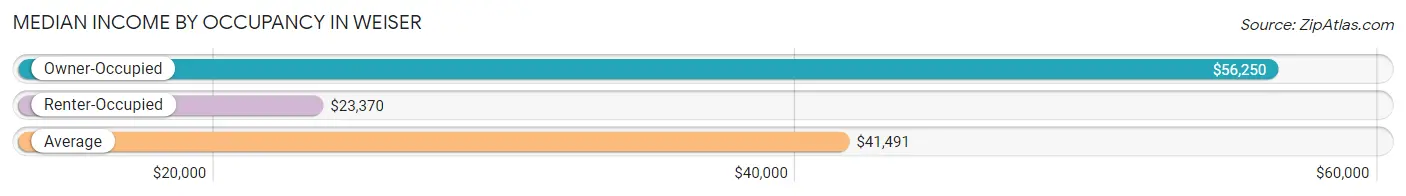
| Occupancy Type | # Households | Median Income |
| Owner-Occupied | 1,432 (60.9%) | $56,250 |
| Renter-Occupied | 920 (39.1%) | $23,370 |
| Average | 2,352 (100.0%) | $41,491 |
Occupancy by Householder Income Bracket in Weiser
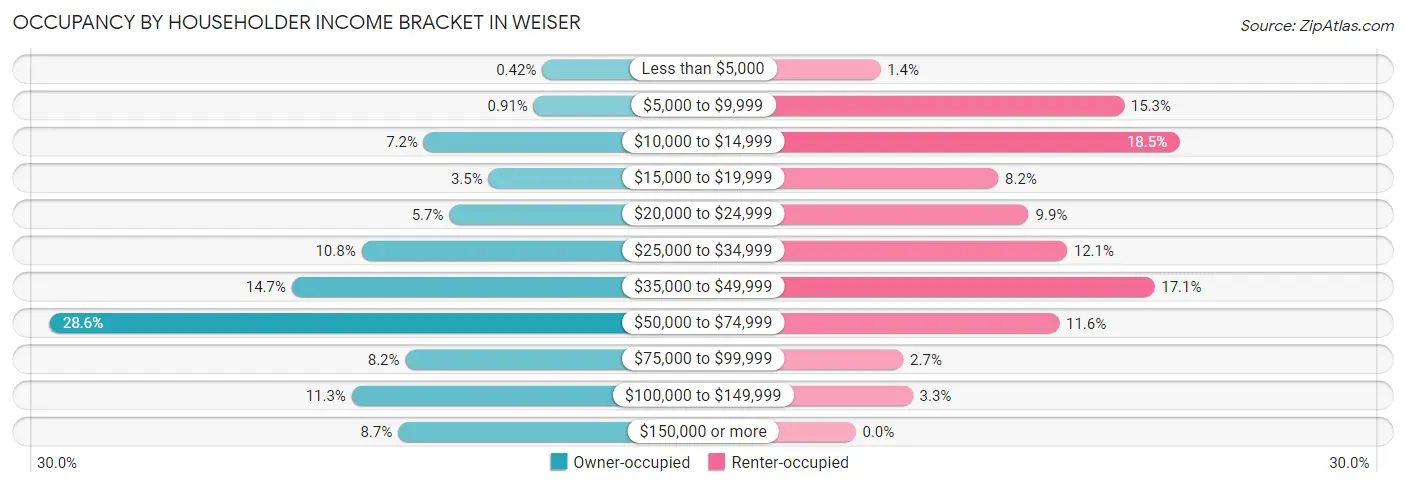
| Income Bracket | Owner-occupied | Renter-occupied |
| Less than $5,000 | 6 (0.4%) | 13 (1.4%) |
| $5,000 to $9,999 | 13 (0.9%) | 141 (15.3%) |
| $10,000 to $14,999 | 103 (7.2%) | 170 (18.5%) |
| $15,000 to $19,999 | 50 (3.5%) | 75 (8.2%) |
| $20,000 to $24,999 | 82 (5.7%) | 91 (9.9%) |
| $25,000 to $34,999 | 154 (10.7%) | 111 (12.1%) |
| $35,000 to $49,999 | 211 (14.7%) | 157 (17.1%) |
| $50,000 to $74,999 | 409 (28.6%) | 107 (11.6%) |
| $75,000 to $99,999 | 118 (8.2%) | 25 (2.7%) |
| $100,000 to $149,999 | 162 (11.3%) | 30 (3.3%) |
| $150,000 or more | 124 (8.7%) | 0 (0.0%) |
| Total | 1,432 (100.0%) | 920 (100.0%) |
Monthly Housing Cost Tiers in Weiser
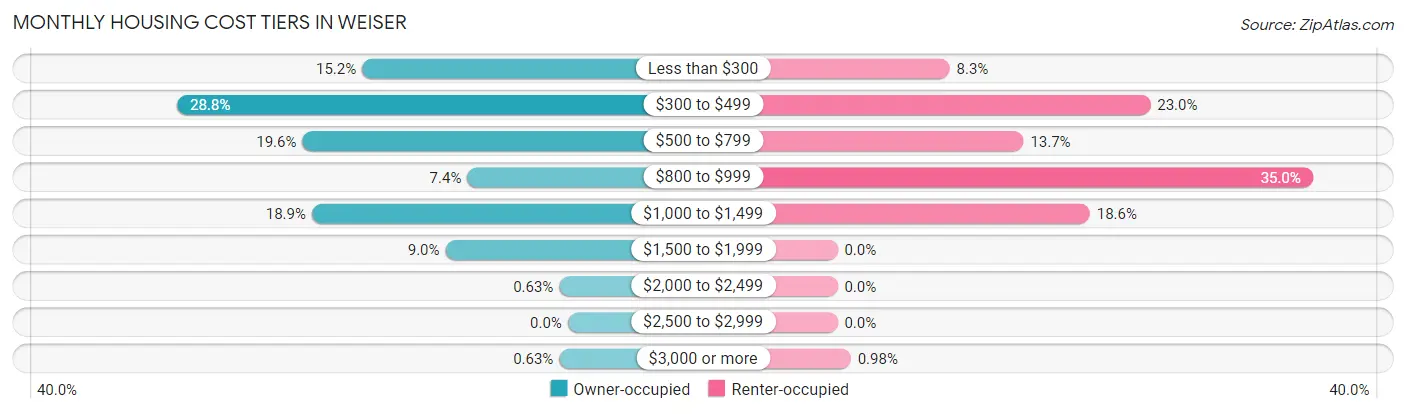
| Monthly Cost | Owner-occupied | Renter-occupied |
| Less than $300 | 217 (15.1%) | 76 (8.3%) |
| $300 to $499 | 412 (28.8%) | 212 (23.0%) |
| $500 to $799 | 280 (19.6%) | 126 (13.7%) |
| $800 to $999 | 106 (7.4%) | 322 (35.0%) |
| $1,000 to $1,499 | 270 (18.9%) | 171 (18.6%) |
| $1,500 to $1,999 | 129 (9.0%) | 0 (0.0%) |
| $2,000 to $2,499 | 9 (0.6%) | 0 (0.0%) |
| $2,500 to $2,999 | 0 (0.0%) | 0 (0.0%) |
| $3,000 or more | 9 (0.6%) | 9 (1.0%) |
| Total | 1,432 (100.0%) | 920 (100.0%) |
Physical Housing Characteristics in Weiser
Housing Structures in Weiser
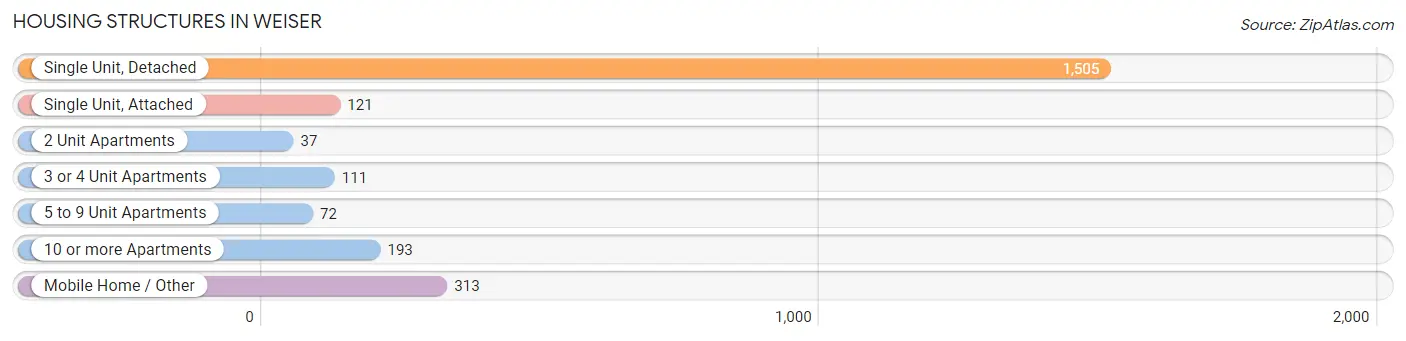
| Structure Type | # Housing Units | % Housing Units |
| Single Unit, Detached | 1,505 | 64.0% |
| Single Unit, Attached | 121 | 5.1% |
| 2 Unit Apartments | 37 | 1.6% |
| 3 or 4 Unit Apartments | 111 | 4.7% |
| 5 to 9 Unit Apartments | 72 | 3.1% |
| 10 or more Apartments | 193 | 8.2% |
| Mobile Home / Other | 313 | 13.3% |
| Total | 2,352 | 100.0% |
Housing Structures by Occupancy in Weiser
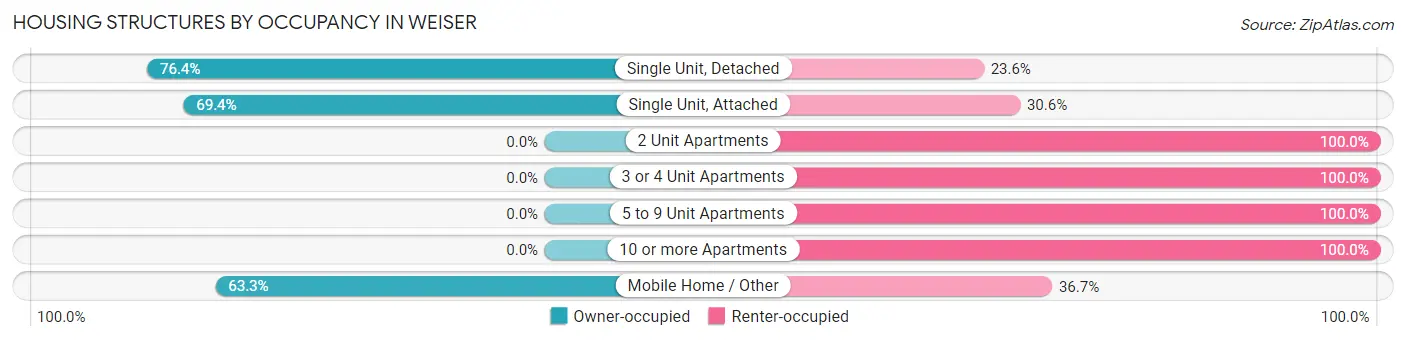
| Structure Type | Owner-occupied | Renter-occupied |
| Single Unit, Detached | 1,150 (76.4%) | 355 (23.6%) |
| Single Unit, Attached | 84 (69.4%) | 37 (30.6%) |
| 2 Unit Apartments | 0 (0.0%) | 37 (100.0%) |
| 3 or 4 Unit Apartments | 0 (0.0%) | 111 (100.0%) |
| 5 to 9 Unit Apartments | 0 (0.0%) | 72 (100.0%) |
| 10 or more Apartments | 0 (0.0%) | 193 (100.0%) |
| Mobile Home / Other | 198 (63.3%) | 115 (36.7%) |
| Total | 1,432 (60.9%) | 920 (39.1%) |
Housing Structures by Number of Rooms in Weiser
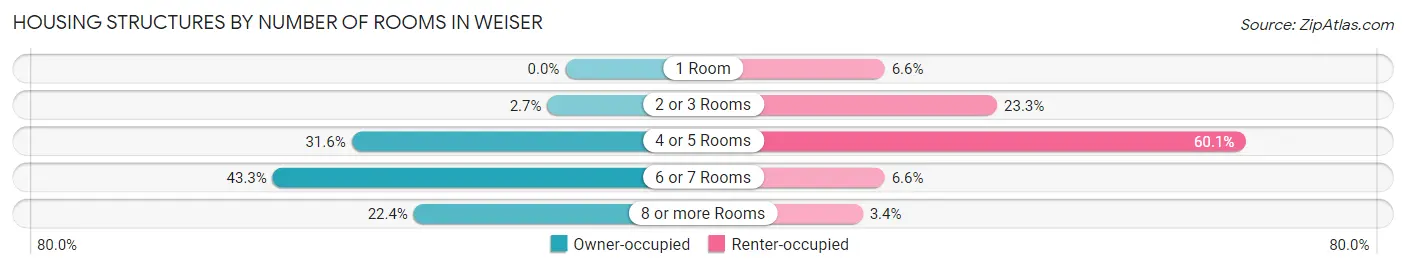
| Number of Rooms | Owner-occupied | Renter-occupied |
| 1 Room | 0 (0.0%) | 61 (6.6%) |
| 2 or 3 Rooms | 38 (2.6%) | 214 (23.3%) |
| 4 or 5 Rooms | 453 (31.6%) | 553 (60.1%) |
| 6 or 7 Rooms | 620 (43.3%) | 61 (6.6%) |
| 8 or more Rooms | 321 (22.4%) | 31 (3.4%) |
| Total | 1,432 (100.0%) | 920 (100.0%) |
Housing Structure by Heating Type in Weiser
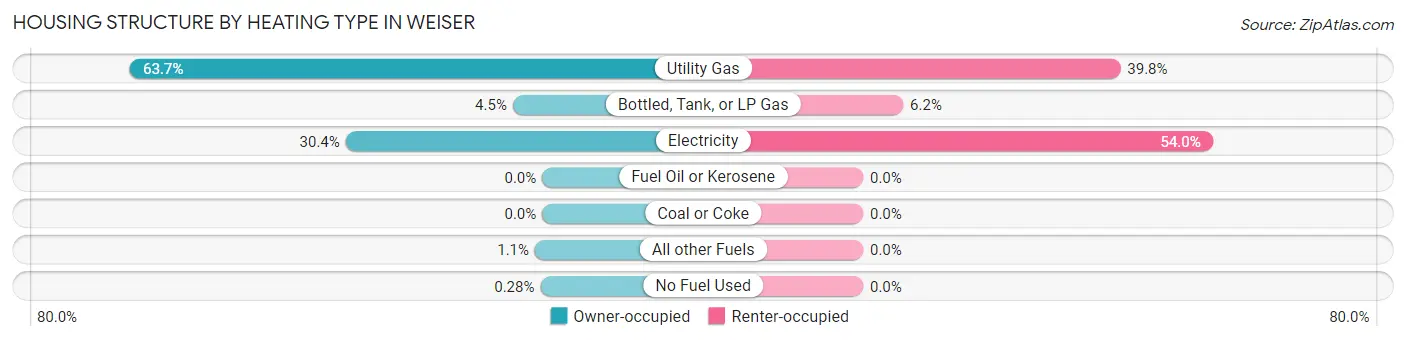
| Heating Type | Owner-occupied | Renter-occupied |
| Utility Gas | 912 (63.7%) | 366 (39.8%) |
| Bottled, Tank, or LP Gas | 65 (4.5%) | 57 (6.2%) |
| Electricity | 435 (30.4%) | 497 (54.0%) |
| Fuel Oil or Kerosene | 0 (0.0%) | 0 (0.0%) |
| Coal or Coke | 0 (0.0%) | 0 (0.0%) |
| All other Fuels | 16 (1.1%) | 0 (0.0%) |
| No Fuel Used | 4 (0.3%) | 0 (0.0%) |
| Total | 1,432 (100.0%) | 920 (100.0%) |
Household Vehicle Usage in Weiser
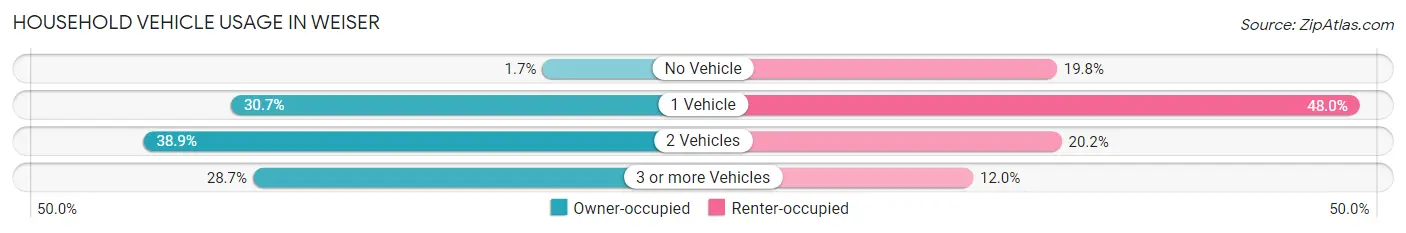
| Vehicles per Household | Owner-occupied | Renter-occupied |
| No Vehicle | 24 (1.7%) | 182 (19.8%) |
| 1 Vehicle | 440 (30.7%) | 442 (48.0%) |
| 2 Vehicles | 557 (38.9%) | 186 (20.2%) |
| 3 or more Vehicles | 411 (28.7%) | 110 (12.0%) |
| Total | 1,432 (100.0%) | 920 (100.0%) |
Real Estate & Mortgages in Weiser
Real Estate and Mortgage Overview in Weiser
| Characteristic | Without Mortgage | With Mortgage |
| Housing Units | 743 | 689 |
| Median Property Value | $157,400 | $178,800 |
| Median Household Income | $39,623 | $43 |
| Monthly Housing Costs | $357 | $9 |
| Real Estate Taxes | $1,085 | $20 |
Property Value by Mortgage Status in Weiser
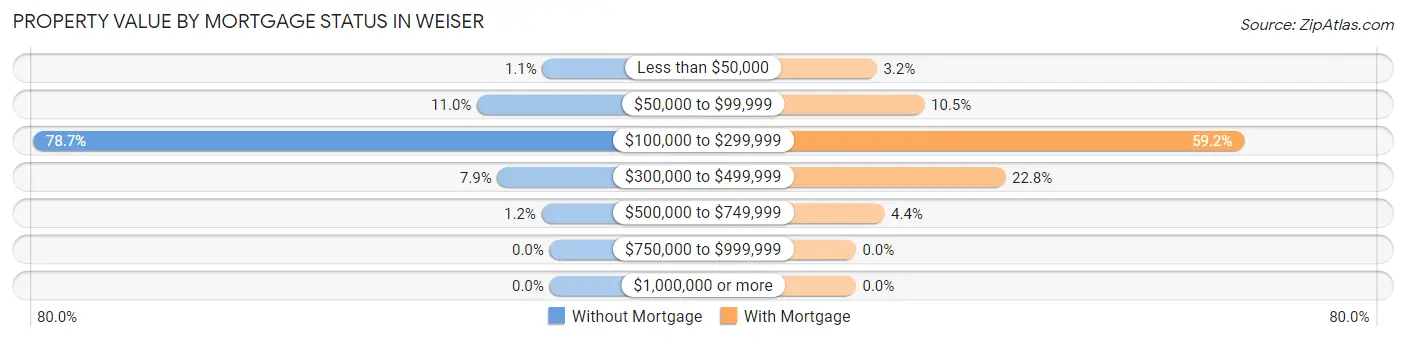
| Property Value | Without Mortgage | With Mortgage |
| Less than $50,000 | 8 (1.1%) | 22 (3.2%) |
| $50,000 to $99,999 | 82 (11.0%) | 72 (10.4%) |
| $100,000 to $299,999 | 585 (78.7%) | 408 (59.2%) |
| $300,000 to $499,999 | 59 (7.9%) | 157 (22.8%) |
| $500,000 to $749,999 | 9 (1.2%) | 30 (4.3%) |
| $750,000 to $999,999 | 0 (0.0%) | 0 (0.0%) |
| $1,000,000 or more | 0 (0.0%) | 0 (0.0%) |
| Total | 743 (100.0%) | 689 (100.0%) |
Household Income by Mortgage Status in Weiser
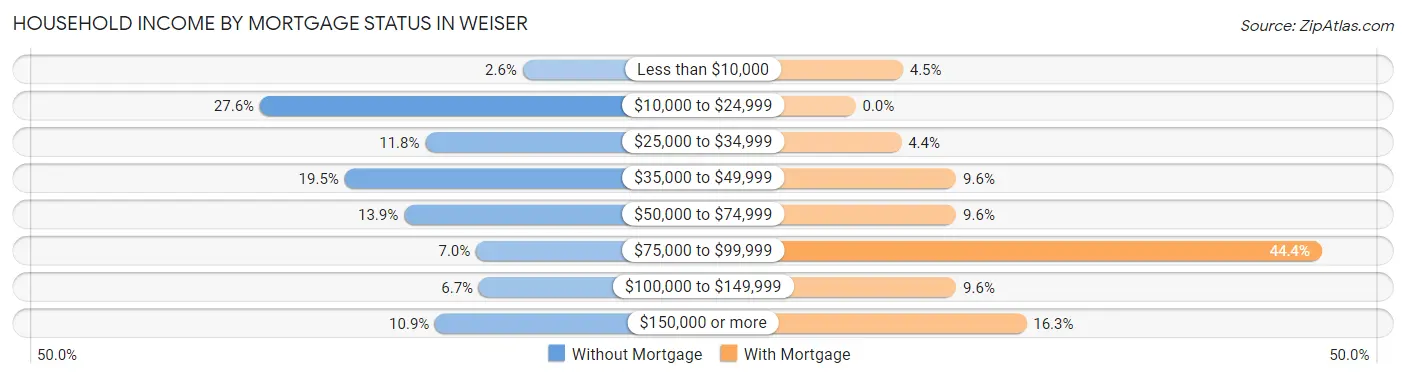
| Household Income | Without Mortgage | With Mortgage |
| Less than $10,000 | 19 (2.6%) | 31 (4.5%) |
| $10,000 to $24,999 | 205 (27.6%) | 0 (0.0%) |
| $25,000 to $34,999 | 88 (11.8%) | 30 (4.3%) |
| $35,000 to $49,999 | 145 (19.5%) | 66 (9.6%) |
| $50,000 to $74,999 | 103 (13.9%) | 66 (9.6%) |
| $75,000 to $99,999 | 52 (7.0%) | 306 (44.4%) |
| $100,000 to $149,999 | 50 (6.7%) | 66 (9.6%) |
| $150,000 or more | 81 (10.9%) | 112 (16.3%) |
| Total | 743 (100.0%) | 689 (100.0%) |
Property Value to Household Income Ratio in Weiser
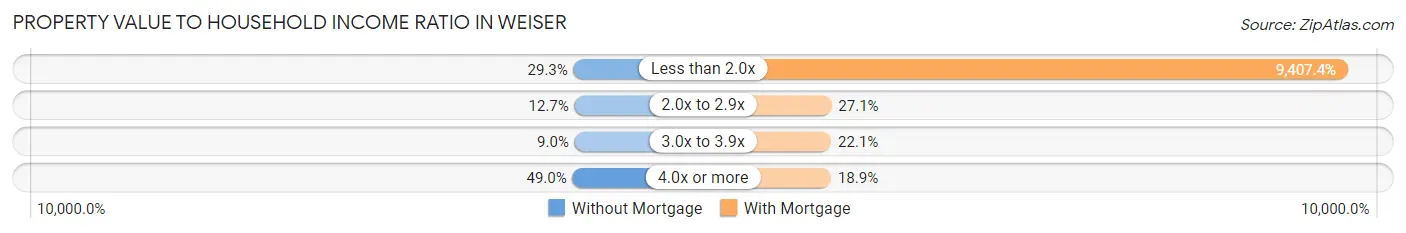
| Value-to-Income Ratio | Without Mortgage | With Mortgage |
| Less than 2.0x | 218 (29.3%) | 64,817 (9,407.4%) |
| 2.0x to 2.9x | 94 (12.7%) | 187 (27.1%) |
| 3.0x to 3.9x | 67 (9.0%) | 152 (22.1%) |
| 4.0x or more | 364 (49.0%) | 130 (18.9%) |
| Total | 743 (100.0%) | 689 (100.0%) |
Real Estate Taxes by Mortgage Status in Weiser
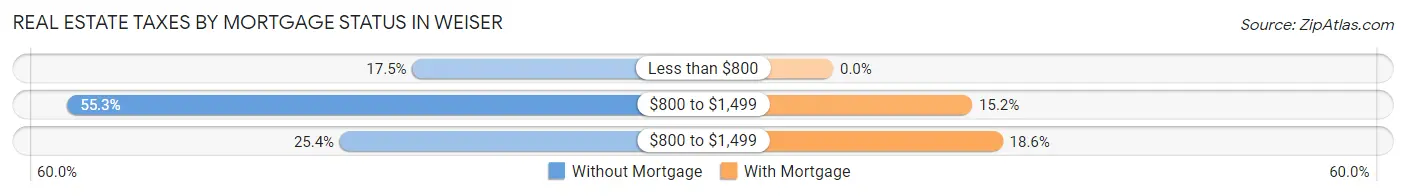
| Property Taxes | Without Mortgage | With Mortgage |
| Less than $800 | 130 (17.5%) | 0 (0.0%) |
| $800 to $1,499 | 411 (55.3%) | 105 (15.2%) |
| $800 to $1,499 | 189 (25.4%) | 128 (18.6%) |
| Total | 743 (100.0%) | 689 (100.0%) |
Health & Disability in Weiser
Health Insurance Coverage by Age in Weiser
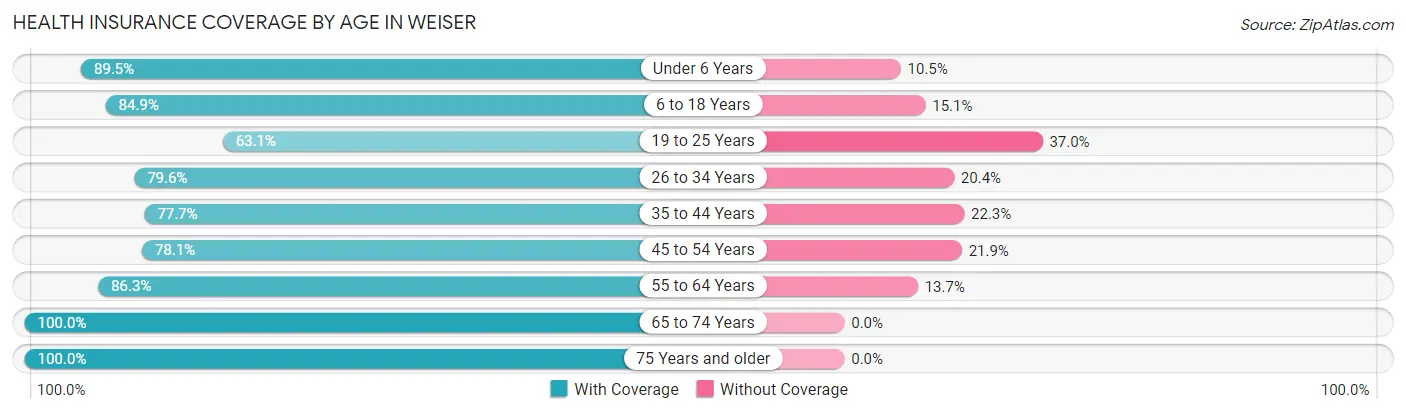
| Age Bracket | With Coverage | Without Coverage |
| Under 6 Years | 307 (89.5%) | 36 (10.5%) |
| 6 to 18 Years | 798 (84.9%) | 142 (15.1%) |
| 19 to 25 Years | 302 (63.0%) | 177 (36.9%) |
| 26 to 34 Years | 510 (79.6%) | 131 (20.4%) |
| 35 to 44 Years | 459 (77.7%) | 132 (22.3%) |
| 45 to 54 Years | 389 (78.1%) | 109 (21.9%) |
| 55 to 64 Years | 536 (86.3%) | 85 (13.7%) |
| 65 to 74 Years | 853 (100.0%) | 0 (0.0%) |
| 75 Years and older | 553 (100.0%) | 0 (0.0%) |
| Total | 4,707 (85.3%) | 812 (14.7%) |
Health Insurance Coverage by Citizenship Status in Weiser
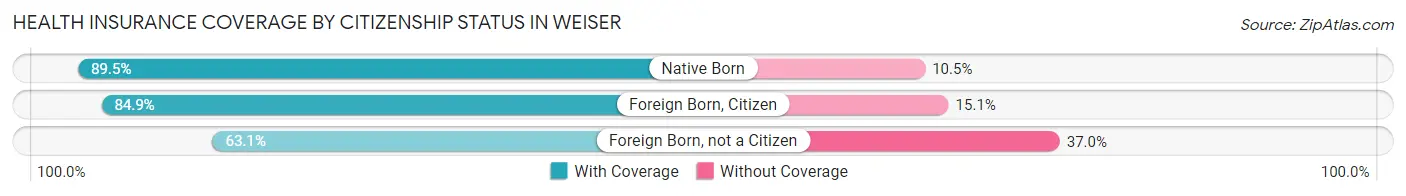
| Citizenship Status | With Coverage | Without Coverage |
| Native Born | 307 (89.5%) | 36 (10.5%) |
| Foreign Born, Citizen | 798 (84.9%) | 142 (15.1%) |
| Foreign Born, not a Citizen | 302 (63.0%) | 177 (36.9%) |
Health Insurance Coverage by Household Income in Weiser
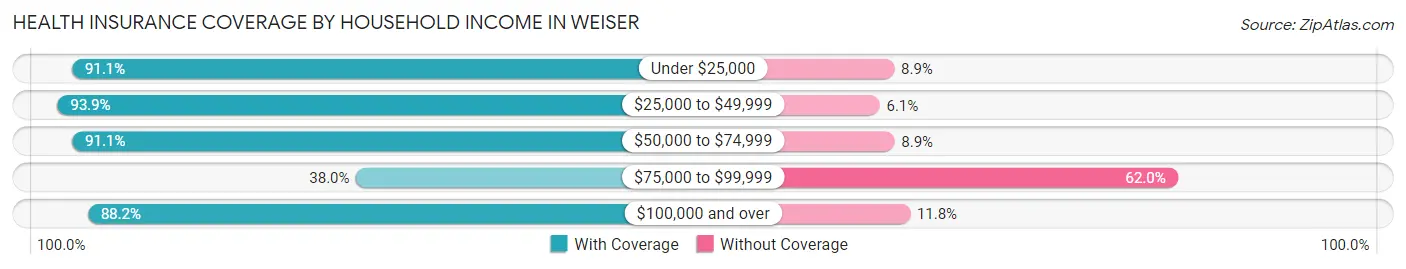
| Household Income | With Coverage | Without Coverage |
| Under $25,000 | 1,049 (91.1%) | 102 (8.9%) |
| $25,000 to $49,999 | 1,149 (93.9%) | 75 (6.1%) |
| $50,000 to $74,999 | 1,258 (91.1%) | 123 (8.9%) |
| $75,000 to $99,999 | 232 (38.0%) | 378 (62.0%) |
| $100,000 and over | 999 (88.2%) | 134 (11.8%) |
Public vs Private Health Insurance Coverage by Age in Weiser
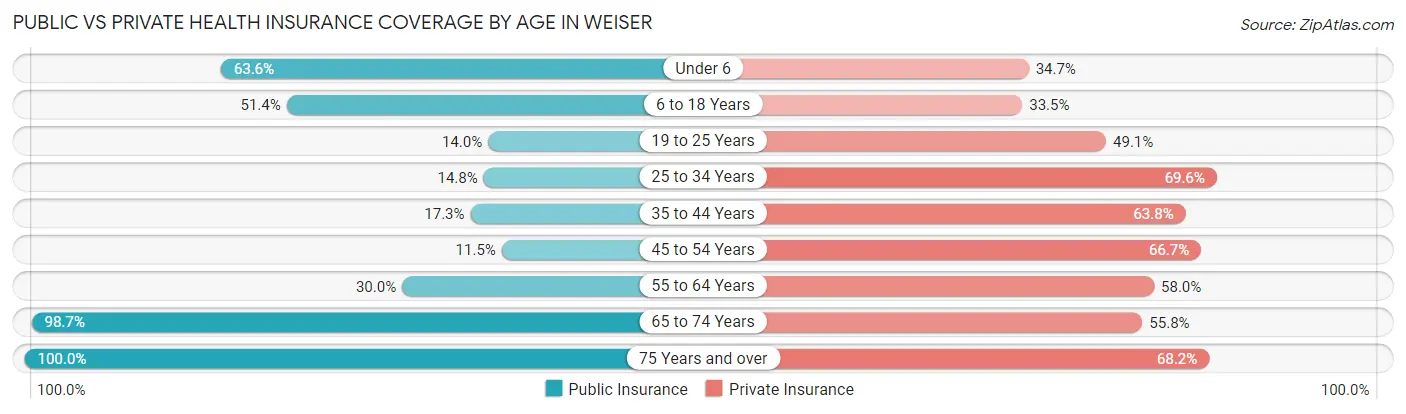
| Age Bracket | Public Insurance | Private Insurance |
| Under 6 | 218 (63.6%) | 119 (34.7%) |
| 6 to 18 Years | 483 (51.4%) | 315 (33.5%) |
| 19 to 25 Years | 67 (14.0%) | 235 (49.1%) |
| 25 to 34 Years | 95 (14.8%) | 446 (69.6%) |
| 35 to 44 Years | 102 (17.3%) | 377 (63.8%) |
| 45 to 54 Years | 57 (11.5%) | 332 (66.7%) |
| 55 to 64 Years | 186 (29.9%) | 360 (58.0%) |
| 65 to 74 Years | 842 (98.7%) | 476 (55.8%) |
| 75 Years and over | 553 (100.0%) | 377 (68.2%) |
| Total | 2,603 (47.2%) | 3,037 (55.0%) |
Disability Status by Sex by Age in Weiser
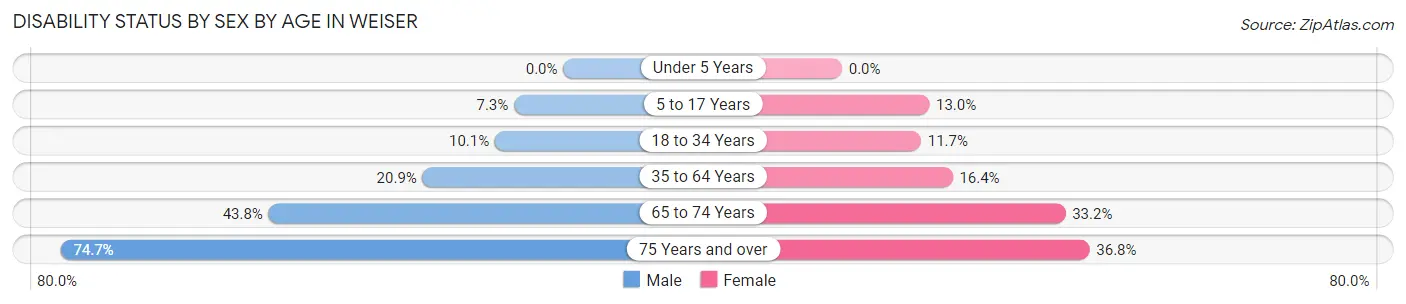
| Age Bracket | Male | Female |
| Under 5 Years | 0 (0.0%) | 0 (0.0%) |
| 5 to 17 Years | 35 (7.3%) | 69 (13.0%) |
| 18 to 34 Years | 51 (10.1%) | 74 (11.7%) |
| 35 to 64 Years | 169 (20.9%) | 148 (16.4%) |
| 65 to 74 Years | 182 (43.8%) | 145 (33.2%) |
| 75 Years and over | 224 (74.7%) | 93 (36.8%) |
Disability Class by Sex by Age in Weiser
Disability Class: Hearing Difficulty
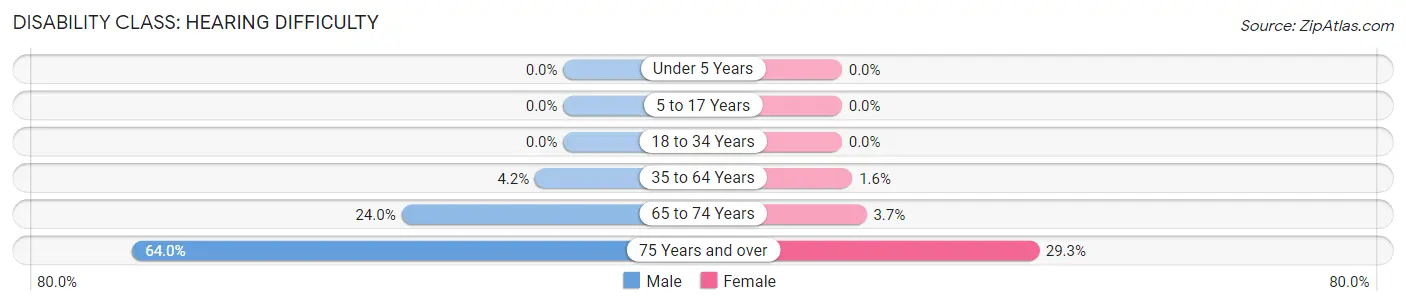
| Age Bracket | Male | Female |
| Under 5 Years | 0 (0.0%) | 0 (0.0%) |
| 5 to 17 Years | 0 (0.0%) | 0 (0.0%) |
| 18 to 34 Years | 0 (0.0%) | 0 (0.0%) |
| 35 to 64 Years | 34 (4.2%) | 14 (1.5%) |
| 65 to 74 Years | 100 (24.0%) | 16 (3.7%) |
| 75 Years and over | 192 (64.0%) | 74 (29.2%) |
Disability Class: Vision Difficulty
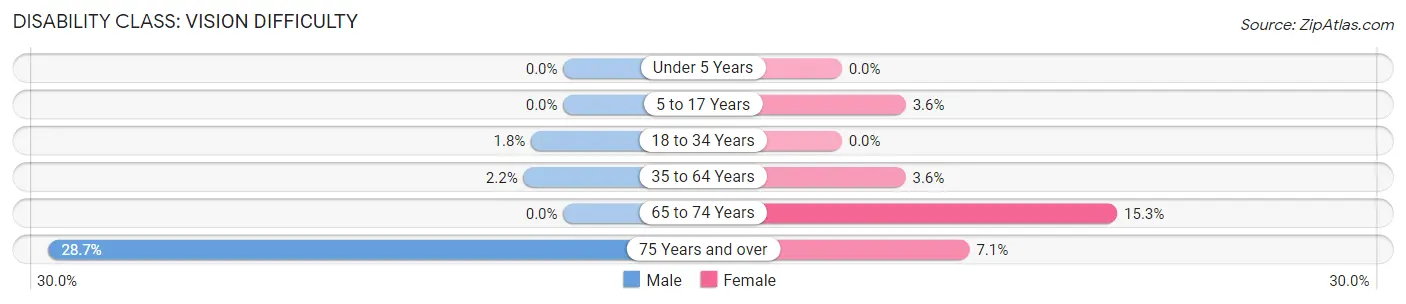
| Age Bracket | Male | Female |
| Under 5 Years | 0 (0.0%) | 0 (0.0%) |
| 5 to 17 Years | 0 (0.0%) | 19 (3.6%) |
| 18 to 34 Years | 9 (1.8%) | 0 (0.0%) |
| 35 to 64 Years | 18 (2.2%) | 32 (3.5%) |
| 65 to 74 Years | 0 (0.0%) | 67 (15.3%) |
| 75 Years and over | 86 (28.7%) | 18 (7.1%) |
Disability Class: Cognitive Difficulty
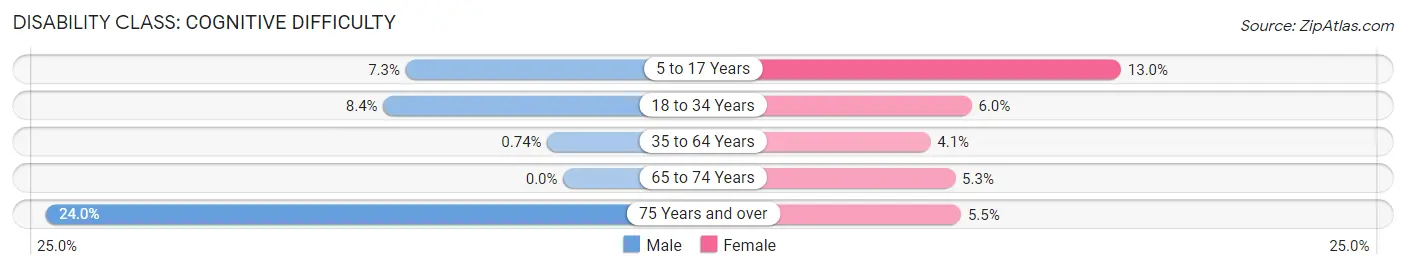
| Age Bracket | Male | Female |
| 5 to 17 Years | 35 (7.3%) | 69 (13.0%) |
| 18 to 34 Years | 42 (8.4%) | 38 (6.0%) |
| 35 to 64 Years | 6 (0.7%) | 37 (4.1%) |
| 65 to 74 Years | 0 (0.0%) | 23 (5.3%) |
| 75 Years and over | 72 (24.0%) | 14 (5.5%) |
Disability Class: Ambulatory Difficulty
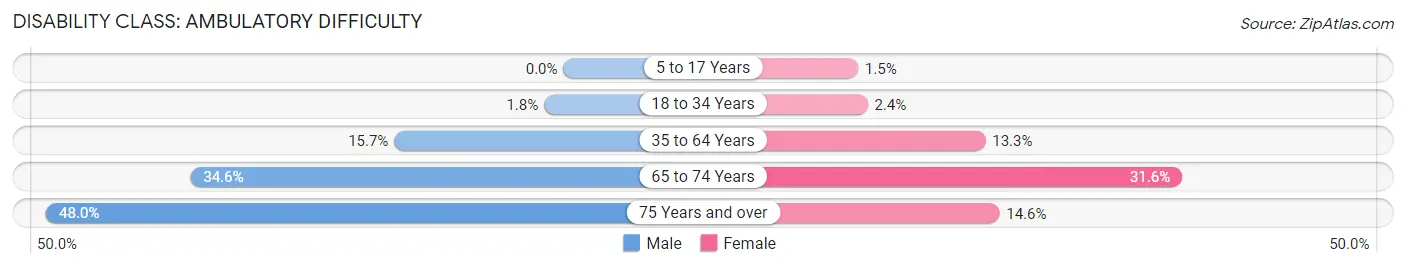
| Age Bracket | Male | Female |
| 5 to 17 Years | 0 (0.0%) | 8 (1.5%) |
| 18 to 34 Years | 9 (1.8%) | 15 (2.4%) |
| 35 to 64 Years | 127 (15.7%) | 120 (13.3%) |
| 65 to 74 Years | 144 (34.6%) | 138 (31.6%) |
| 75 Years and over | 144 (48.0%) | 37 (14.6%) |
Disability Class: Self-Care Difficulty
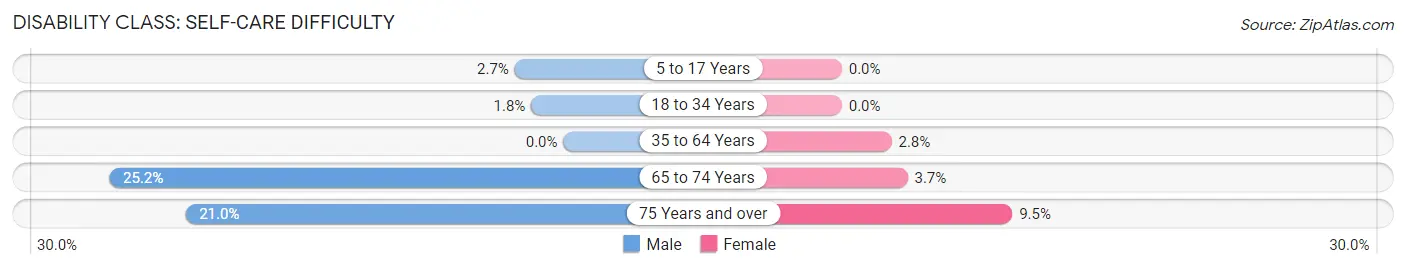
| Age Bracket | Male | Female |
| 5 to 17 Years | 13 (2.7%) | 0 (0.0%) |
| 18 to 34 Years | 9 (1.8%) | 0 (0.0%) |
| 35 to 64 Years | 0 (0.0%) | 25 (2.8%) |
| 65 to 74 Years | 105 (25.2%) | 16 (3.7%) |
| 75 Years and over | 63 (21.0%) | 24 (9.5%) |
Technology Access in Weiser
Computing Device Access in Weiser
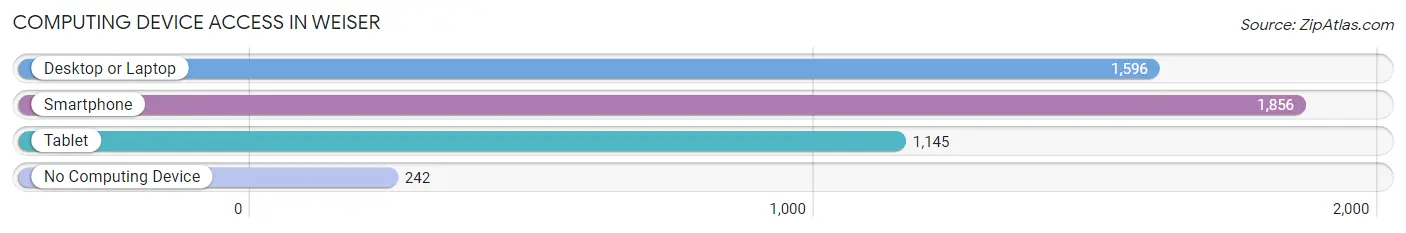
| Device Type | # Households | % Households |
| Desktop or Laptop | 1,596 | 67.9% |
| Smartphone | 1,856 | 78.9% |
| Tablet | 1,145 | 48.7% |
| No Computing Device | 242 | 10.3% |
| Total | 2,352 | 100.0% |
Internet Access in Weiser
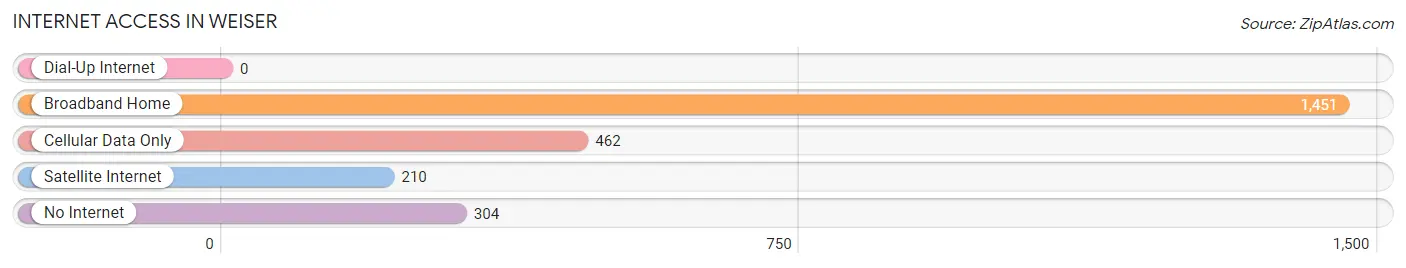
| Internet Type | # Households | % Households |
| Dial-Up Internet | 0 | 0.0% |
| Broadband Home | 1,451 | 61.7% |
| Cellular Data Only | 462 | 19.6% |
| Satellite Internet | 210 | 8.9% |
| No Internet | 304 | 12.9% |
| Total | 2,352 | 100.0% |
Weiser Summary
Weiser is a city located in Washington County, Idaho, United States. It is the county seat of Washington County and is part of the Weiser Micropolitan Statistical Area. The population was 5,507 at the 2010 census.
History
Weiser was founded in 1864 by a group of settlers led by William Craig. The settlers named the town after a local Native American chief, Chief Weiser. The town was incorporated in 1887.
In the late 19th century, Weiser was a major stop on the Oregon Short Line Railroad. The railroad brought many new settlers to the area, and the town grew rapidly. By the early 20th century, Weiser had become a major agricultural center, with many farms and ranches in the area.
Geography
Weiser is located at an elevation of 2,845 feet (867 m) in the Weiser River Valley. The city is situated on the banks of the Weiser River, which flows through the city. The city is surrounded by rolling hills and mountains, including the Seven Devils Mountains to the west and the Owyhee Mountains to the east.
Weiser is located in the Snake River Plain, a large area of flat land that stretches from western Idaho into eastern Oregon. The city is located approximately 75 miles (121 km) northwest of Boise, the state capital.
Economy
Weiser’s economy is largely based on agriculture. The city is home to many farms and ranches, and the surrounding area is known for its production of potatoes, wheat, barley, and other crops.
The city is also home to several manufacturing companies, including Weiser Manufacturing, which produces agricultural equipment, and Weiser Plastics, which produces plastic products.
Demographics
As of the 2010 census, there were 5,507 people, 2,093 households, and 1,372 families residing in the city. The population density was 1,092.3 people per square mile (422.2/km2). There were 2,309 housing units at an average density of 459.3 per square mile (177.3/km2). The racial makeup of the city was 91.2% White, 0.3% African American, 0.7% Native American, 0.4% Asian, 0.1% Pacific Islander, 5.2% from other races, and 2.1% from two or more races. Hispanic or Latino of any race were 11.2% of the population.
There were 2,093 households, out of which 32.2% had children under the age of 18 living with them, 48.2% were married couples living together, 12.7% had a female householder with no husband present, and 33.2% were non-families. 28.2% of all households were made up of individuals, and 13.2% had someone living alone who was 65 years of age or older. The average household size was 2.60 and the average family size was 3.17.
In the city, the population was spread out, with 28.2% under the age of 18, 8.2% from 18 to 24, 25.2% from 25 to 44, 22.2% from 45 to 64, and 16.2% who were 65 years of age or older. The median age was 36 years. For every 100 females, there were 94.2 males. For every 100 females age 18 and over, there were 91.2 males.
The median income for a household in the city was $30,938, and the median income for a family was $36,944. Males had a median income of $30,000 versus $20,938 for females. The per capita income for the city was $15,845. About 11.2% of families and 14.2% of the population were below the poverty line, including 19.2% of those under age 18 and 8.2% of those age 65 or over.
Common Questions
What is the Total Population of Weiser?
Total Population of Weiser is 5,678.
What is the Total Male Population of Weiser?
Total Male Population of Weiser is 2,736.
What is the Total Female Population of Weiser?
Total Female Population of Weiser is 2,942.
What is the Ratio of Males per 100 Females in Weiser?
There are 93.00 Males per 100 Females in Weiser.
What is the Ratio of Females per 100 Males in Weiser?
There are 107.53 Females per 100 Males in Weiser.
What is the Median Population Age in Weiser?
Median Population Age in Weiser is 39.3 Years.
What is the Average Family Size in Weiser
Average Family Size in Weiser is 2.7 People.
What is the Average Household Size in Weiser
Average Household Size in Weiser is 2.3 People.
What is Per Capita Income in Weiser?
Per Capita income in Weiser is $23,799.
What is the Median Family Income in Weiser?
Median Family Income in Weiser is $48,646.
What is the Median Household income in Weiser?
Median Household Income in Weiser is $41,491.
What is Income or Wage Gap in Weiser?
Income or Wage Gap in Weiser is 54.4%.
Women in Weiser earn 45.6 cents for every dollar earned by a man.
What is Inequality or Gini Index in Weiser?
Inequality or Gini Index in Weiser is 0.45.
How Large is the Labor Force in Weiser?
There are 2,254 People in the Labor Forcein in Weiser.
What is the Percentage of People in the Labor Force in Weiser?
49.9% of People are in the Labor Force in Weiser.
What is the Unemployment Rate in Weiser?
Unemployment Rate in Weiser is 5.8%.