Cottonwood, ID
Cottonwood Map
Cottonwood Overview
1,243
TOTAL POPULATION
574
MALE POPULATION
669
FEMALE POPULATION
85.80
MALES / 100 FEMALES
116.55
FEMALES / 100 MALES
33.1
MEDIAN AGE
4.2
AVG FAMILY SIZE
3.1
AVG HOUSEHOLD SIZE
$23,579
PER CAPITA INCOME
$63,833
AVG FAMILY INCOME
$55,147
AVG HOUSEHOLD INCOME
68.0%
WAGE / INCOME GAP [ % ]
32.0¢/ $1
WAGE / INCOME GAP [ $ ]
0.35
INEQUALITY / GINI INDEX
523
LABOR FORCE [ PEOPLE ]
56.2%
PERCENT IN LABOR FORCE
10.9%
UNEMPLOYMENT RATE
Cottonwood Zip Codes
Cottonwood Area Codes
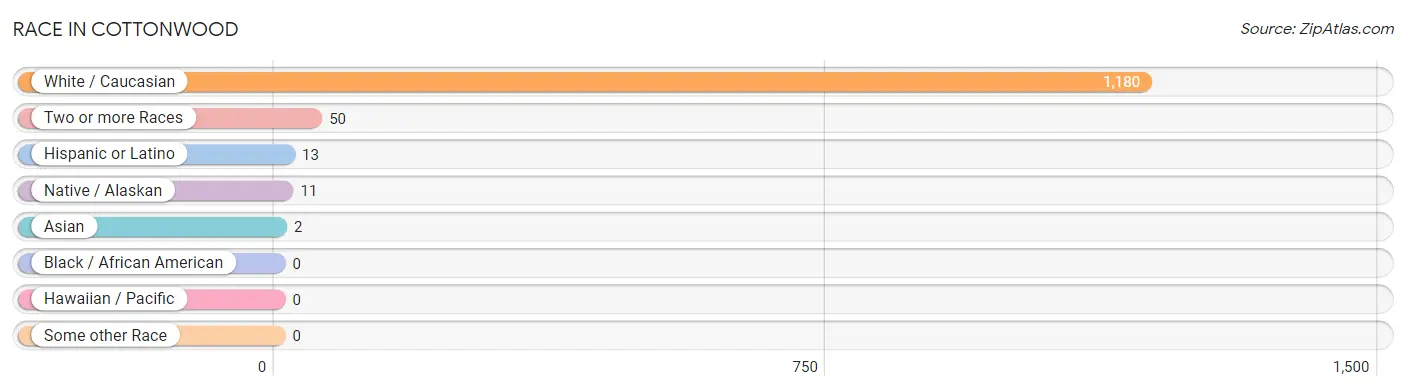
Race in Cottonwood
The most populous races in Cottonwood are White / Caucasian (1,180 | 94.9%), Two or more Races (50 | 4.0%), and Hispanic or Latino (13 | 1.1%).
| Race | # Population | % Population |
| Asian | 2 | 0.2% |
| Black / African American | 0 | 0.0% |
| Hawaiian / Pacific | 0 | 0.0% |
| Hispanic or Latino | 13 | 1.1% |
| Native / Alaskan | 11 | 0.9% |
| White / Caucasian | 1,180 | 94.9% |
| Two or more Races | 50 | 4.0% |
| Some other Race | 0 | 0.0% |
| Total | 1,243 | 100.0% |
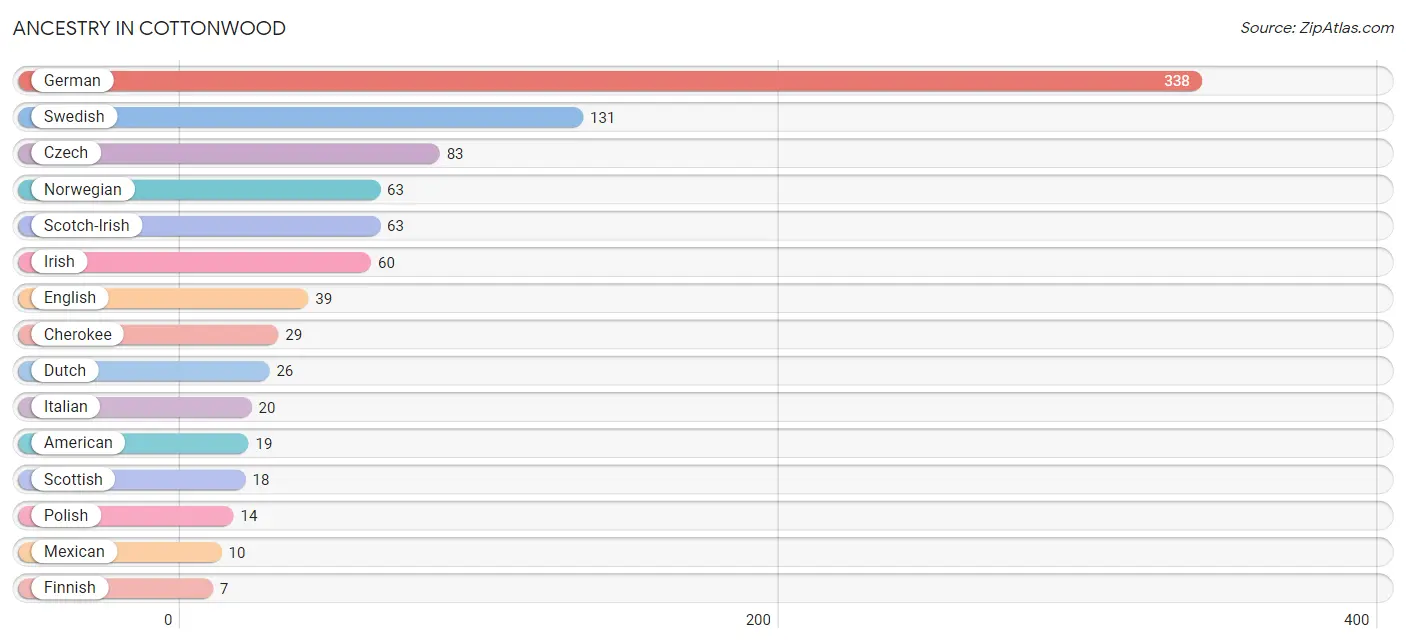
Ancestry in Cottonwood
The most populous ancestries reported in Cottonwood are German (338 | 27.2%), Swedish (131 | 10.5%), Czech (83 | 6.7%), Norwegian (63 | 5.1%), and Scotch-Irish (63 | 5.1%), together accounting for 54.5% of all Cottonwood residents.
| Ancestry | # Population | % Population |
| American | 19 | 1.5% |
| Bhutanese | 4 | 0.3% |
| Blackfeet | 4 | 0.3% |
| Cherokee | 29 | 2.3% |
| Chippewa | 3 | 0.2% |
| Czech | 83 | 6.7% |
| Danish | 6 | 0.5% |
| Dutch | 26 | 2.1% |
| English | 39 | 3.1% |
| European | 4 | 0.3% |
| Finnish | 7 | 0.6% |
| French | 6 | 0.5% |
| French Canadian | 3 | 0.2% |
| German | 338 | 27.2% |
| Hungarian | 3 | 0.2% |
| Irish | 60 | 4.8% |
| Italian | 20 | 1.6% |
| Mexican | 10 | 0.8% |
| Norwegian | 63 | 5.1% |
| Polish | 14 | 1.1% |
| Scotch-Irish | 63 | 5.1% |
| Scottish | 18 | 1.5% |
| Spanish | 3 | 0.2% |
| Swedish | 131 | 10.5% |
| Thai | 2 | 0.2% | View All 25 Rows |
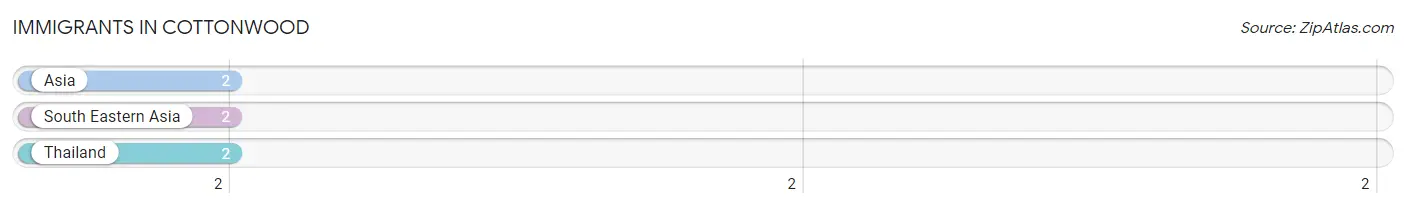
Immigrants in Cottonwood
The most numerous immigrant groups reported in Cottonwood came from Asia (2 | 0.2%), South Eastern Asia (2 | 0.2%), and Thailand (2 | 0.2%), together accounting for 0.5% of all Cottonwood residents.
| Immigration Origin | # Population | % Population |
| Asia | 2 | 0.2% |
| South Eastern Asia | 2 | 0.2% |
| Thailand | 2 | 0.2% | View All 3 Rows |
Sex and Age in Cottonwood
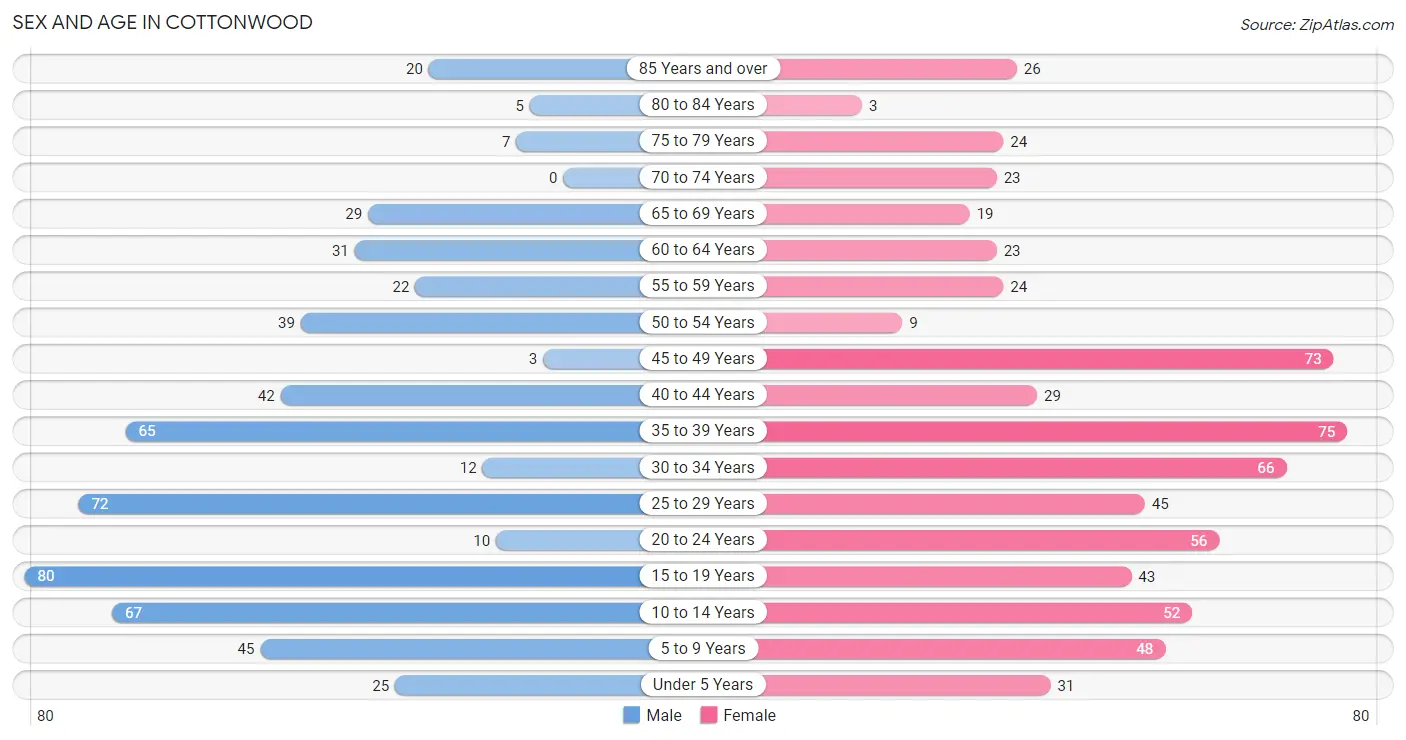
Sex and Age in Cottonwood
The most populous age groups in Cottonwood are 15 to 19 Years (80 | 13.9%) for men and 35 to 39 Years (75 | 11.2%) for women.
| Age Bracket | Male | Female |
| Under 5 Years | 25 (4.4%) | 31 (4.6%) |
| 5 to 9 Years | 45 (7.8%) | 48 (7.2%) |
| 10 to 14 Years | 67 (11.7%) | 52 (7.8%) |
| 15 to 19 Years | 80 (13.9%) | 43 (6.4%) |
| 20 to 24 Years | 10 (1.7%) | 56 (8.4%) |
| 25 to 29 Years | 72 (12.5%) | 45 (6.7%) |
| 30 to 34 Years | 12 (2.1%) | 66 (9.9%) |
| 35 to 39 Years | 65 (11.3%) | 75 (11.2%) |
| 40 to 44 Years | 42 (7.3%) | 29 (4.3%) |
| 45 to 49 Years | 3 (0.5%) | 73 (10.9%) |
| 50 to 54 Years | 39 (6.8%) | 9 (1.3%) |
| 55 to 59 Years | 22 (3.8%) | 24 (3.6%) |
| 60 to 64 Years | 31 (5.4%) | 23 (3.4%) |
| 65 to 69 Years | 29 (5.1%) | 19 (2.8%) |
| 70 to 74 Years | 0 (0.0%) | 23 (3.4%) |
| 75 to 79 Years | 7 (1.2%) | 24 (3.6%) |
| 80 to 84 Years | 5 (0.9%) | 3 (0.4%) |
| 85 Years and over | 20 (3.5%) | 26 (3.9%) |
| Total | 574 (100.0%) | 669 (100.0%) |
Families and Households in Cottonwood
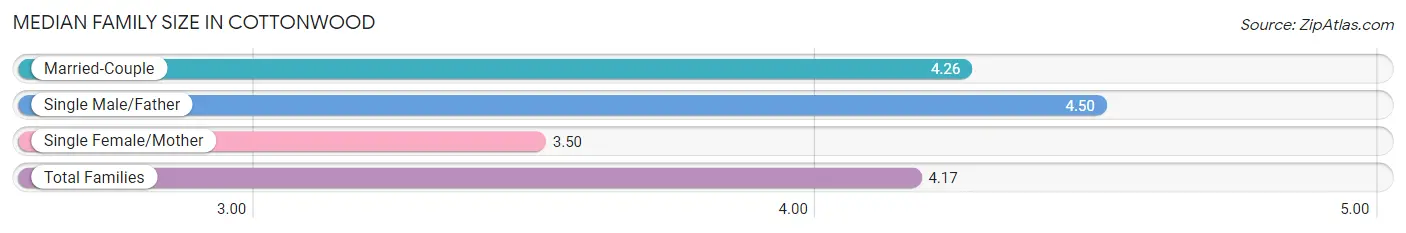
Median Family Size in Cottonwood
The median family size in Cottonwood is 4.17 persons per family, with single male/father families (14 | 5.4%) accounting for the largest median family size of 4.5 persons per family. On the other hand, single female/mother families (34 | 13.1%) represent the smallest median family size with 3.50 persons per family.
| Family Type | # Families | Family Size |
| Married-Couple | 212 (81.5%) | 4.26 |
| Single Male/Father | 14 (5.4%) | 4.50 |
| Single Female/Mother | 34 (13.1%) | 3.50 |
| Total Families | 260 (100.0%) | 4.17 |
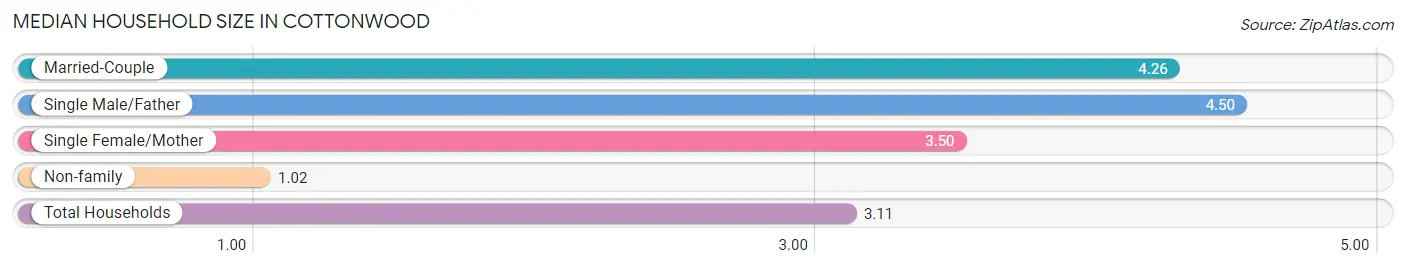
Median Household Size in Cottonwood
The median household size in Cottonwood is 3.11 persons per household, with single male/father households (14 | 3.6%) accounting for the largest median household size of 4.5 persons per household. non-family households (132 | 33.7%) represent the smallest median household size with 1.02 persons per household.
| Household Type | # Households | Household Size |
| Married-Couple | 212 (54.1%) | 4.26 |
| Single Male/Father | 14 (3.6%) | 4.50 |
| Single Female/Mother | 34 (8.7%) | 3.50 |
| Non-family | 132 (33.7%) | 1.02 |
| Total Households | 392 (100.0%) | 3.11 |
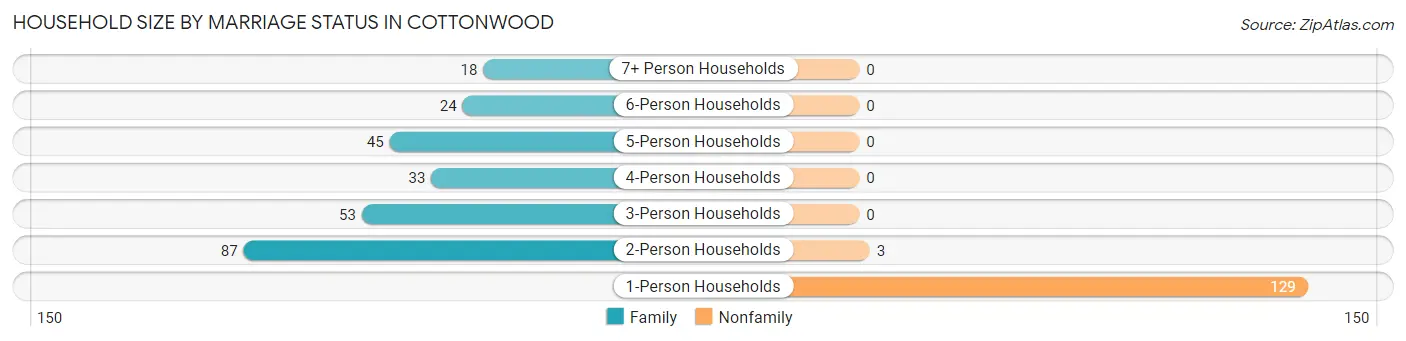
Household Size by Marriage Status in Cottonwood
Out of a total of 392 households in Cottonwood, 260 (66.3%) are family households, while 132 (33.7%) are nonfamily households. The most numerous type of family households are 2-person households, comprising 87, and the most common type of nonfamily households are 1-person households, comprising 129.
| Household Size | Family Households | Nonfamily Households |
| 1-Person Households | - | 129 (32.9%) |
| 2-Person Households | 87 (22.2%) | 3 (0.8%) |
| 3-Person Households | 53 (13.5%) | 0 (0.0%) |
| 4-Person Households | 33 (8.4%) | 0 (0.0%) |
| 5-Person Households | 45 (11.5%) | 0 (0.0%) |
| 6-Person Households | 24 (6.1%) | 0 (0.0%) |
| 7+ Person Households | 18 (4.6%) | 0 (0.0%) |
| Total | 260 (66.3%) | 132 (33.7%) |
Female Fertility in Cottonwood
Fertility by Age in Cottonwood
Average fertility rate in Cottonwood is 72.0 births per 1,000 women. Women in the age bracket of 20 to 34 years have the highest fertility rate with 120.0 births per 1,000 women. Women in the age bracket of 20 to 34 years acount for 71.4% of all women with births.
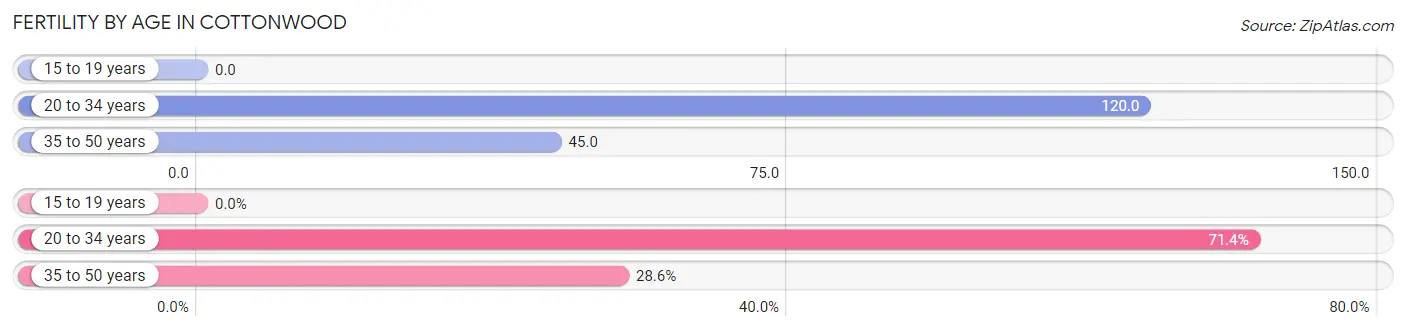
| Age Bracket | Women with Births | Births / 1,000 Women |
| 15 to 19 years | 0 (0.0%) | 0.0 |
| 20 to 34 years | 20 (71.4%) | 120.0 |
| 35 to 50 years | 8 (28.6%) | 45.0 |
| Total | 28 (100.0%) | 72.0 |
Fertility by Age by Marriage Status in Cottonwood
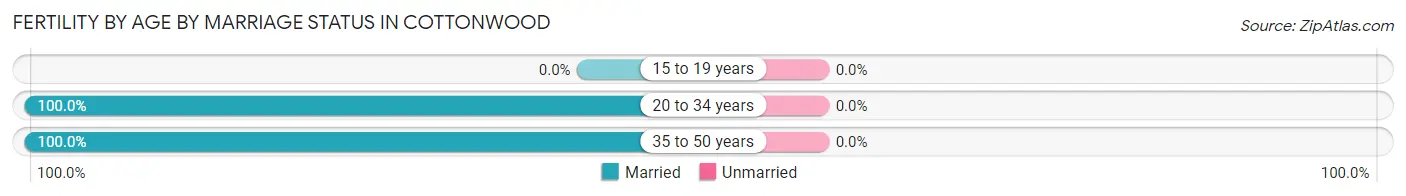
| Age Bracket | Married | Unmarried |
| 15 to 19 years | 0 (0.0%) | 0 (0.0%) |
| 20 to 34 years | 20 (100.0%) | 0 (0.0%) |
| 35 to 50 years | 8 (100.0%) | 0 (0.0%) |
| Total | 28 (100.0%) | 0 (0.0%) |
Fertility by Education in Cottonwood
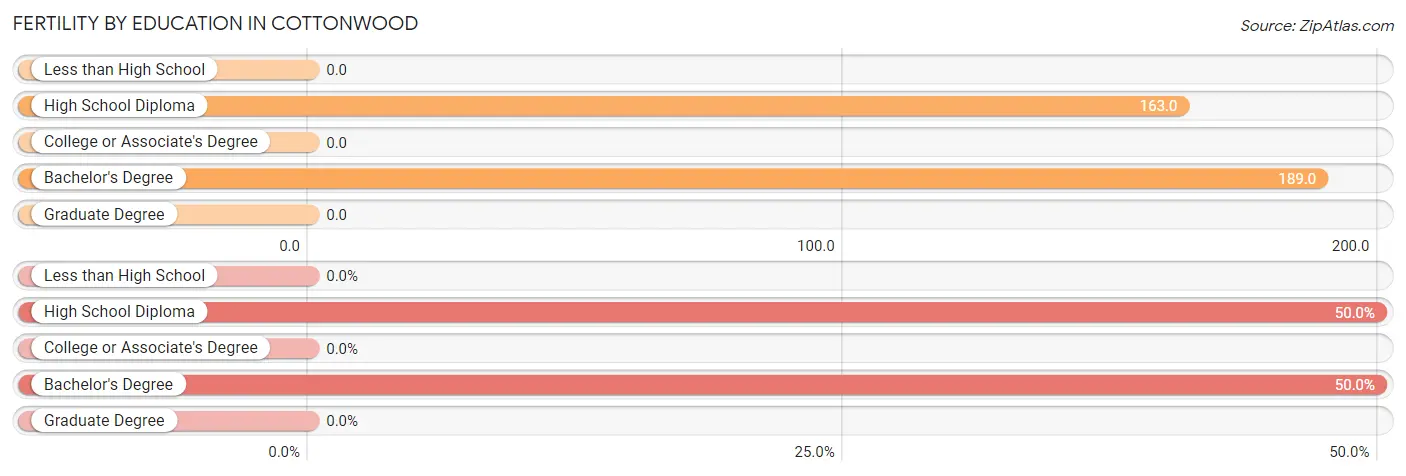
| Educational Attainment | Women with Births | Births / 1,000 Women |
| Less than High School | 0 (0.0%) | 0.0 |
| High School Diploma | 14 (50.0%) | 163.0 |
| College or Associate's Degree | 0 (0.0%) | 0.0 |
| Bachelor's Degree | 14 (50.0%) | 189.0 |
| Graduate Degree | 0 (0.0%) | 0.0 |
| Total | 28 (100.0%) | 72.0 |
Fertility by Education by Marriage Status in Cottonwood
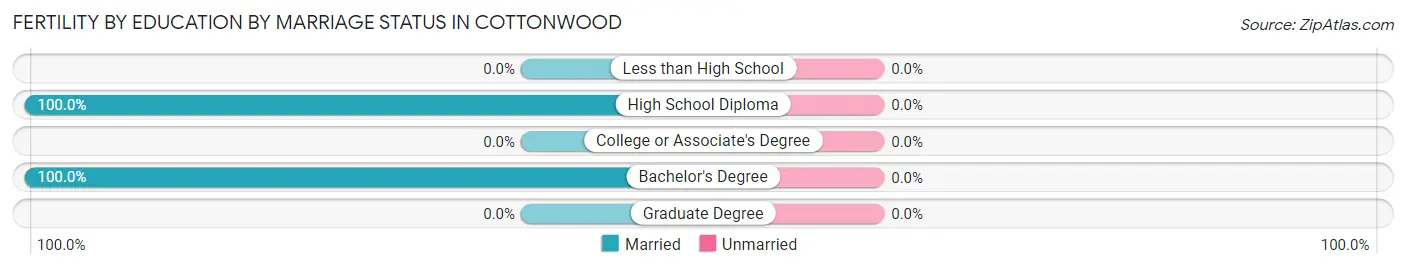
| Educational Attainment | Married | Unmarried |
| Less than High School | 0 (0.0%) | 0 (0.0%) |
| High School Diploma | 14 (100.0%) | 0 (0.0%) |
| College or Associate's Degree | 0 (0.0%) | 0 (0.0%) |
| Bachelor's Degree | 14 (100.0%) | 0 (0.0%) |
| Graduate Degree | 0 (0.0%) | 0 (0.0%) |
| Total | 28 (100.0%) | 0 (0.0%) |
Income in Cottonwood
Income Overview in Cottonwood
Per Capita Income in Cottonwood is $23,579, while median incomes of families and households are $63,833 and $55,147 respectively.
| Characteristic | Number | Measure |
| Per Capita Income | 1,243 | $23,579 |
| Median Family Income | 260 | $63,833 |
| Mean Family Income | 260 | $72,715 |
| Median Household Income | 392 | $55,147 |
| Mean Household Income | 392 | $62,870 |
| Income Deficit | 260 | $0 |
| Wage / Income Gap (%) | 1,243 | 67.97% |
| Wage / Income Gap ($) | 1,243 | 32.03¢ per $1 |
| Gini / Inequality Index | 1,243 | 0.35 |
Earnings by Sex in Cottonwood
Average Earnings in Cottonwood are $38,609, $45,313 for men and $14,516 for women, a difference of 68.0%.
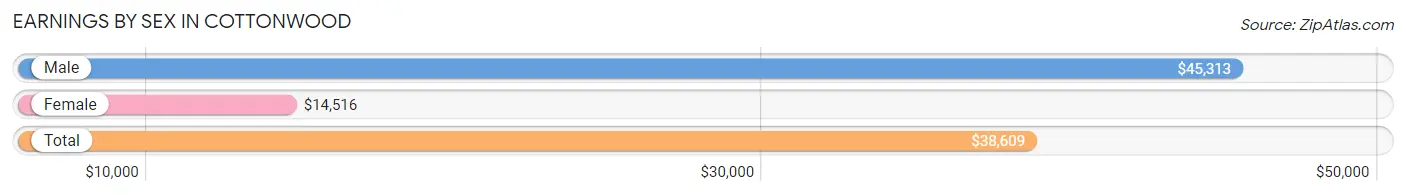
| Sex | Number | Average Earnings |
| Male | 321 (57.8%) | $45,313 |
| Female | 234 (42.2%) | $14,516 |
| Total | 555 (100.0%) | $38,609 |
Earnings by Sex by Income Bracket in Cottonwood
The most common earnings brackets in Cottonwood are $35,000 to $39,999 for men (57 | 17.8%) and $12,500 to $14,999 for women (31 | 13.3%).
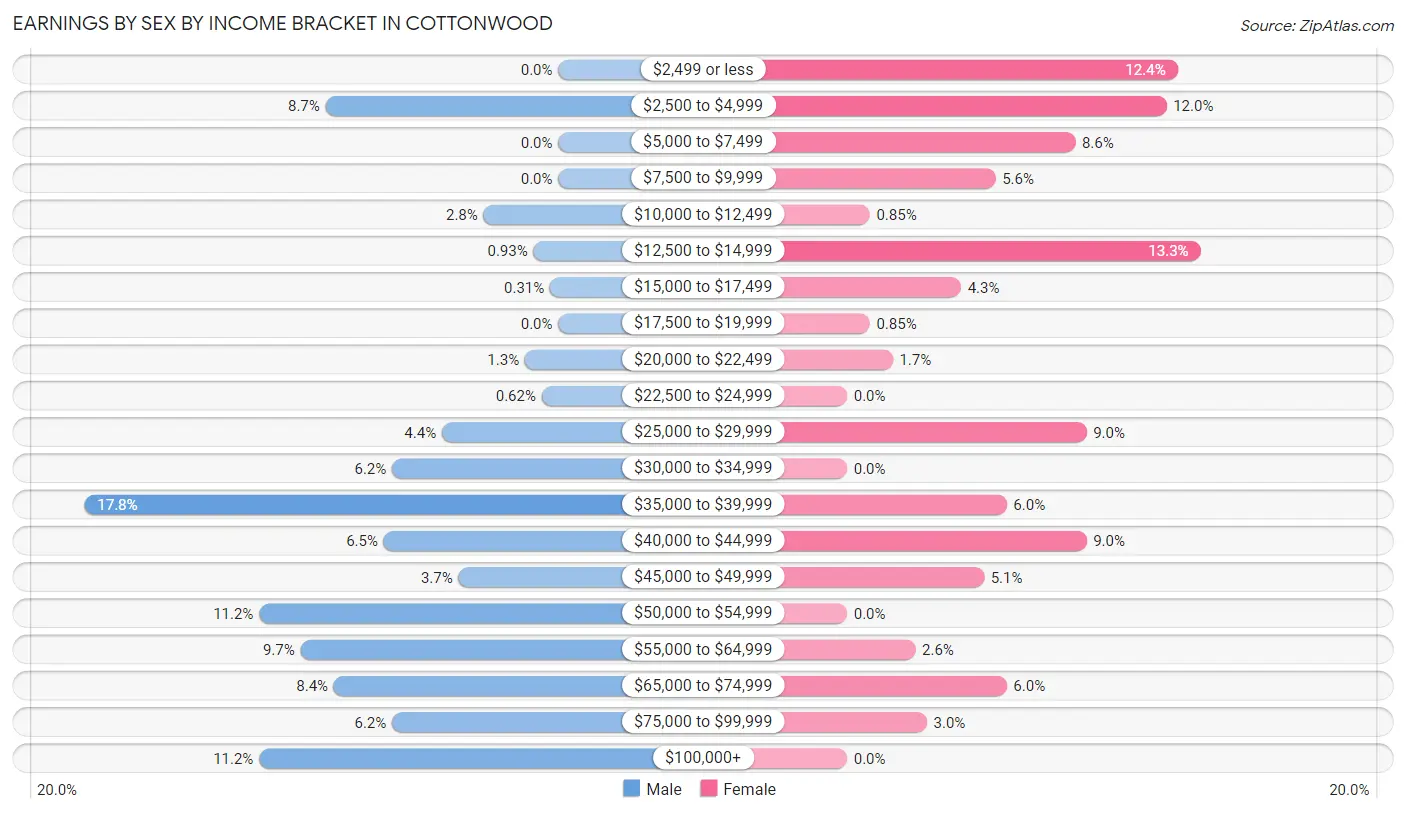
| Income | Male | Female |
| $2,499 or less | 0 (0.0%) | 29 (12.4%) |
| $2,500 to $4,999 | 28 (8.7%) | 28 (12.0%) |
| $5,000 to $7,499 | 0 (0.0%) | 20 (8.6%) |
| $7,500 to $9,999 | 0 (0.0%) | 13 (5.6%) |
| $10,000 to $12,499 | 9 (2.8%) | 2 (0.9%) |
| $12,500 to $14,999 | 3 (0.9%) | 31 (13.3%) |
| $15,000 to $17,499 | 1 (0.3%) | 10 (4.3%) |
| $17,500 to $19,999 | 0 (0.0%) | 2 (0.9%) |
| $20,000 to $22,499 | 4 (1.3%) | 4 (1.7%) |
| $22,500 to $24,999 | 2 (0.6%) | 0 (0.0%) |
| $25,000 to $29,999 | 14 (4.4%) | 21 (9.0%) |
| $30,000 to $34,999 | 20 (6.2%) | 0 (0.0%) |
| $35,000 to $39,999 | 57 (17.8%) | 14 (6.0%) |
| $40,000 to $44,999 | 21 (6.5%) | 21 (9.0%) |
| $45,000 to $49,999 | 12 (3.7%) | 12 (5.1%) |
| $50,000 to $54,999 | 36 (11.2%) | 0 (0.0%) |
| $55,000 to $64,999 | 31 (9.7%) | 6 (2.6%) |
| $65,000 to $74,999 | 27 (8.4%) | 14 (6.0%) |
| $75,000 to $99,999 | 20 (6.2%) | 7 (3.0%) |
| $100,000+ | 36 (11.2%) | 0 (0.0%) |
| Total | 321 (100.0%) | 234 (100.0%) |
Earnings by Sex by Educational Attainment in Cottonwood
Average earnings in Cottonwood are $50,664 for men and $14,839 for women, a difference of 70.7%. Men with an educational attainment of bachelor's degree enjoy the highest average annual earnings of $55,982, while those with less than high school education earn the least with $39,095. Women with an educational attainment of graduate degree earn the most with the average annual earnings of $83,125, while those with high school diploma education have the smallest earnings of $14,000.
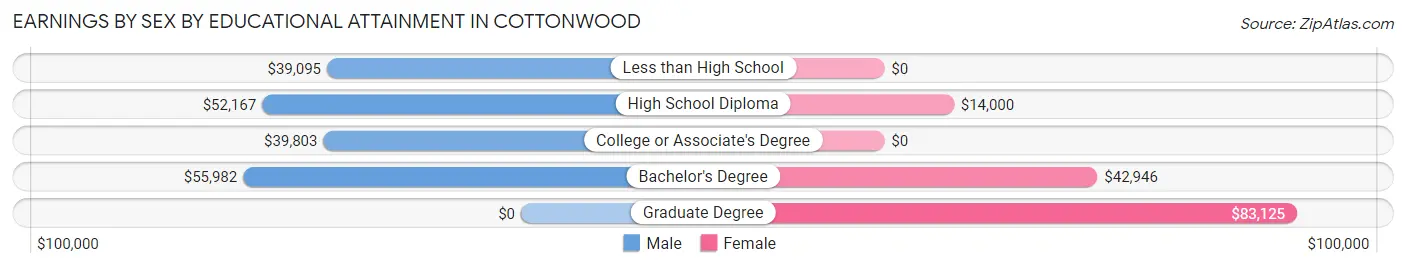
| Educational Attainment | Male Income | Female Income |
| Less than High School | $39,095 | $0 |
| High School Diploma | $52,167 | $14,000 |
| College or Associate's Degree | $39,803 | $0 |
| Bachelor's Degree | $55,982 | $42,946 |
| Graduate Degree | - | - |
| Total | $50,664 | $14,839 |
Family Income in Cottonwood
Family Income Brackets in Cottonwood
According to the Cottonwood family income data, there are 72 families falling into the $75,000 to $99,999 income range, which is the most common income bracket and makes up 27.7% of all families.
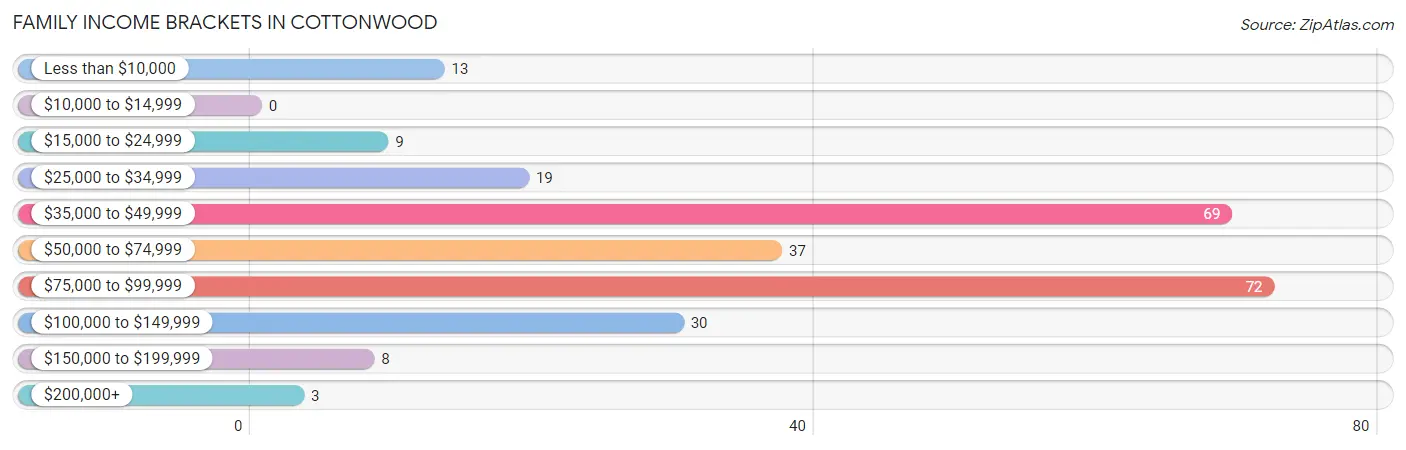
| Income Bracket | # Families | % Families |
| Less than $10,000 | 13 | 5.0% |
| $10,000 to $14,999 | 0 | 0.0% |
| $15,000 to $24,999 | 9 | 3.5% |
| $25,000 to $34,999 | 19 | 7.3% |
| $35,000 to $49,999 | 69 | 26.5% |
| $50,000 to $74,999 | 37 | 14.2% |
| $75,000 to $99,999 | 72 | 27.7% |
| $100,000 to $149,999 | 30 | 11.5% |
| $150,000 to $199,999 | 8 | 3.1% |
| $200,000+ | 3 | 1.2% |
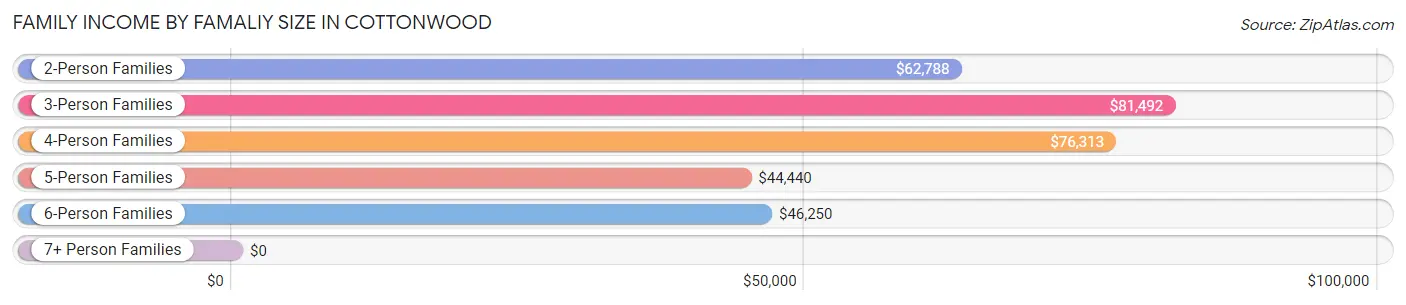
Family Income by Famaliy Size in Cottonwood
3-person families (53 | 20.4%) account for the highest median family income in Cottonwood with $81,492 per family, while 2-person families (87 | 33.5%) have the highest median income of $31,394 per family member.
| Income Bracket | # Families | Median Income |
| 2-Person Families | 87 (33.5%) | $62,788 |
| 3-Person Families | 53 (20.4%) | $81,492 |
| 4-Person Families | 33 (12.7%) | $76,313 |
| 5-Person Families | 45 (17.3%) | $44,440 |
| 6-Person Families | 24 (9.2%) | $46,250 |
| 7+ Person Families | 18 (6.9%) | $0 |
| Total | 260 (100.0%) | $63,833 |
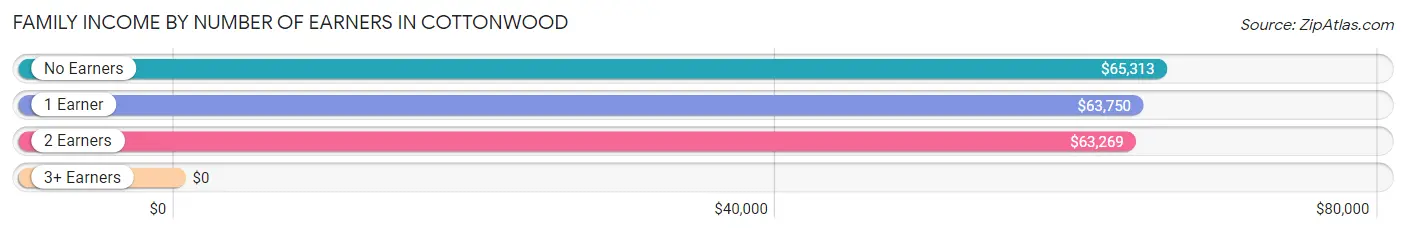
Family Income by Number of Earners in Cottonwood
| Number of Earners | # Families | Median Income |
| No Earners | 17 (6.5%) | $65,313 |
| 1 Earner | 68 (26.2%) | $63,750 |
| 2 Earners | 170 (65.4%) | $63,269 |
| 3+ Earners | 5 (1.9%) | $0 |
| Total | 260 (100.0%) | $63,833 |
Household Income in Cottonwood
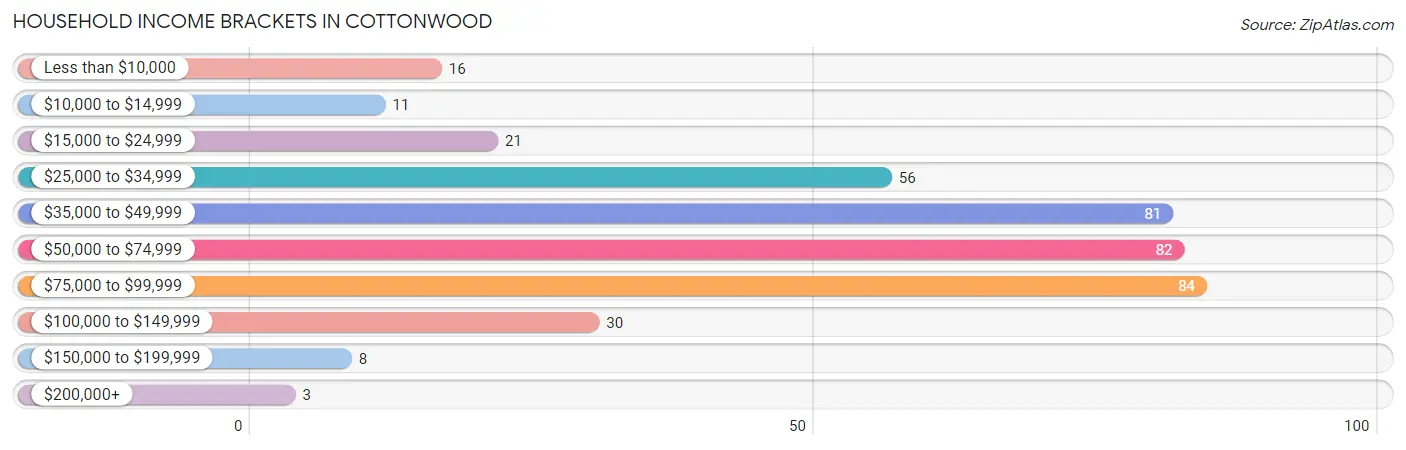
Household Income Brackets in Cottonwood
With 84 households falling in the category, the $75,000 to $99,999 income range is the most frequent in Cottonwood, accounting for 21.4% of all households. In contrast, only 3 households (0.8%) fall into the $200,000+ income bracket, making it the least populous group.
| Income Bracket | # Households | % Households |
| Less than $10,000 | 16 | 4.1% |
| $10,000 to $14,999 | 11 | 2.8% |
| $15,000 to $24,999 | 21 | 5.4% |
| $25,000 to $34,999 | 56 | 14.3% |
| $35,000 to $49,999 | 81 | 20.7% |
| $50,000 to $74,999 | 82 | 20.9% |
| $75,000 to $99,999 | 84 | 21.4% |
| $100,000 to $149,999 | 30 | 7.7% |
| $150,000 to $199,999 | 8 | 2.0% |
| $200,000+ | 3 | 0.8% |
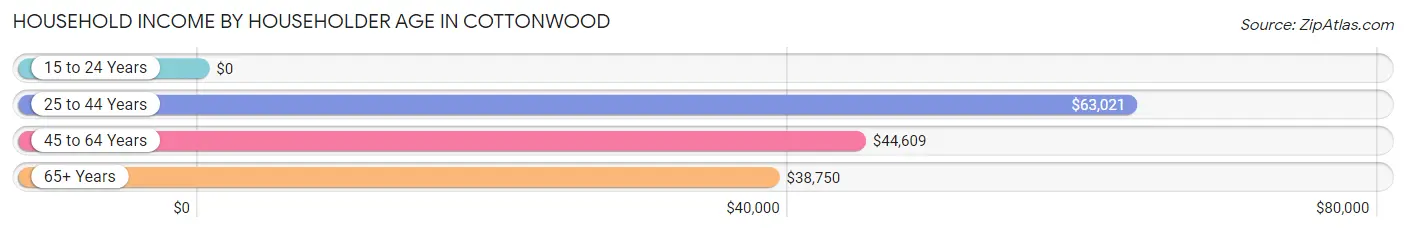
Household Income by Householder Age in Cottonwood
The median household income in Cottonwood is $55,147, with the highest median household income of $63,021 found in the 25 to 44 years age bracket for the primary householder. A total of 163 households (41.6%) fall into this category. Meanwhile, the 15 to 24 years age bracket for the primary householder has the lowest median household income of $0, with 11 households (2.8%) in this group.
| Income Bracket | # Households | Median Income |
| 15 to 24 Years | 11 (2.8%) | $0 |
| 25 to 44 Years | 163 (41.6%) | $63,021 |
| 45 to 64 Years | 86 (21.9%) | $44,609 |
| 65+ Years | 132 (33.7%) | $38,750 |
| Total | 392 (100.0%) | $55,147 |
Poverty in Cottonwood
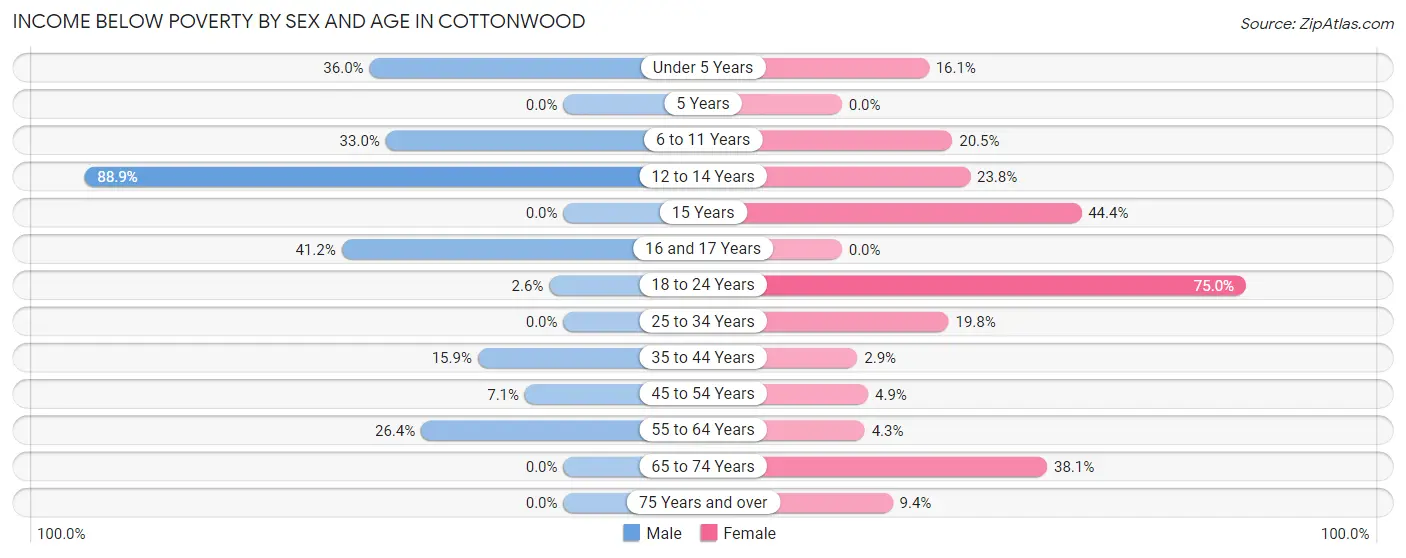
Income Below Poverty by Sex and Age in Cottonwood
With 17.1% poverty level for males and 19.0% for females among the residents of Cottonwood, 12 to 14 year old males and 18 to 24 year old females are the most vulnerable to poverty, with 16 males (88.9%) and 45 females (75.0%) in their respective age groups living below the poverty level.
| Age Bracket | Male | Female |
| Under 5 Years | 9 (36.0%) | 5 (16.1%) |
| 5 Years | 0 (0.0%) | 0 (0.0%) |
| 6 to 11 Years | 31 (33.0%) | 16 (20.5%) |
| 12 to 14 Years | 16 (88.9%) | 5 (23.8%) |
| 15 Years | 0 (0.0%) | 4 (44.4%) |
| 16 and 17 Years | 7 (41.2%) | 0 (0.0%) |
| 18 to 24 Years | 1 (2.6%) | 45 (75.0%) |
| 25 to 34 Years | 0 (0.0%) | 22 (19.8%) |
| 35 to 44 Years | 17 (15.9%) | 3 (2.9%) |
| 45 to 54 Years | 3 (7.1%) | 4 (4.9%) |
| 55 to 64 Years | 14 (26.4%) | 2 (4.3%) |
| 65 to 74 Years | 0 (0.0%) | 16 (38.1%) |
| 75 Years and over | 0 (0.0%) | 5 (9.4%) |
| Total | 98 (17.1%) | 127 (19.0%) |
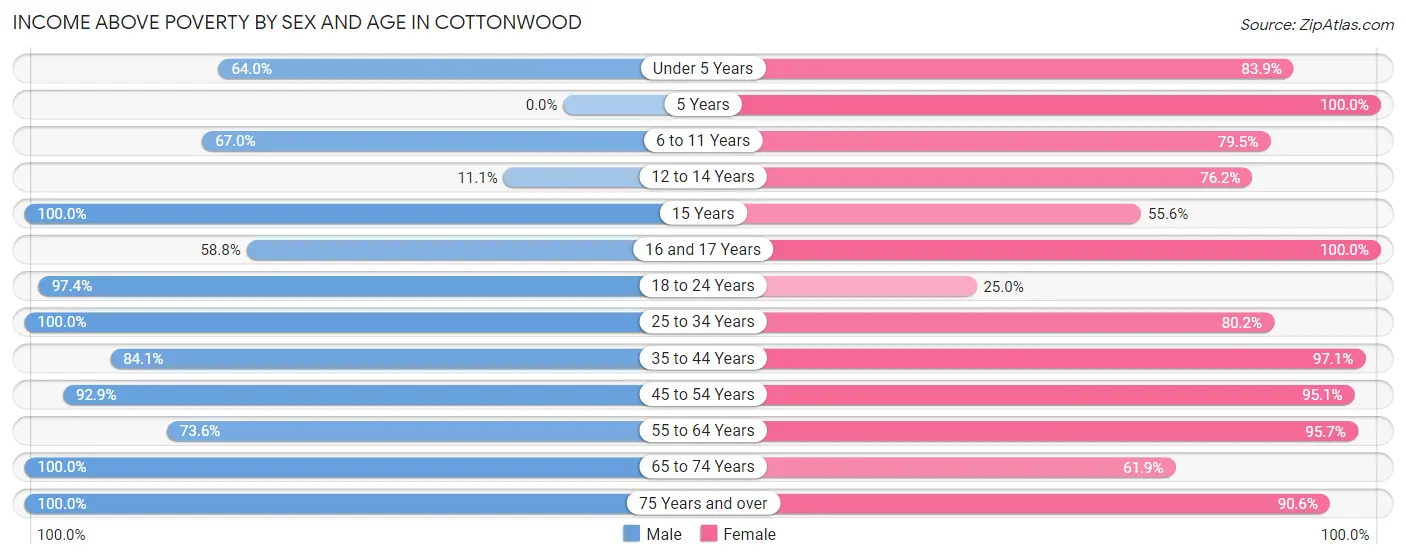
Income Above Poverty by Sex and Age in Cottonwood
According to the poverty statistics in Cottonwood, males aged 15 years and females aged 5 years are the age groups that are most secure financially, with 100.0% of males and 100.0% of females in these age groups living above the poverty line.
| Age Bracket | Male | Female |
| Under 5 Years | 16 (64.0%) | 26 (83.9%) |
| 5 Years | 0 (0.0%) | 1 (100.0%) |
| 6 to 11 Years | 63 (67.0%) | 62 (79.5%) |
| 12 to 14 Years | 2 (11.1%) | 16 (76.2%) |
| 15 Years | 35 (100.0%) | 5 (55.6%) |
| 16 and 17 Years | 10 (58.8%) | 30 (100.0%) |
| 18 to 24 Years | 37 (97.4%) | 15 (25.0%) |
| 25 to 34 Years | 84 (100.0%) | 89 (80.2%) |
| 35 to 44 Years | 90 (84.1%) | 101 (97.1%) |
| 45 to 54 Years | 39 (92.9%) | 78 (95.1%) |
| 55 to 64 Years | 39 (73.6%) | 45 (95.7%) |
| 65 to 74 Years | 29 (100.0%) | 26 (61.9%) |
| 75 Years and over | 32 (100.0%) | 48 (90.6%) |
| Total | 476 (82.9%) | 542 (81.0%) |
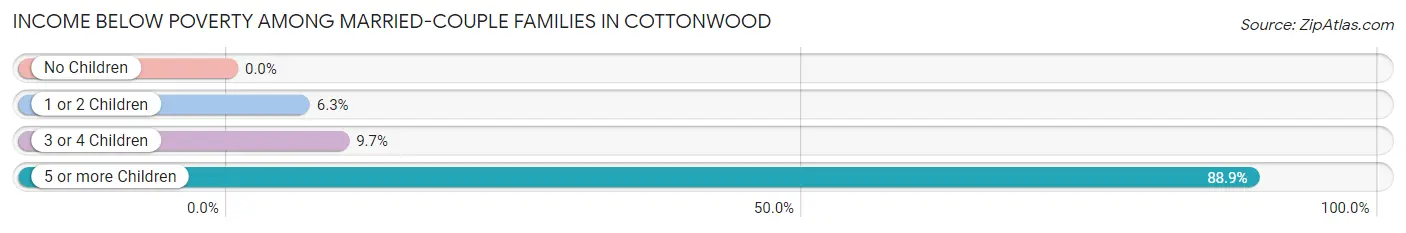
Income Below Poverty Among Married-Couple Families in Cottonwood
The poverty statistics for married-couple families in Cottonwood show that 11.8% or 25 of the total 212 families live below the poverty line. Families with 5 or more children have the highest poverty rate of 88.9%, comprising of 16 families. On the other hand, families with no children have the lowest poverty rate of 0.0%, which includes 0 families.
| Children | Above Poverty | Below Poverty |
| No Children | 67 (100.0%) | 0 (0.0%) |
| 1 or 2 Children | 90 (93.8%) | 6 (6.2%) |
| 3 or 4 Children | 28 (90.3%) | 3 (9.7%) |
| 5 or more Children | 2 (11.1%) | 16 (88.9%) |
| Total | 187 (88.2%) | 25 (11.8%) |
Income Below Poverty Among Single-Parent Households in Cottonwood
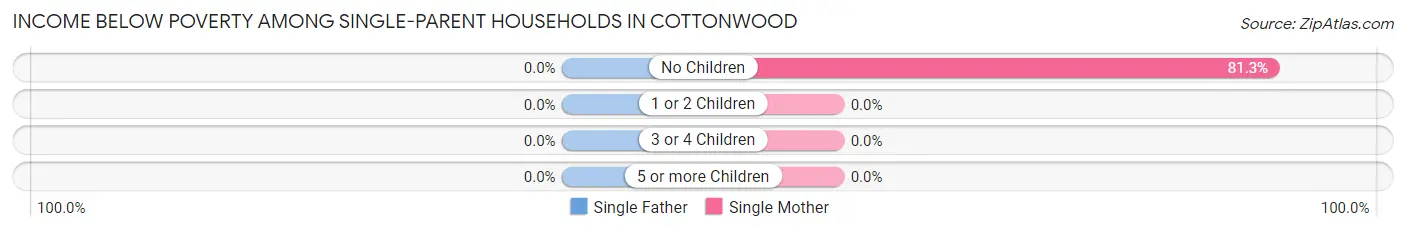
| Children | Single Father | Single Mother |
| No Children | 0 (0.0%) | 13 (81.2%) |
| 1 or 2 Children | 0 (0.0%) | 0 (0.0%) |
| 3 or 4 Children | 0 (0.0%) | 0 (0.0%) |
| 5 or more Children | 0 (0.0%) | 0 (0.0%) |
| Total | 0 (0.0%) | 13 (38.2%) |
Income Below Poverty Among Married-Couple vs Single-Parent Households in Cottonwood
The poverty data for Cottonwood shows that 25 of the married-couple family households (11.8%) and 13 of the single-parent households (27.1%) are living below the poverty level. Within the married-couple family households, those with 5 or more children have the highest poverty rate, with 16 households (88.9%) falling below the poverty line. Among the single-parent households, those with no children have the highest poverty rate, with 13 household (43.3%) living below poverty.
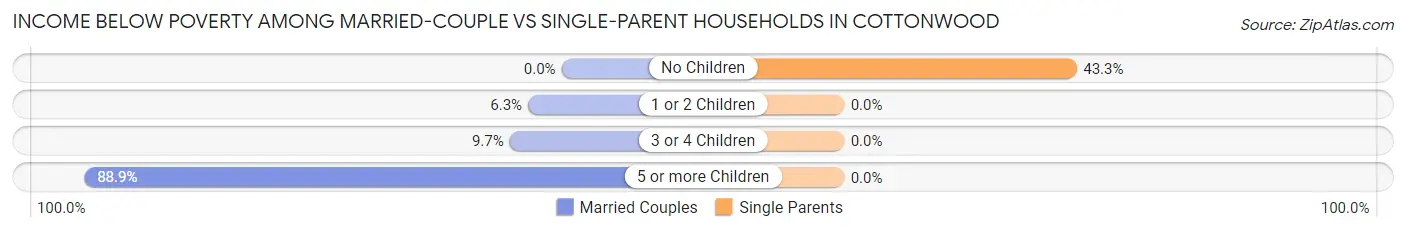
| Children | Married-Couple Families | Single-Parent Households |
| No Children | 0 (0.0%) | 13 (43.3%) |
| 1 or 2 Children | 6 (6.2%) | 0 (0.0%) |
| 3 or 4 Children | 3 (9.7%) | 0 (0.0%) |
| 5 or more Children | 16 (88.9%) | 0 (0.0%) |
| Total | 25 (11.8%) | 13 (27.1%) |
Employment Characteristics in Cottonwood
Employment by Class of Employer in Cottonwood
Among the 459 employed individuals in Cottonwood, private company employees (341 | 74.3%), state government employees (37 | 8.1%), and self-employed (incorporated) (24 | 5.2%) make up the most common classes of employment.
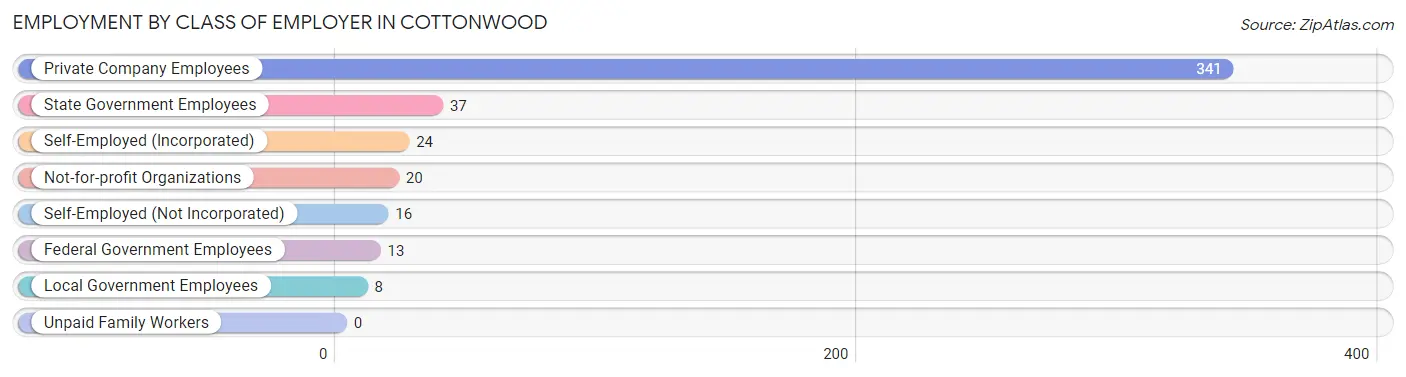
| Employer Class | # Employees | % Employees |
| Private Company Employees | 341 | 74.3% |
| Self-Employed (Incorporated) | 24 | 5.2% |
| Self-Employed (Not Incorporated) | 16 | 3.5% |
| Not-for-profit Organizations | 20 | 4.4% |
| Local Government Employees | 8 | 1.7% |
| State Government Employees | 37 | 8.1% |
| Federal Government Employees | 13 | 2.8% |
| Unpaid Family Workers | 0 | 0.0% |
| Total | 459 | 100.0% |
Employment Status by Age in Cottonwood
According to the labor force statistics for Cottonwood, out of the total population over 16 years of age (931), 56.2% or 523 individuals are in the labor force, with 10.9% or 57 of them unemployed. The age group with the highest labor force participation rate is 25 to 29 years, with 90.6% or 106 individuals in the labor force. Within the labor force, the 20 to 24 years age range has the highest percentage of unemployed individuals, with 81.8% or 45 of them being unemployed.
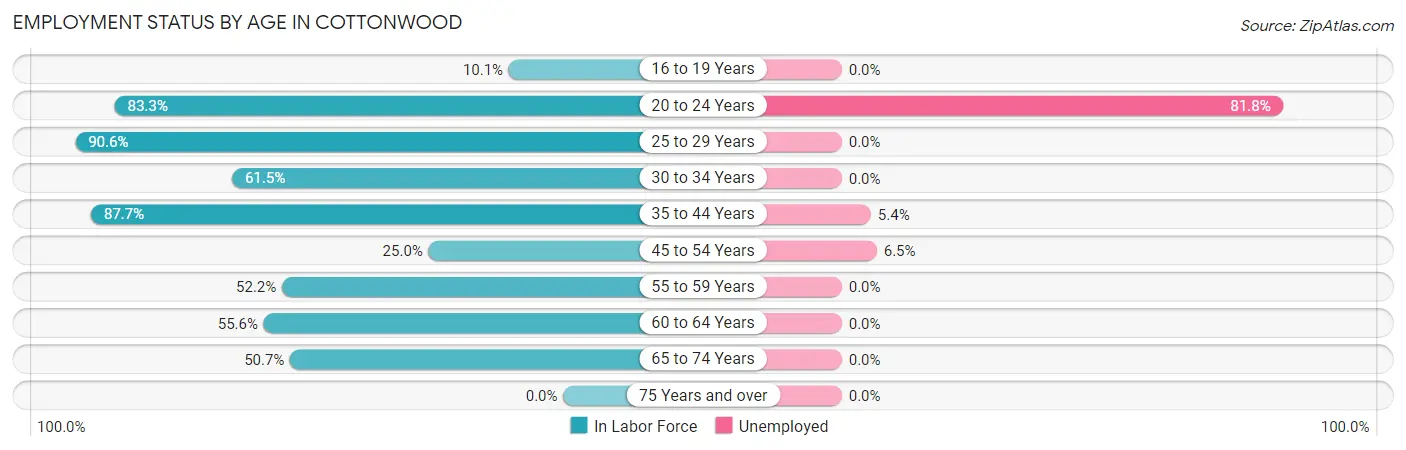
| Age Bracket | In Labor Force | Unemployed |
| 16 to 19 Years | 8 (10.1%) | 0 (0.0%) |
| 20 to 24 Years | 55 (83.3%) | 45 (81.8%) |
| 25 to 29 Years | 106 (90.6%) | 0 (0.0%) |
| 30 to 34 Years | 48 (61.5%) | 0 (0.0%) |
| 35 to 44 Years | 185 (87.7%) | 10 (5.4%) |
| 45 to 54 Years | 31 (25.0%) | 2 (6.5%) |
| 55 to 59 Years | 24 (52.2%) | 0 (0.0%) |
| 60 to 64 Years | 30 (55.6%) | 0 (0.0%) |
| 65 to 74 Years | 36 (50.7%) | 0 (0.0%) |
| 75 Years and over | 0 (0.0%) | 0 (0.0%) |
| Total | 523 (56.2%) | 57 (10.9%) |
Employment Status by Educational Attainment in Cottonwood
According to labor force statistics for Cottonwood, 67.3% of individuals (424) out of the total population between 25 and 64 years of age (630) are in the labor force, with 2.8% or 12 of them being unemployed. The group with the highest labor force participation rate are those with the educational attainment of bachelor's degree or higher, with 90.2% or 120 individuals in the labor force. Within the labor force, individuals with bachelor's degree or higher education have the highest percentage of unemployment, with 8.3% or 10 of them being unemployed.
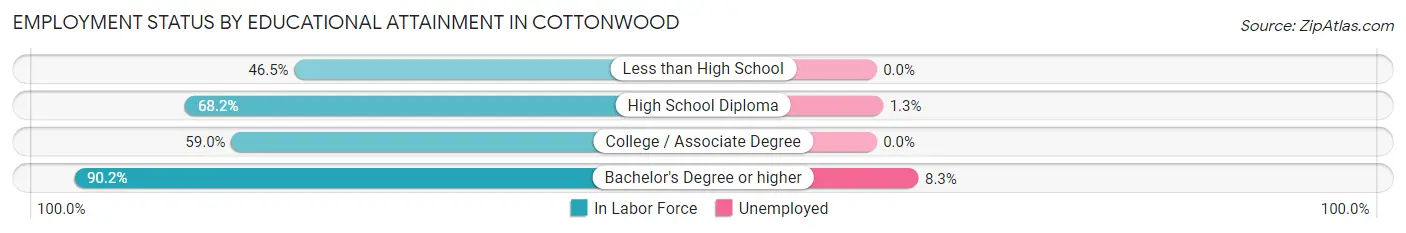
| Educational Attainment | In Labor Force | Unemployed |
| Less than High School | 40 (46.5%) | 0 (0.0%) |
| High School Diploma | 159 (68.2%) | 3 (1.3%) |
| College / Associate Degree | 105 (59.0%) | 0 (0.0%) |
| Bachelor's Degree or higher | 120 (90.2%) | 11 (8.3%) |
| Total | 424 (67.3%) | 18 (2.8%) |
Employment Occupations by Sex in Cottonwood
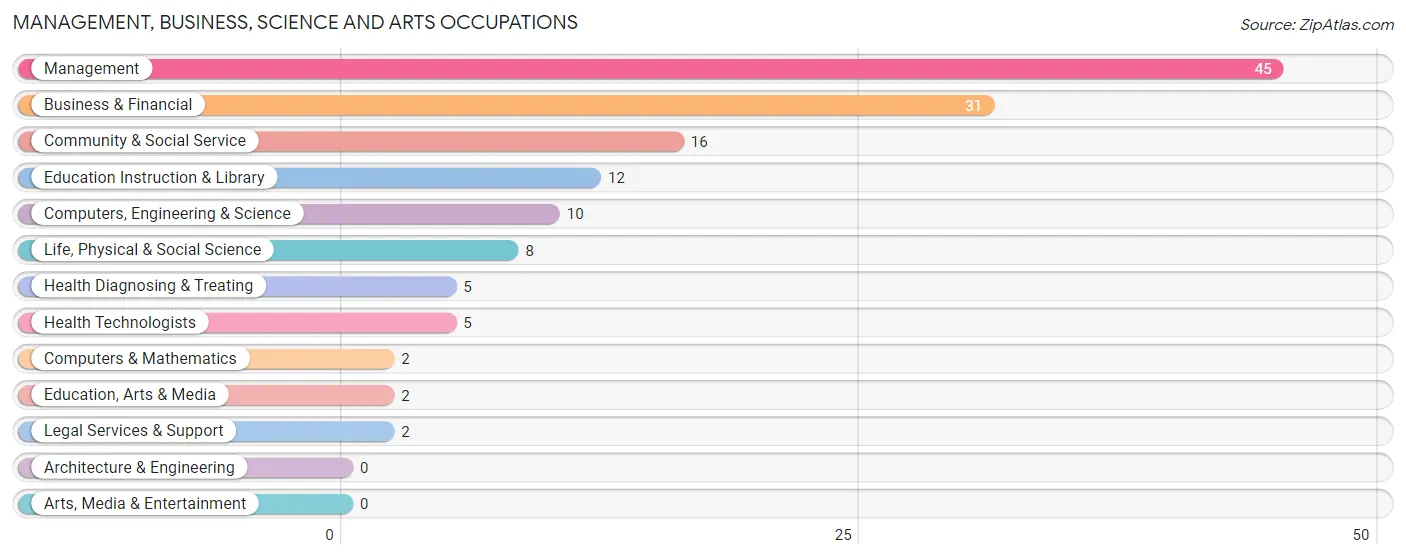
Management, Business, Science and Arts Occupations
The most common Management, Business, Science and Arts occupations in Cottonwood are Management (45 | 9.7%), Business & Financial (31 | 6.7%), Community & Social Service (16 | 3.4%), Education Instruction & Library (12 | 2.6%), and Computers, Engineering & Science (10 | 2.1%).
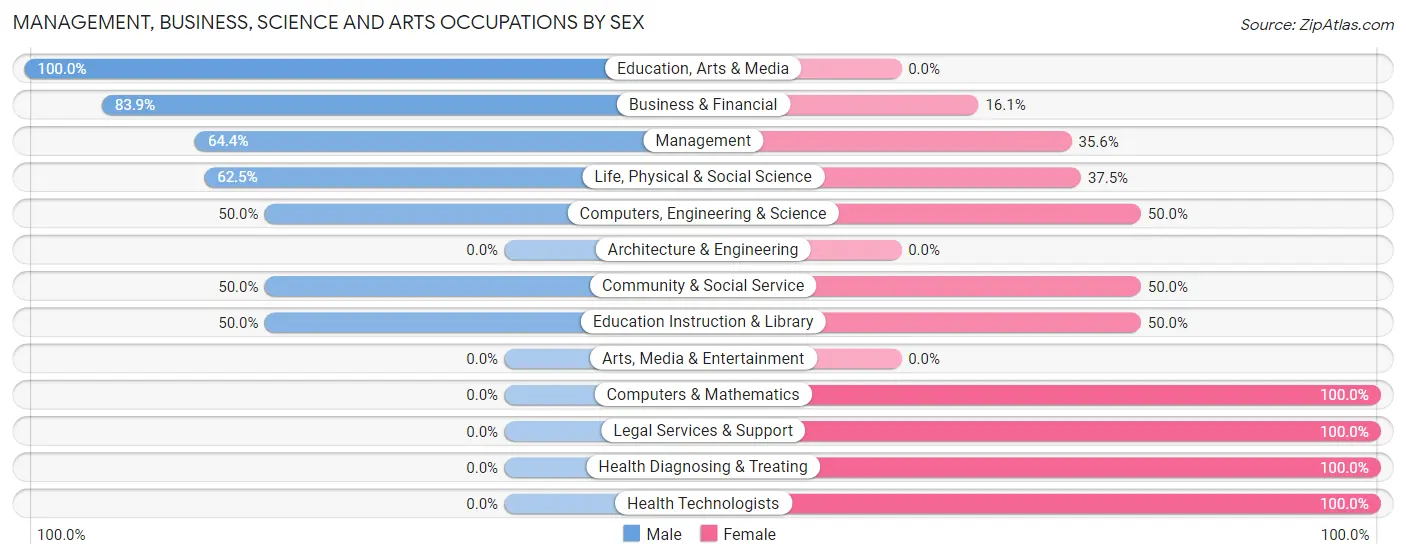
Management, Business, Science and Arts Occupations by Sex
Within the Management, Business, Science and Arts occupations in Cottonwood, the most male-oriented occupations are Education, Arts & Media (100.0%), Business & Financial (83.9%), and Management (64.4%), while the most female-oriented occupations are Computers & Mathematics (100.0%), Legal Services & Support (100.0%), and Health Diagnosing & Treating (100.0%).
| Occupation | Male | Female |
| Management | 29 (64.4%) | 16 (35.6%) |
| Business & Financial | 26 (83.9%) | 5 (16.1%) |
| Computers, Engineering & Science | 5 (50.0%) | 5 (50.0%) |
| Computers & Mathematics | 0 (0.0%) | 2 (100.0%) |
| Architecture & Engineering | 0 (0.0%) | 0 (0.0%) |
| Life, Physical & Social Science | 5 (62.5%) | 3 (37.5%) |
| Community & Social Service | 8 (50.0%) | 8 (50.0%) |
| Education, Arts & Media | 2 (100.0%) | 0 (0.0%) |
| Legal Services & Support | 0 (0.0%) | 2 (100.0%) |
| Education Instruction & Library | 6 (50.0%) | 6 (50.0%) |
| Arts, Media & Entertainment | 0 (0.0%) | 0 (0.0%) |
| Health Diagnosing & Treating | 0 (0.0%) | 5 (100.0%) |
| Health Technologists | 0 (0.0%) | 5 (100.0%) |
| Total (Category) | 68 (63.5%) | 39 (36.4%) |
| Total (Overall) | 264 (56.7%) | 202 (43.3%) |
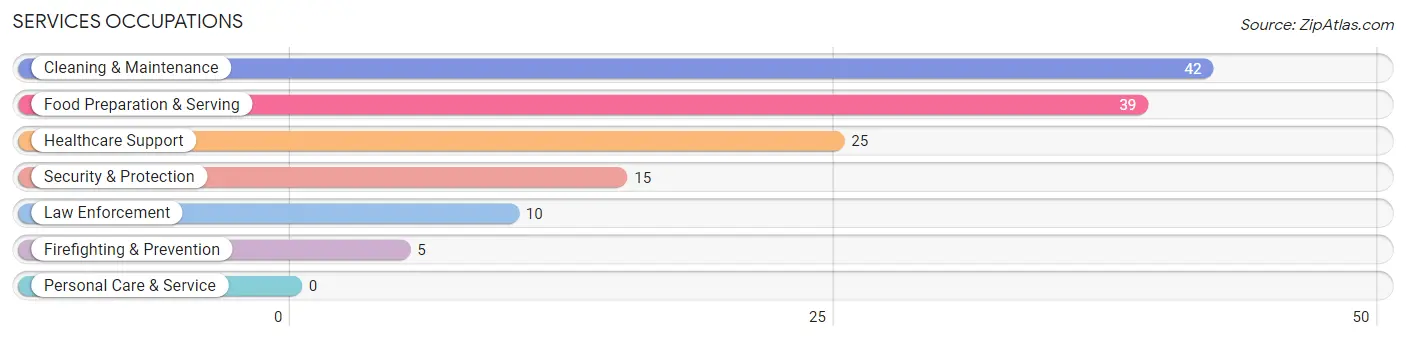
Services Occupations
The most common Services occupations in Cottonwood are Cleaning & Maintenance (42 | 9.0%), Food Preparation & Serving (39 | 8.4%), Healthcare Support (25 | 5.4%), Security & Protection (15 | 3.2%), and Law Enforcement (10 | 2.1%).
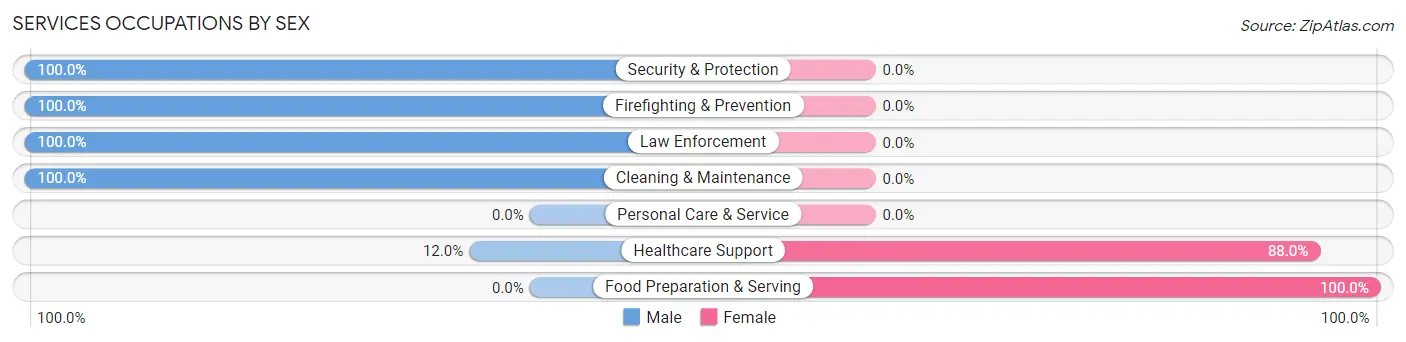
Services Occupations by Sex
Within the Services occupations in Cottonwood, the most male-oriented occupations are Security & Protection (100.0%), Firefighting & Prevention (100.0%), and Law Enforcement (100.0%), while the most female-oriented occupations are Food Preparation & Serving (100.0%), and Healthcare Support (88.0%).
| Occupation | Male | Female |
| Healthcare Support | 3 (12.0%) | 22 (88.0%) |
| Security & Protection | 15 (100.0%) | 0 (0.0%) |
| Firefighting & Prevention | 5 (100.0%) | 0 (0.0%) |
| Law Enforcement | 10 (100.0%) | 0 (0.0%) |
| Food Preparation & Serving | 0 (0.0%) | 39 (100.0%) |
| Cleaning & Maintenance | 42 (100.0%) | 0 (0.0%) |
| Personal Care & Service | 0 (0.0%) | 0 (0.0%) |
| Total (Category) | 60 (49.6%) | 61 (50.4%) |
| Total (Overall) | 264 (56.7%) | 202 (43.3%) |
Sales and Office Occupations
The most common Sales and Office occupations in Cottonwood are Sales & Related (53 | 11.4%), and Office & Administration (46 | 9.9%).
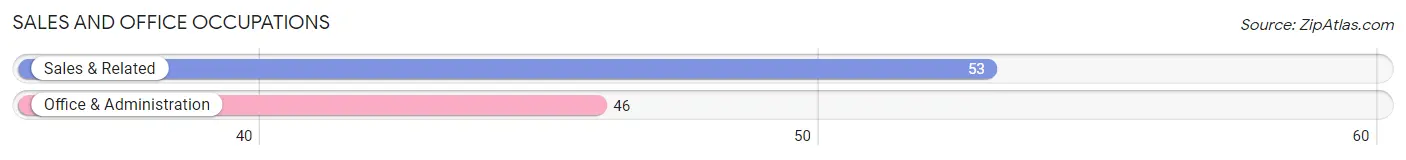
Sales and Office Occupations by Sex
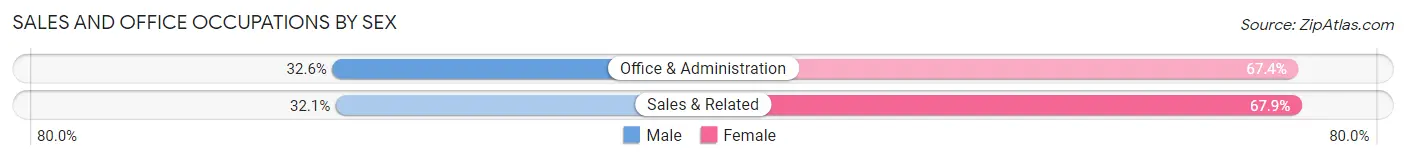
| Occupation | Male | Female |
| Sales & Related | 17 (32.1%) | 36 (67.9%) |
| Office & Administration | 15 (32.6%) | 31 (67.4%) |
| Total (Category) | 32 (32.3%) | 67 (67.7%) |
| Total (Overall) | 264 (56.7%) | 202 (43.3%) |
Natural Resources, Construction and Maintenance Occupations
The most common Natural Resources, Construction and Maintenance occupations in Cottonwood are Farming, Fishing & Forestry (24 | 5.1%), Construction & Extraction (17 | 3.6%), and Installation, Maintenance & Repair (13 | 2.8%).
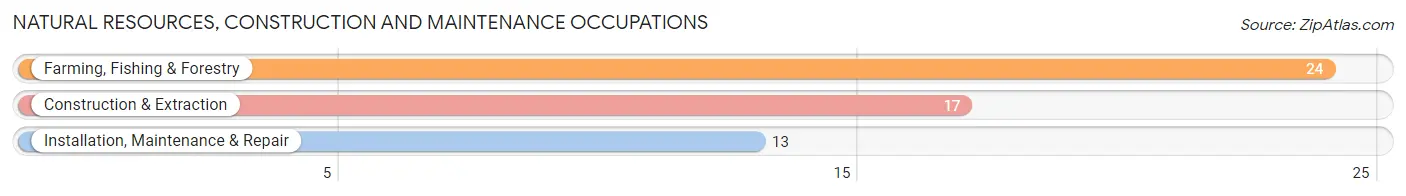
Natural Resources, Construction and Maintenance Occupations by Sex
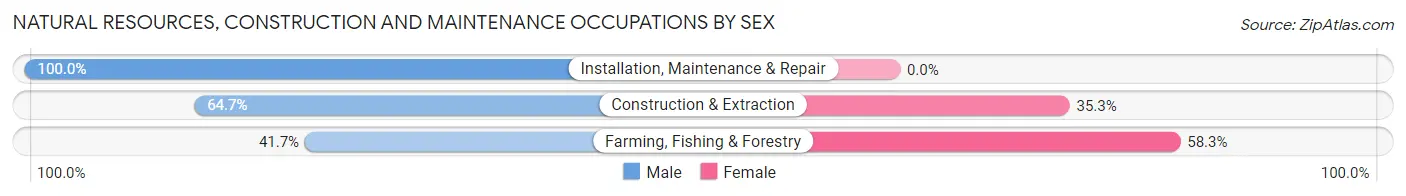
| Occupation | Male | Female |
| Farming, Fishing & Forestry | 10 (41.7%) | 14 (58.3%) |
| Construction & Extraction | 11 (64.7%) | 6 (35.3%) |
| Installation, Maintenance & Repair | 13 (100.0%) | 0 (0.0%) |
| Total (Category) | 34 (63.0%) | 20 (37.0%) |
| Total (Overall) | 264 (56.7%) | 202 (43.3%) |
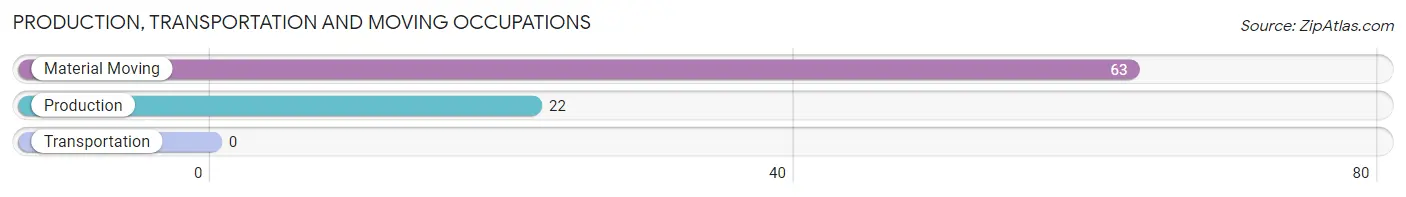
Production, Transportation and Moving Occupations
The most common Production, Transportation and Moving occupations in Cottonwood are Material Moving (63 | 13.5%), and Production (22 | 4.7%).
Production, Transportation and Moving Occupations by Sex
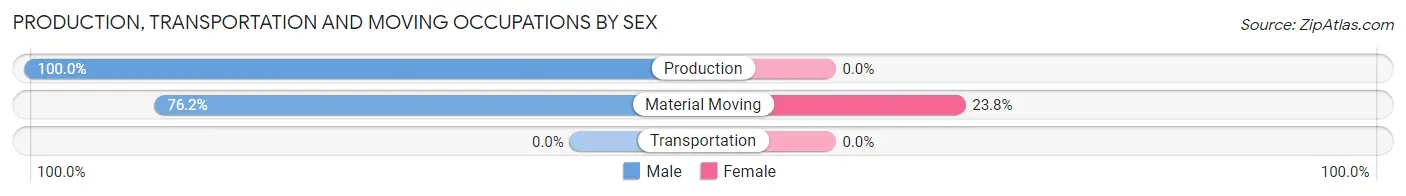
| Occupation | Male | Female |
| Production | 22 (100.0%) | 0 (0.0%) |
| Transportation | 0 (0.0%) | 0 (0.0%) |
| Material Moving | 48 (76.2%) | 15 (23.8%) |
| Total (Category) | 70 (82.4%) | 15 (17.6%) |
| Total (Overall) | 264 (56.7%) | 202 (43.3%) |
Employment Industries by Sex in Cottonwood
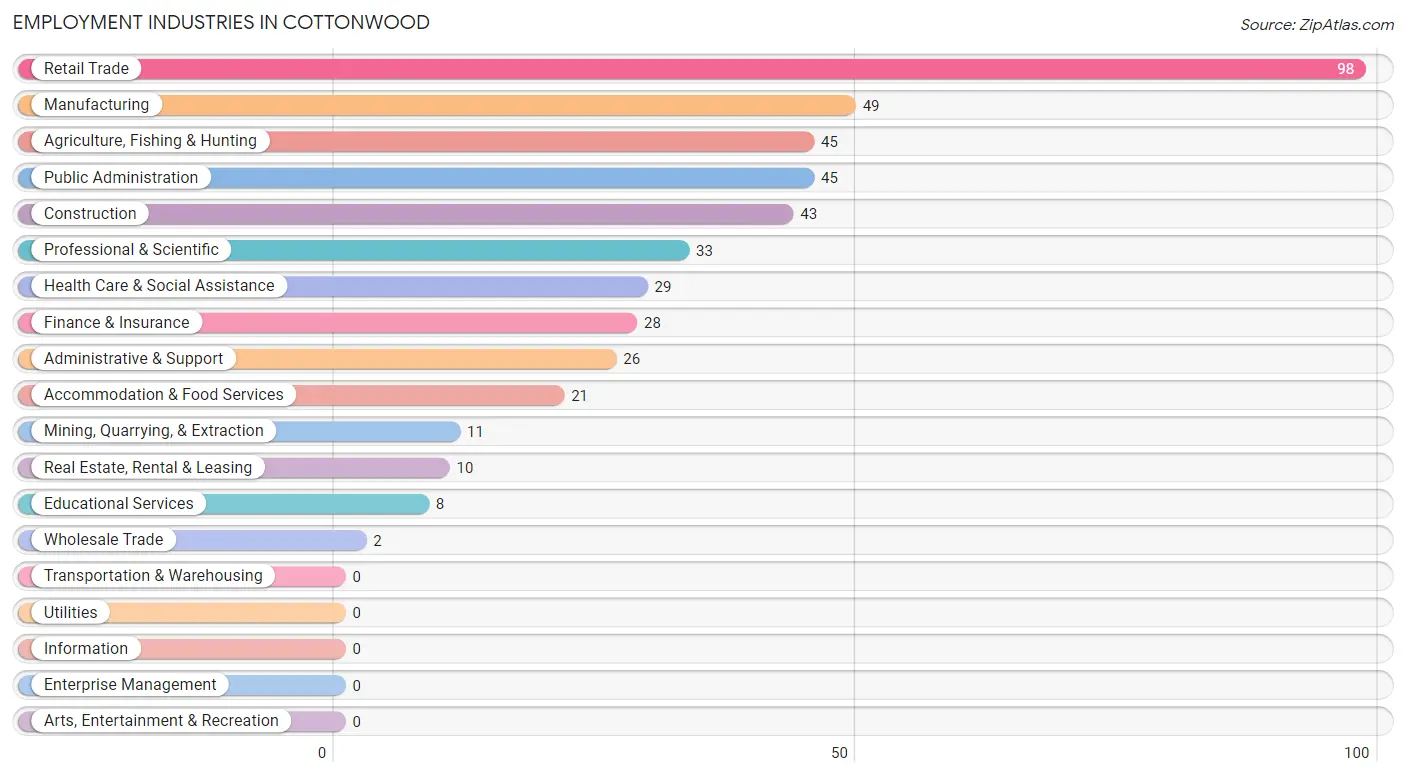
Employment Industries in Cottonwood
The major employment industries in Cottonwood include Retail Trade (98 | 21.0%), Manufacturing (49 | 10.5%), Agriculture, Fishing & Hunting (45 | 9.7%), Public Administration (45 | 9.7%), and Construction (43 | 9.2%).
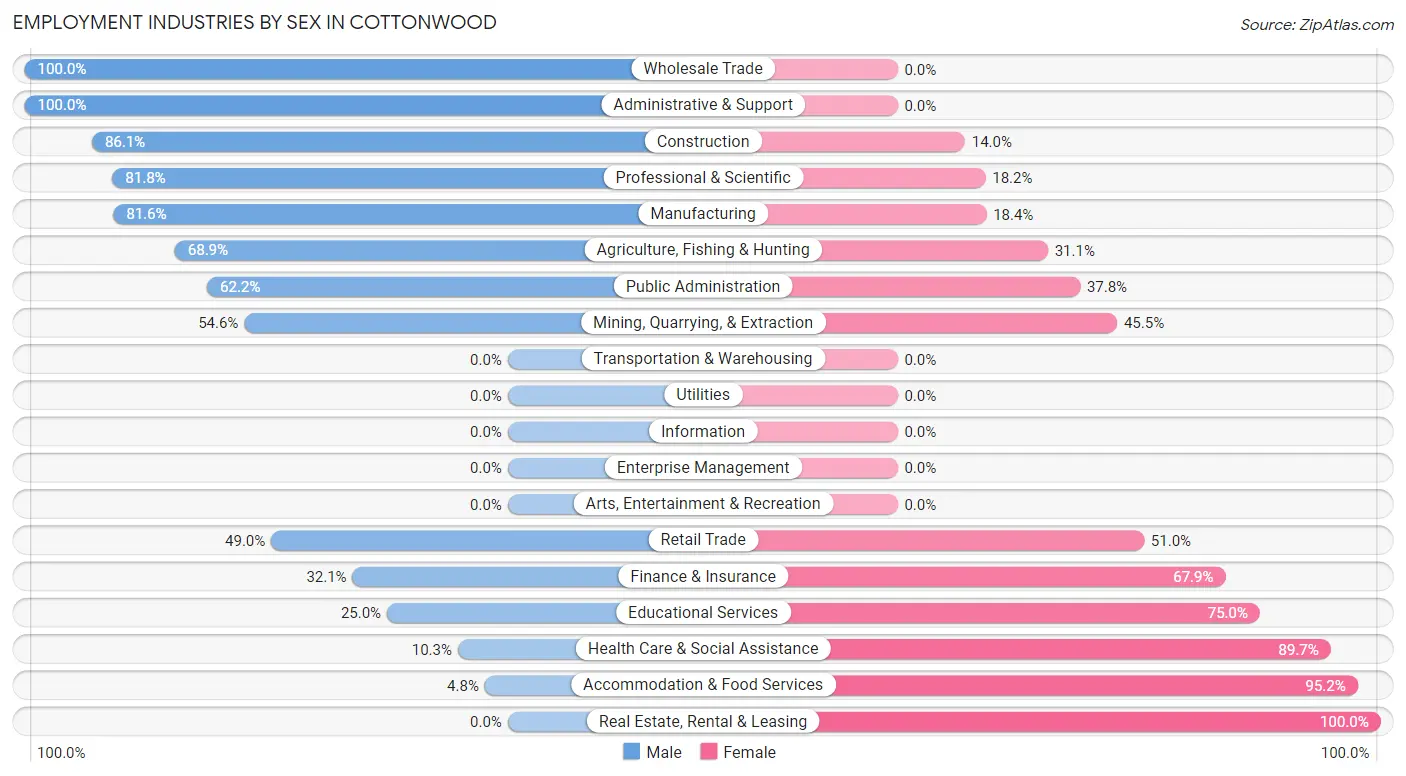
Employment Industries by Sex in Cottonwood
The Cottonwood industries that see more men than women are Wholesale Trade (100.0%), Administrative & Support (100.0%), and Construction (86.1%), whereas the industries that tend to have a higher number of women are Real Estate, Rental & Leasing (100.0%), Accommodation & Food Services (95.2%), and Health Care & Social Assistance (89.7%).
| Industry | Male | Female |
| Agriculture, Fishing & Hunting | 31 (68.9%) | 14 (31.1%) |
| Mining, Quarrying, & Extraction | 6 (54.5%) | 5 (45.5%) |
| Construction | 37 (86.1%) | 6 (14.0%) |
| Manufacturing | 40 (81.6%) | 9 (18.4%) |
| Wholesale Trade | 2 (100.0%) | 0 (0.0%) |
| Retail Trade | 48 (49.0%) | 50 (51.0%) |
| Transportation & Warehousing | 0 (0.0%) | 0 (0.0%) |
| Utilities | 0 (0.0%) | 0 (0.0%) |
| Information | 0 (0.0%) | 0 (0.0%) |
| Finance & Insurance | 9 (32.1%) | 19 (67.9%) |
| Real Estate, Rental & Leasing | 0 (0.0%) | 10 (100.0%) |
| Professional & Scientific | 27 (81.8%) | 6 (18.2%) |
| Enterprise Management | 0 (0.0%) | 0 (0.0%) |
| Administrative & Support | 26 (100.0%) | 0 (0.0%) |
| Educational Services | 2 (25.0%) | 6 (75.0%) |
| Health Care & Social Assistance | 3 (10.3%) | 26 (89.7%) |
| Arts, Entertainment & Recreation | 0 (0.0%) | 0 (0.0%) |
| Accommodation & Food Services | 1 (4.8%) | 20 (95.2%) |
| Public Administration | 28 (62.2%) | 17 (37.8%) |
| Total | 264 (56.7%) | 202 (43.3%) |
Education in Cottonwood
School Enrollment in Cottonwood
The most common levels of schooling among the 422 students in Cottonwood are elementary school (107 | 25.4%), high school (106 | 25.1%), and college / undergraduate (94 | 22.3%).
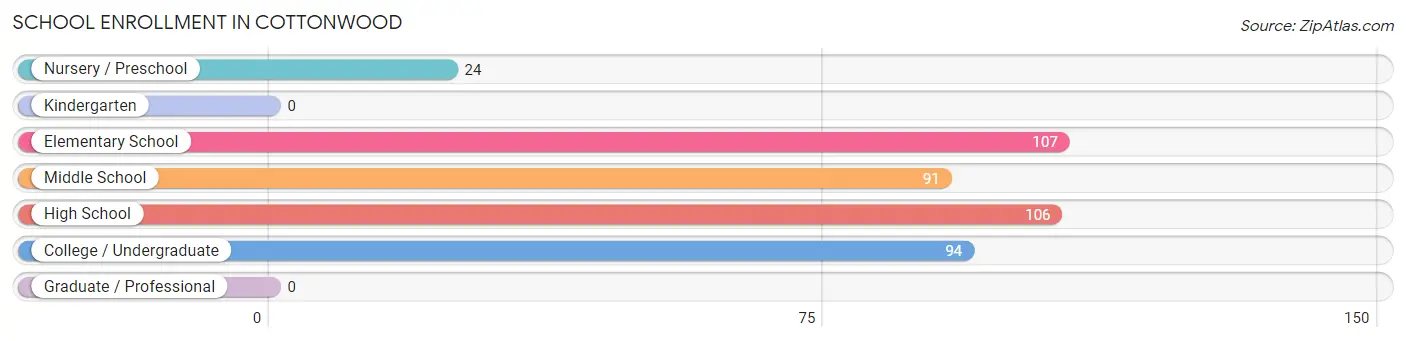
| School Level | # Students | % Students |
| Nursery / Preschool | 24 | 5.7% |
| Kindergarten | 0 | 0.0% |
| Elementary School | 107 | 25.4% |
| Middle School | 91 | 21.6% |
| High School | 106 | 25.1% |
| College / Undergraduate | 94 | 22.3% |
| Graduate / Professional | 0 | 0.0% |
| Total | 422 | 100.0% |
School Enrollment by Age by Funding Source in Cottonwood
Out of a total of 422 students who are enrolled in schools in Cottonwood, 111 (26.3%) attend a private institution, while the remaining 311 (73.7%) are enrolled in public schools. The age group of 10 to 14 year olds has the highest likelihood of being enrolled in private schools, with 59 (49.6% in the age bracket) enrolled. Conversely, the age group of 18 to 19 year olds has the lowest likelihood of being enrolled in a private school, with 32 (100.0% in the age bracket) attending a public institution.
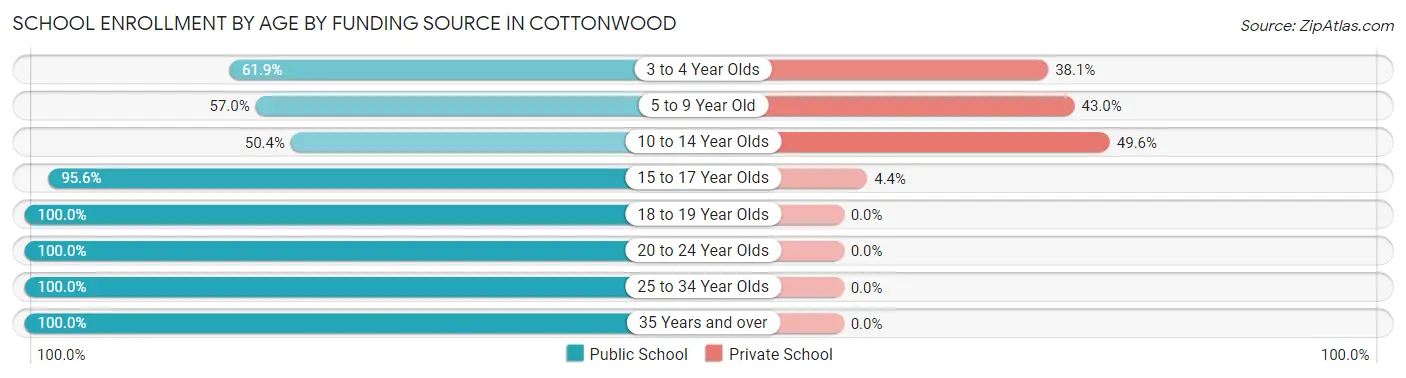
| Age Bracket | Public School | Private School |
| 3 to 4 Year Olds | 13 (61.9%) | 8 (38.1%) |
| 5 to 9 Year Old | 53 (57.0%) | 40 (43.0%) |
| 10 to 14 Year Olds | 60 (50.4%) | 59 (49.6%) |
| 15 to 17 Year Olds | 87 (95.6%) | 4 (4.4%) |
| 18 to 19 Year Olds | 32 (100.0%) | 0 (0.0%) |
| 20 to 24 Year Olds | 7 (100.0%) | 0 (0.0%) |
| 25 to 34 Year Olds | 4 (100.0%) | 0 (0.0%) |
| 35 Years and over | 55 (100.0%) | 0 (0.0%) |
| Total | 311 (73.7%) | 111 (26.3%) |
Educational Attainment by Field of Study in Cottonwood
Business (54 | 29.3%), bio, nature & agricultural (29 | 15.8%), science & technology (26 | 14.1%), social sciences (19 | 10.3%), and physical & health sciences (16 | 8.7%) are the most common fields of study among 184 individuals in Cottonwood who have obtained a bachelor's degree or higher.
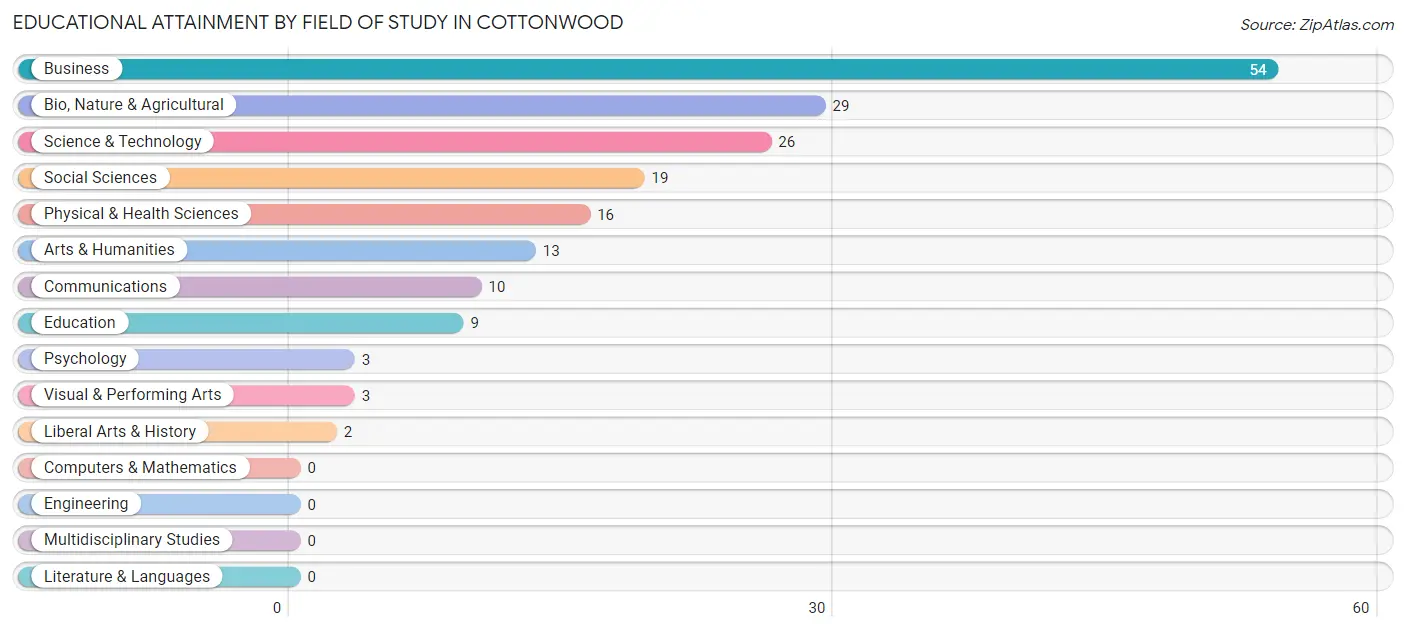
| Field of Study | # Graduates | % Graduates |
| Computers & Mathematics | 0 | 0.0% |
| Bio, Nature & Agricultural | 29 | 15.8% |
| Physical & Health Sciences | 16 | 8.7% |
| Psychology | 3 | 1.6% |
| Social Sciences | 19 | 10.3% |
| Engineering | 0 | 0.0% |
| Multidisciplinary Studies | 0 | 0.0% |
| Science & Technology | 26 | 14.1% |
| Business | 54 | 29.3% |
| Education | 9 | 4.9% |
| Literature & Languages | 0 | 0.0% |
| Liberal Arts & History | 2 | 1.1% |
| Visual & Performing Arts | 3 | 1.6% |
| Communications | 10 | 5.4% |
| Arts & Humanities | 13 | 7.1% |
| Total | 184 | 100.0% |
Transportation & Commute in Cottonwood
Vehicle Availability by Sex in Cottonwood
The most prevalent vehicle ownership categories in Cottonwood are males with 2 vehicles (114, accounting for 44.0%) and females with 2 vehicles (92, making up 59.4%).
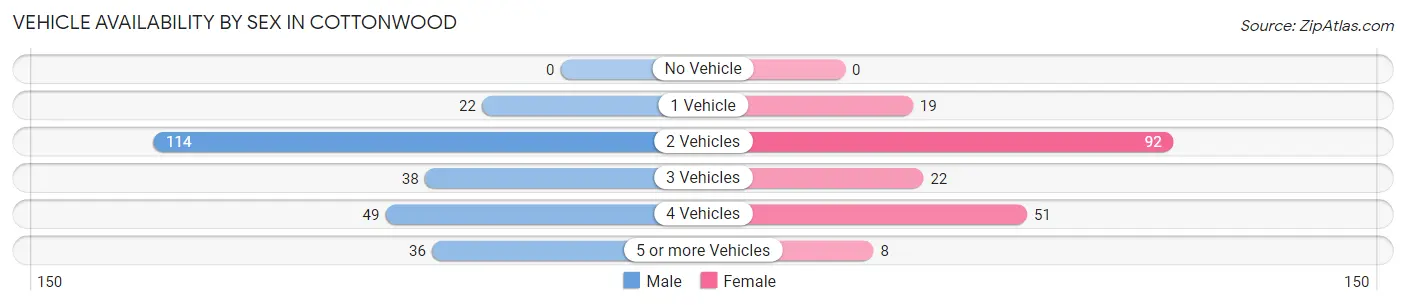
| Vehicles Available | Male | Female |
| No Vehicle | 0 (0.0%) | 0 (0.0%) |
| 1 Vehicle | 22 (8.5%) | 19 (9.9%) |
| 2 Vehicles | 114 (44.0%) | 92 (47.9%) |
| 3 Vehicles | 38 (14.7%) | 22 (11.5%) |
| 4 Vehicles | 49 (18.9%) | 51 (26.6%) |
| 5 or more Vehicles | 36 (13.9%) | 8 (4.2%) |
| Total | 259 (100.0%) | 192 (100.0%) |
Commute Time in Cottonwood
The most frequently occuring commute durations in Cottonwood are 5 to 9 minutes (109 commuters, 24.7%), less than 5 minutes (82 commuters, 18.5%), and 10 to 14 minutes (63 commuters, 14.2%).
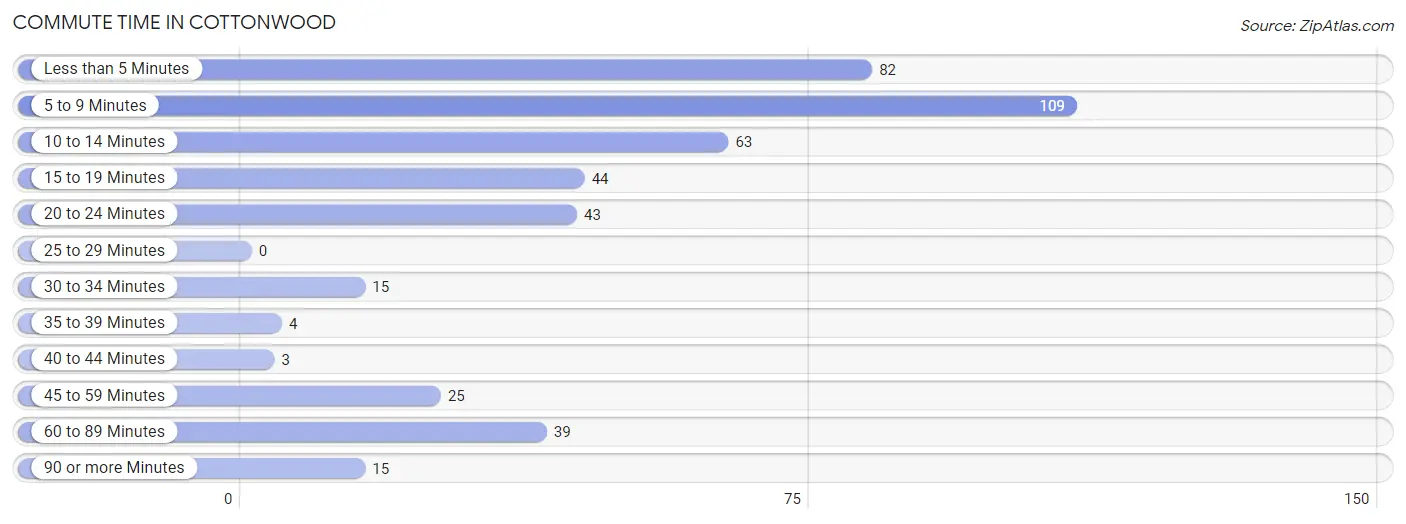
| Commute Time | # Commuters | % Commuters |
| Less than 5 Minutes | 82 | 18.5% |
| 5 to 9 Minutes | 109 | 24.7% |
| 10 to 14 Minutes | 63 | 14.2% |
| 15 to 19 Minutes | 44 | 10.0% |
| 20 to 24 Minutes | 43 | 9.7% |
| 25 to 29 Minutes | 0 | 0.0% |
| 30 to 34 Minutes | 15 | 3.4% |
| 35 to 39 Minutes | 4 | 0.9% |
| 40 to 44 Minutes | 3 | 0.7% |
| 45 to 59 Minutes | 25 | 5.7% |
| 60 to 89 Minutes | 39 | 8.8% |
| 90 or more Minutes | 15 | 3.4% |
Commute Time by Sex in Cottonwood
The most common commute times in Cottonwood are less than 5 minutes (59 commuters, 22.6%) for males and 5 to 9 minutes (67 commuters, 37.0%) for females.
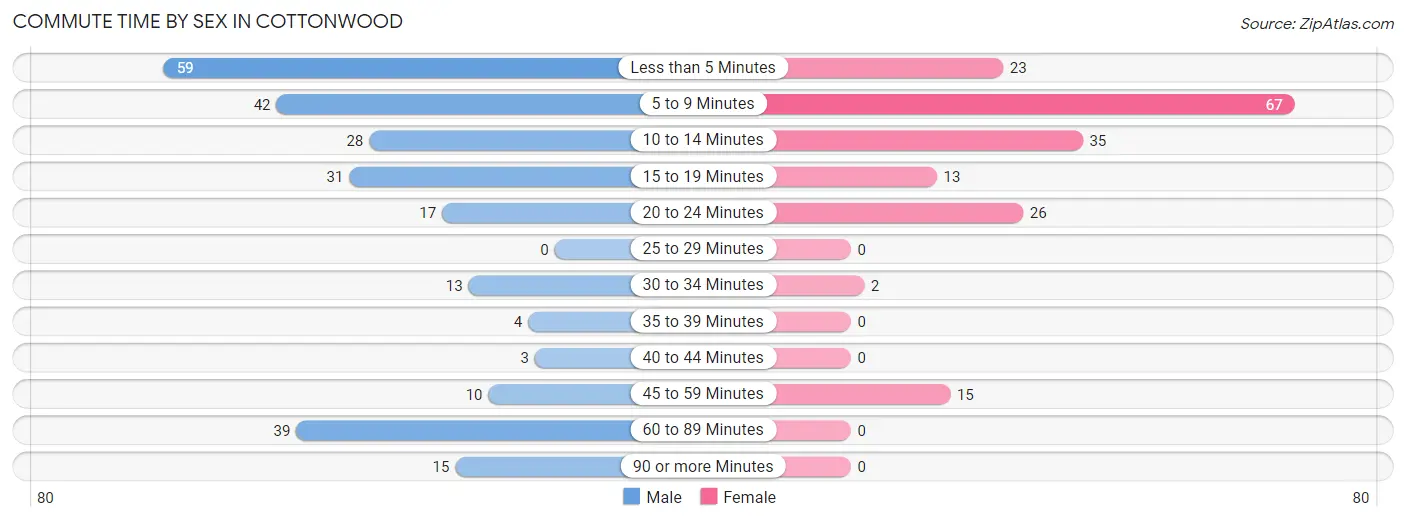
| Commute Time | Male | Female |
| Less than 5 Minutes | 59 (22.6%) | 23 (12.7%) |
| 5 to 9 Minutes | 42 (16.1%) | 67 (37.0%) |
| 10 to 14 Minutes | 28 (10.7%) | 35 (19.3%) |
| 15 to 19 Minutes | 31 (11.9%) | 13 (7.2%) |
| 20 to 24 Minutes | 17 (6.5%) | 26 (14.4%) |
| 25 to 29 Minutes | 0 (0.0%) | 0 (0.0%) |
| 30 to 34 Minutes | 13 (5.0%) | 2 (1.1%) |
| 35 to 39 Minutes | 4 (1.5%) | 0 (0.0%) |
| 40 to 44 Minutes | 3 (1.1%) | 0 (0.0%) |
| 45 to 59 Minutes | 10 (3.8%) | 15 (8.3%) |
| 60 to 89 Minutes | 39 (14.9%) | 0 (0.0%) |
| 90 or more Minutes | 15 (5.8%) | 0 (0.0%) |
Time of Departure to Work by Sex in Cottonwood
The most frequent times of departure to work in Cottonwood are 6:30 AM to 6:59 AM (68, 26.1%) for males and 7:00 AM to 7:29 AM (43, 23.8%) for females.
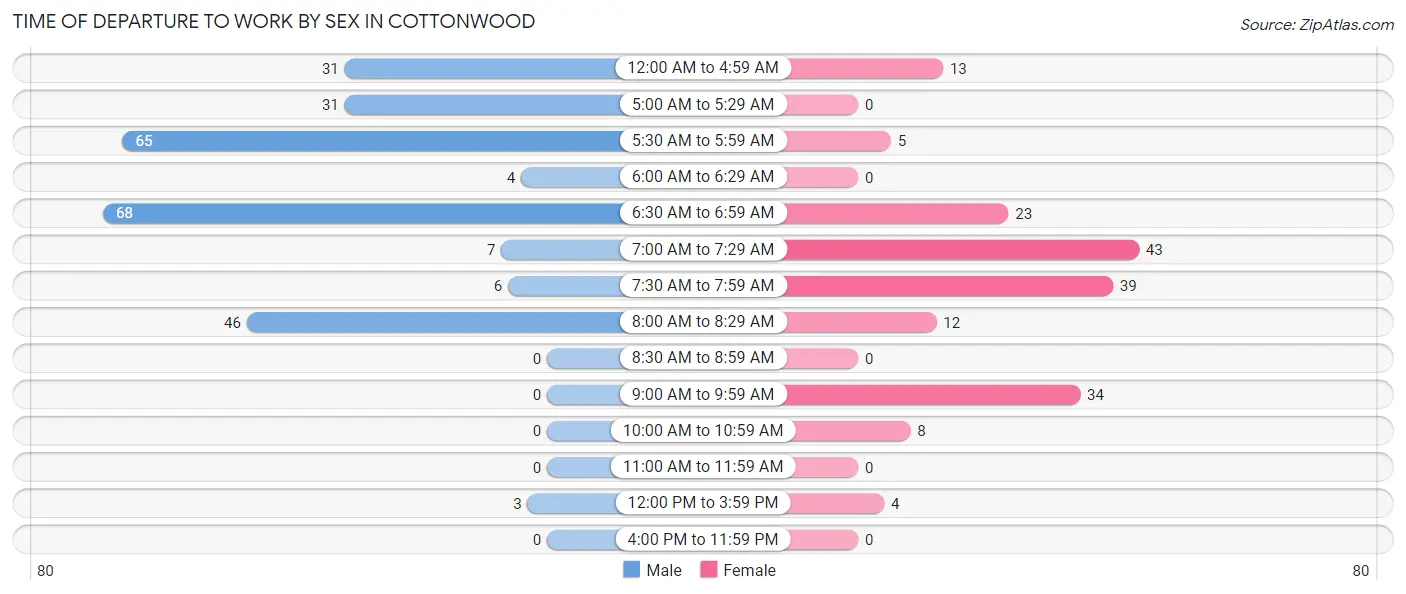
| Time of Departure | Male | Female |
| 12:00 AM to 4:59 AM | 31 (11.9%) | 13 (7.2%) |
| 5:00 AM to 5:29 AM | 31 (11.9%) | 0 (0.0%) |
| 5:30 AM to 5:59 AM | 65 (24.9%) | 5 (2.8%) |
| 6:00 AM to 6:29 AM | 4 (1.5%) | 0 (0.0%) |
| 6:30 AM to 6:59 AM | 68 (26.1%) | 23 (12.7%) |
| 7:00 AM to 7:29 AM | 7 (2.7%) | 43 (23.8%) |
| 7:30 AM to 7:59 AM | 6 (2.3%) | 39 (21.5%) |
| 8:00 AM to 8:29 AM | 46 (17.6%) | 12 (6.6%) |
| 8:30 AM to 8:59 AM | 0 (0.0%) | 0 (0.0%) |
| 9:00 AM to 9:59 AM | 0 (0.0%) | 34 (18.8%) |
| 10:00 AM to 10:59 AM | 0 (0.0%) | 8 (4.4%) |
| 11:00 AM to 11:59 AM | 0 (0.0%) | 0 (0.0%) |
| 12:00 PM to 3:59 PM | 3 (1.1%) | 4 (2.2%) |
| 4:00 PM to 11:59 PM | 0 (0.0%) | 0 (0.0%) |
| Total | 261 (100.0%) | 181 (100.0%) |
Housing Occupancy in Cottonwood
Occupancy by Ownership in Cottonwood
Of the total 392 dwellings in Cottonwood, owner-occupied units account for 283 (72.2%), while renter-occupied units make up 109 (27.8%).
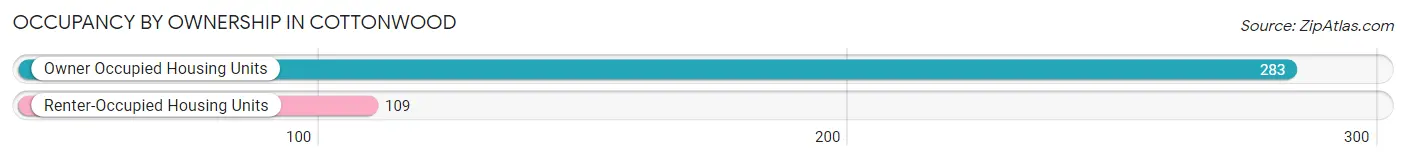
| Occupancy | # Housing Units | % Housing Units |
| Owner Occupied Housing Units | 283 | 72.2% |
| Renter-Occupied Housing Units | 109 | 27.8% |
| Total Occupied Housing Units | 392 | 100.0% |
Occupancy by Household Size in Cottonwood
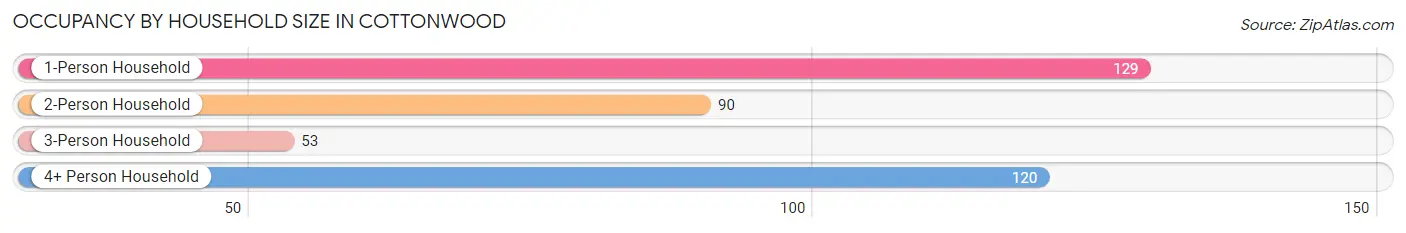
| Household Size | # Housing Units | % Housing Units |
| 1-Person Household | 129 | 32.9% |
| 2-Person Household | 90 | 23.0% |
| 3-Person Household | 53 | 13.5% |
| 4+ Person Household | 120 | 30.6% |
| Total Housing Units | 392 | 100.0% |
Occupancy by Ownership by Household Size in Cottonwood
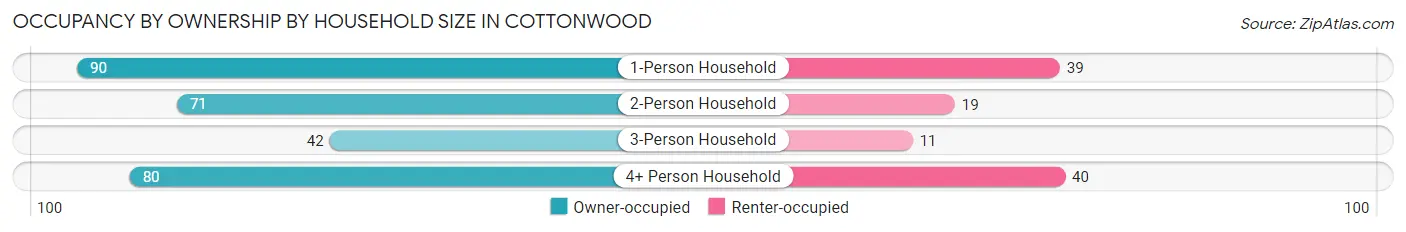
| Household Size | Owner-occupied | Renter-occupied |
| 1-Person Household | 90 (69.8%) | 39 (30.2%) |
| 2-Person Household | 71 (78.9%) | 19 (21.1%) |
| 3-Person Household | 42 (79.2%) | 11 (20.7%) |
| 4+ Person Household | 80 (66.7%) | 40 (33.3%) |
| Total Housing Units | 283 (72.2%) | 109 (27.8%) |
Occupancy by Educational Attainment in Cottonwood
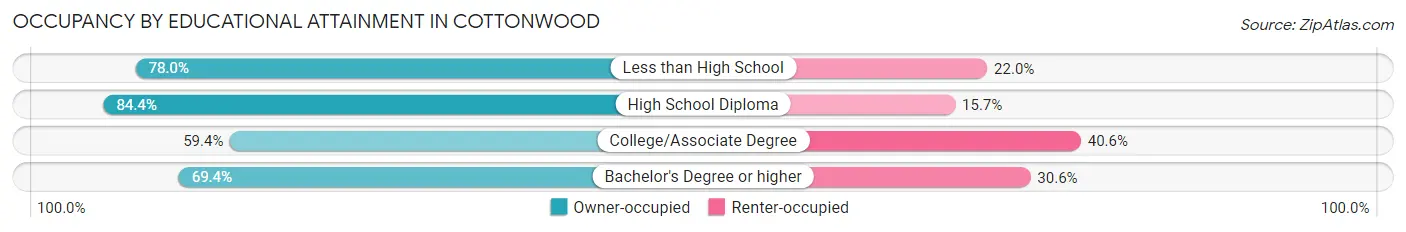
| Household Size | Owner-occupied | Renter-occupied |
| Less than High School | 39 (78.0%) | 11 (22.0%) |
| High School Diploma | 97 (84.4%) | 18 (15.7%) |
| College/Associate Degree | 63 (59.4%) | 43 (40.6%) |
| Bachelor's Degree or higher | 84 (69.4%) | 37 (30.6%) |
Occupancy by Age of Householder in Cottonwood
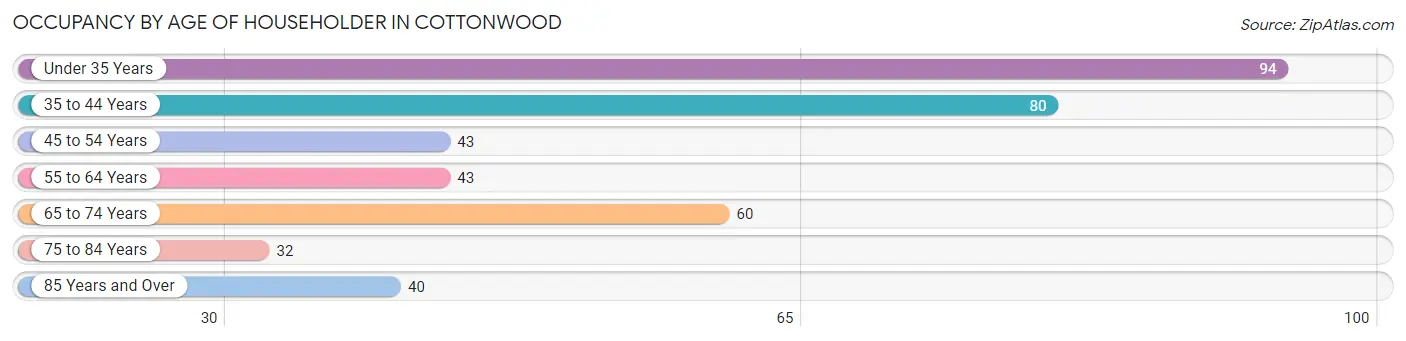
| Age Bracket | # Households | % Households |
| Under 35 Years | 94 | 24.0% |
| 35 to 44 Years | 80 | 20.4% |
| 45 to 54 Years | 43 | 11.0% |
| 55 to 64 Years | 43 | 11.0% |
| 65 to 74 Years | 60 | 15.3% |
| 75 to 84 Years | 32 | 8.2% |
| 85 Years and Over | 40 | 10.2% |
| Total | 392 | 100.0% |
Housing Finances in Cottonwood
Median Income by Occupancy in Cottonwood
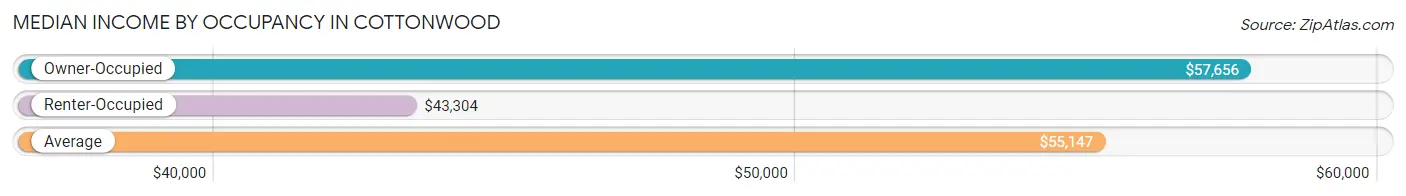
| Occupancy Type | # Households | Median Income |
| Owner-Occupied | 283 (72.2%) | $57,656 |
| Renter-Occupied | 109 (27.8%) | $43,304 |
| Average | 392 (100.0%) | $55,147 |
Occupancy by Householder Income Bracket in Cottonwood
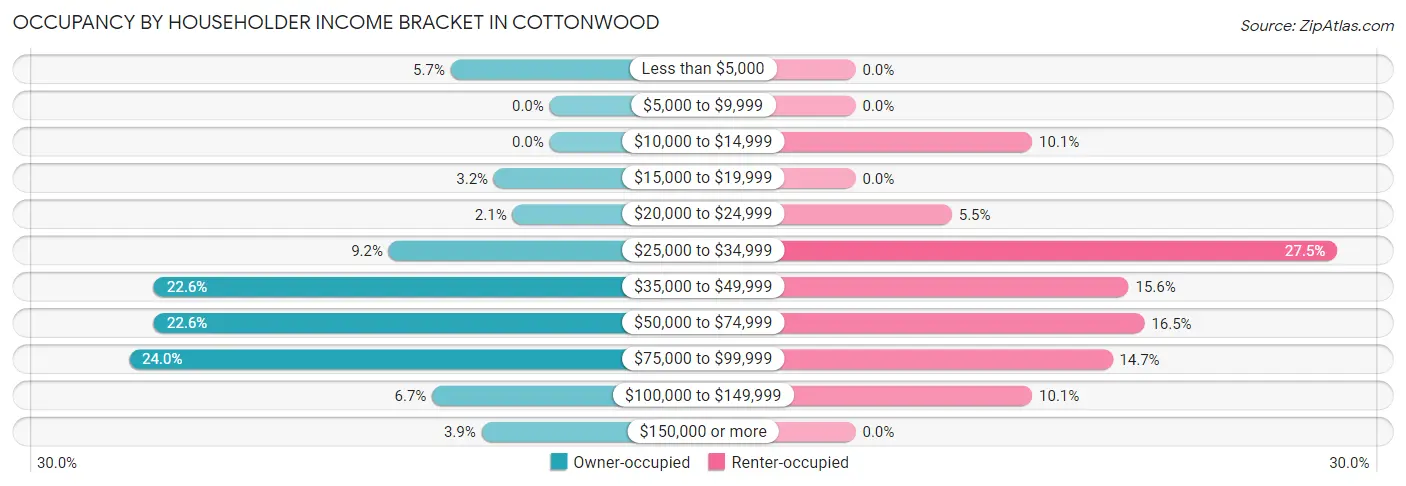
| Income Bracket | Owner-occupied | Renter-occupied |
| Less than $5,000 | 16 (5.7%) | 0 (0.0%) |
| $5,000 to $9,999 | 0 (0.0%) | 0 (0.0%) |
| $10,000 to $14,999 | 0 (0.0%) | 11 (10.1%) |
| $15,000 to $19,999 | 9 (3.2%) | 0 (0.0%) |
| $20,000 to $24,999 | 6 (2.1%) | 6 (5.5%) |
| $25,000 to $34,999 | 26 (9.2%) | 30 (27.5%) |
| $35,000 to $49,999 | 64 (22.6%) | 17 (15.6%) |
| $50,000 to $74,999 | 64 (22.6%) | 18 (16.5%) |
| $75,000 to $99,999 | 68 (24.0%) | 16 (14.7%) |
| $100,000 to $149,999 | 19 (6.7%) | 11 (10.1%) |
| $150,000 or more | 11 (3.9%) | 0 (0.0%) |
| Total | 283 (100.0%) | 109 (100.0%) |
Monthly Housing Cost Tiers in Cottonwood
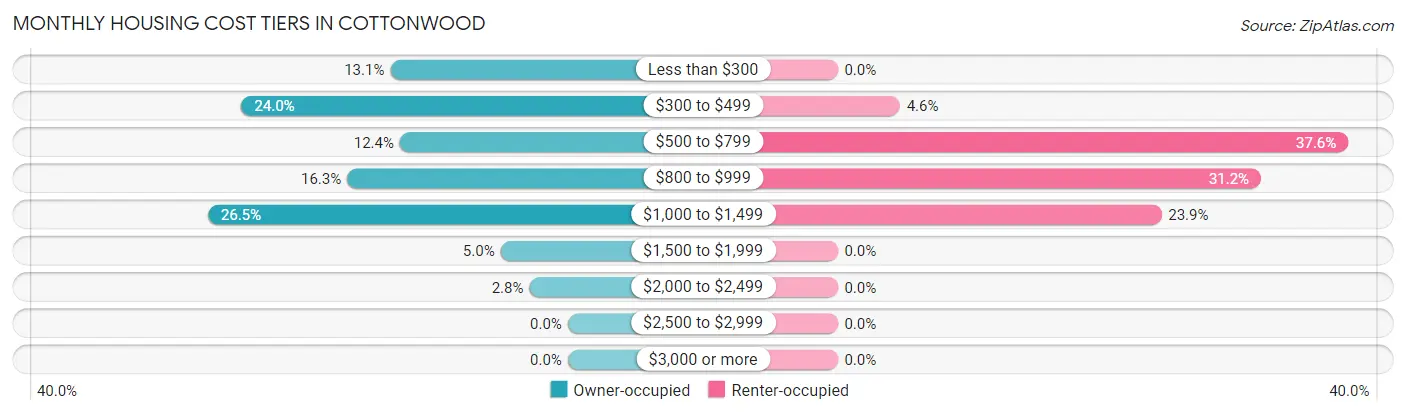
| Monthly Cost | Owner-occupied | Renter-occupied |
| Less than $300 | 37 (13.1%) | 0 (0.0%) |
| $300 to $499 | 68 (24.0%) | 5 (4.6%) |
| $500 to $799 | 35 (12.4%) | 41 (37.6%) |
| $800 to $999 | 46 (16.3%) | 34 (31.2%) |
| $1,000 to $1,499 | 75 (26.5%) | 26 (23.8%) |
| $1,500 to $1,999 | 14 (5.0%) | 0 (0.0%) |
| $2,000 to $2,499 | 8 (2.8%) | 0 (0.0%) |
| $2,500 to $2,999 | 0 (0.0%) | 0 (0.0%) |
| $3,000 or more | 0 (0.0%) | 0 (0.0%) |
| Total | 283 (100.0%) | 109 (100.0%) |
Physical Housing Characteristics in Cottonwood
Housing Structures in Cottonwood
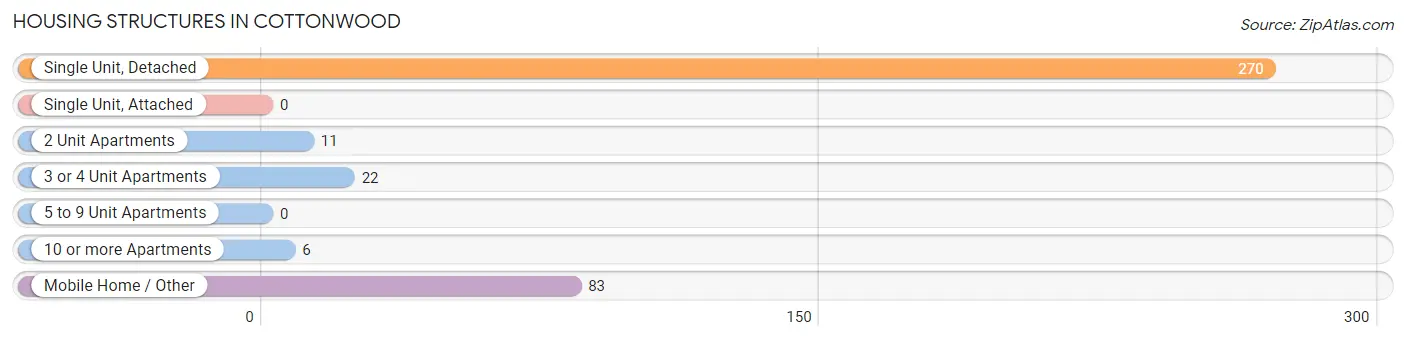
| Structure Type | # Housing Units | % Housing Units |
| Single Unit, Detached | 270 | 68.9% |
| Single Unit, Attached | 0 | 0.0% |
| 2 Unit Apartments | 11 | 2.8% |
| 3 or 4 Unit Apartments | 22 | 5.6% |
| 5 to 9 Unit Apartments | 0 | 0.0% |
| 10 or more Apartments | 6 | 1.5% |
| Mobile Home / Other | 83 | 21.2% |
| Total | 392 | 100.0% |
Housing Structures by Occupancy in Cottonwood
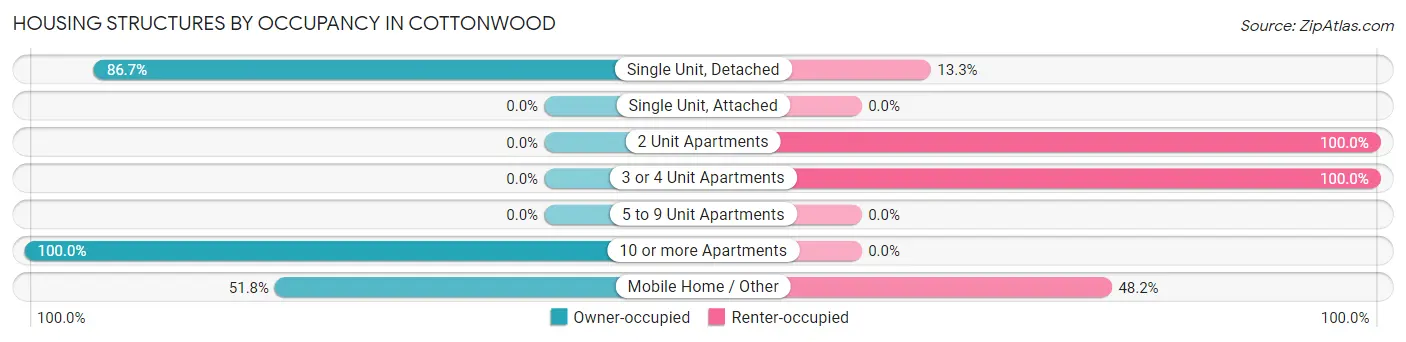
| Structure Type | Owner-occupied | Renter-occupied |
| Single Unit, Detached | 234 (86.7%) | 36 (13.3%) |
| Single Unit, Attached | 0 (0.0%) | 0 (0.0%) |
| 2 Unit Apartments | 0 (0.0%) | 11 (100.0%) |
| 3 or 4 Unit Apartments | 0 (0.0%) | 22 (100.0%) |
| 5 to 9 Unit Apartments | 0 (0.0%) | 0 (0.0%) |
| 10 or more Apartments | 6 (100.0%) | 0 (0.0%) |
| Mobile Home / Other | 43 (51.8%) | 40 (48.2%) |
| Total | 283 (72.2%) | 109 (27.8%) |
Housing Structures by Number of Rooms in Cottonwood
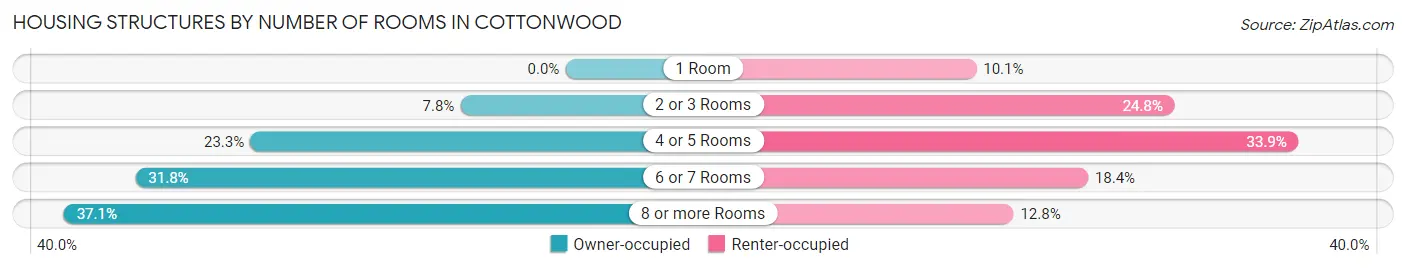
| Number of Rooms | Owner-occupied | Renter-occupied |
| 1 Room | 0 (0.0%) | 11 (10.1%) |
| 2 or 3 Rooms | 22 (7.8%) | 27 (24.8%) |
| 4 or 5 Rooms | 66 (23.3%) | 37 (33.9%) |
| 6 or 7 Rooms | 90 (31.8%) | 20 (18.3%) |
| 8 or more Rooms | 105 (37.1%) | 14 (12.8%) |
| Total | 283 (100.0%) | 109 (100.0%) |
Housing Structure by Heating Type in Cottonwood
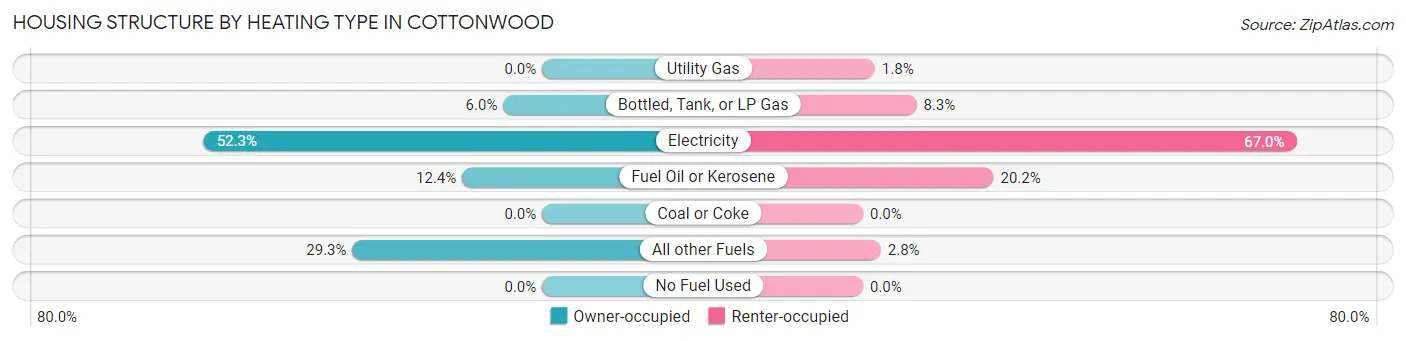
| Heating Type | Owner-occupied | Renter-occupied |
| Utility Gas | 0 (0.0%) | 2 (1.8%) |
| Bottled, Tank, or LP Gas | 17 (6.0%) | 9 (8.3%) |
| Electricity | 148 (52.3%) | 73 (67.0%) |
| Fuel Oil or Kerosene | 35 (12.4%) | 22 (20.2%) |
| Coal or Coke | 0 (0.0%) | 0 (0.0%) |
| All other Fuels | 83 (29.3%) | 3 (2.8%) |
| No Fuel Used | 0 (0.0%) | 0 (0.0%) |
| Total | 283 (100.0%) | 109 (100.0%) |
Household Vehicle Usage in Cottonwood
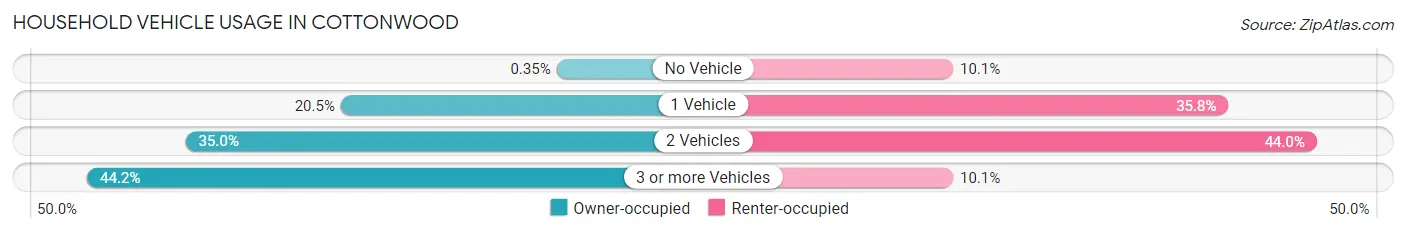
| Vehicles per Household | Owner-occupied | Renter-occupied |
| No Vehicle | 1 (0.4%) | 11 (10.1%) |
| 1 Vehicle | 58 (20.5%) | 39 (35.8%) |
| 2 Vehicles | 99 (35.0%) | 48 (44.0%) |
| 3 or more Vehicles | 125 (44.2%) | 11 (10.1%) |
| Total | 283 (100.0%) | 109 (100.0%) |
Real Estate & Mortgages in Cottonwood
Real Estate and Mortgage Overview in Cottonwood
| Characteristic | Without Mortgage | With Mortgage |
| Housing Units | 133 | 150 |
| Median Property Value | $180,700 | $155,400 |
| Median Household Income | $56,250 | $0 |
| Monthly Housing Costs | $404 | $0 |
| Real Estate Taxes | $817 | $3 |
Property Value by Mortgage Status in Cottonwood
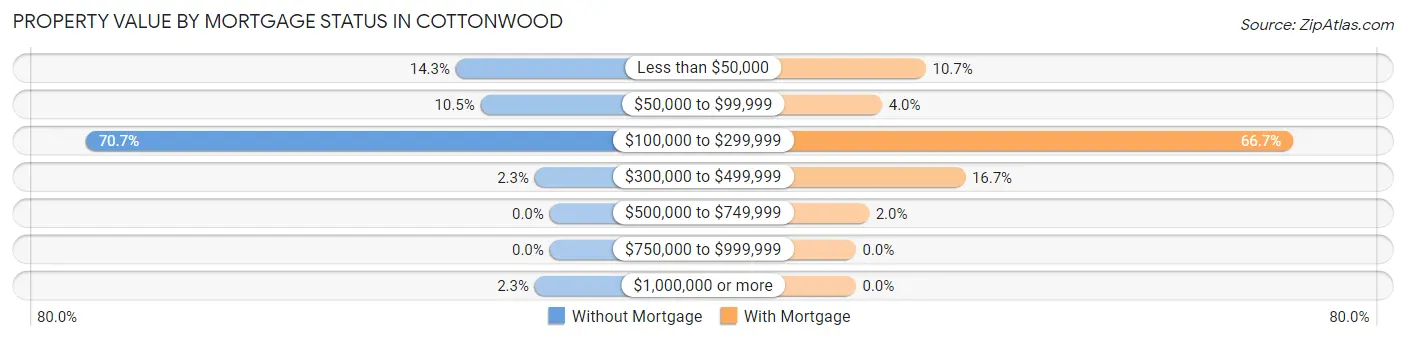
| Property Value | Without Mortgage | With Mortgage |
| Less than $50,000 | 19 (14.3%) | 16 (10.7%) |
| $50,000 to $99,999 | 14 (10.5%) | 6 (4.0%) |
| $100,000 to $299,999 | 94 (70.7%) | 100 (66.7%) |
| $300,000 to $499,999 | 3 (2.3%) | 25 (16.7%) |
| $500,000 to $749,999 | 0 (0.0%) | 3 (2.0%) |
| $750,000 to $999,999 | 0 (0.0%) | 0 (0.0%) |
| $1,000,000 or more | 3 (2.3%) | 0 (0.0%) |
| Total | 133 (100.0%) | 150 (100.0%) |
Household Income by Mortgage Status in Cottonwood
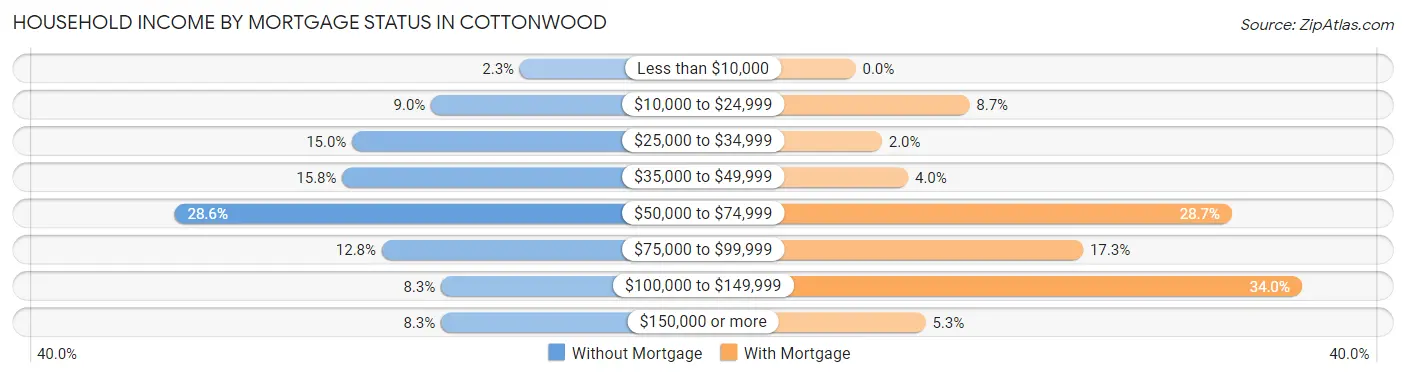
| Household Income | Without Mortgage | With Mortgage |
| Less than $10,000 | 3 (2.3%) | 0 (0.0%) |
| $10,000 to $24,999 | 12 (9.0%) | 13 (8.7%) |
| $25,000 to $34,999 | 20 (15.0%) | 3 (2.0%) |
| $35,000 to $49,999 | 21 (15.8%) | 6 (4.0%) |
| $50,000 to $74,999 | 38 (28.6%) | 43 (28.7%) |
| $75,000 to $99,999 | 17 (12.8%) | 26 (17.3%) |
| $100,000 to $149,999 | 11 (8.3%) | 51 (34.0%) |
| $150,000 or more | 11 (8.3%) | 8 (5.3%) |
| Total | 133 (100.0%) | 150 (100.0%) |
Property Value to Household Income Ratio in Cottonwood
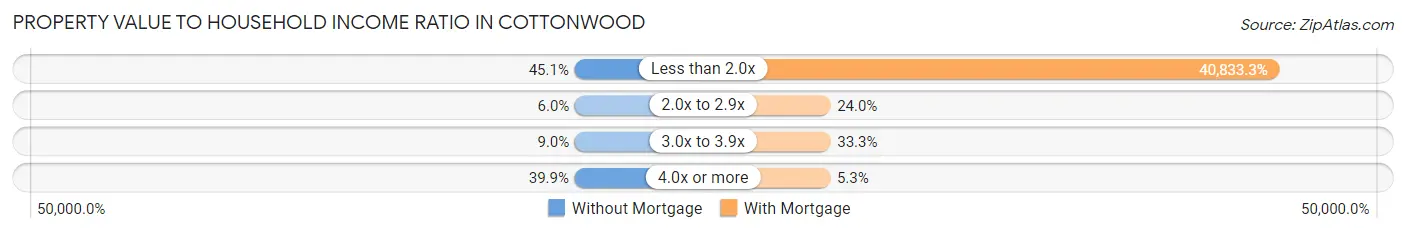
| Value-to-Income Ratio | Without Mortgage | With Mortgage |
| Less than 2.0x | 60 (45.1%) | 61,250 (40,833.3%) |
| 2.0x to 2.9x | 8 (6.0%) | 36 (24.0%) |
| 3.0x to 3.9x | 12 (9.0%) | 50 (33.3%) |
| 4.0x or more | 53 (39.9%) | 8 (5.3%) |
| Total | 133 (100.0%) | 150 (100.0%) |
Real Estate Taxes by Mortgage Status in Cottonwood
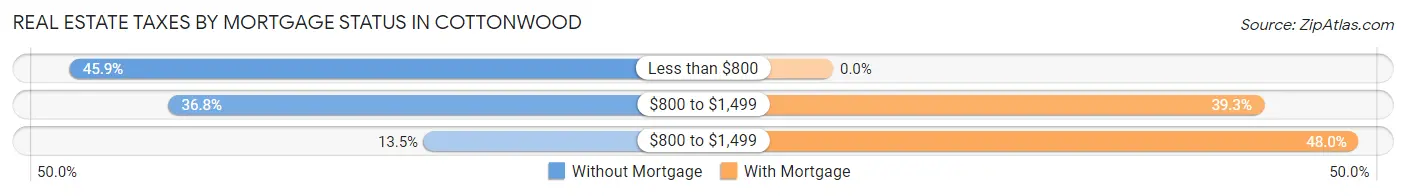
| Property Taxes | Without Mortgage | With Mortgage |
| Less than $800 | 61 (45.9%) | 0 (0.0%) |
| $800 to $1,499 | 49 (36.8%) | 59 (39.3%) |
| $800 to $1,499 | 18 (13.5%) | 72 (48.0%) |
| Total | 133 (100.0%) | 150 (100.0%) |
Health & Disability in Cottonwood
Health Insurance Coverage by Age in Cottonwood
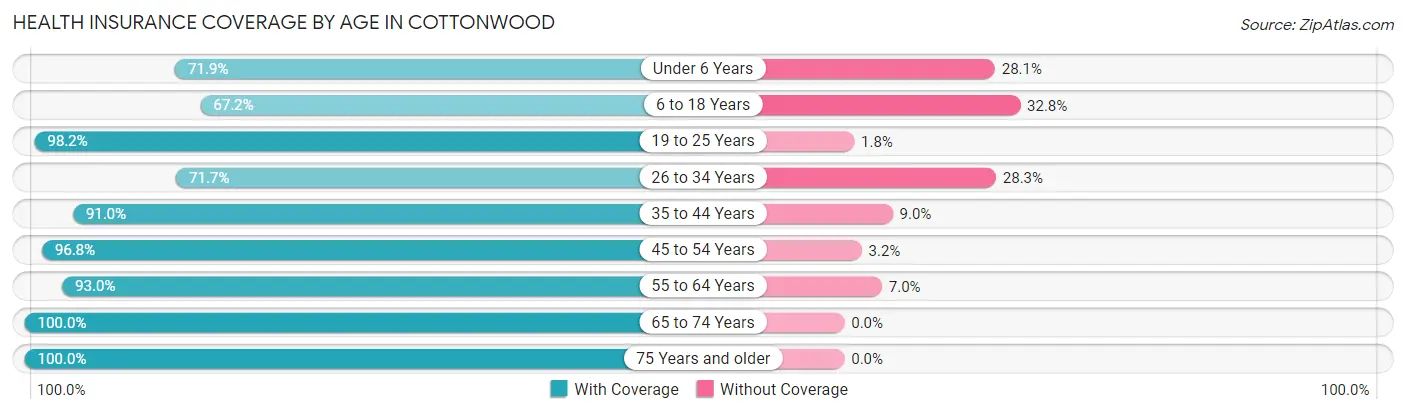
| Age Bracket | With Coverage | Without Coverage |
| Under 6 Years | 41 (71.9%) | 16 (28.1%) |
| 6 to 18 Years | 203 (67.2%) | 99 (32.8%) |
| 19 to 25 Years | 107 (98.2%) | 2 (1.8%) |
| 26 to 34 Years | 132 (71.7%) | 52 (28.3%) |
| 35 to 44 Years | 192 (91.0%) | 19 (9.0%) |
| 45 to 54 Years | 120 (96.8%) | 4 (3.2%) |
| 55 to 64 Years | 93 (93.0%) | 7 (7.0%) |
| 65 to 74 Years | 71 (100.0%) | 0 (0.0%) |
| 75 Years and older | 85 (100.0%) | 0 (0.0%) |
| Total | 1,044 (84.0%) | 199 (16.0%) |
Health Insurance Coverage by Citizenship Status in Cottonwood
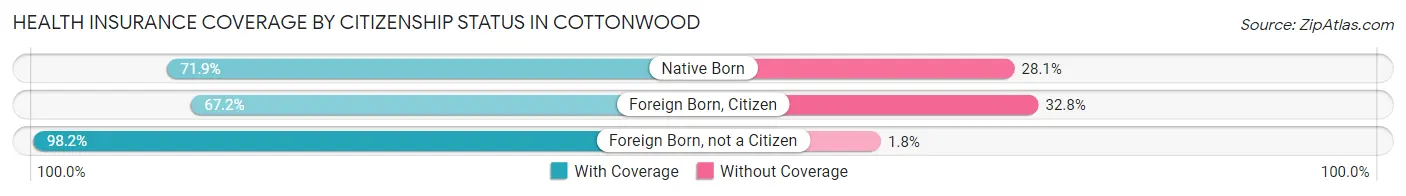
| Citizenship Status | With Coverage | Without Coverage |
| Native Born | 41 (71.9%) | 16 (28.1%) |
| Foreign Born, Citizen | 203 (67.2%) | 99 (32.8%) |
| Foreign Born, not a Citizen | 107 (98.2%) | 2 (1.8%) |
Health Insurance Coverage by Household Income in Cottonwood
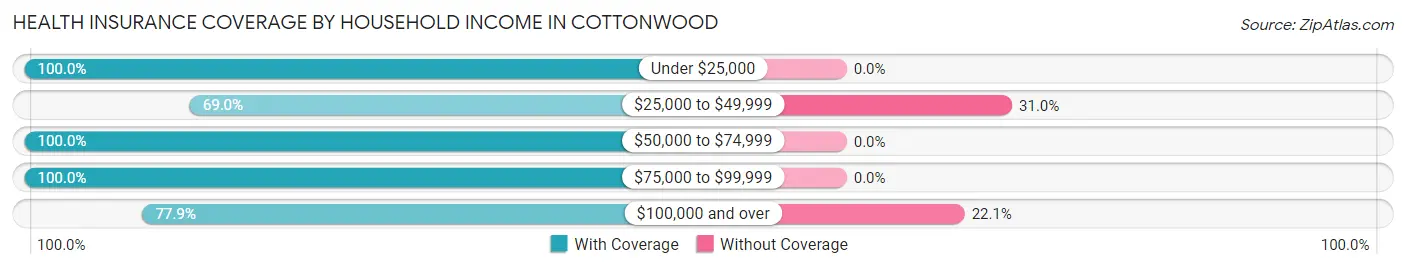
| Household Income | With Coverage | Without Coverage |
| Under $25,000 | 99 (100.0%) | 0 (0.0%) |
| $25,000 to $49,999 | 350 (69.0%) | 157 (31.0%) |
| $50,000 to $74,999 | 146 (100.0%) | 0 (0.0%) |
| $75,000 to $99,999 | 305 (100.0%) | 0 (0.0%) |
| $100,000 and over | 127 (77.9%) | 36 (22.1%) |
Public vs Private Health Insurance Coverage by Age in Cottonwood
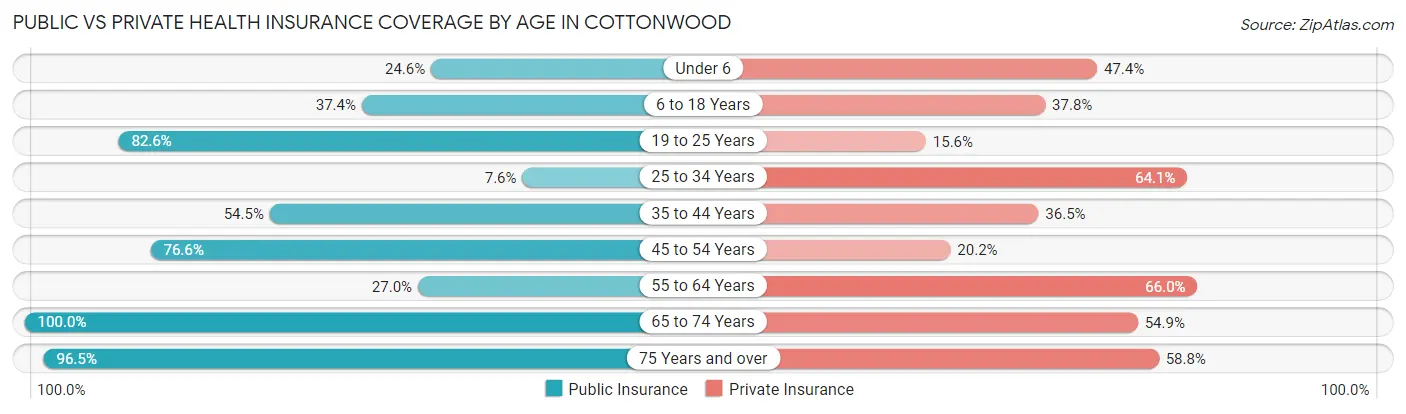
| Age Bracket | Public Insurance | Private Insurance |
| Under 6 | 14 (24.6%) | 27 (47.4%) |
| 6 to 18 Years | 113 (37.4%) | 114 (37.8%) |
| 19 to 25 Years | 90 (82.6%) | 17 (15.6%) |
| 25 to 34 Years | 14 (7.6%) | 118 (64.1%) |
| 35 to 44 Years | 115 (54.5%) | 77 (36.5%) |
| 45 to 54 Years | 95 (76.6%) | 25 (20.2%) |
| 55 to 64 Years | 27 (27.0%) | 66 (66.0%) |
| 65 to 74 Years | 71 (100.0%) | 39 (54.9%) |
| 75 Years and over | 82 (96.5%) | 50 (58.8%) |
| Total | 621 (50.0%) | 533 (42.9%) |
Disability Status by Sex by Age in Cottonwood
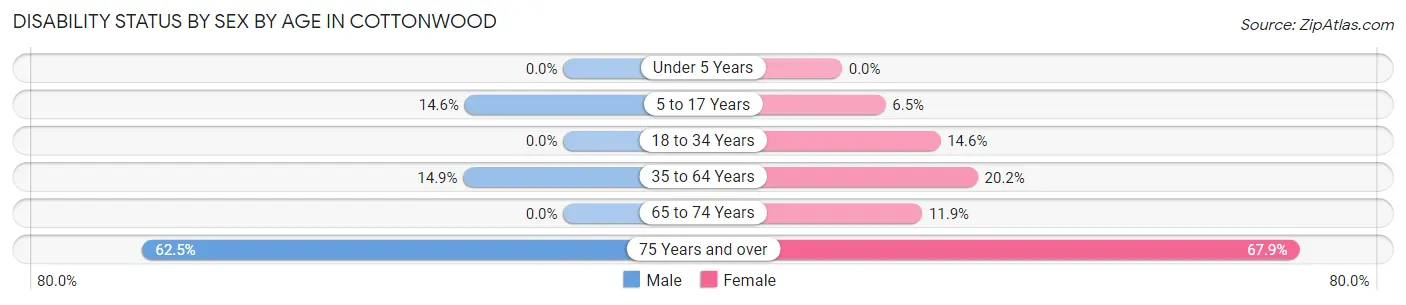
| Age Bracket | Male | Female |
| Under 5 Years | 0 (0.0%) | 0 (0.0%) |
| 5 to 17 Years | 24 (14.6%) | 9 (6.5%) |
| 18 to 34 Years | 0 (0.0%) | 25 (14.6%) |
| 35 to 64 Years | 30 (14.8%) | 47 (20.2%) |
| 65 to 74 Years | 0 (0.0%) | 5 (11.9%) |
| 75 Years and over | 20 (62.5%) | 36 (67.9%) |
Disability Class by Sex by Age in Cottonwood
Disability Class: Hearing Difficulty
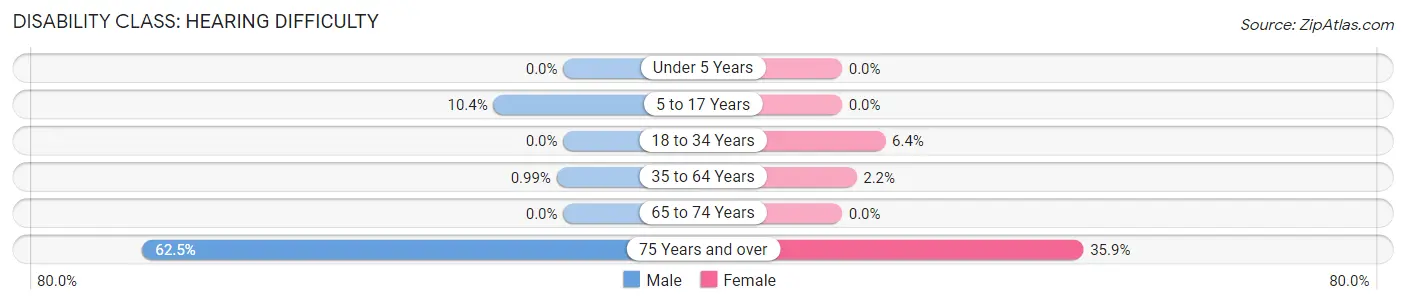
| Age Bracket | Male | Female |
| Under 5 Years | 0 (0.0%) | 0 (0.0%) |
| 5 to 17 Years | 17 (10.4%) | 0 (0.0%) |
| 18 to 34 Years | 0 (0.0%) | 11 (6.4%) |
| 35 to 64 Years | 2 (1.0%) | 5 (2.1%) |
| 65 to 74 Years | 0 (0.0%) | 0 (0.0%) |
| 75 Years and over | 20 (62.5%) | 19 (35.8%) |
Disability Class: Vision Difficulty
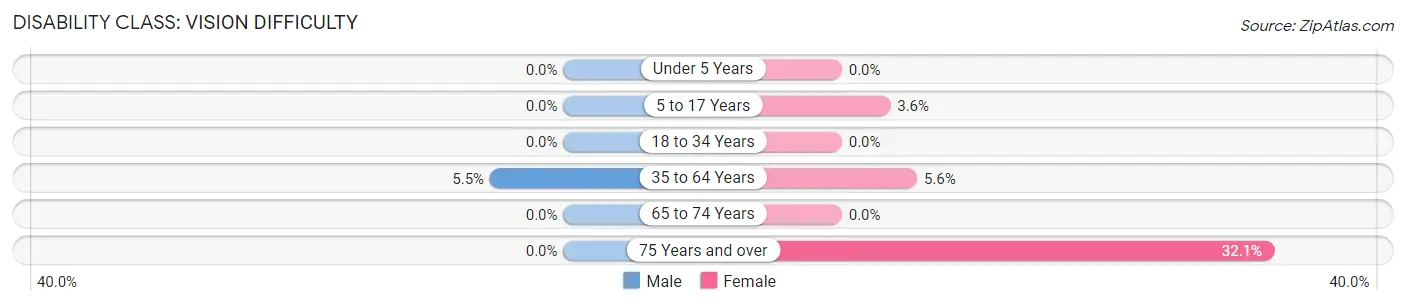
| Age Bracket | Male | Female |
| Under 5 Years | 0 (0.0%) | 0 (0.0%) |
| 5 to 17 Years | 0 (0.0%) | 5 (3.6%) |
| 18 to 34 Years | 0 (0.0%) | 0 (0.0%) |
| 35 to 64 Years | 11 (5.4%) | 13 (5.6%) |
| 65 to 74 Years | 0 (0.0%) | 0 (0.0%) |
| 75 Years and over | 0 (0.0%) | 17 (32.1%) |
Disability Class: Cognitive Difficulty
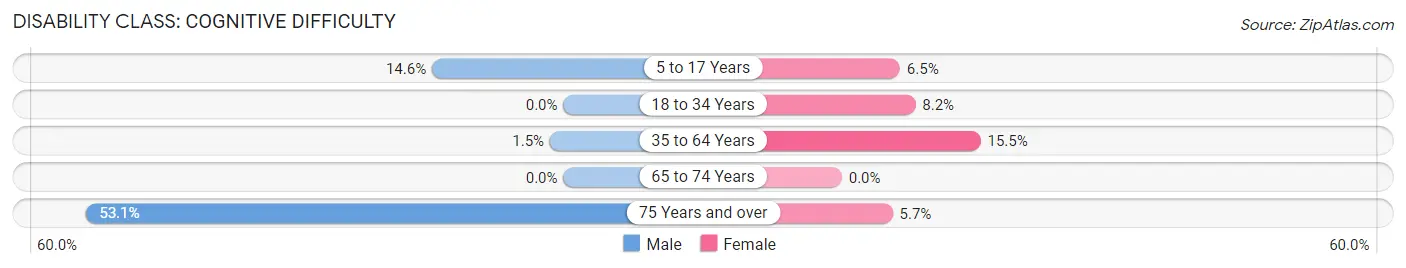
| Age Bracket | Male | Female |
| 5 to 17 Years | 24 (14.6%) | 9 (6.5%) |
| 18 to 34 Years | 0 (0.0%) | 14 (8.2%) |
| 35 to 64 Years | 3 (1.5%) | 36 (15.4%) |
| 65 to 74 Years | 0 (0.0%) | 0 (0.0%) |
| 75 Years and over | 17 (53.1%) | 3 (5.7%) |
Disability Class: Ambulatory Difficulty
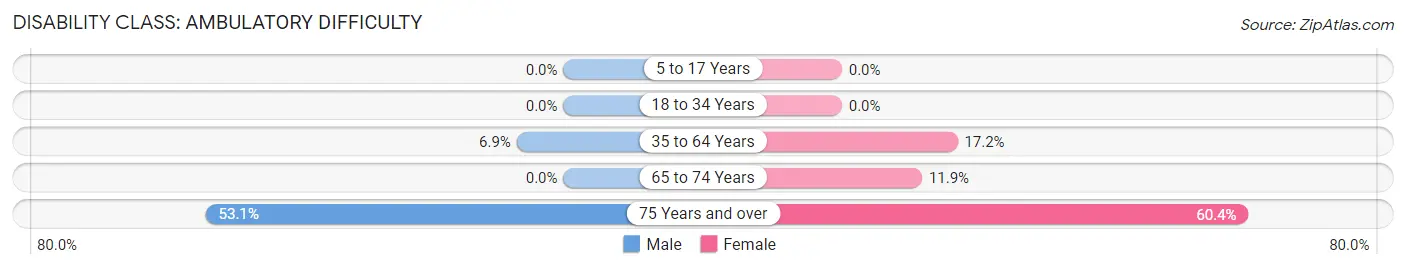
| Age Bracket | Male | Female |
| 5 to 17 Years | 0 (0.0%) | 0 (0.0%) |
| 18 to 34 Years | 0 (0.0%) | 0 (0.0%) |
| 35 to 64 Years | 14 (6.9%) | 40 (17.2%) |
| 65 to 74 Years | 0 (0.0%) | 5 (11.9%) |
| 75 Years and over | 17 (53.1%) | 32 (60.4%) |
Disability Class: Self-Care Difficulty
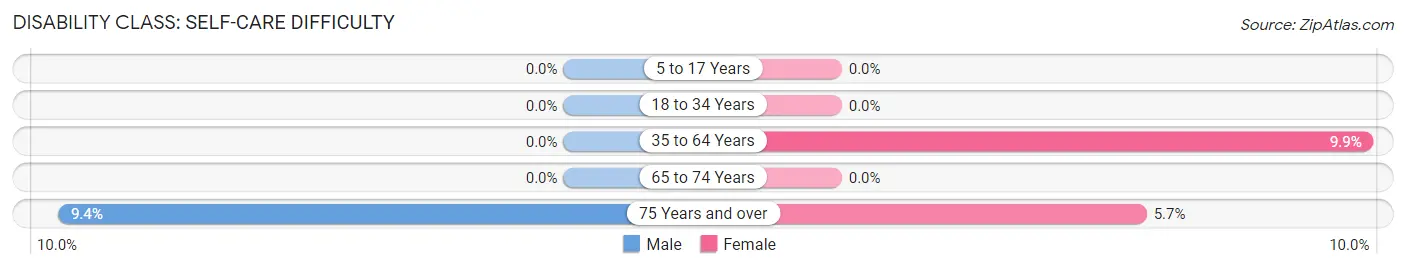
| Age Bracket | Male | Female |
| 5 to 17 Years | 0 (0.0%) | 0 (0.0%) |
| 18 to 34 Years | 0 (0.0%) | 0 (0.0%) |
| 35 to 64 Years | 0 (0.0%) | 23 (9.9%) |
| 65 to 74 Years | 0 (0.0%) | 0 (0.0%) |
| 75 Years and over | 3 (9.4%) | 3 (5.7%) |
Technology Access in Cottonwood
Computing Device Access in Cottonwood
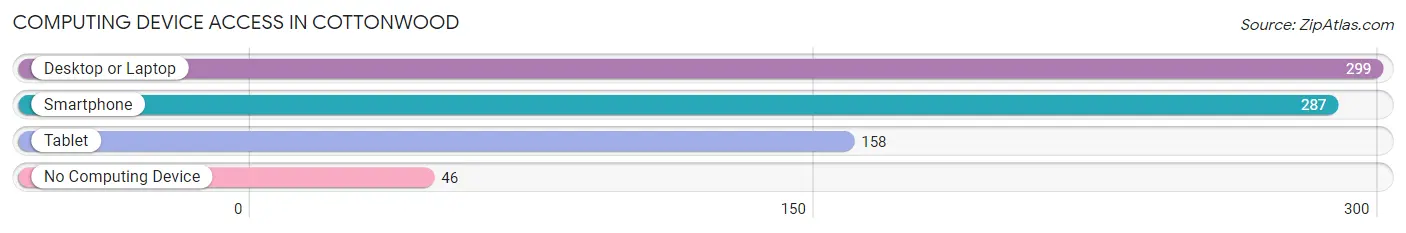
| Device Type | # Households | % Households |
| Desktop or Laptop | 299 | 76.3% |
| Smartphone | 287 | 73.2% |
| Tablet | 158 | 40.3% |
| No Computing Device | 46 | 11.7% |
| Total | 392 | 100.0% |
Internet Access in Cottonwood
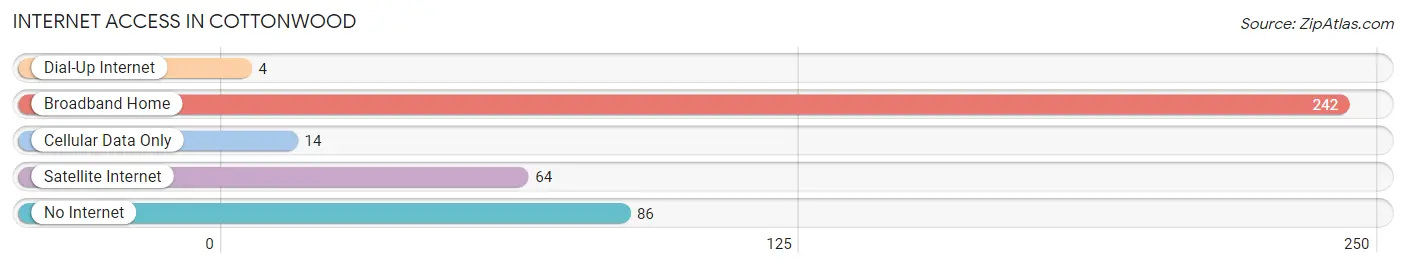
| Internet Type | # Households | % Households |
| Dial-Up Internet | 4 | 1.0% |
| Broadband Home | 242 | 61.7% |
| Cellular Data Only | 14 | 3.6% |
| Satellite Internet | 64 | 16.3% |
| No Internet | 86 | 21.9% |
| Total | 392 | 100.0% |
Cottonwood Summary
Cottonwood, Idaho is a small city located in the northern part of the state, in the county of Idaho. It is situated in the Camas Prairie, a region of rolling hills and grasslands. The city is located at the intersection of two major highways, US-95 and US-12, and is the county seat of Idaho County. The population of Cottonwood was 1,093 at the 2010 census.
History
The area that is now Cottonwood was first settled in the late 1800s by homesteaders. The town was originally known as "Cottonwood Station" and was a stop on the stagecoach line between Lewiston and Grangeville. In 1891, the town was officially incorporated as Cottonwood.
The town grew slowly but steadily over the years, and by the early 1900s, it had become a thriving agricultural center. Cottonwood was known for its production of potatoes, wheat, and other crops. The town also had a number of businesses, including a bank, a hotel, and a newspaper.
In the 1950s, the town began to decline as the agricultural industry shifted away from the area. The population of Cottonwood dropped from 1,500 in 1950 to just over 1,000 in 2010.
Geography
Cottonwood is located in the northern part of Idaho, in the county of Idaho. It is situated in the Camas Prairie, a region of rolling hills and grasslands. The city is located at the intersection of two major highways, US-95 and US-12.
The city has a total area of 1.2 square miles, all of which is land. The elevation of Cottonwood is 2,845 feet above sea level.
Economy
The economy of Cottonwood is largely based on agriculture. The town is known for its production of potatoes, wheat, and other crops. The town also has a number of businesses, including a bank, a hotel, and a newspaper.
In recent years, the town has seen an increase in tourism. The nearby Nez Perce National Historical Park is a popular destination for visitors, and the town is also home to a number of outdoor recreation opportunities, including fishing, hunting, and camping.
Demographics
As of the 2010 census, the population of Cottonwood was 1,093. The racial makeup of the town was 95.3% White, 0.7% Native American, 0.2% Asian, 0.1% Pacific Islander, 0.2% from other races, and 3.5% from two or more races. Hispanic or Latino of any race were 1.2% of the population.
The median income for a household in Cottonwood was $30,000, and the median income for a family was $35,000. The per capita income for the town was $15,000. About 15.3% of families and 17.2% of the population were below the poverty line, including 22.2% of those under age 18 and 8.3% of those age 65 or over.
Common Questions
What is the Total Population of Cottonwood?
Total Population of Cottonwood is 1,243.
What is the Total Male Population of Cottonwood?
Total Male Population of Cottonwood is 574.
What is the Total Female Population of Cottonwood?
Total Female Population of Cottonwood is 669.
What is the Ratio of Males per 100 Females in Cottonwood?
There are 85.80 Males per 100 Females in Cottonwood.
What is the Ratio of Females per 100 Males in Cottonwood?
There are 116.55 Females per 100 Males in Cottonwood.
What is the Median Population Age in Cottonwood?
Median Population Age in Cottonwood is 33.1 Years.
What is the Average Family Size in Cottonwood
Average Family Size in Cottonwood is 4.2 People.
What is the Average Household Size in Cottonwood
Average Household Size in Cottonwood is 3.1 People.
What is Per Capita Income in Cottonwood?
Per Capita income in Cottonwood is $23,579.
What is the Median Family Income in Cottonwood?
Median Family Income in Cottonwood is $63,833.
What is the Median Household income in Cottonwood?
Median Household Income in Cottonwood is $55,147.
What is Income or Wage Gap in Cottonwood?
Income or Wage Gap in Cottonwood is 68.0%.
Women in Cottonwood earn 32.0 cents for every dollar earned by a man.
What is Inequality or Gini Index in Cottonwood?
Inequality or Gini Index in Cottonwood is 0.35.
How Large is the Labor Force in Cottonwood?
There are 523 People in the Labor Forcein in Cottonwood.
What is the Percentage of People in the Labor Force in Cottonwood?
56.2% of People are in the Labor Force in Cottonwood.
What is the Unemployment Rate in Cottonwood?
Unemployment Rate in Cottonwood is 10.9%.