Moreland, ID
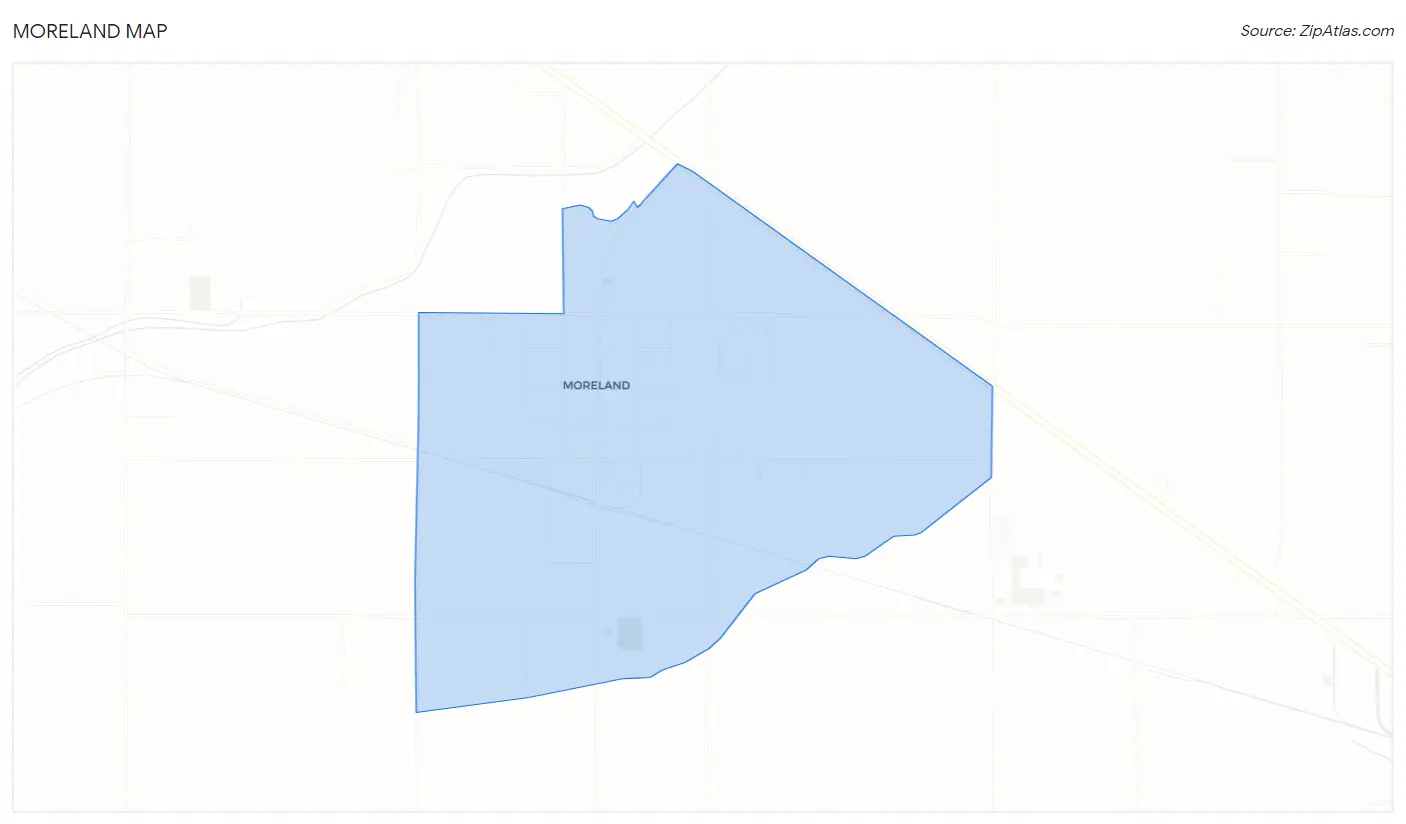
Moreland Map
Moreland Overview
1,343
TOTAL POPULATION
673
MALE POPULATION
670
FEMALE POPULATION
100.45
MALES / 100 FEMALES
99.55
FEMALES / 100 MALES
33.9
MEDIAN AGE
4.2
AVG FAMILY SIZE
3.3
AVG HOUSEHOLD SIZE
$21,713
PER CAPITA INCOME
$57,123
AVG FAMILY INCOME
$56,391
AVG HOUSEHOLD INCOME
13.1%
WAGE / INCOME GAP [ % ]
86.9¢/ $1
WAGE / INCOME GAP [ $ ]
0.37
INEQUALITY / GINI INDEX
514
LABOR FORCE [ PEOPLE ]
54.4%
PERCENT IN LABOR FORCE
Moreland Area Codes
Race in Moreland
The most populous races in Moreland are White / Caucasian (1,143 | 85.1%), Two or more Races (196 | 14.6%), and Hispanic or Latino (117 | 8.7%).
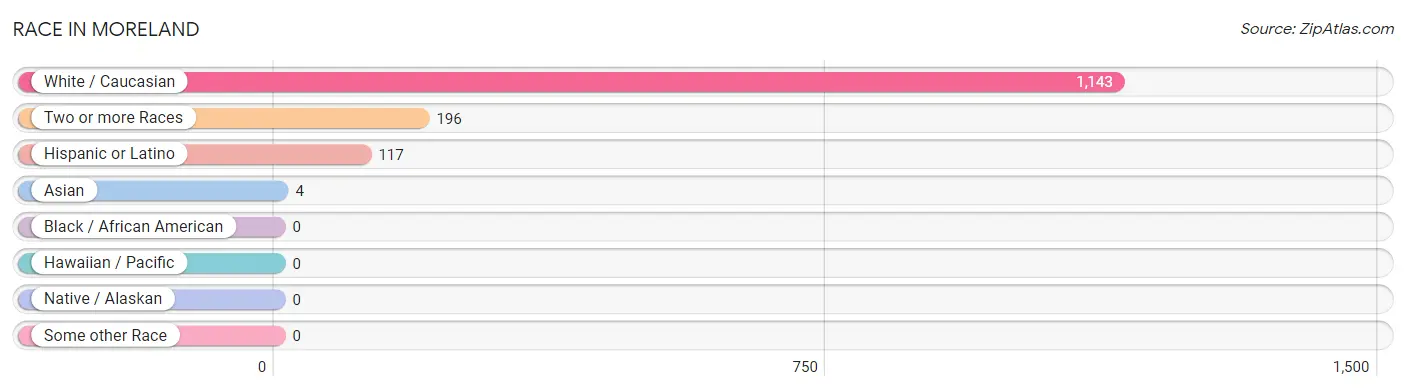
| Race | # Population | % Population |
| Asian | 4 | 0.3% |
| Black / African American | 0 | 0.0% |
| Hawaiian / Pacific | 0 | 0.0% |
| Hispanic or Latino | 117 | 8.7% |
| Native / Alaskan | 0 | 0.0% |
| White / Caucasian | 1,143 | 85.1% |
| Two or more Races | 196 | 14.6% |
| Some other Race | 0 | 0.0% |
| Total | 1,343 | 100.0% |
Ancestry in Moreland
The most populous ancestries reported in Moreland are English (404 | 30.1%), American (226 | 16.8%), German (171 | 12.7%), European (128 | 9.5%), and Mexican (117 | 8.7%), together accounting for 77.9% of all Moreland residents.
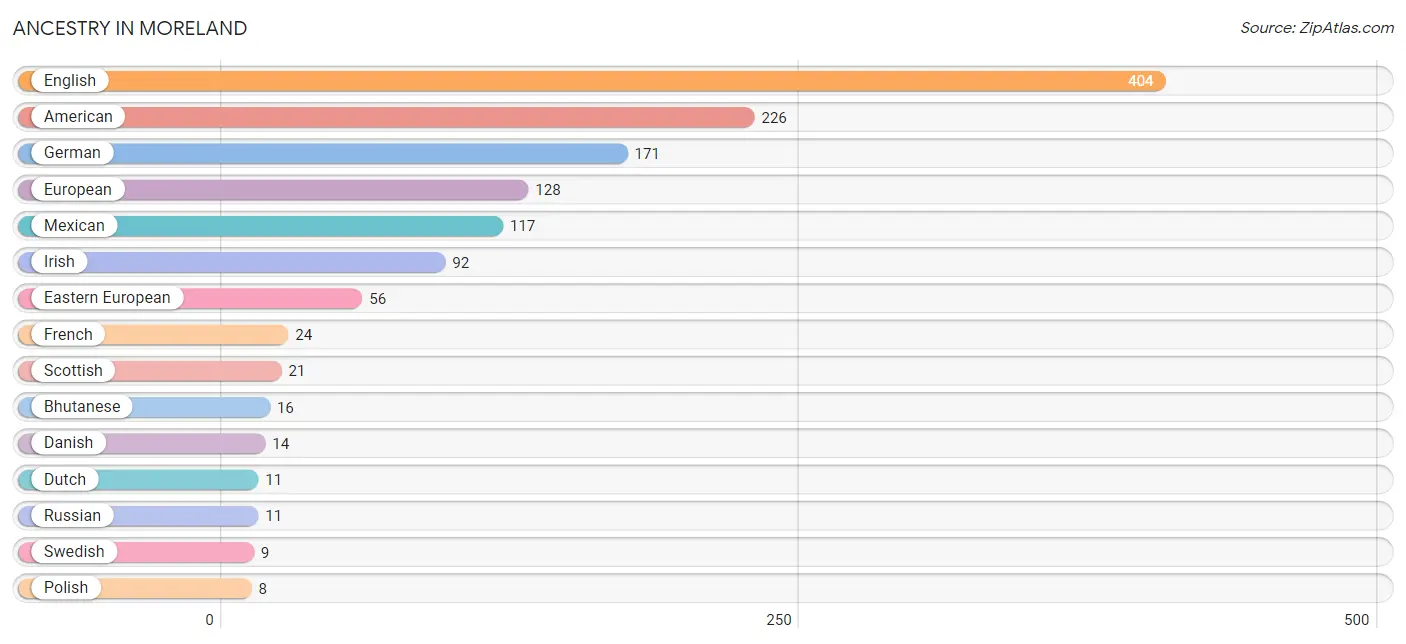
| Ancestry | # Population | % Population |
| American | 226 | 16.8% |
| Bhutanese | 16 | 1.2% |
| Danish | 14 | 1.0% |
| Dutch | 11 | 0.8% |
| Eastern European | 56 | 4.2% |
| English | 404 | 30.1% |
| European | 128 | 9.5% |
| French | 24 | 1.8% |
| German | 171 | 12.7% |
| Irish | 92 | 6.9% |
| Mexican | 117 | 8.7% |
| Polish | 8 | 0.6% |
| Russian | 11 | 0.8% |
| Scottish | 21 | 1.6% |
| Swedish | 9 | 0.7% |
| Swiss | 5 | 0.4% | View All 16 Rows |
Immigrants in Moreland
The most numerous immigrant groups reported in Moreland came from Asia (4 | 0.3%), Philippines (4 | 0.3%), and South Eastern Asia (4 | 0.3%), together accounting for 0.9% of all Moreland residents.
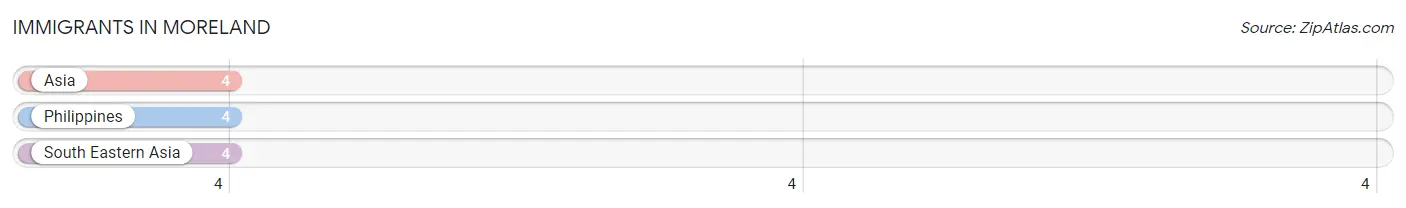
| Immigration Origin | # Population | % Population |
| Asia | 4 | 0.3% |
| Philippines | 4 | 0.3% |
| South Eastern Asia | 4 | 0.3% | View All 3 Rows |
Sex and Age in Moreland
Sex and Age in Moreland
The most populous age groups in Moreland are 10 to 14 Years (87 | 12.9%) for men and 10 to 14 Years (87 | 13.0%) for women.
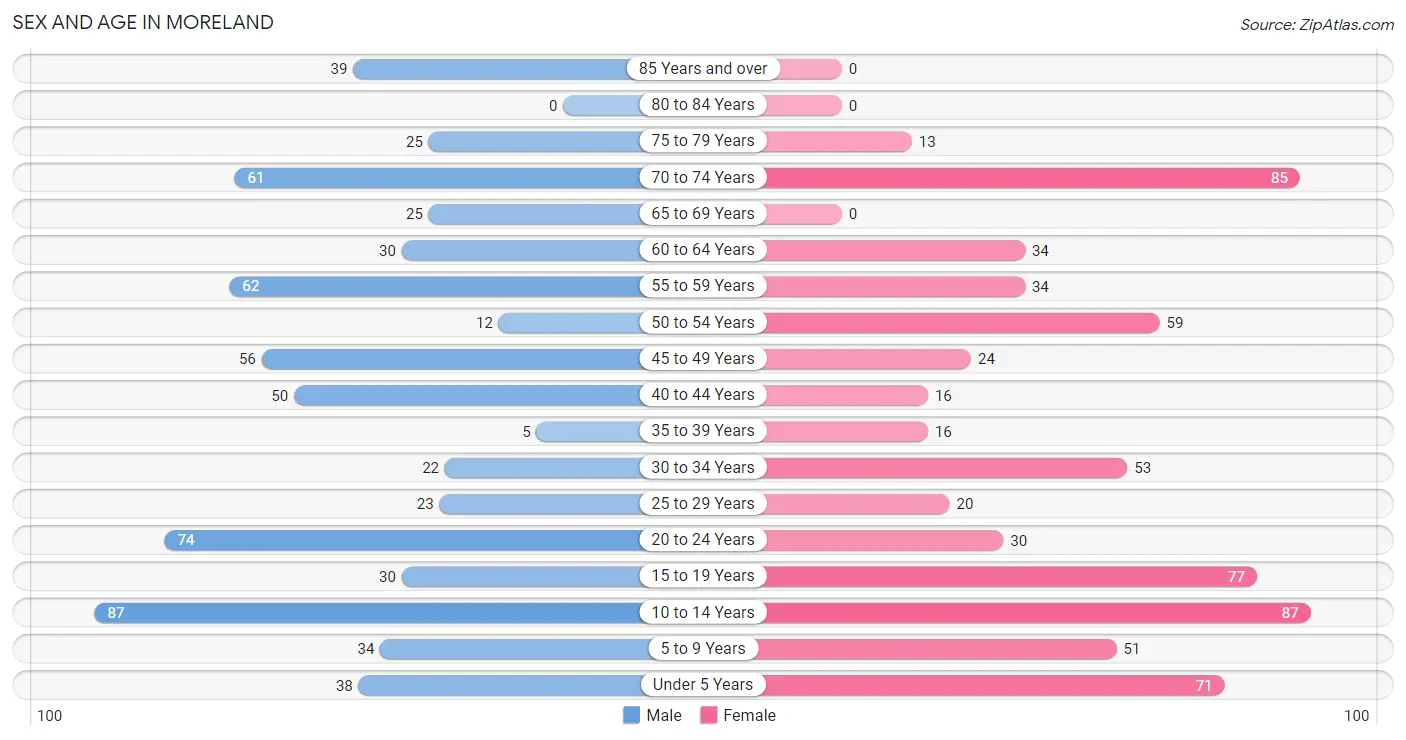
| Age Bracket | Male | Female |
| Under 5 Years | 38 (5.7%) | 71 (10.6%) |
| 5 to 9 Years | 34 (5.1%) | 51 (7.6%) |
| 10 to 14 Years | 87 (12.9%) | 87 (13.0%) |
| 15 to 19 Years | 30 (4.5%) | 77 (11.5%) |
| 20 to 24 Years | 74 (11.0%) | 30 (4.5%) |
| 25 to 29 Years | 23 (3.4%) | 20 (3.0%) |
| 30 to 34 Years | 22 (3.3%) | 53 (7.9%) |
| 35 to 39 Years | 5 (0.7%) | 16 (2.4%) |
| 40 to 44 Years | 50 (7.4%) | 16 (2.4%) |
| 45 to 49 Years | 56 (8.3%) | 24 (3.6%) |
| 50 to 54 Years | 12 (1.8%) | 59 (8.8%) |
| 55 to 59 Years | 62 (9.2%) | 34 (5.1%) |
| 60 to 64 Years | 30 (4.5%) | 34 (5.1%) |
| 65 to 69 Years | 25 (3.7%) | 0 (0.0%) |
| 70 to 74 Years | 61 (9.1%) | 85 (12.7%) |
| 75 to 79 Years | 25 (3.7%) | 13 (1.9%) |
| 80 to 84 Years | 0 (0.0%) | 0 (0.0%) |
| 85 Years and over | 39 (5.8%) | 0 (0.0%) |
| Total | 673 (100.0%) | 670 (100.0%) |
Families and Households in Moreland
Median Family Size in Moreland
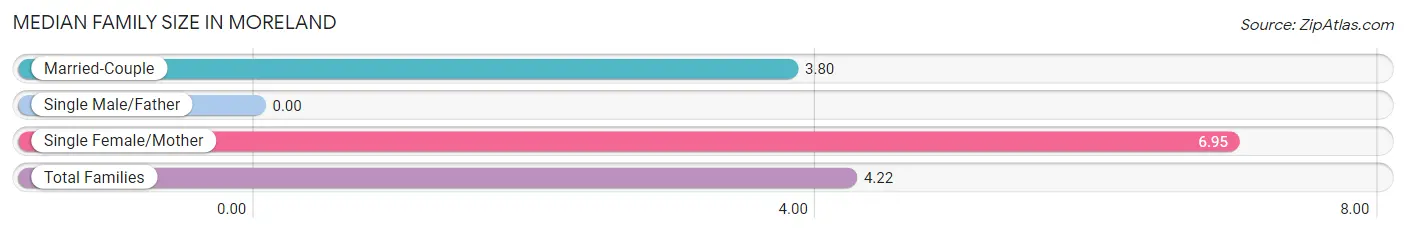
| Family Type | # Families | Family Size |
| Married-Couple | 243 (86.8%) | 3.80 |
| Single Male/Father | 0 (0.0%) | - |
| Single Female/Mother | 37 (13.2%) | 6.95 |
| Total Families | 280 (100.0%) | 4.22 |
Median Household Size in Moreland
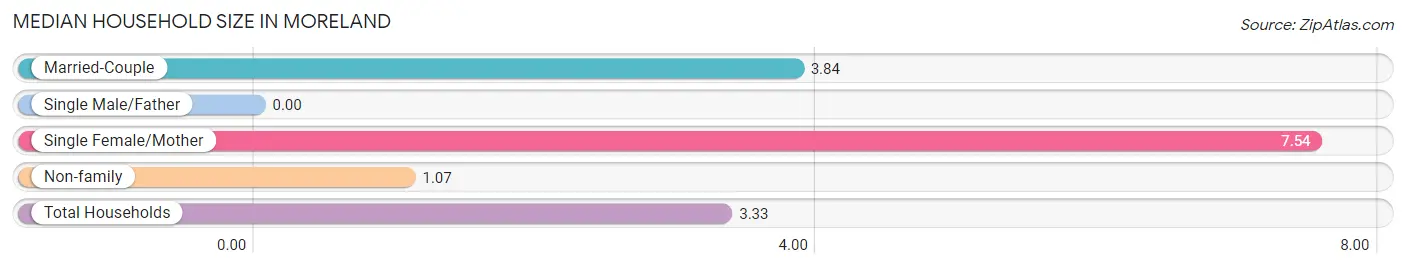
| Household Type | # Households | Household Size |
| Married-Couple | 243 (60.3%) | 3.84 |
| Single Male/Father | 0 (0.0%) | - |
| Single Female/Mother | 37 (9.2%) | 7.54 |
| Non-family | 123 (30.5%) | 1.07 |
| Total Households | 403 (100.0%) | 3.33 |
Household Size by Marriage Status in Moreland
Out of a total of 403 households in Moreland, 280 (69.5%) are family households, while 123 (30.5%) are nonfamily households. The most numerous type of family households are 2-person households, comprising 93, and the most common type of nonfamily households are 1-person households, comprising 115.
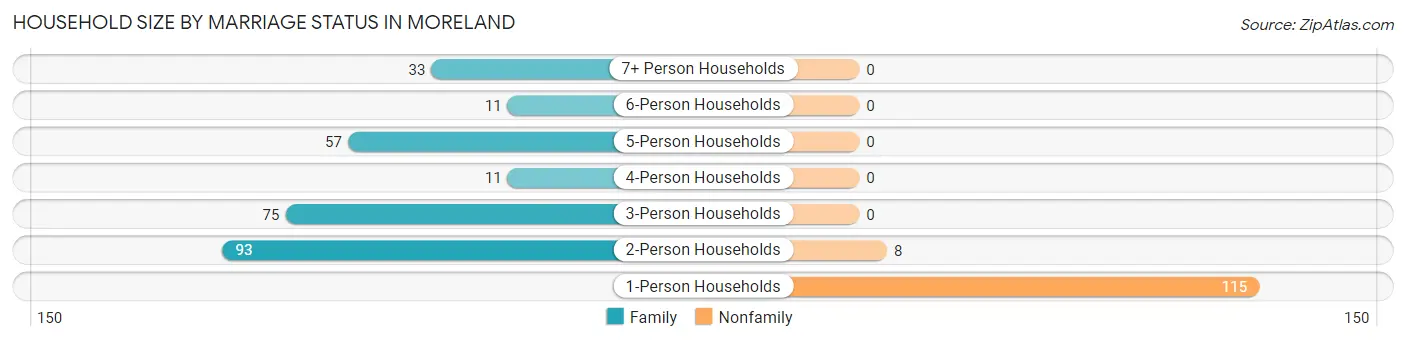
| Household Size | Family Households | Nonfamily Households |
| 1-Person Households | - | 115 (28.5%) |
| 2-Person Households | 93 (23.1%) | 8 (2.0%) |
| 3-Person Households | 75 (18.6%) | 0 (0.0%) |
| 4-Person Households | 11 (2.7%) | 0 (0.0%) |
| 5-Person Households | 57 (14.1%) | 0 (0.0%) |
| 6-Person Households | 11 (2.7%) | 0 (0.0%) |
| 7+ Person Households | 33 (8.2%) | 0 (0.0%) |
| Total | 280 (69.5%) | 123 (30.5%) |
Female Fertility in Moreland
Fertility by Age in Moreland
Average fertility rate in Moreland is 42.0 births per 1,000 women. Women in the age bracket of 20 to 34 years have the highest fertility rate with 97.0 births per 1,000 women. Women in the age bracket of 20 to 34 years acount for 100.0% of all women with births.
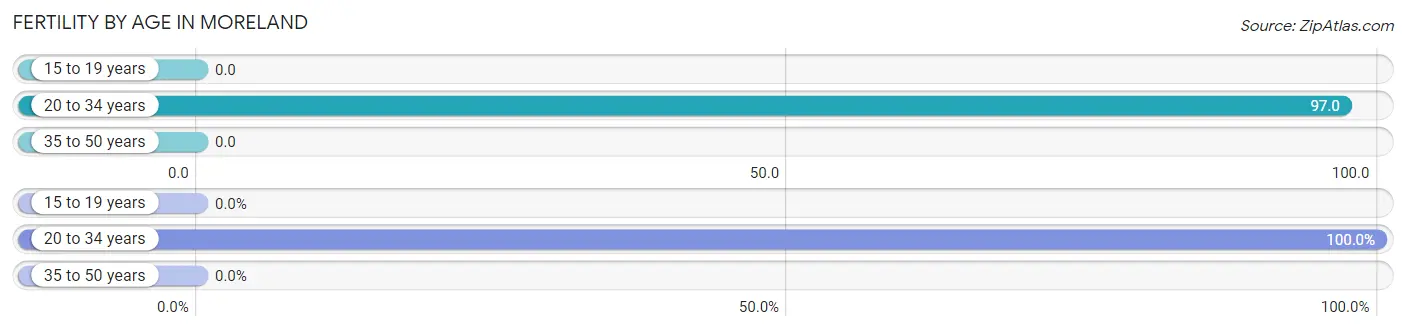
| Age Bracket | Women with Births | Births / 1,000 Women |
| 15 to 19 years | 0 (0.0%) | 0.0 |
| 20 to 34 years | 10 (100.0%) | 97.0 |
| 35 to 50 years | 0 (0.0%) | 0.0 |
| Total | 10 (100.0%) | 42.0 |
Fertility by Age by Marriage Status in Moreland
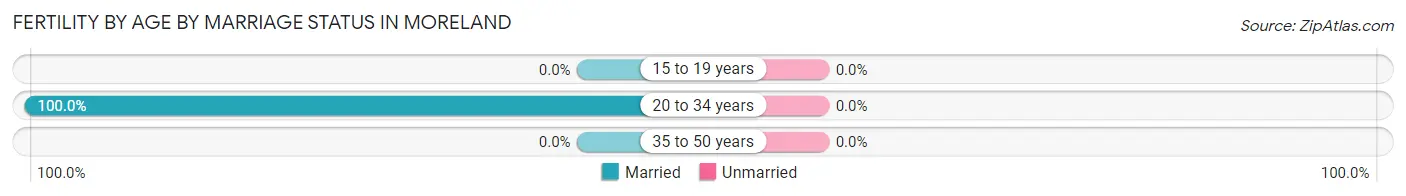
| Age Bracket | Married | Unmarried |
| 15 to 19 years | 0 (0.0%) | 0 (0.0%) |
| 20 to 34 years | 10 (100.0%) | 0 (0.0%) |
| 35 to 50 years | 0 (0.0%) | 0 (0.0%) |
| Total | 10 (100.0%) | 0 (0.0%) |
Fertility by Education in Moreland
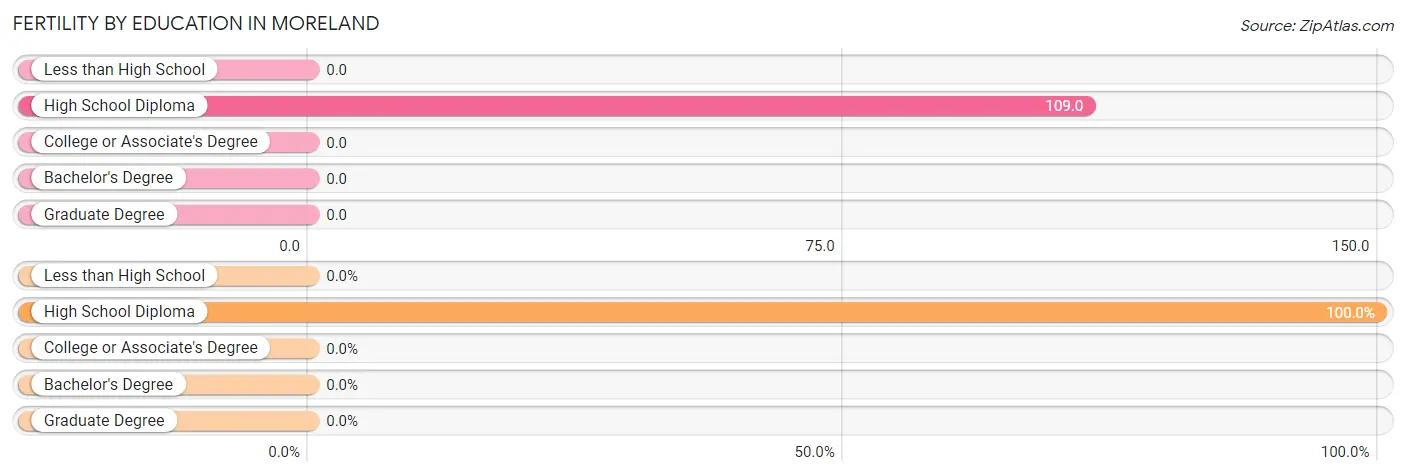
| Educational Attainment | Women with Births | Births / 1,000 Women |
| Less than High School | 0 (0.0%) | 0.0 |
| High School Diploma | 10 (100.0%) | 109.0 |
| College or Associate's Degree | 0 (0.0%) | 0.0 |
| Bachelor's Degree | 0 (0.0%) | 0.0 |
| Graduate Degree | 0 (0.0%) | 0.0 |
| Total | 10 (100.0%) | 42.0 |
Fertility by Education by Marriage Status in Moreland
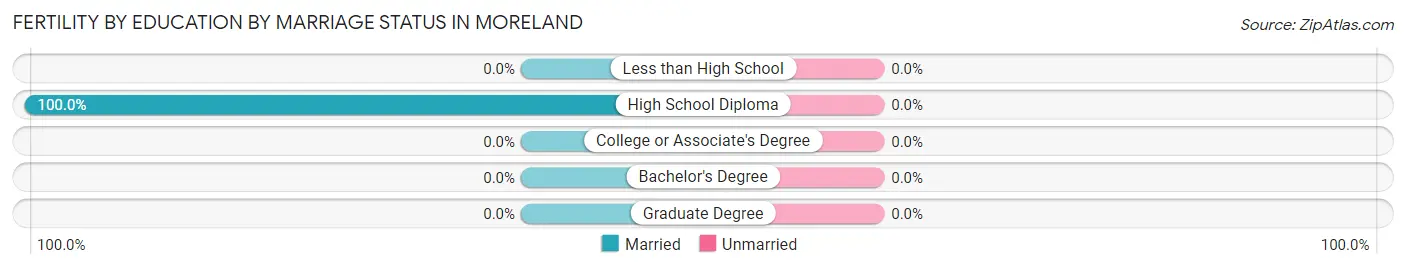
| Educational Attainment | Married | Unmarried |
| Less than High School | 0 (0.0%) | 0 (0.0%) |
| High School Diploma | 10 (100.0%) | 0 (0.0%) |
| College or Associate's Degree | 0 (0.0%) | 0 (0.0%) |
| Bachelor's Degree | 0 (0.0%) | 0 (0.0%) |
| Graduate Degree | 0 (0.0%) | 0 (0.0%) |
| Total | 10 (100.0%) | 0 (0.0%) |
Income in Moreland
Income Overview in Moreland
Per Capita Income in Moreland is $21,713, while median incomes of families and households are $57,123 and $56,391 respectively.
| Characteristic | Number | Measure |
| Per Capita Income | 1,343 | $21,713 |
| Median Family Income | 280 | $57,123 |
| Mean Family Income | 280 | $77,265 |
| Median Household Income | 403 | $56,391 |
| Mean Household Income | 403 | $68,609 |
| Income Deficit | 280 | $0 |
| Wage / Income Gap (%) | 1,343 | 13.07% |
| Wage / Income Gap ($) | 1,343 | 86.93¢ per $1 |
| Gini / Inequality Index | 1,343 | 0.37 |
Earnings by Sex in Moreland
Average Earnings in Moreland are $23,495, $24,778 for men and $21,540 for women, a difference of 13.1%.
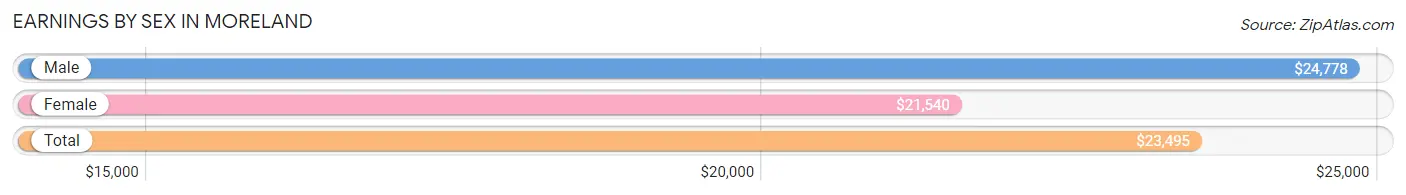
| Sex | Number | Average Earnings |
| Male | 368 (60.0%) | $24,778 |
| Female | 245 (40.0%) | $21,540 |
| Total | 613 (100.0%) | $23,495 |
Earnings by Sex by Income Bracket in Moreland
The most common earnings brackets in Moreland are $2,499 or less for men (54 | 14.7%) and $30,000 to $34,999 for women (59 | 24.1%).
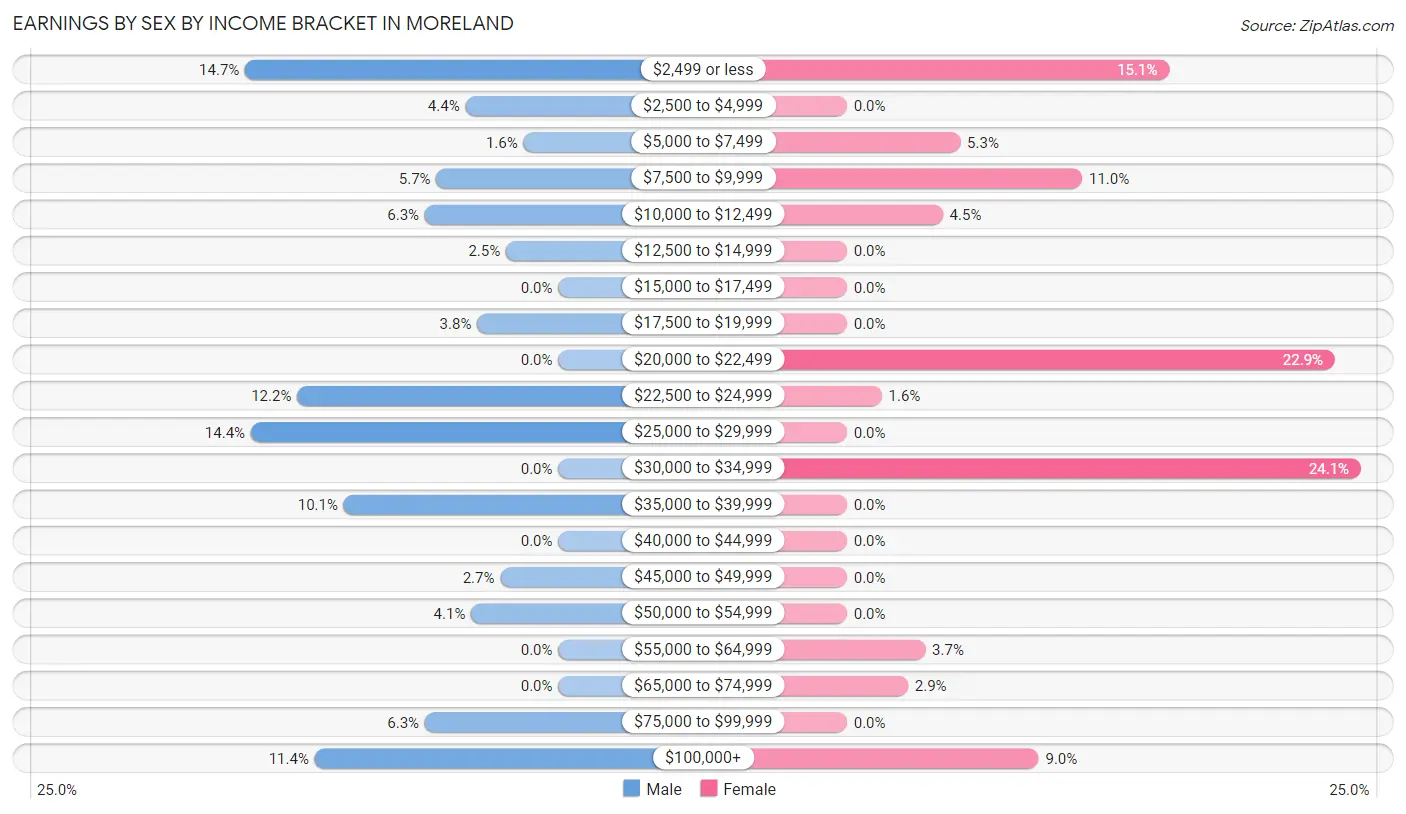
| Income | Male | Female |
| $2,499 or less | 54 (14.7%) | 37 (15.1%) |
| $2,500 to $4,999 | 16 (4.3%) | 0 (0.0%) |
| $5,000 to $7,499 | 6 (1.6%) | 13 (5.3%) |
| $7,500 to $9,999 | 21 (5.7%) | 27 (11.0%) |
| $10,000 to $12,499 | 23 (6.2%) | 11 (4.5%) |
| $12,500 to $14,999 | 9 (2.5%) | 0 (0.0%) |
| $15,000 to $17,499 | 0 (0.0%) | 0 (0.0%) |
| $17,500 to $19,999 | 14 (3.8%) | 0 (0.0%) |
| $20,000 to $22,499 | 0 (0.0%) | 56 (22.9%) |
| $22,500 to $24,999 | 45 (12.2%) | 4 (1.6%) |
| $25,000 to $29,999 | 53 (14.4%) | 0 (0.0%) |
| $30,000 to $34,999 | 0 (0.0%) | 59 (24.1%) |
| $35,000 to $39,999 | 37 (10.1%) | 0 (0.0%) |
| $40,000 to $44,999 | 0 (0.0%) | 0 (0.0%) |
| $45,000 to $49,999 | 10 (2.7%) | 0 (0.0%) |
| $50,000 to $54,999 | 15 (4.1%) | 0 (0.0%) |
| $55,000 to $64,999 | 0 (0.0%) | 9 (3.7%) |
| $65,000 to $74,999 | 0 (0.0%) | 7 (2.9%) |
| $75,000 to $99,999 | 23 (6.2%) | 0 (0.0%) |
| $100,000+ | 42 (11.4%) | 22 (9.0%) |
| Total | 368 (100.0%) | 245 (100.0%) |
Earnings by Sex by Educational Attainment in Moreland
Average earnings in Moreland are $27,120 for men and $24,063 for women, a difference of 11.3%. Men with an educational attainment of high school diploma enjoy the highest average annual earnings of $26,630, while those with high school diploma education earn the least with $26,630. Women with an educational attainment of high school diploma earn the most with the average annual earnings of $30,507, while those with bachelor's degree education have the smallest earnings of $20,789.
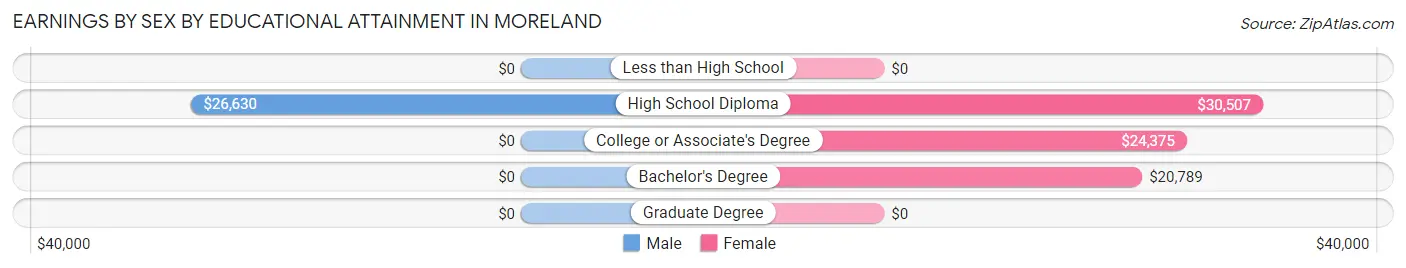
| Educational Attainment | Male Income | Female Income |
| Less than High School | - | - |
| High School Diploma | $26,630 | $30,507 |
| College or Associate's Degree | - | - |
| Bachelor's Degree | - | - |
| Graduate Degree | - | - |
| Total | $27,120 | $24,063 |
Family Income in Moreland
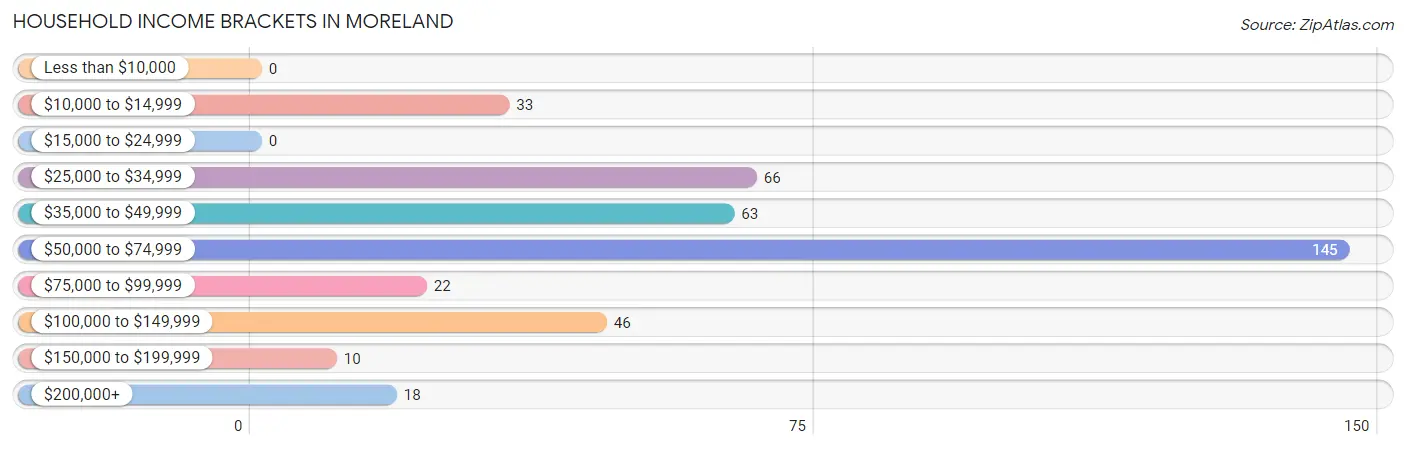
Family Income Brackets in Moreland
According to the Moreland family income data, there are 102 families falling into the $50,000 to $74,999 income range, which is the most common income bracket and makes up 36.4% of all families.
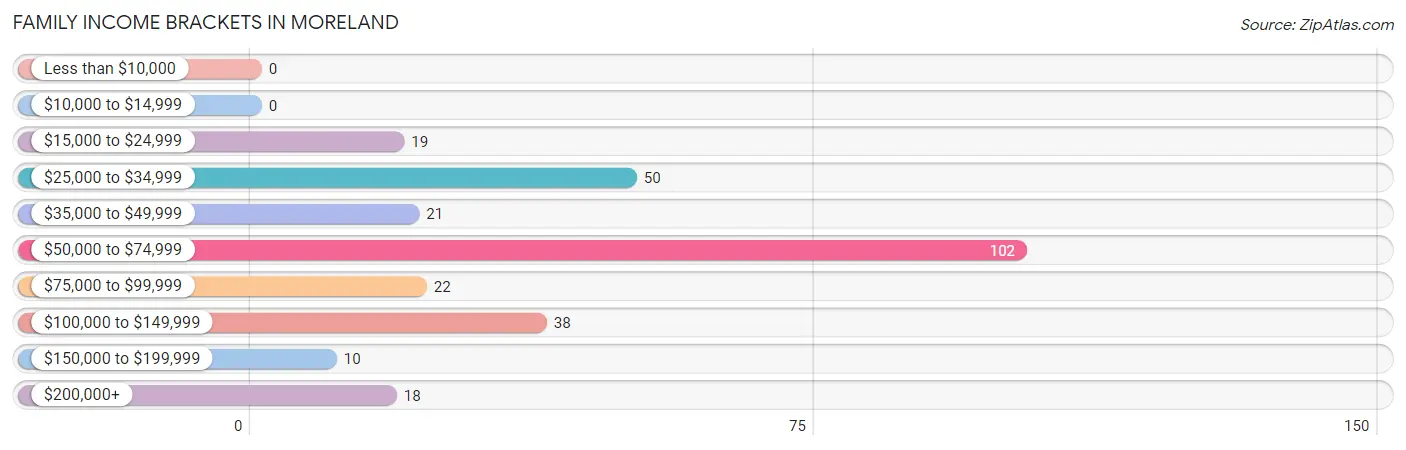
| Income Bracket | # Families | % Families |
| Less than $10,000 | 0 | 0.0% |
| $10,000 to $14,999 | 0 | 0.0% |
| $15,000 to $24,999 | 19 | 6.8% |
| $25,000 to $34,999 | 50 | 17.9% |
| $35,000 to $49,999 | 21 | 7.5% |
| $50,000 to $74,999 | 102 | 36.4% |
| $75,000 to $99,999 | 22 | 7.9% |
| $100,000 to $149,999 | 38 | 13.6% |
| $150,000 to $199,999 | 10 | 3.6% |
| $200,000+ | 18 | 6.4% |
Family Income by Famaliy Size in Moreland
5-person families (38 | 13.6%) account for the highest median family income in Moreland with $96,429 per family, while 5-person families (38 | 13.6%) have the highest median income of $19,286 per family member.
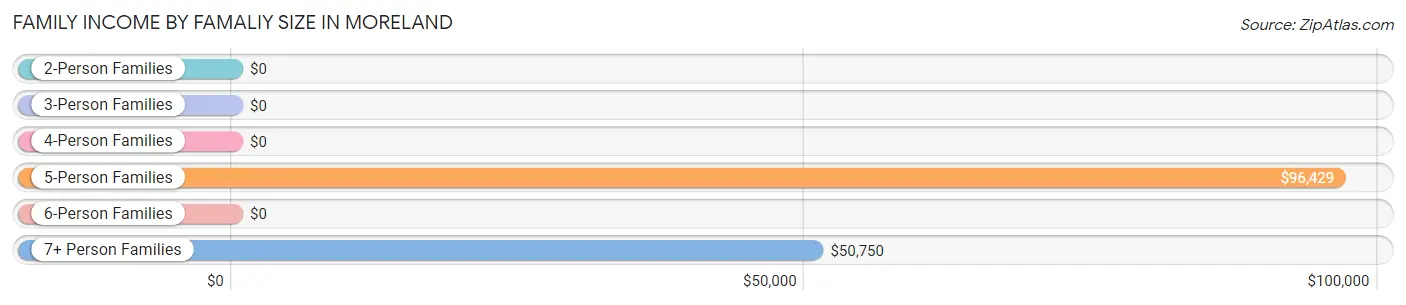
| Income Bracket | # Families | Median Income |
| 2-Person Families | 93 (33.2%) | $0 |
| 3-Person Families | 75 (26.8%) | $0 |
| 4-Person Families | 30 (10.7%) | $0 |
| 5-Person Families | 38 (13.6%) | $96,429 |
| 6-Person Families | 11 (3.9%) | $0 |
| 7+ Person Families | 33 (11.8%) | $50,750 |
| Total | 280 (100.0%) | $57,123 |
Family Income by Number of Earners in Moreland
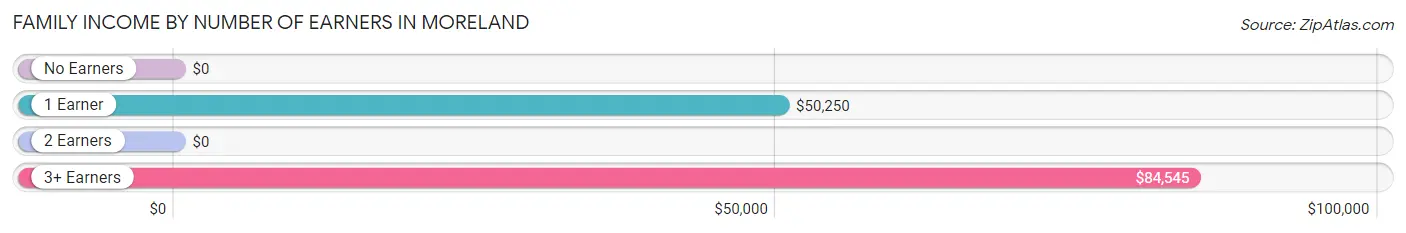
| Number of Earners | # Families | Median Income |
| No Earners | 58 (20.7%) | $0 |
| 1 Earner | 81 (28.9%) | $50,250 |
| 2 Earners | 83 (29.6%) | $0 |
| 3+ Earners | 58 (20.7%) | $84,545 |
| Total | 280 (100.0%) | $57,123 |
Household Income in Moreland
Household Income Brackets in Moreland
With 145 households falling in the category, the $50,000 to $74,999 income range is the most frequent in Moreland, accounting for 36.0% of all households.
| Income Bracket | # Households | % Households |
| Less than $10,000 | 0 | 0.0% |
| $10,000 to $14,999 | 33 | 8.2% |
| $15,000 to $24,999 | 0 | 0.0% |
| $25,000 to $34,999 | 66 | 16.4% |
| $35,000 to $49,999 | 63 | 15.6% |
| $50,000 to $74,999 | 145 | 36.0% |
| $75,000 to $99,999 | 22 | 5.5% |
| $100,000 to $149,999 | 46 | 11.4% |
| $150,000 to $199,999 | 10 | 2.5% |
| $200,000+ | 18 | 4.5% |
Household Income by Householder Age in Moreland
The median household income in Moreland is $56,391, with the highest median household income of $61,842 found in the 25 to 44 years age bracket for the primary householder. A total of 68 households (16.9%) fall into this category.
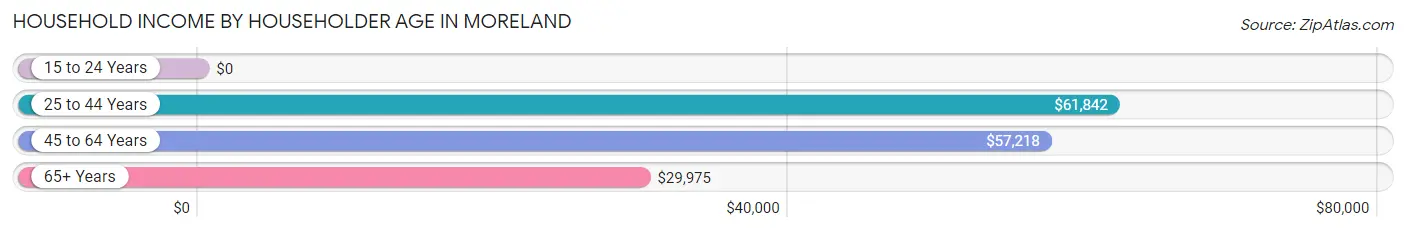
| Income Bracket | # Households | Median Income |
| 15 to 24 Years | 0 (0.0%) | $0 |
| 25 to 44 Years | 68 (16.9%) | $61,842 |
| 45 to 64 Years | 170 (42.2%) | $57,218 |
| 65+ Years | 165 (40.9%) | $29,975 |
| Total | 403 (100.0%) | $56,391 |
Poverty in Moreland
Income Below Poverty by Sex and Age in Moreland
With 13.1% poverty level for males and 23.1% for females among the residents of Moreland, 75 year old and over males and 15 year old females are the most vulnerable to poverty, with 33 males (51.6%) and 24 females (100.0%) in their respective age groups living below the poverty level.
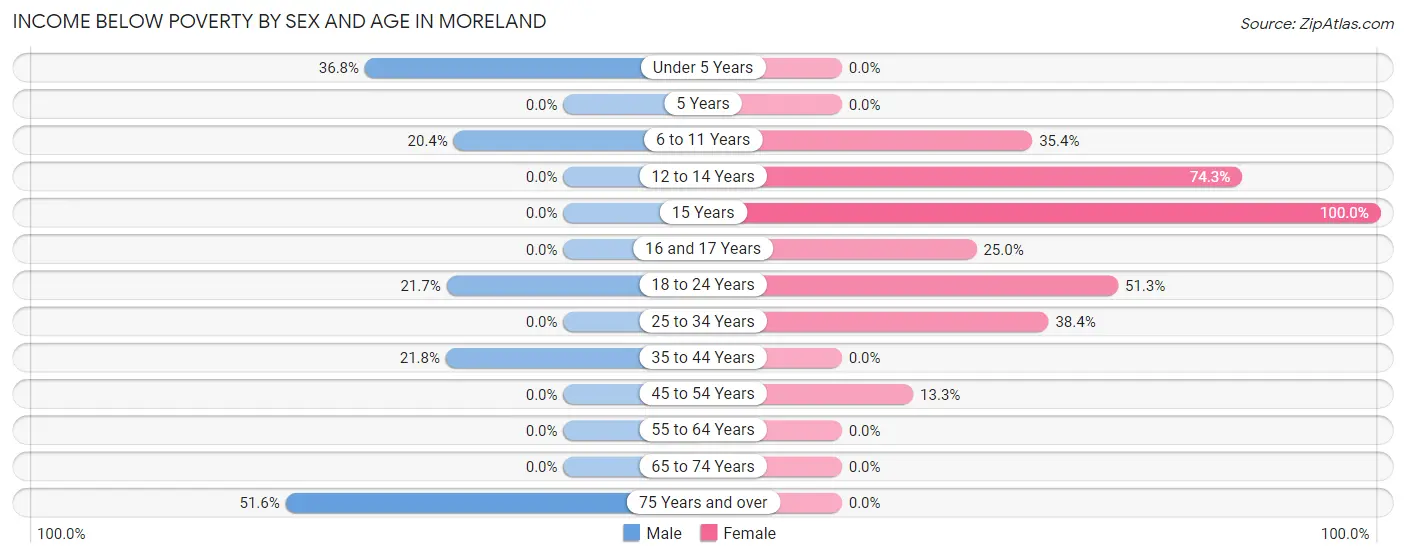
| Age Bracket | Male | Female |
| Under 5 Years | 14 (36.8%) | 0 (0.0%) |
| 5 Years | 0 (0.0%) | 0 (0.0%) |
| 6 to 11 Years | 11 (20.4%) | 35 (35.3%) |
| 12 to 14 Years | 0 (0.0%) | 26 (74.3%) |
| 15 Years | 0 (0.0%) | 24 (100.0%) |
| 16 and 17 Years | 0 (0.0%) | 11 (25.0%) |
| 18 to 24 Years | 18 (21.7%) | 20 (51.3%) |
| 25 to 34 Years | 0 (0.0%) | 28 (38.4%) |
| 35 to 44 Years | 12 (21.8%) | 0 (0.0%) |
| 45 to 54 Years | 0 (0.0%) | 11 (13.3%) |
| 55 to 64 Years | 0 (0.0%) | 0 (0.0%) |
| 65 to 74 Years | 0 (0.0%) | 0 (0.0%) |
| 75 Years and over | 33 (51.6%) | 0 (0.0%) |
| Total | 88 (13.1%) | 155 (23.1%) |
Income Above Poverty by Sex and Age in Moreland
According to the poverty statistics in Moreland, males aged 12 to 14 years and females aged under 5 years are the age groups that are most secure financially, with 100.0% of males and 100.0% of females in these age groups living above the poverty line.
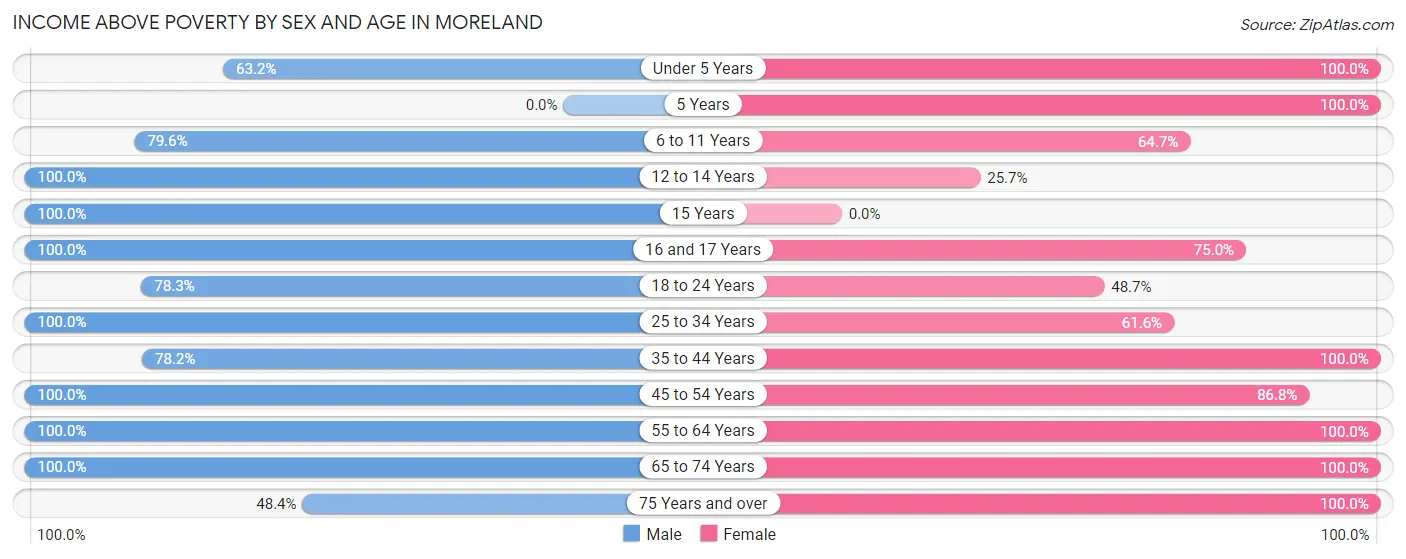
| Age Bracket | Male | Female |
| Under 5 Years | 24 (63.2%) | 71 (100.0%) |
| 5 Years | 0 (0.0%) | 4 (100.0%) |
| 6 to 11 Years | 43 (79.6%) | 64 (64.6%) |
| 12 to 14 Years | 67 (100.0%) | 9 (25.7%) |
| 15 Years | 6 (100.0%) | 0 (0.0%) |
| 16 and 17 Years | 15 (100.0%) | 33 (75.0%) |
| 18 to 24 Years | 65 (78.3%) | 19 (48.7%) |
| 25 to 34 Years | 45 (100.0%) | 45 (61.6%) |
| 35 to 44 Years | 43 (78.2%) | 32 (100.0%) |
| 45 to 54 Years | 68 (100.0%) | 72 (86.8%) |
| 55 to 64 Years | 92 (100.0%) | 68 (100.0%) |
| 65 to 74 Years | 86 (100.0%) | 85 (100.0%) |
| 75 Years and over | 31 (48.4%) | 13 (100.0%) |
| Total | 585 (86.9%) | 515 (76.9%) |
Income Below Poverty Among Married-Couple Families in Moreland
The poverty statistics for married-couple families in Moreland show that 3.7% or 9 of the total 243 families live below the poverty line. Families with 5 or more children have the highest poverty rate of 27.3%, comprising of 9 families. On the other hand, families with no children have the lowest poverty rate of 0.0%, which includes 0 families.
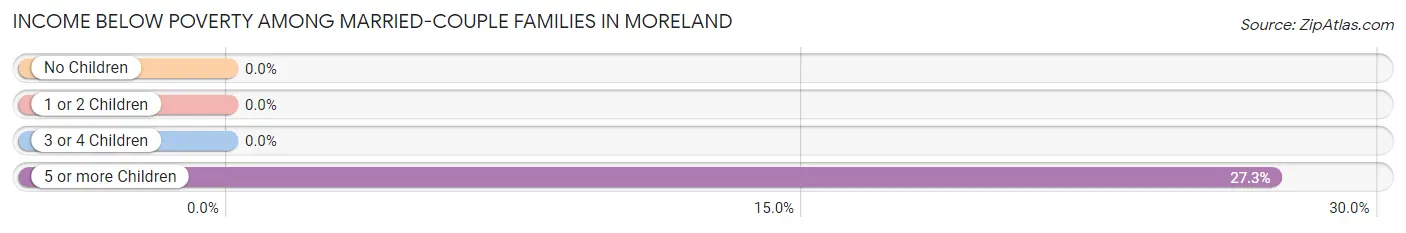
| Children | Above Poverty | Below Poverty |
| No Children | 114 (100.0%) | 0 (0.0%) |
| 1 or 2 Children | 80 (100.0%) | 0 (0.0%) |
| 3 or 4 Children | 16 (100.0%) | 0 (0.0%) |
| 5 or more Children | 24 (72.7%) | 9 (27.3%) |
| Total | 234 (96.3%) | 9 (3.7%) |
Income Below Poverty Among Single-Parent Households in Moreland
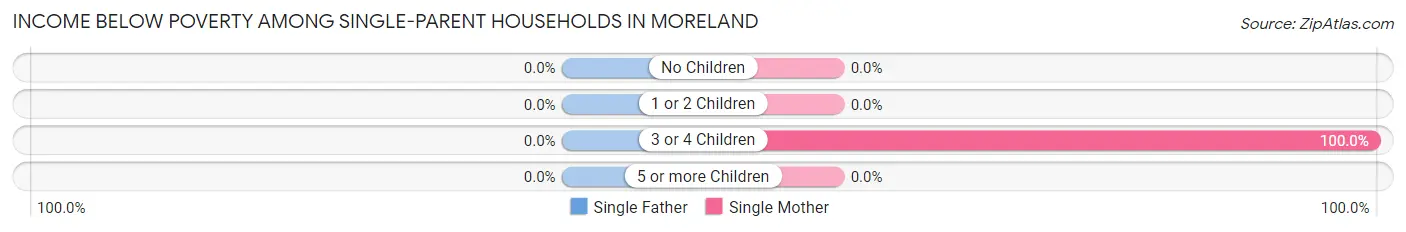
| Children | Single Father | Single Mother |
| No Children | 0 (0.0%) | 0 (0.0%) |
| 1 or 2 Children | 0 (0.0%) | 0 (0.0%) |
| 3 or 4 Children | 0 (0.0%) | 19 (100.0%) |
| 5 or more Children | 0 (0.0%) | 0 (0.0%) |
| Total | 0 (0.0%) | 19 (51.3%) |
Income Below Poverty Among Married-Couple vs Single-Parent Households in Moreland
The poverty data for Moreland shows that 9 of the married-couple family households (3.7%) and 19 of the single-parent households (51.3%) are living below the poverty level. Within the married-couple family households, those with 5 or more children have the highest poverty rate, with 9 households (27.3%) falling below the poverty line. Among the single-parent households, those with 3 or 4 children have the highest poverty rate, with 19 household (100.0%) living below poverty.
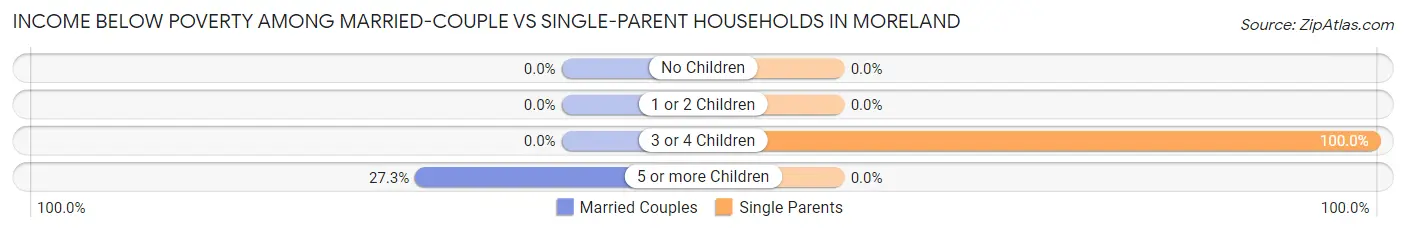
| Children | Married-Couple Families | Single-Parent Households |
| No Children | 0 (0.0%) | 0 (0.0%) |
| 1 or 2 Children | 0 (0.0%) | 0 (0.0%) |
| 3 or 4 Children | 0 (0.0%) | 19 (100.0%) |
| 5 or more Children | 9 (27.3%) | 0 (0.0%) |
| Total | 9 (3.7%) | 19 (51.3%) |
Employment Characteristics in Moreland
Employment by Class of Employer in Moreland
Among the 514 employed individuals in Moreland, private company employees (333 | 64.8%), not-for-profit organizations (47 | 9.1%), and federal government employees (43 | 8.4%) make up the most common classes of employment.
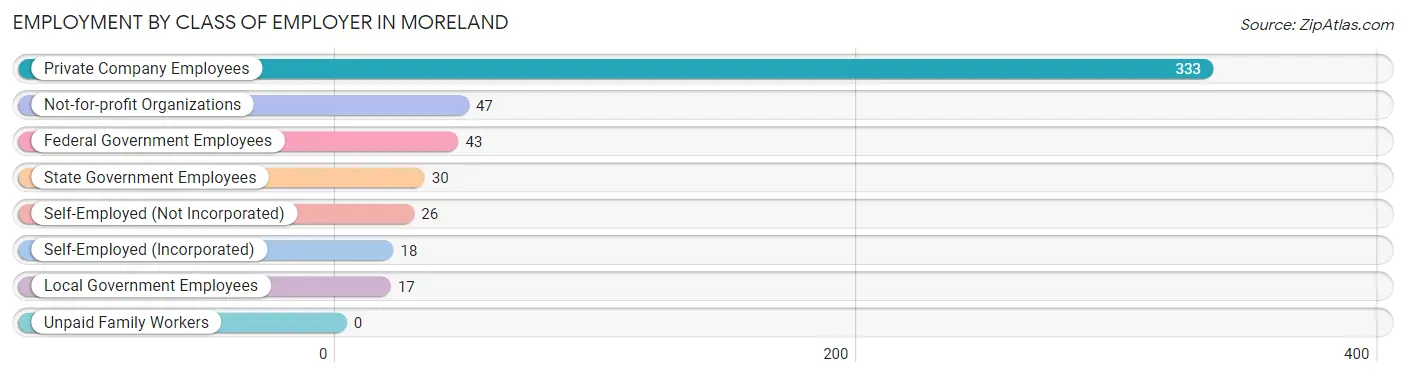
| Employer Class | # Employees | % Employees |
| Private Company Employees | 333 | 64.8% |
| Self-Employed (Incorporated) | 18 | 3.5% |
| Self-Employed (Not Incorporated) | 26 | 5.1% |
| Not-for-profit Organizations | 47 | 9.1% |
| Local Government Employees | 17 | 3.3% |
| State Government Employees | 30 | 5.8% |
| Federal Government Employees | 43 | 8.4% |
| Unpaid Family Workers | 0 | 0.0% |
| Total | 514 | 100.0% |
Employment Status by Age in Moreland
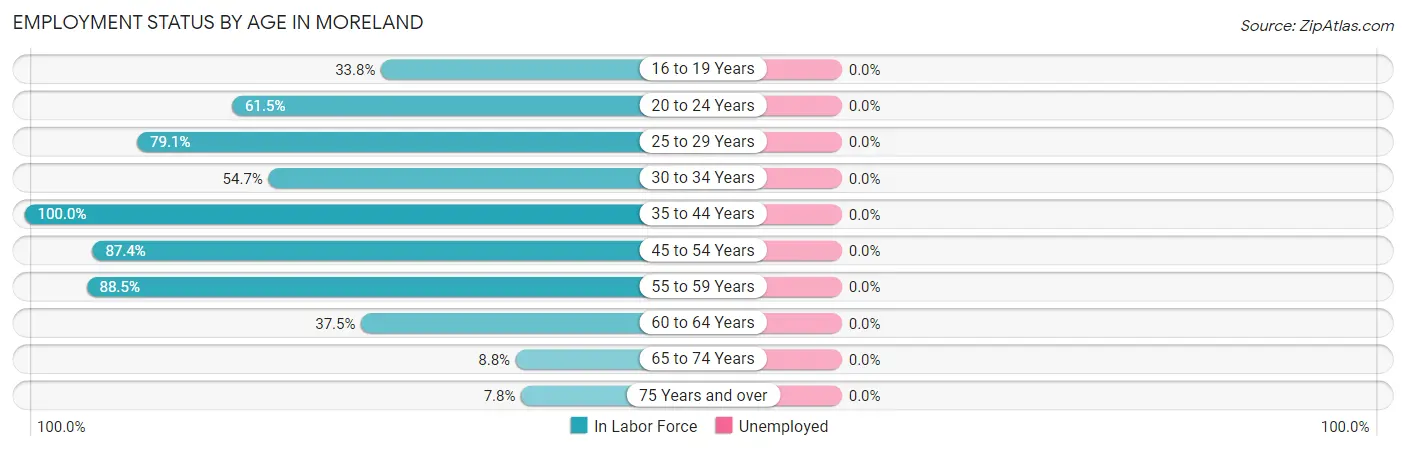
| Age Bracket | In Labor Force | Unemployed |
| 16 to 19 Years | 26 (33.8%) | 0 (0.0%) |
| 20 to 24 Years | 64 (61.5%) | 0 (0.0%) |
| 25 to 29 Years | 34 (79.1%) | 0 (0.0%) |
| 30 to 34 Years | 41 (54.7%) | 0 (0.0%) |
| 35 to 44 Years | 87 (100.0%) | 0 (0.0%) |
| 45 to 54 Years | 132 (87.4%) | 0 (0.0%) |
| 55 to 59 Years | 85 (88.5%) | 0 (0.0%) |
| 60 to 64 Years | 24 (37.5%) | 0 (0.0%) |
| 65 to 74 Years | 15 (8.8%) | 0 (0.0%) |
| 75 Years and over | 6 (7.8%) | 0 (0.0%) |
| Total | 514 (54.4%) | 0 (0.0%) |
Employment Status by Educational Attainment in Moreland
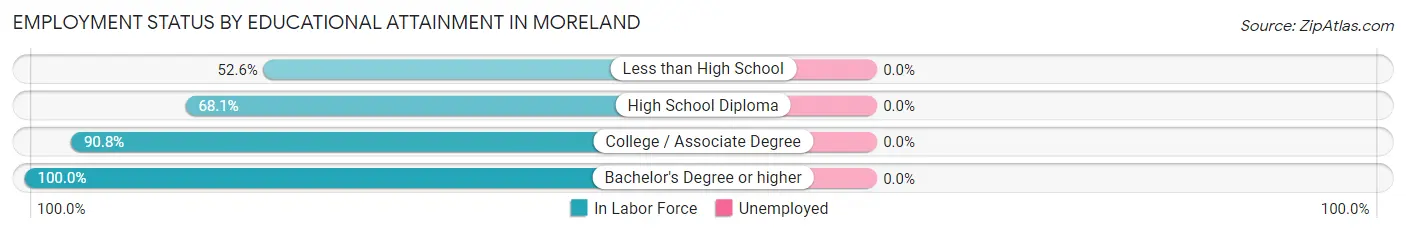
| Educational Attainment | In Labor Force | Unemployed |
| Less than High School | 10 (52.6%) | 0 (0.0%) |
| High School Diploma | 201 (68.1%) | 0 (0.0%) |
| College / Associate Degree | 99 (90.8%) | 0 (0.0%) |
| Bachelor's Degree or higher | 93 (100.0%) | 0 (0.0%) |
| Total | 403 (78.1%) | 0 (0.0%) |
Employment Occupations by Sex in Moreland
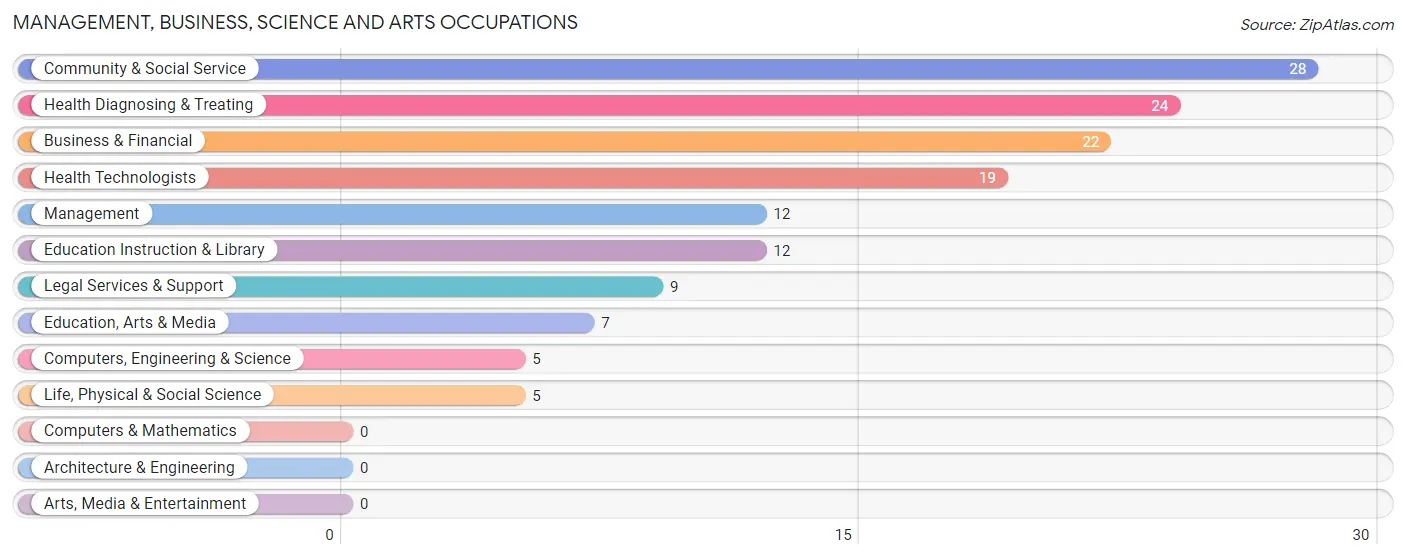
Management, Business, Science and Arts Occupations
The most common Management, Business, Science and Arts occupations in Moreland are Community & Social Service (28 | 5.4%), Health Diagnosing & Treating (24 | 4.7%), Business & Financial (22 | 4.3%), Health Technologists (19 | 3.7%), and Management (12 | 2.3%).
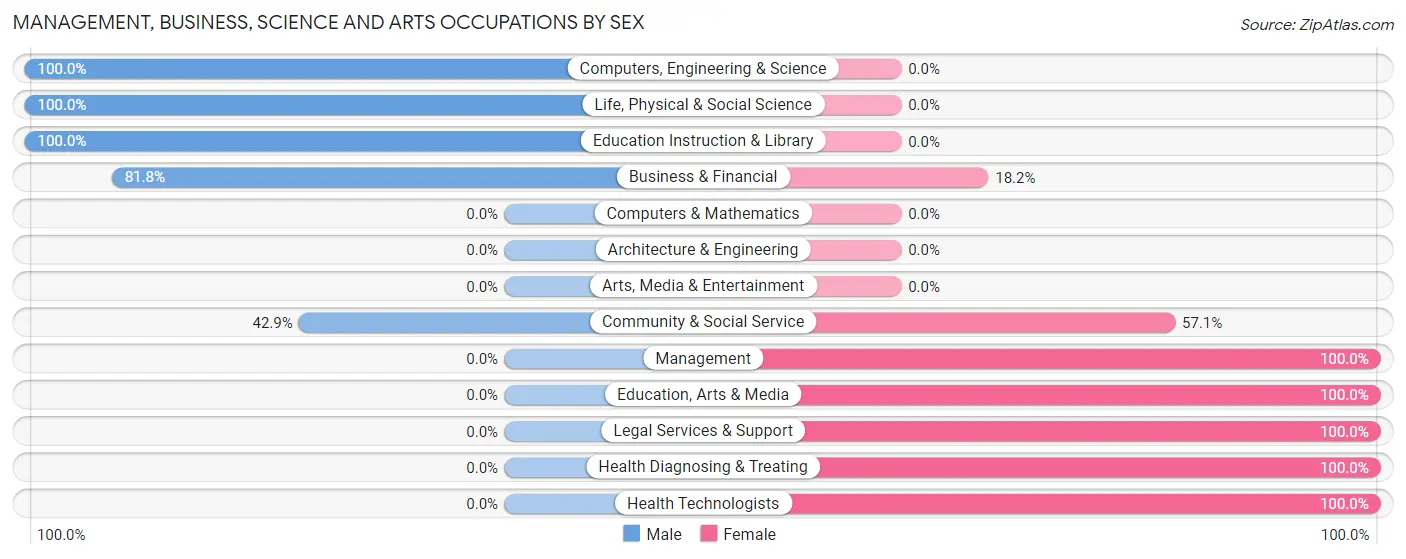
Management, Business, Science and Arts Occupations by Sex
Within the Management, Business, Science and Arts occupations in Moreland, the most male-oriented occupations are Computers, Engineering & Science (100.0%), Life, Physical & Social Science (100.0%), and Education Instruction & Library (100.0%), while the most female-oriented occupations are Management (100.0%), Education, Arts & Media (100.0%), and Legal Services & Support (100.0%).
| Occupation | Male | Female |
| Management | 0 (0.0%) | 12 (100.0%) |
| Business & Financial | 18 (81.8%) | 4 (18.2%) |
| Computers, Engineering & Science | 5 (100.0%) | 0 (0.0%) |
| Computers & Mathematics | 0 (0.0%) | 0 (0.0%) |
| Architecture & Engineering | 0 (0.0%) | 0 (0.0%) |
| Life, Physical & Social Science | 5 (100.0%) | 0 (0.0%) |
| Community & Social Service | 12 (42.9%) | 16 (57.1%) |
| Education, Arts & Media | 0 (0.0%) | 7 (100.0%) |
| Legal Services & Support | 0 (0.0%) | 9 (100.0%) |
| Education Instruction & Library | 12 (100.0%) | 0 (0.0%) |
| Arts, Media & Entertainment | 0 (0.0%) | 0 (0.0%) |
| Health Diagnosing & Treating | 0 (0.0%) | 24 (100.0%) |
| Health Technologists | 0 (0.0%) | 19 (100.0%) |
| Total (Category) | 35 (38.5%) | 56 (61.5%) |
| Total (Overall) | 298 (58.0%) | 216 (42.0%) |
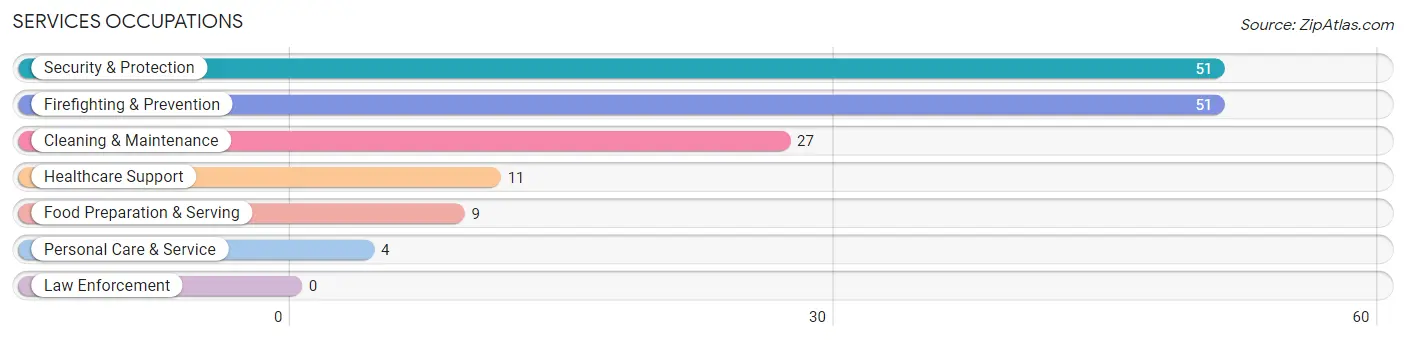
Services Occupations
The most common Services occupations in Moreland are Security & Protection (51 | 9.9%), Firefighting & Prevention (51 | 9.9%), Cleaning & Maintenance (27 | 5.2%), Healthcare Support (11 | 2.1%), and Food Preparation & Serving (9 | 1.8%).
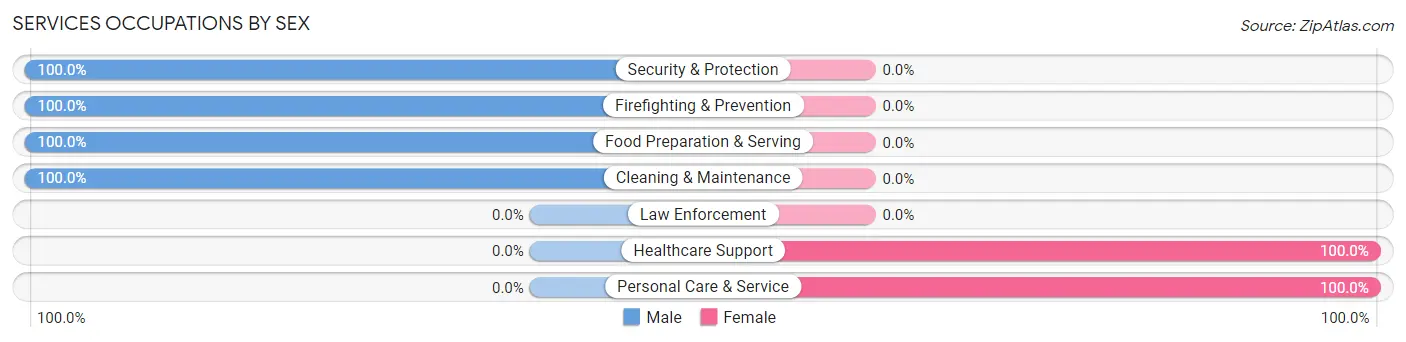
Services Occupations by Sex
Within the Services occupations in Moreland, the most male-oriented occupations are Security & Protection (100.0%), Firefighting & Prevention (100.0%), and Food Preparation & Serving (100.0%), while the most female-oriented occupations are Healthcare Support (100.0%), and Personal Care & Service (100.0%).
| Occupation | Male | Female |
| Healthcare Support | 0 (0.0%) | 11 (100.0%) |
| Security & Protection | 51 (100.0%) | 0 (0.0%) |
| Firefighting & Prevention | 51 (100.0%) | 0 (0.0%) |
| Law Enforcement | 0 (0.0%) | 0 (0.0%) |
| Food Preparation & Serving | 9 (100.0%) | 0 (0.0%) |
| Cleaning & Maintenance | 27 (100.0%) | 0 (0.0%) |
| Personal Care & Service | 0 (0.0%) | 4 (100.0%) |
| Total (Category) | 87 (85.3%) | 15 (14.7%) |
| Total (Overall) | 298 (58.0%) | 216 (42.0%) |
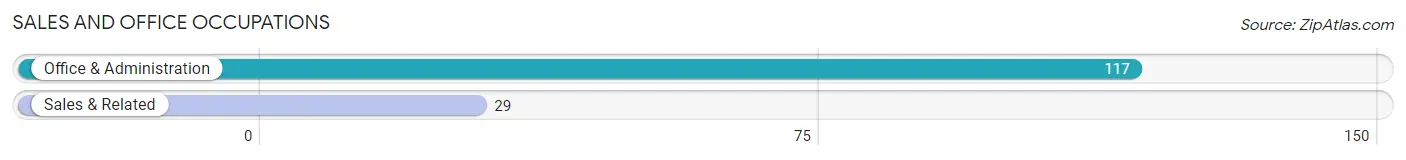
Sales and Office Occupations
The most common Sales and Office occupations in Moreland are Office & Administration (117 | 22.8%), and Sales & Related (29 | 5.6%).
Sales and Office Occupations by Sex
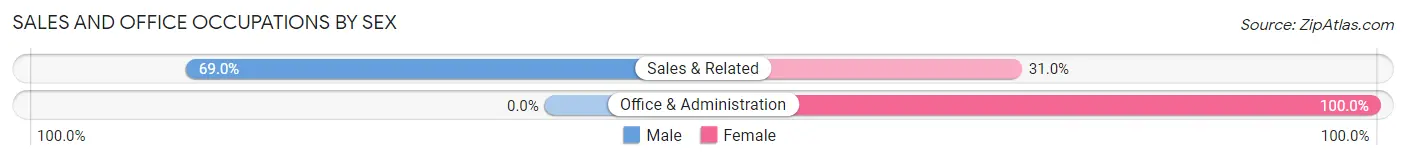
| Occupation | Male | Female |
| Sales & Related | 20 (69.0%) | 9 (31.0%) |
| Office & Administration | 0 (0.0%) | 117 (100.0%) |
| Total (Category) | 20 (13.7%) | 126 (86.3%) |
| Total (Overall) | 298 (58.0%) | 216 (42.0%) |
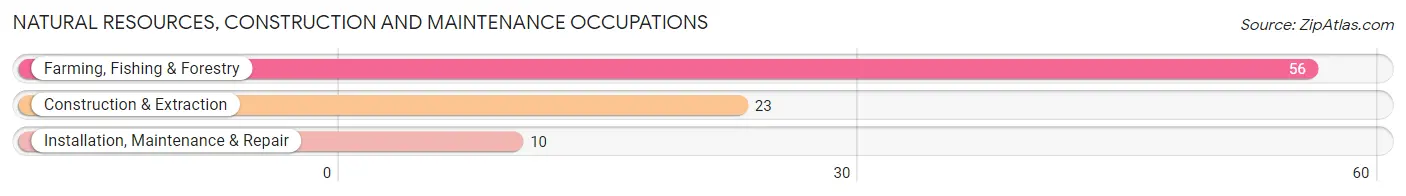
Natural Resources, Construction and Maintenance Occupations
The most common Natural Resources, Construction and Maintenance occupations in Moreland are Farming, Fishing & Forestry (56 | 10.9%), Construction & Extraction (23 | 4.5%), and Installation, Maintenance & Repair (10 | 1.9%).
Natural Resources, Construction and Maintenance Occupations by Sex
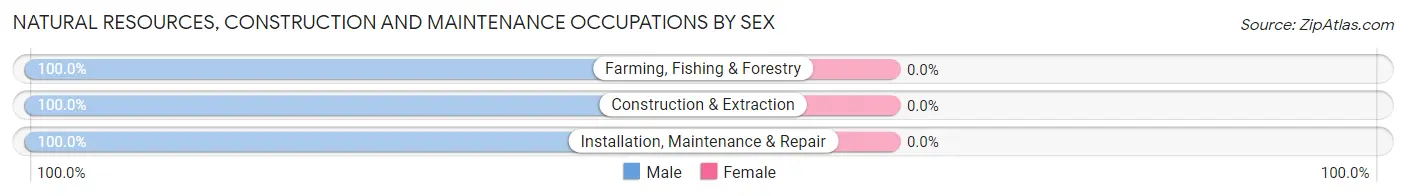
| Occupation | Male | Female |
| Farming, Fishing & Forestry | 56 (100.0%) | 0 (0.0%) |
| Construction & Extraction | 23 (100.0%) | 0 (0.0%) |
| Installation, Maintenance & Repair | 10 (100.0%) | 0 (0.0%) |
| Total (Category) | 89 (100.0%) | 0 (0.0%) |
| Total (Overall) | 298 (58.0%) | 216 (42.0%) |
Production, Transportation and Moving Occupations
The most common Production, Transportation and Moving occupations in Moreland are Transportation (34 | 6.6%), Material Moving (27 | 5.2%), and Production (25 | 4.9%).
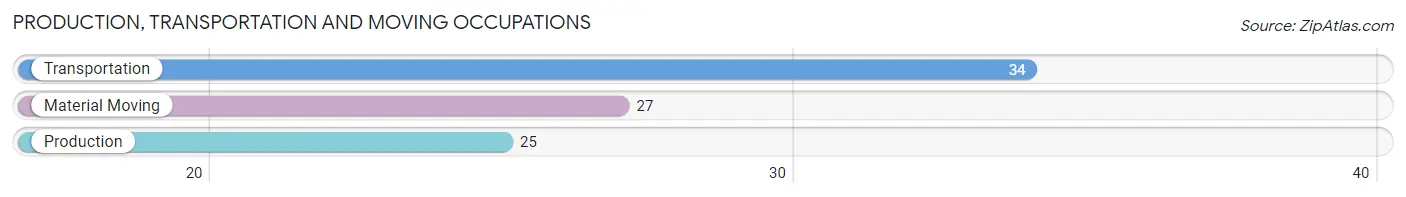
Production, Transportation and Moving Occupations by Sex
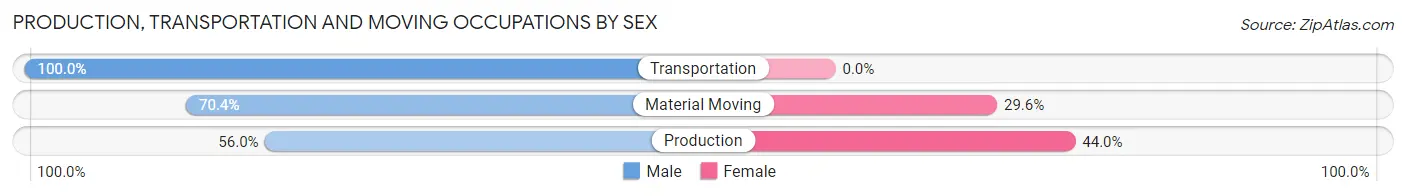
| Occupation | Male | Female |
| Production | 14 (56.0%) | 11 (44.0%) |
| Transportation | 34 (100.0%) | 0 (0.0%) |
| Material Moving | 19 (70.4%) | 8 (29.6%) |
| Total (Category) | 67 (77.9%) | 19 (22.1%) |
| Total (Overall) | 298 (58.0%) | 216 (42.0%) |
Employment Industries by Sex in Moreland
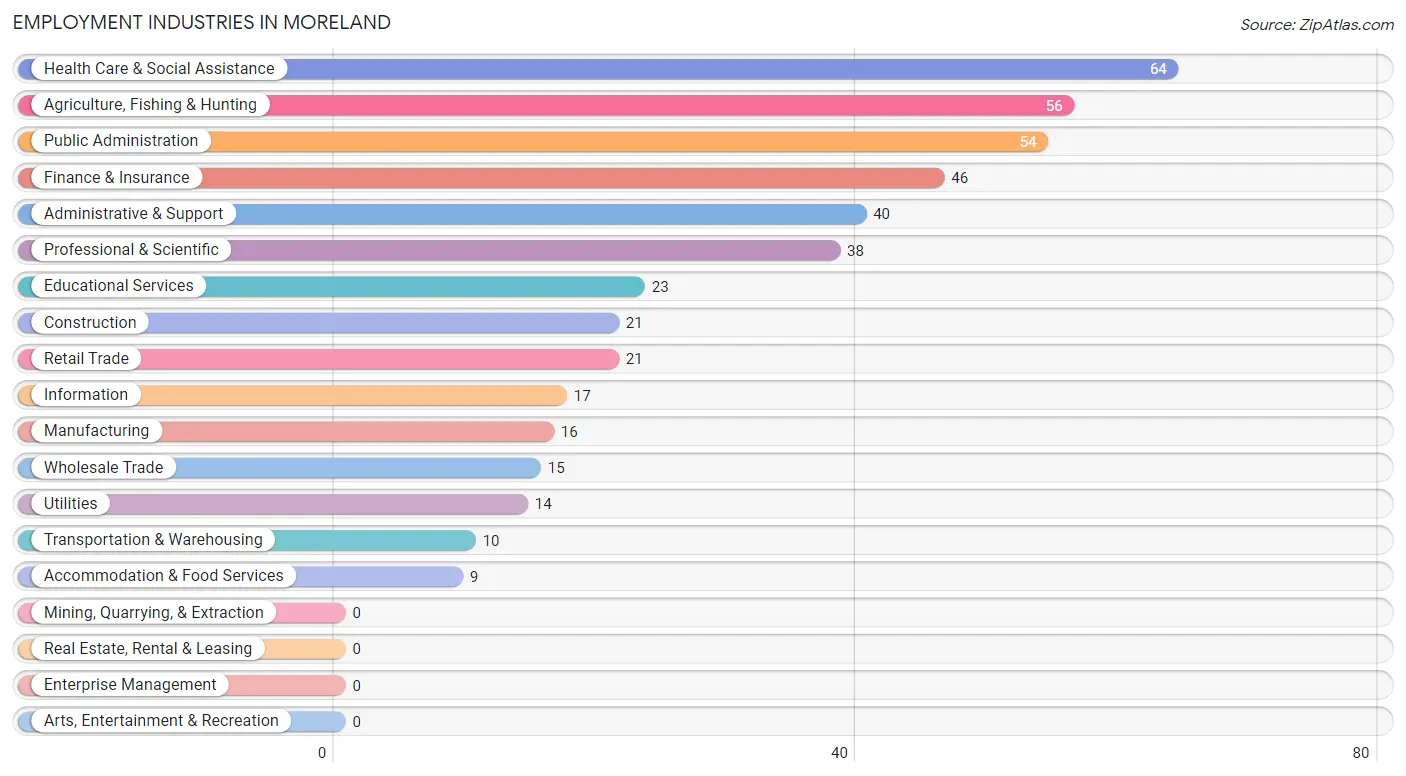
Employment Industries in Moreland
The major employment industries in Moreland include Health Care & Social Assistance (64 | 12.4%), Agriculture, Fishing & Hunting (56 | 10.9%), Public Administration (54 | 10.5%), Finance & Insurance (46 | 8.9%), and Administrative & Support (40 | 7.8%).
Employment Industries by Sex in Moreland
The Moreland industries that see more men than women are Agriculture, Fishing & Hunting (100.0%), Construction (100.0%), and Wholesale Trade (100.0%), whereas the industries that tend to have a higher number of women are Information (100.0%), Health Care & Social Assistance (100.0%), and Manufacturing (68.8%).
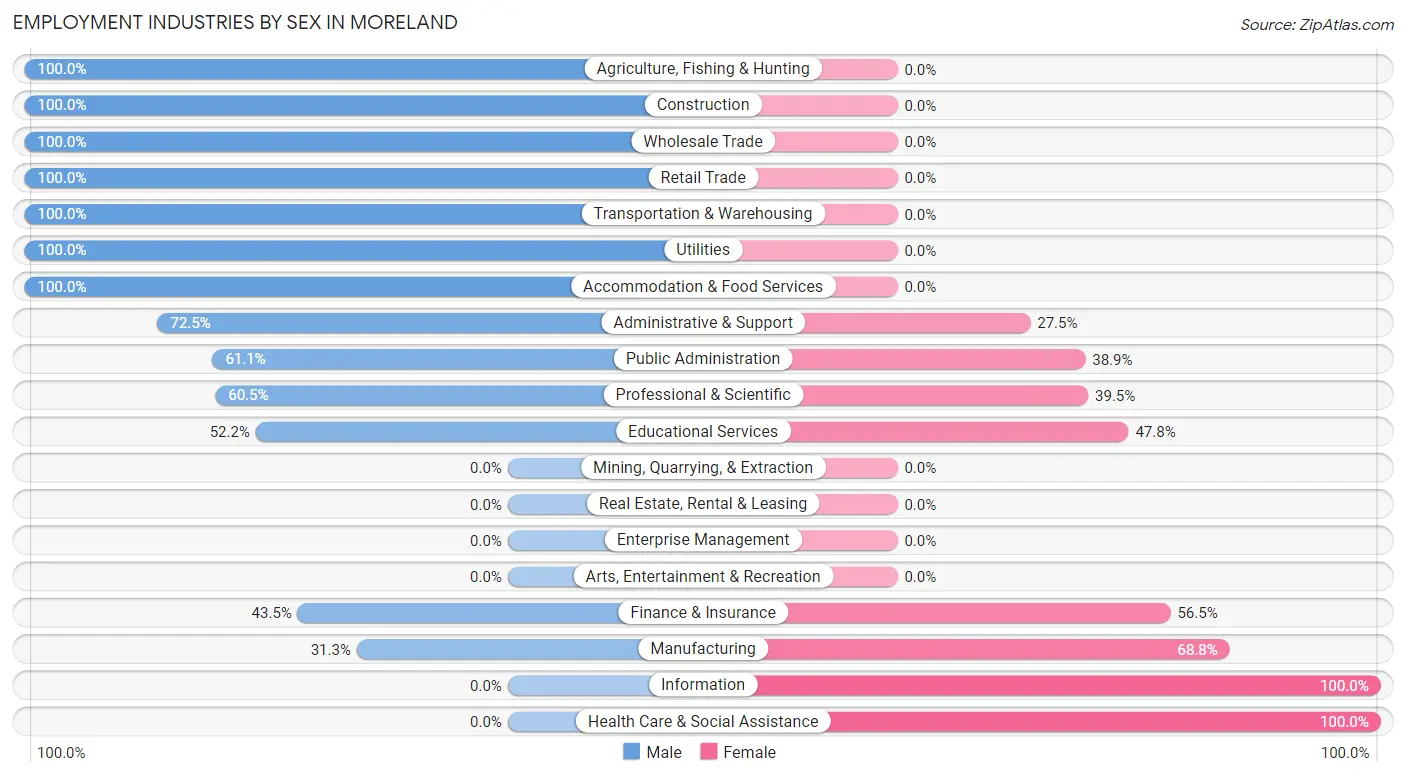
| Industry | Male | Female |
| Agriculture, Fishing & Hunting | 56 (100.0%) | 0 (0.0%) |
| Mining, Quarrying, & Extraction | 0 (0.0%) | 0 (0.0%) |
| Construction | 21 (100.0%) | 0 (0.0%) |
| Manufacturing | 5 (31.2%) | 11 (68.8%) |
| Wholesale Trade | 15 (100.0%) | 0 (0.0%) |
| Retail Trade | 21 (100.0%) | 0 (0.0%) |
| Transportation & Warehousing | 10 (100.0%) | 0 (0.0%) |
| Utilities | 14 (100.0%) | 0 (0.0%) |
| Information | 0 (0.0%) | 17 (100.0%) |
| Finance & Insurance | 20 (43.5%) | 26 (56.5%) |
| Real Estate, Rental & Leasing | 0 (0.0%) | 0 (0.0%) |
| Professional & Scientific | 23 (60.5%) | 15 (39.5%) |
| Enterprise Management | 0 (0.0%) | 0 (0.0%) |
| Administrative & Support | 29 (72.5%) | 11 (27.5%) |
| Educational Services | 12 (52.2%) | 11 (47.8%) |
| Health Care & Social Assistance | 0 (0.0%) | 64 (100.0%) |
| Arts, Entertainment & Recreation | 0 (0.0%) | 0 (0.0%) |
| Accommodation & Food Services | 9 (100.0%) | 0 (0.0%) |
| Public Administration | 33 (61.1%) | 21 (38.9%) |
| Total | 298 (58.0%) | 216 (42.0%) |
Education in Moreland
School Enrollment in Moreland
The most common levels of schooling among the 423 students in Moreland are middle school (148 | 35.0%), high school (98 | 23.2%), and elementary school (90 | 21.3%).

| School Level | # Students | % Students |
| Nursery / Preschool | 34 | 8.0% |
| Kindergarten | 0 | 0.0% |
| Elementary School | 90 | 21.3% |
| Middle School | 148 | 35.0% |
| High School | 98 | 23.2% |
| College / Undergraduate | 53 | 12.5% |
| Graduate / Professional | 0 | 0.0% |
| Total | 423 | 100.0% |
School Enrollment by Age by Funding Source in Moreland
Out of a total of 423 students who are enrolled in schools in Moreland, 99 (23.4%) attend a private institution, while the remaining 324 (76.6%) are enrolled in public schools. The age group of 5 to 9 year old has the highest likelihood of being enrolled in private schools, with 37 (49.3% in the age bracket) enrolled. Conversely, the age group of 18 to 19 year olds has the lowest likelihood of being enrolled in a private school, with 9 (100.0% in the age bracket) attending a public institution.
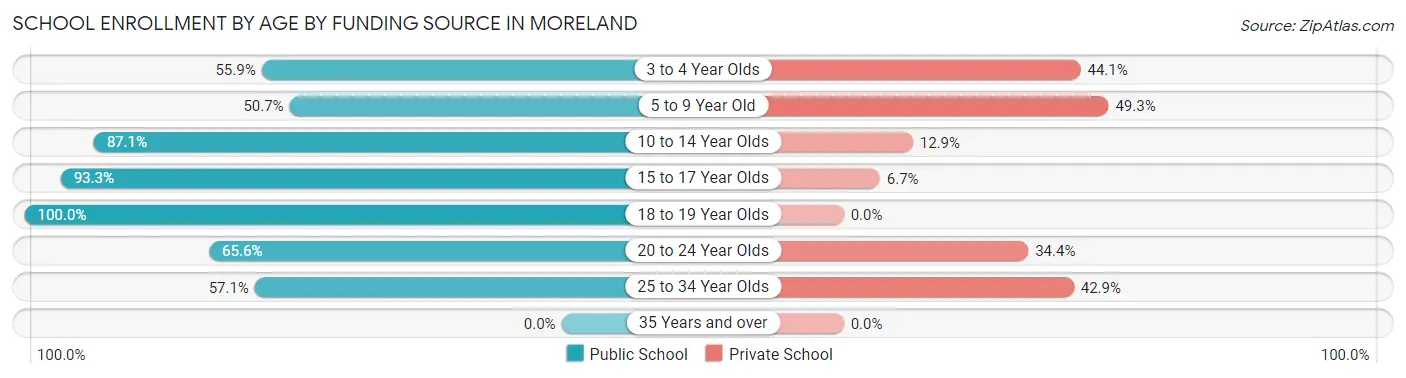
| Age Bracket | Public School | Private School |
| 3 to 4 Year Olds | 19 (55.9%) | 15 (44.1%) |
| 5 to 9 Year Old | 38 (50.7%) | 37 (49.3%) |
| 10 to 14 Year Olds | 142 (87.1%) | 21 (12.9%) |
| 15 to 17 Year Olds | 83 (93.3%) | 6 (6.7%) |
| 18 to 19 Year Olds | 9 (100.0%) | 0 (0.0%) |
| 20 to 24 Year Olds | 21 (65.6%) | 11 (34.4%) |
| 25 to 34 Year Olds | 12 (57.1%) | 9 (42.9%) |
| 35 Years and over | 0 (0.0%) | 0 (0.0%) |
| Total | 324 (76.6%) | 99 (23.4%) |
Educational Attainment by Field of Study in Moreland
Social sciences (24 | 19.8%), education (23 | 19.0%), science & technology (19 | 15.7%), computers & mathematics (18 | 14.9%), and business (18 | 14.9%) are the most common fields of study among 121 individuals in Moreland who have obtained a bachelor's degree or higher.
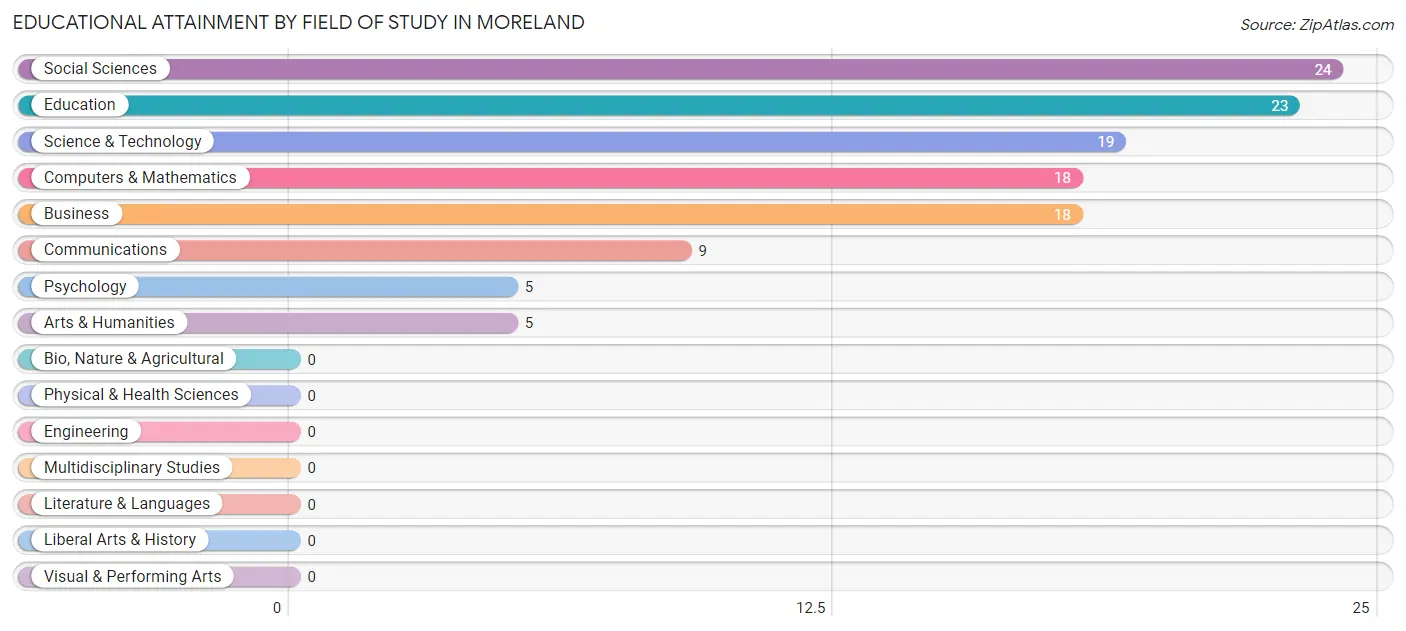
| Field of Study | # Graduates | % Graduates |
| Computers & Mathematics | 18 | 14.9% |
| Bio, Nature & Agricultural | 0 | 0.0% |
| Physical & Health Sciences | 0 | 0.0% |
| Psychology | 5 | 4.1% |
| Social Sciences | 24 | 19.8% |
| Engineering | 0 | 0.0% |
| Multidisciplinary Studies | 0 | 0.0% |
| Science & Technology | 19 | 15.7% |
| Business | 18 | 14.9% |
| Education | 23 | 19.0% |
| Literature & Languages | 0 | 0.0% |
| Liberal Arts & History | 0 | 0.0% |
| Visual & Performing Arts | 0 | 0.0% |
| Communications | 9 | 7.4% |
| Arts & Humanities | 5 | 4.1% |
| Total | 121 | 100.0% |
Transportation & Commute in Moreland
Vehicle Availability by Sex in Moreland
The most prevalent vehicle ownership categories in Moreland are males with 4 vehicles (171, accounting for 57.4%) and females with 4 vehicles (93, making up 79.2%).
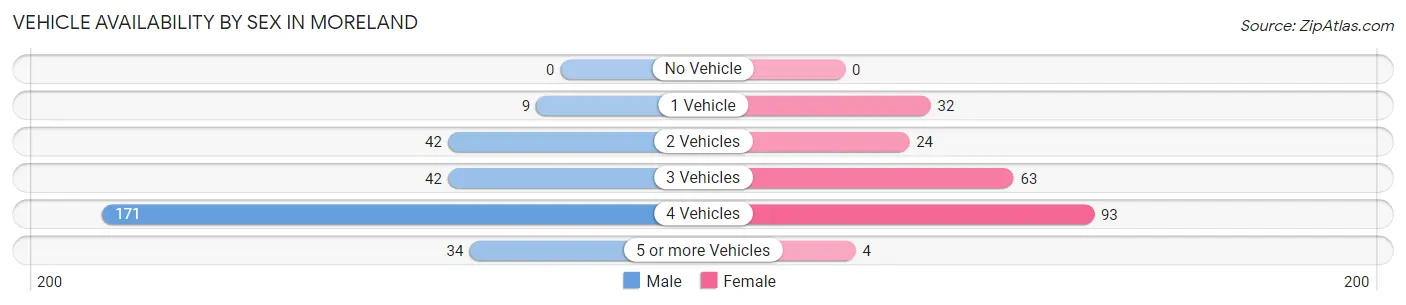
| Vehicles Available | Male | Female |
| No Vehicle | 0 (0.0%) | 0 (0.0%) |
| 1 Vehicle | 9 (3.0%) | 32 (14.8%) |
| 2 Vehicles | 42 (14.1%) | 24 (11.1%) |
| 3 Vehicles | 42 (14.1%) | 63 (29.2%) |
| 4 Vehicles | 171 (57.4%) | 93 (43.1%) |
| 5 or more Vehicles | 34 (11.4%) | 4 (1.8%) |
| Total | 298 (100.0%) | 216 (100.0%) |
Commute Time in Moreland
The most frequently occuring commute durations in Moreland are 10 to 14 minutes (89 commuters, 19.7%), 15 to 19 minutes (76 commuters, 16.8%), and 25 to 29 minutes (74 commuters, 16.4%).
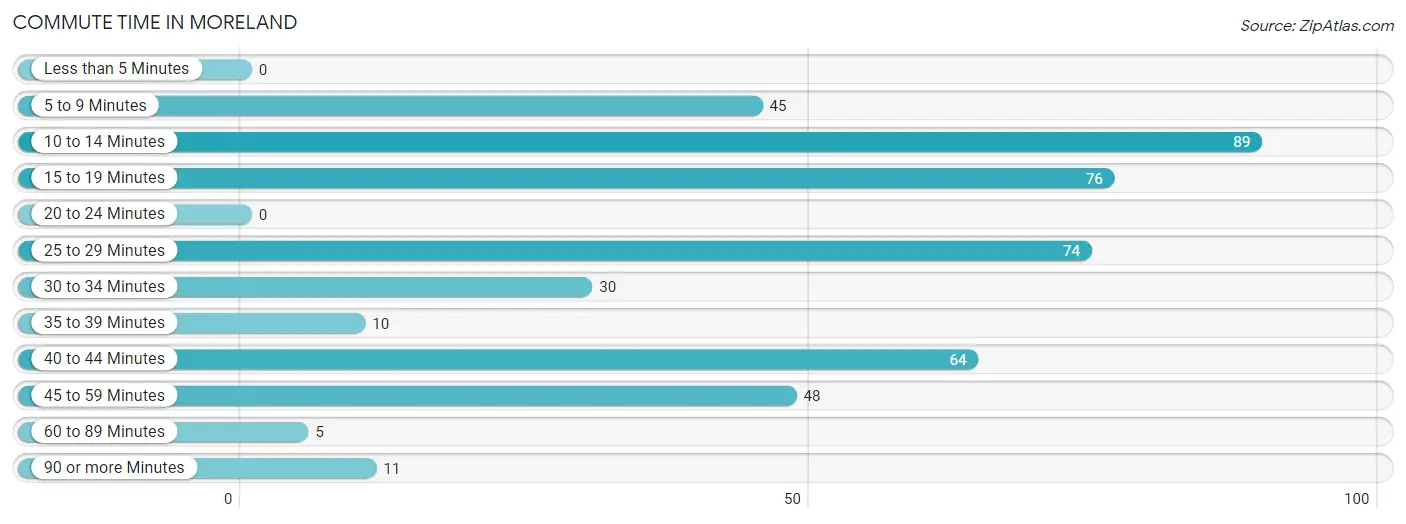
| Commute Time | # Commuters | % Commuters |
| Less than 5 Minutes | 0 | 0.0% |
| 5 to 9 Minutes | 45 | 10.0% |
| 10 to 14 Minutes | 89 | 19.7% |
| 15 to 19 Minutes | 76 | 16.8% |
| 20 to 24 Minutes | 0 | 0.0% |
| 25 to 29 Minutes | 74 | 16.4% |
| 30 to 34 Minutes | 30 | 6.6% |
| 35 to 39 Minutes | 10 | 2.2% |
| 40 to 44 Minutes | 64 | 14.2% |
| 45 to 59 Minutes | 48 | 10.6% |
| 60 to 89 Minutes | 5 | 1.1% |
| 90 or more Minutes | 11 | 2.4% |
Commute Time by Sex in Moreland
The most common commute times in Moreland are 25 to 29 minutes (45 commuters, 16.5%) for males and 10 to 14 minutes (63 commuters, 35.0%) for females.
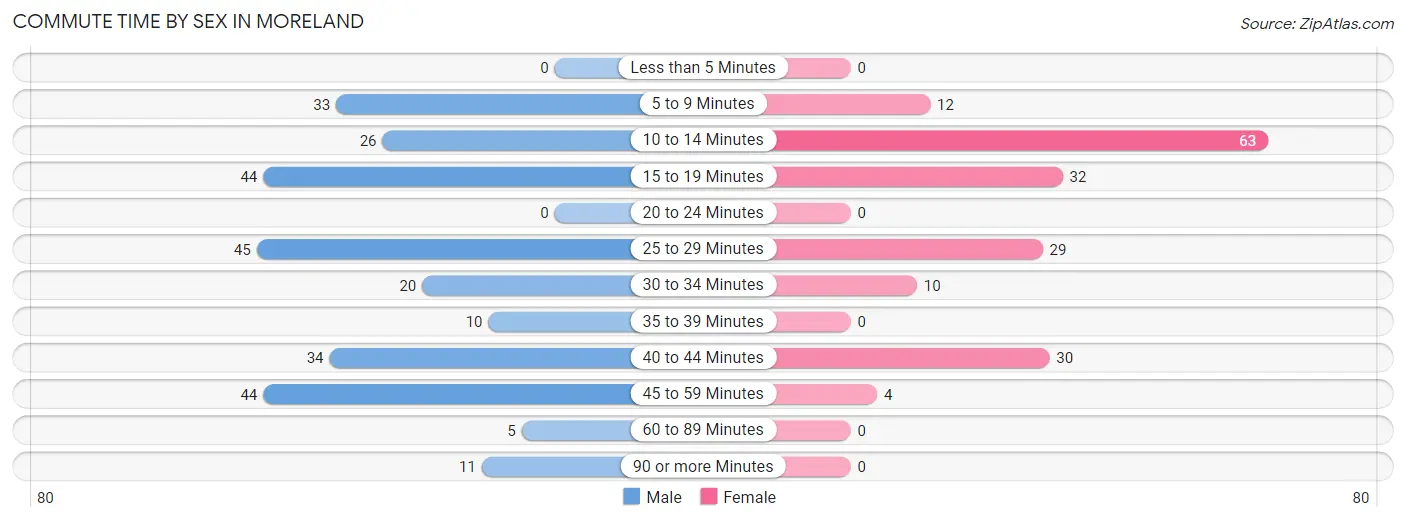
| Commute Time | Male | Female |
| Less than 5 Minutes | 0 (0.0%) | 0 (0.0%) |
| 5 to 9 Minutes | 33 (12.1%) | 12 (6.7%) |
| 10 to 14 Minutes | 26 (9.6%) | 63 (35.0%) |
| 15 to 19 Minutes | 44 (16.2%) | 32 (17.8%) |
| 20 to 24 Minutes | 0 (0.0%) | 0 (0.0%) |
| 25 to 29 Minutes | 45 (16.5%) | 29 (16.1%) |
| 30 to 34 Minutes | 20 (7.3%) | 10 (5.6%) |
| 35 to 39 Minutes | 10 (3.7%) | 0 (0.0%) |
| 40 to 44 Minutes | 34 (12.5%) | 30 (16.7%) |
| 45 to 59 Minutes | 44 (16.2%) | 4 (2.2%) |
| 60 to 89 Minutes | 5 (1.8%) | 0 (0.0%) |
| 90 or more Minutes | 11 (4.0%) | 0 (0.0%) |
Time of Departure to Work by Sex in Moreland
The most frequent times of departure to work in Moreland are 8:30 AM to 8:59 AM (88, 32.4%) for males and 6:30 AM to 6:59 AM (48, 26.7%) for females.
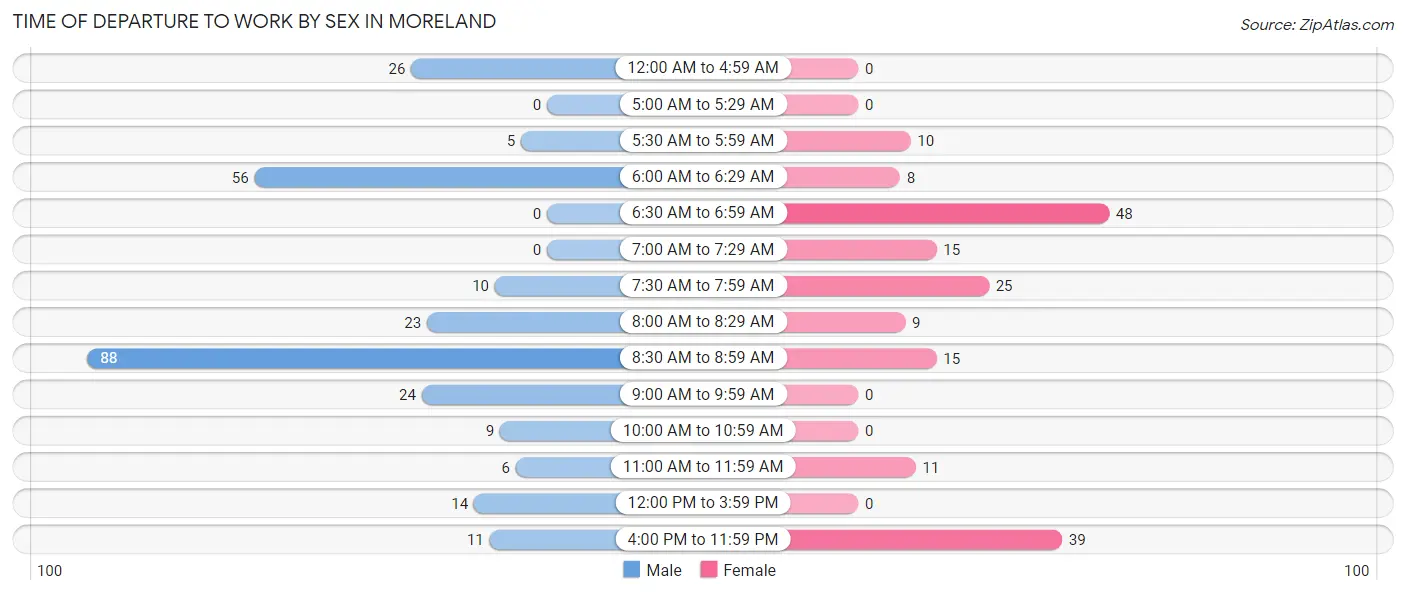
| Time of Departure | Male | Female |
| 12:00 AM to 4:59 AM | 26 (9.6%) | 0 (0.0%) |
| 5:00 AM to 5:29 AM | 0 (0.0%) | 0 (0.0%) |
| 5:30 AM to 5:59 AM | 5 (1.8%) | 10 (5.6%) |
| 6:00 AM to 6:29 AM | 56 (20.6%) | 8 (4.4%) |
| 6:30 AM to 6:59 AM | 0 (0.0%) | 48 (26.7%) |
| 7:00 AM to 7:29 AM | 0 (0.0%) | 15 (8.3%) |
| 7:30 AM to 7:59 AM | 10 (3.7%) | 25 (13.9%) |
| 8:00 AM to 8:29 AM | 23 (8.5%) | 9 (5.0%) |
| 8:30 AM to 8:59 AM | 88 (32.4%) | 15 (8.3%) |
| 9:00 AM to 9:59 AM | 24 (8.8%) | 0 (0.0%) |
| 10:00 AM to 10:59 AM | 9 (3.3%) | 0 (0.0%) |
| 11:00 AM to 11:59 AM | 6 (2.2%) | 11 (6.1%) |
| 12:00 PM to 3:59 PM | 14 (5.1%) | 0 (0.0%) |
| 4:00 PM to 11:59 PM | 11 (4.0%) | 39 (21.7%) |
| Total | 272 (100.0%) | 180 (100.0%) |
Housing Occupancy in Moreland
Occupancy by Ownership in Moreland
Of the total 403 dwellings in Moreland, owner-occupied units account for 383 (95.0%), while renter-occupied units make up 20 (5.0%).
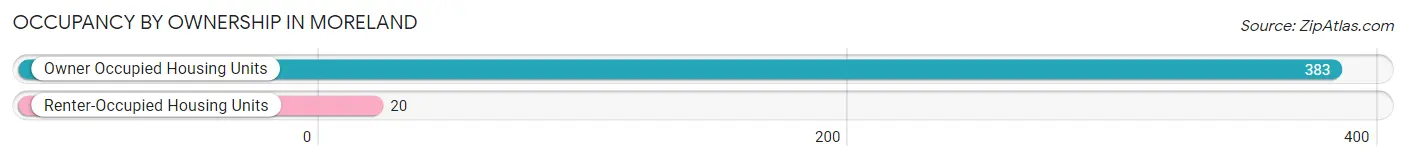
| Occupancy | # Housing Units | % Housing Units |
| Owner Occupied Housing Units | 383 | 95.0% |
| Renter-Occupied Housing Units | 20 | 5.0% |
| Total Occupied Housing Units | 403 | 100.0% |
Occupancy by Household Size in Moreland
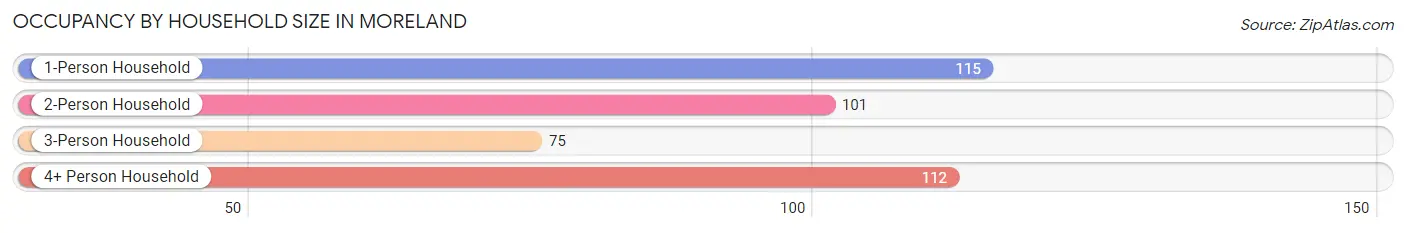
| Household Size | # Housing Units | % Housing Units |
| 1-Person Household | 115 | 28.5% |
| 2-Person Household | 101 | 25.1% |
| 3-Person Household | 75 | 18.6% |
| 4+ Person Household | 112 | 27.8% |
| Total Housing Units | 403 | 100.0% |
Occupancy by Ownership by Household Size in Moreland
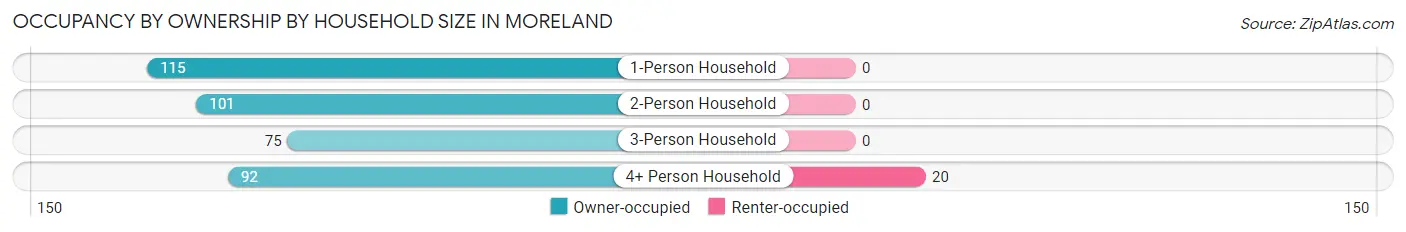
| Household Size | Owner-occupied | Renter-occupied |
| 1-Person Household | 115 (100.0%) | 0 (0.0%) |
| 2-Person Household | 101 (100.0%) | 0 (0.0%) |
| 3-Person Household | 75 (100.0%) | 0 (0.0%) |
| 4+ Person Household | 92 (82.1%) | 20 (17.9%) |
| Total Housing Units | 383 (95.0%) | 20 (5.0%) |
Occupancy by Educational Attainment in Moreland
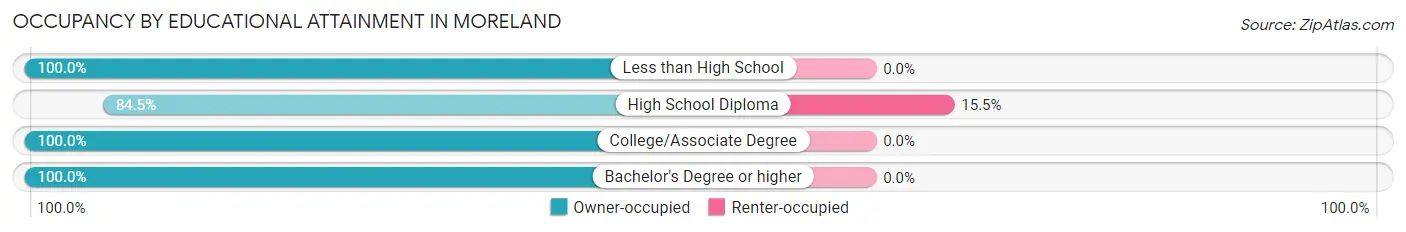
| Household Size | Owner-occupied | Renter-occupied |
| Less than High School | 42 (100.0%) | 0 (0.0%) |
| High School Diploma | 109 (84.5%) | 20 (15.5%) |
| College/Associate Degree | 181 (100.0%) | 0 (0.0%) |
| Bachelor's Degree or higher | 51 (100.0%) | 0 (0.0%) |
Occupancy by Age of Householder in Moreland
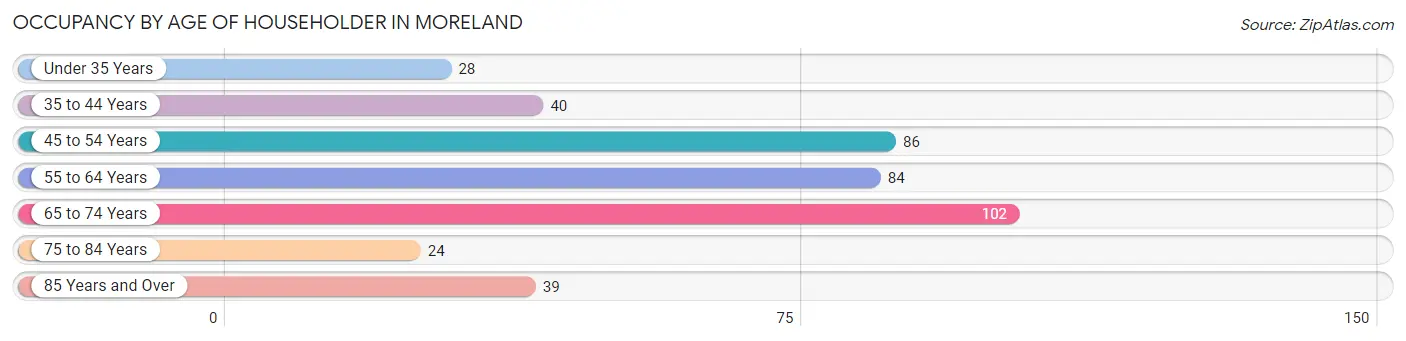
| Age Bracket | # Households | % Households |
| Under 35 Years | 28 | 7.0% |
| 35 to 44 Years | 40 | 9.9% |
| 45 to 54 Years | 86 | 21.3% |
| 55 to 64 Years | 84 | 20.8% |
| 65 to 74 Years | 102 | 25.3% |
| 75 to 84 Years | 24 | 6.0% |
| 85 Years and Over | 39 | 9.7% |
| Total | 403 | 100.0% |
Housing Finances in Moreland
Median Income by Occupancy in Moreland
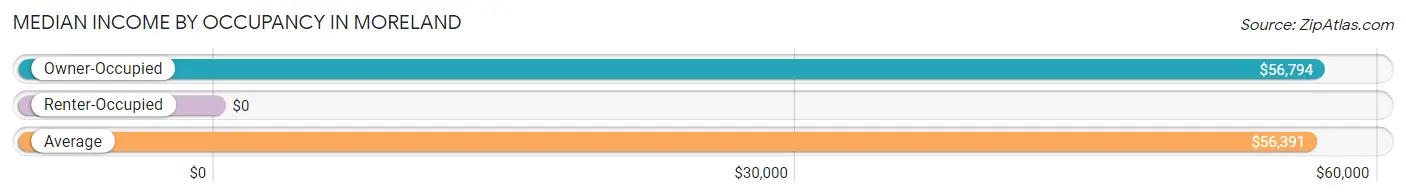
| Occupancy Type | # Households | Median Income |
| Owner-Occupied | 383 (95.0%) | $56,794 |
| Renter-Occupied | 20 (5.0%) | $0 |
| Average | 403 (100.0%) | $56,391 |
Occupancy by Householder Income Bracket in Moreland
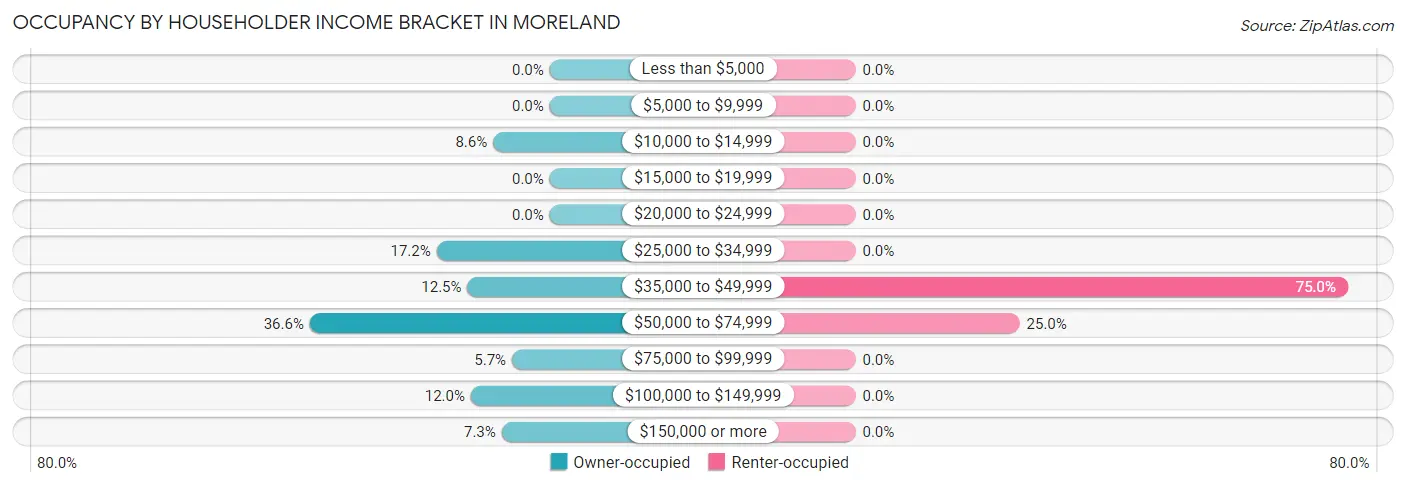
| Income Bracket | Owner-occupied | Renter-occupied |
| Less than $5,000 | 0 (0.0%) | 0 (0.0%) |
| $5,000 to $9,999 | 0 (0.0%) | 0 (0.0%) |
| $10,000 to $14,999 | 33 (8.6%) | 0 (0.0%) |
| $15,000 to $19,999 | 0 (0.0%) | 0 (0.0%) |
| $20,000 to $24,999 | 0 (0.0%) | 0 (0.0%) |
| $25,000 to $34,999 | 66 (17.2%) | 0 (0.0%) |
| $35,000 to $49,999 | 48 (12.5%) | 15 (75.0%) |
| $50,000 to $74,999 | 140 (36.5%) | 5 (25.0%) |
| $75,000 to $99,999 | 22 (5.7%) | 0 (0.0%) |
| $100,000 to $149,999 | 46 (12.0%) | 0 (0.0%) |
| $150,000 or more | 28 (7.3%) | 0 (0.0%) |
| Total | 383 (100.0%) | 20 (100.0%) |
Monthly Housing Cost Tiers in Moreland
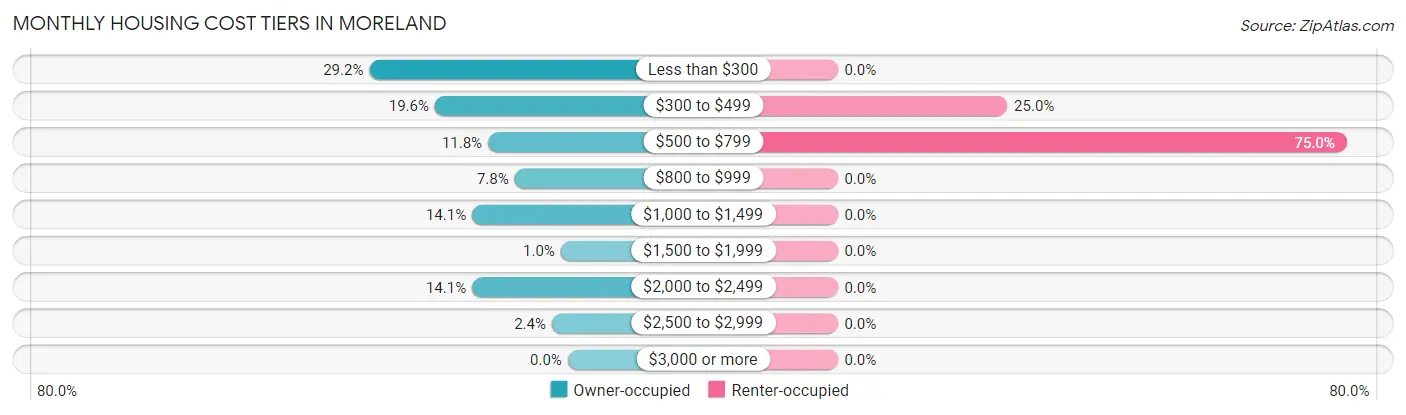
| Monthly Cost | Owner-occupied | Renter-occupied |
| Less than $300 | 112 (29.2%) | 0 (0.0%) |
| $300 to $499 | 75 (19.6%) | 5 (25.0%) |
| $500 to $799 | 45 (11.7%) | 15 (75.0%) |
| $800 to $999 | 30 (7.8%) | 0 (0.0%) |
| $1,000 to $1,499 | 54 (14.1%) | 0 (0.0%) |
| $1,500 to $1,999 | 4 (1.0%) | 0 (0.0%) |
| $2,000 to $2,499 | 54 (14.1%) | 0 (0.0%) |
| $2,500 to $2,999 | 9 (2.4%) | 0 (0.0%) |
| $3,000 or more | 0 (0.0%) | 0 (0.0%) |
| Total | 383 (100.0%) | 20 (100.0%) |
Physical Housing Characteristics in Moreland
Housing Structures in Moreland
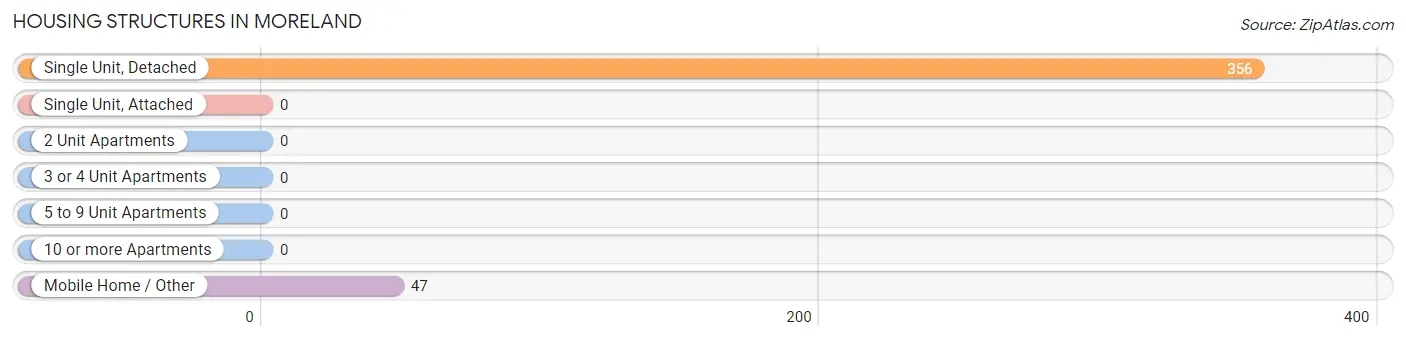
| Structure Type | # Housing Units | % Housing Units |
| Single Unit, Detached | 356 | 88.3% |
| Single Unit, Attached | 0 | 0.0% |
| 2 Unit Apartments | 0 | 0.0% |
| 3 or 4 Unit Apartments | 0 | 0.0% |
| 5 to 9 Unit Apartments | 0 | 0.0% |
| 10 or more Apartments | 0 | 0.0% |
| Mobile Home / Other | 47 | 11.7% |
| Total | 403 | 100.0% |
Housing Structures by Occupancy in Moreland
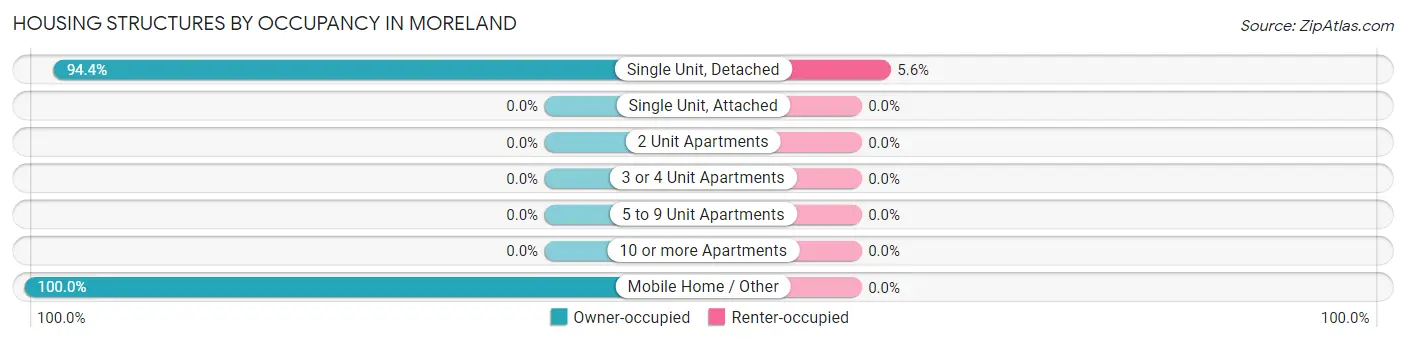
| Structure Type | Owner-occupied | Renter-occupied |
| Single Unit, Detached | 336 (94.4%) | 20 (5.6%) |
| Single Unit, Attached | 0 (0.0%) | 0 (0.0%) |
| 2 Unit Apartments | 0 (0.0%) | 0 (0.0%) |
| 3 or 4 Unit Apartments | 0 (0.0%) | 0 (0.0%) |
| 5 to 9 Unit Apartments | 0 (0.0%) | 0 (0.0%) |
| 10 or more Apartments | 0 (0.0%) | 0 (0.0%) |
| Mobile Home / Other | 47 (100.0%) | 0 (0.0%) |
| Total | 383 (95.0%) | 20 (5.0%) |
Housing Structures by Number of Rooms in Moreland
| Number of Rooms | Owner-occupied | Renter-occupied |
| 1 Room | 0 (0.0%) | 0 (0.0%) |
| 2 or 3 Rooms | 0 (0.0%) | 0 (0.0%) |
| 4 or 5 Rooms | 140 (36.5%) | 20 (100.0%) |
| 6 or 7 Rooms | 70 (18.3%) | 0 (0.0%) |
| 8 or more Rooms | 173 (45.2%) | 0 (0.0%) |
| Total | 383 (100.0%) | 20 (100.0%) |
Housing Structure by Heating Type in Moreland
| Heating Type | Owner-occupied | Renter-occupied |
| Utility Gas | 209 (54.6%) | 0 (0.0%) |
| Bottled, Tank, or LP Gas | 0 (0.0%) | 5 (25.0%) |
| Electricity | 133 (34.7%) | 15 (75.0%) |
| Fuel Oil or Kerosene | 0 (0.0%) | 0 (0.0%) |
| Coal or Coke | 0 (0.0%) | 0 (0.0%) |
| All other Fuels | 41 (10.7%) | 0 (0.0%) |
| No Fuel Used | 0 (0.0%) | 0 (0.0%) |
| Total | 383 (100.0%) | 20 (100.0%) |
Household Vehicle Usage in Moreland
| Vehicles per Household | Owner-occupied | Renter-occupied |
| No Vehicle | 0 (0.0%) | 0 (0.0%) |
| 1 Vehicle | 32 (8.4%) | 0 (0.0%) |
| 2 Vehicles | 81 (21.1%) | 20 (100.0%) |
| 3 or more Vehicles | 270 (70.5%) | 0 (0.0%) |
| Total | 383 (100.0%) | 20 (100.0%) |
Real Estate & Mortgages in Moreland
Real Estate and Mortgage Overview in Moreland
| Characteristic | Without Mortgage | With Mortgage |
| Housing Units | 226 | 157 |
| Median Property Value | $225,600 | $257,000 |
| Median Household Income | $41,167 | $9 |
| Monthly Housing Costs | $353 | $0 |
| Real Estate Taxes | $912 | $0 |
Property Value by Mortgage Status in Moreland
| Property Value | Without Mortgage | With Mortgage |
| Less than $50,000 | 6 (2.6%) | 0 (0.0%) |
| $50,000 to $99,999 | 0 (0.0%) | 20 (12.7%) |
| $100,000 to $299,999 | 127 (56.2%) | 111 (70.7%) |
| $300,000 to $499,999 | 74 (32.7%) | 17 (10.8%) |
| $500,000 to $749,999 | 19 (8.4%) | 9 (5.7%) |
| $750,000 to $999,999 | 0 (0.0%) | 0 (0.0%) |
| $1,000,000 or more | 0 (0.0%) | 0 (0.0%) |
| Total | 226 (100.0%) | 157 (100.0%) |
Household Income by Mortgage Status in Moreland
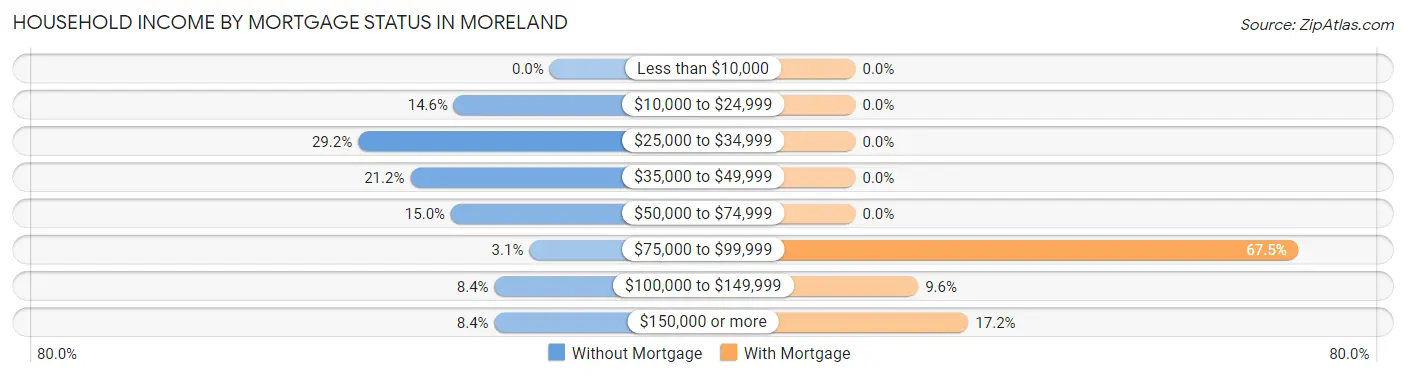
| Household Income | Without Mortgage | With Mortgage |
| Less than $10,000 | 0 (0.0%) | 0 (0.0%) |
| $10,000 to $24,999 | 33 (14.6%) | 0 (0.0%) |
| $25,000 to $34,999 | 66 (29.2%) | 0 (0.0%) |
| $35,000 to $49,999 | 48 (21.2%) | 0 (0.0%) |
| $50,000 to $74,999 | 34 (15.0%) | 0 (0.0%) |
| $75,000 to $99,999 | 7 (3.1%) | 106 (67.5%) |
| $100,000 to $149,999 | 19 (8.4%) | 15 (9.6%) |
| $150,000 or more | 19 (8.4%) | 27 (17.2%) |
| Total | 226 (100.0%) | 157 (100.0%) |
Property Value to Household Income Ratio in Moreland
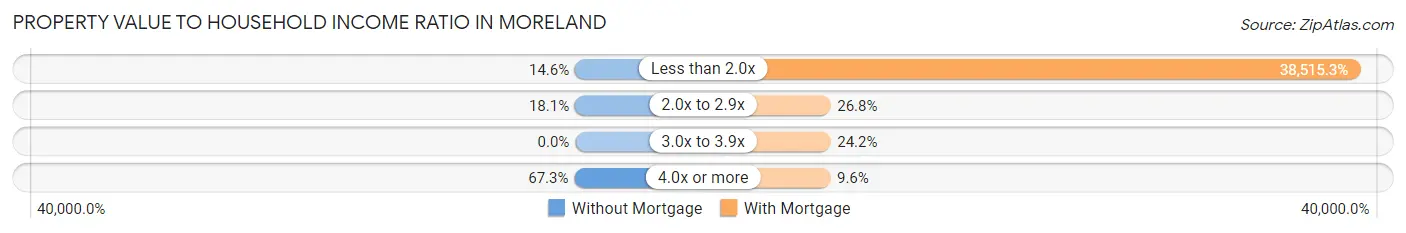
| Value-to-Income Ratio | Without Mortgage | With Mortgage |
| Less than 2.0x | 33 (14.6%) | 60,469 (38,515.3%) |
| 2.0x to 2.9x | 41 (18.1%) | 42 (26.8%) |
| 3.0x to 3.9x | 0 (0.0%) | 38 (24.2%) |
| 4.0x or more | 152 (67.3%) | 15 (9.6%) |
| Total | 226 (100.0%) | 157 (100.0%) |
Real Estate Taxes by Mortgage Status in Moreland
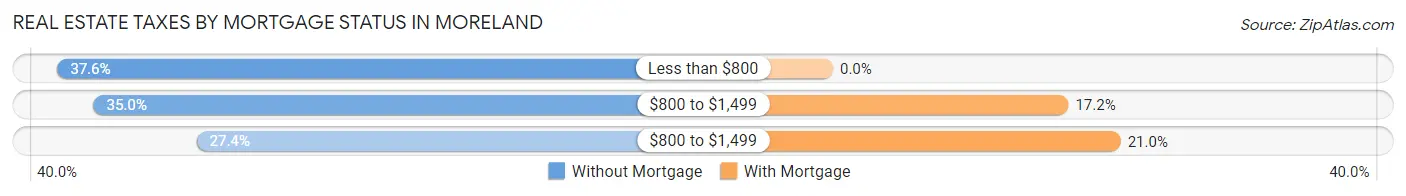
| Property Taxes | Without Mortgage | With Mortgage |
| Less than $800 | 85 (37.6%) | 0 (0.0%) |
| $800 to $1,499 | 79 (35.0%) | 27 (17.2%) |
| $800 to $1,499 | 62 (27.4%) | 33 (21.0%) |
| Total | 226 (100.0%) | 157 (100.0%) |
Health & Disability in Moreland
Health Insurance Coverage by Age in Moreland
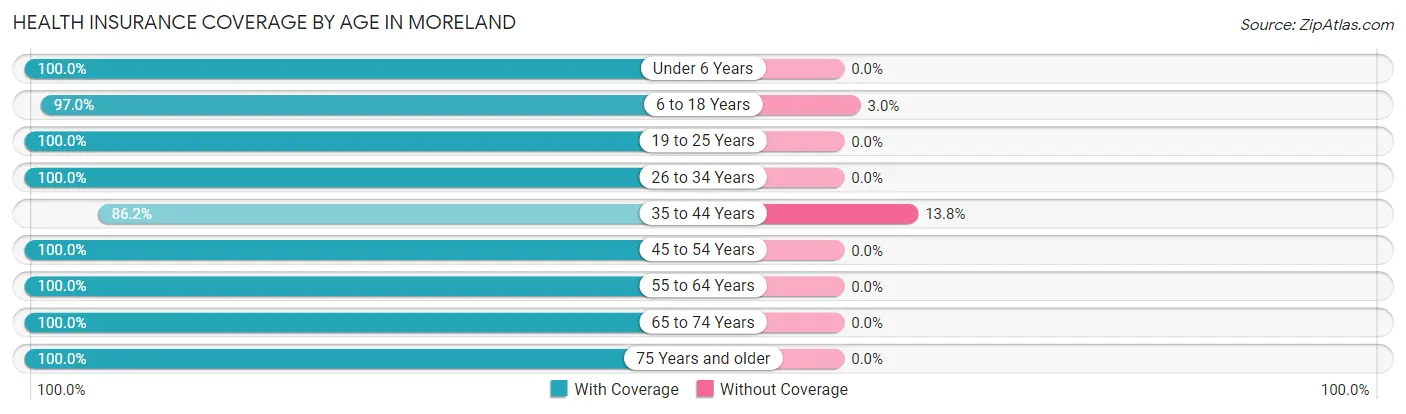
| Age Bracket | With Coverage | Without Coverage |
| Under 6 Years | 113 (100.0%) | 0 (0.0%) |
| 6 to 18 Years | 351 (97.0%) | 11 (3.0%) |
| 19 to 25 Years | 104 (100.0%) | 0 (0.0%) |
| 26 to 34 Years | 118 (100.0%) | 0 (0.0%) |
| 35 to 44 Years | 75 (86.2%) | 12 (13.8%) |
| 45 to 54 Years | 151 (100.0%) | 0 (0.0%) |
| 55 to 64 Years | 160 (100.0%) | 0 (0.0%) |
| 65 to 74 Years | 171 (100.0%) | 0 (0.0%) |
| 75 Years and older | 77 (100.0%) | 0 (0.0%) |
| Total | 1,320 (98.3%) | 23 (1.7%) |
Health Insurance Coverage by Citizenship Status in Moreland
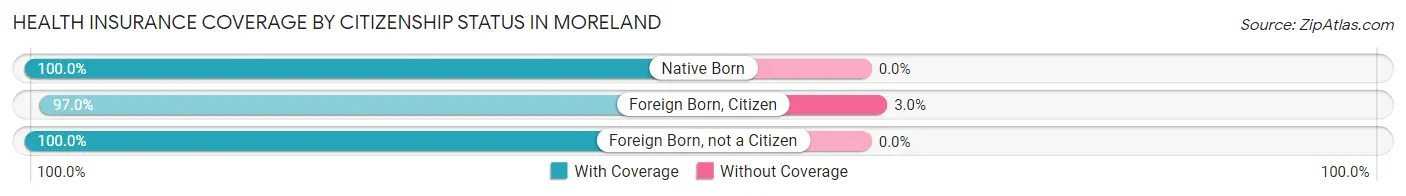
| Citizenship Status | With Coverage | Without Coverage |
| Native Born | 113 (100.0%) | 0 (0.0%) |
| Foreign Born, Citizen | 351 (97.0%) | 11 (3.0%) |
| Foreign Born, not a Citizen | 104 (100.0%) | 0 (0.0%) |
Health Insurance Coverage by Household Income in Moreland
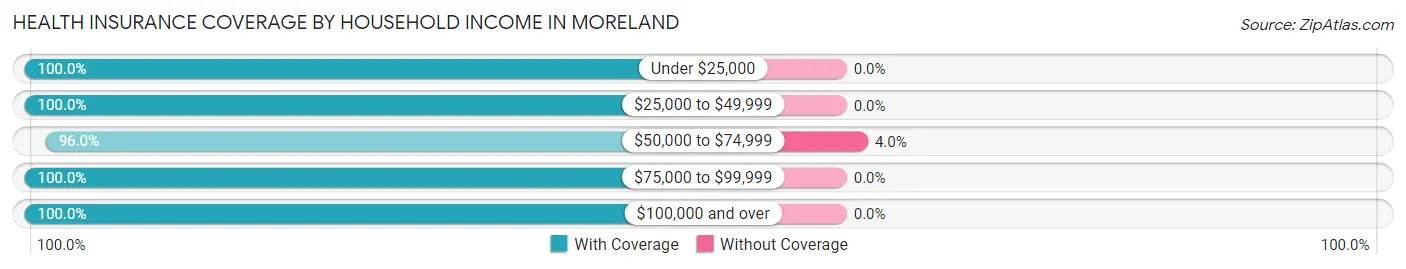
| Household Income | With Coverage | Without Coverage |
| Under $25,000 | 33 (100.0%) | 0 (0.0%) |
| $25,000 to $49,999 | 279 (100.0%) | 0 (0.0%) |
| $50,000 to $74,999 | 557 (96.0%) | 23 (4.0%) |
| $75,000 to $99,999 | 180 (100.0%) | 0 (0.0%) |
| $100,000 and over | 271 (100.0%) | 0 (0.0%) |
Public vs Private Health Insurance Coverage by Age in Moreland
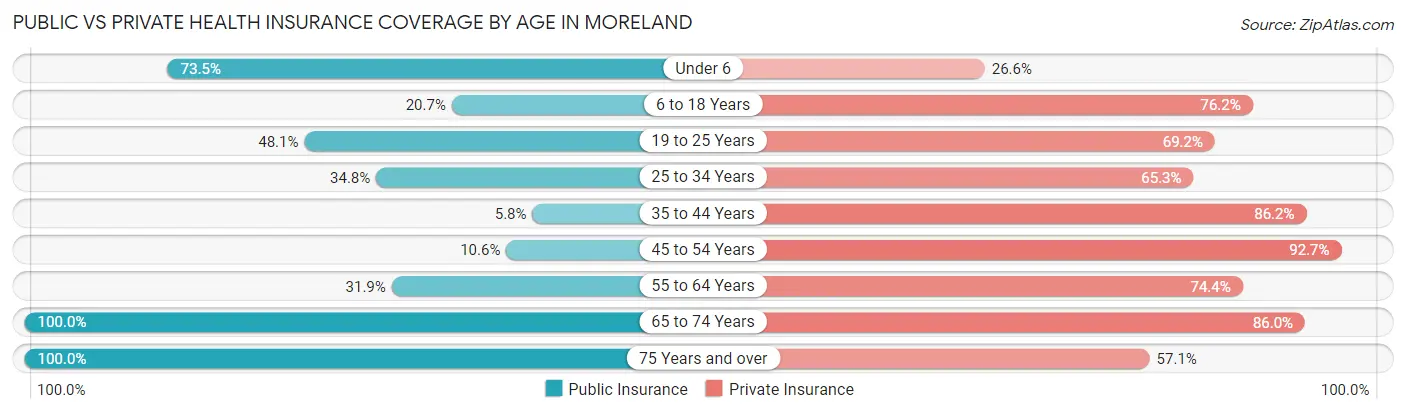
| Age Bracket | Public Insurance | Private Insurance |
| Under 6 | 83 (73.5%) | 30 (26.6%) |
| 6 to 18 Years | 75 (20.7%) | 276 (76.2%) |
| 19 to 25 Years | 50 (48.1%) | 72 (69.2%) |
| 25 to 34 Years | 41 (34.7%) | 77 (65.2%) |
| 35 to 44 Years | 5 (5.8%) | 75 (86.2%) |
| 45 to 54 Years | 16 (10.6%) | 140 (92.7%) |
| 55 to 64 Years | 51 (31.9%) | 119 (74.4%) |
| 65 to 74 Years | 171 (100.0%) | 147 (86.0%) |
| 75 Years and over | 77 (100.0%) | 44 (57.1%) |
| Total | 569 (42.4%) | 980 (73.0%) |
Disability Status by Sex by Age in Moreland
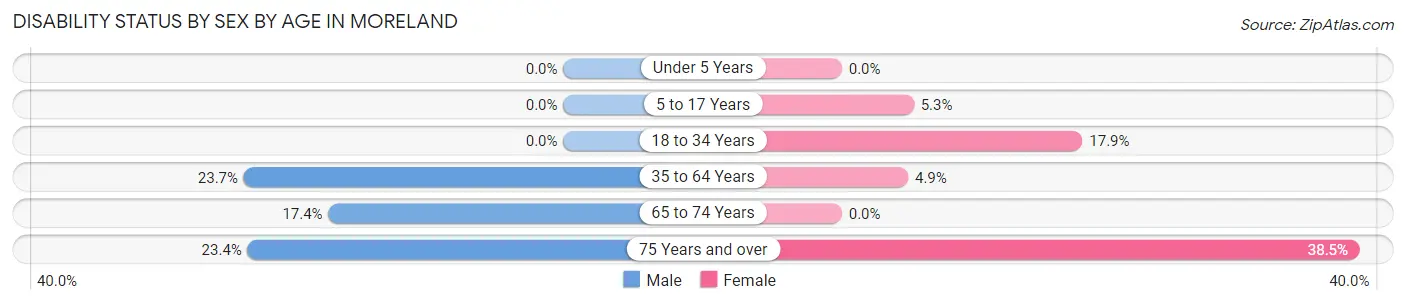
| Age Bracket | Male | Female |
| Under 5 Years | 0 (0.0%) | 0 (0.0%) |
| 5 to 17 Years | 0 (0.0%) | 11 (5.3%) |
| 18 to 34 Years | 0 (0.0%) | 20 (17.9%) |
| 35 to 64 Years | 51 (23.7%) | 9 (4.9%) |
| 65 to 74 Years | 15 (17.4%) | 0 (0.0%) |
| 75 Years and over | 15 (23.4%) | 5 (38.5%) |
Disability Class by Sex by Age in Moreland
Disability Class: Hearing Difficulty
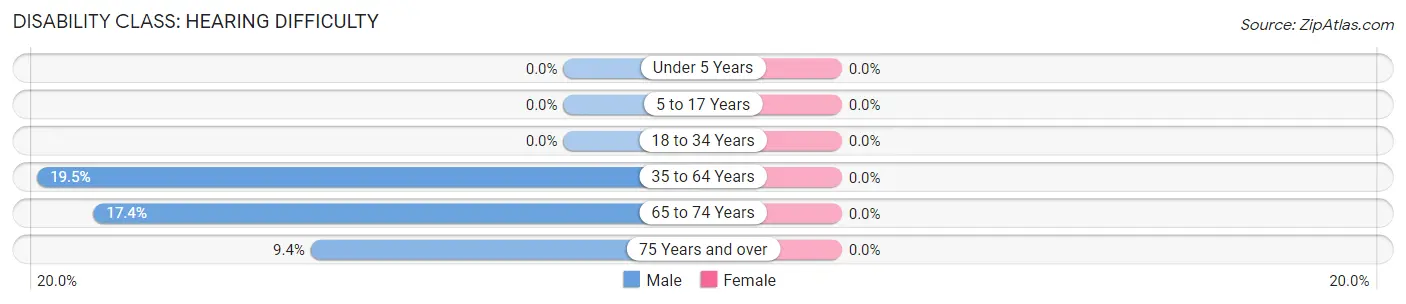
| Age Bracket | Male | Female |
| Under 5 Years | 0 (0.0%) | 0 (0.0%) |
| 5 to 17 Years | 0 (0.0%) | 0 (0.0%) |
| 18 to 34 Years | 0 (0.0%) | 0 (0.0%) |
| 35 to 64 Years | 42 (19.5%) | 0 (0.0%) |
| 65 to 74 Years | 15 (17.4%) | 0 (0.0%) |
| 75 Years and over | 6 (9.4%) | 0 (0.0%) |
Disability Class: Vision Difficulty
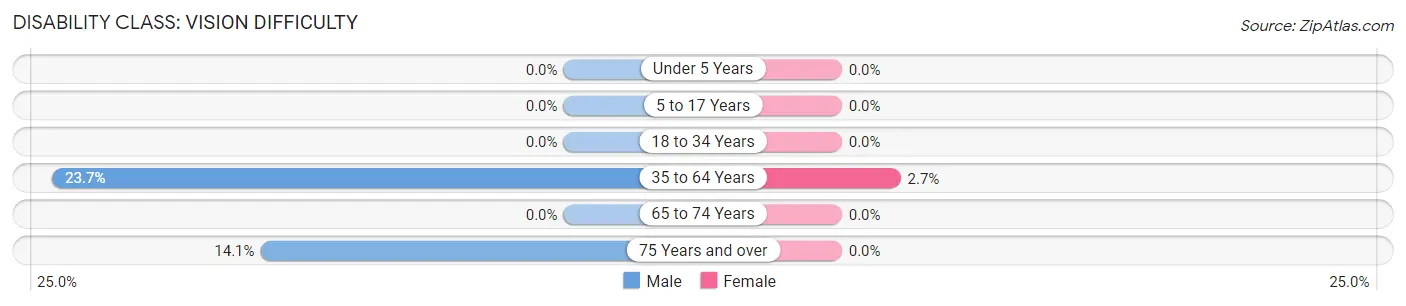
| Age Bracket | Male | Female |
| Under 5 Years | 0 (0.0%) | 0 (0.0%) |
| 5 to 17 Years | 0 (0.0%) | 0 (0.0%) |
| 18 to 34 Years | 0 (0.0%) | 0 (0.0%) |
| 35 to 64 Years | 51 (23.7%) | 5 (2.7%) |
| 65 to 74 Years | 0 (0.0%) | 0 (0.0%) |
| 75 Years and over | 9 (14.1%) | 0 (0.0%) |
Disability Class: Cognitive Difficulty
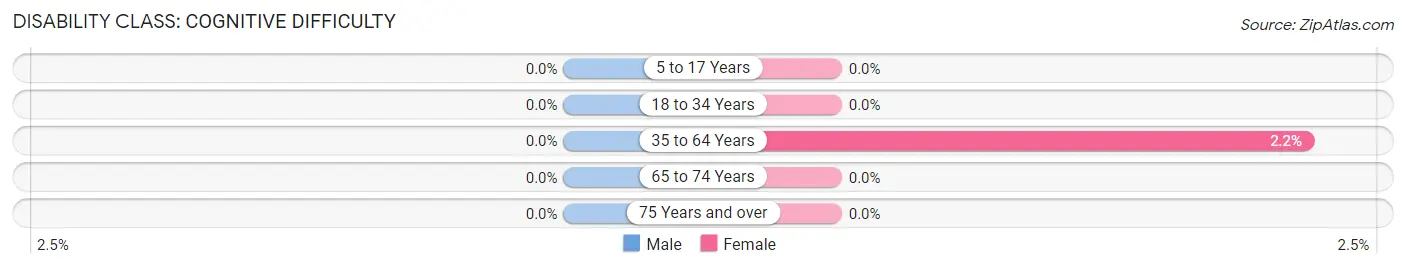
| Age Bracket | Male | Female |
| 5 to 17 Years | 0 (0.0%) | 0 (0.0%) |
| 18 to 34 Years | 0 (0.0%) | 0 (0.0%) |
| 35 to 64 Years | 0 (0.0%) | 4 (2.2%) |
| 65 to 74 Years | 0 (0.0%) | 0 (0.0%) |
| 75 Years and over | 0 (0.0%) | 0 (0.0%) |
Disability Class: Ambulatory Difficulty
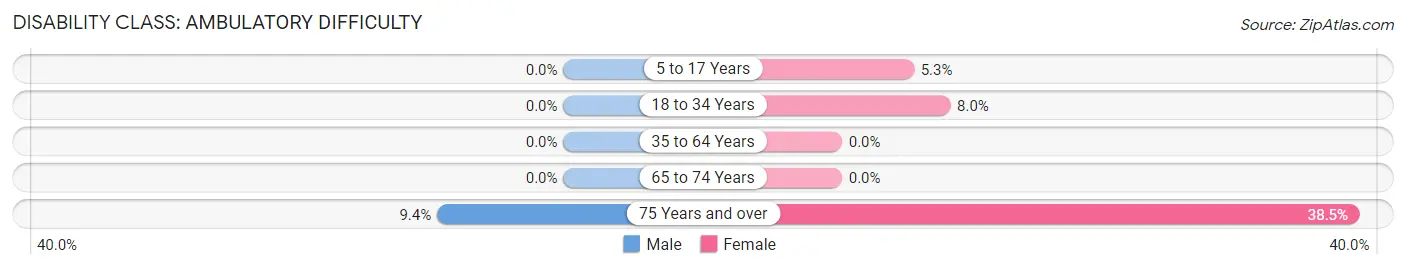
| Age Bracket | Male | Female |
| 5 to 17 Years | 0 (0.0%) | 11 (5.3%) |
| 18 to 34 Years | 0 (0.0%) | 9 (8.0%) |
| 35 to 64 Years | 0 (0.0%) | 0 (0.0%) |
| 65 to 74 Years | 0 (0.0%) | 0 (0.0%) |
| 75 Years and over | 6 (9.4%) | 5 (38.5%) |
Disability Class: Self-Care Difficulty
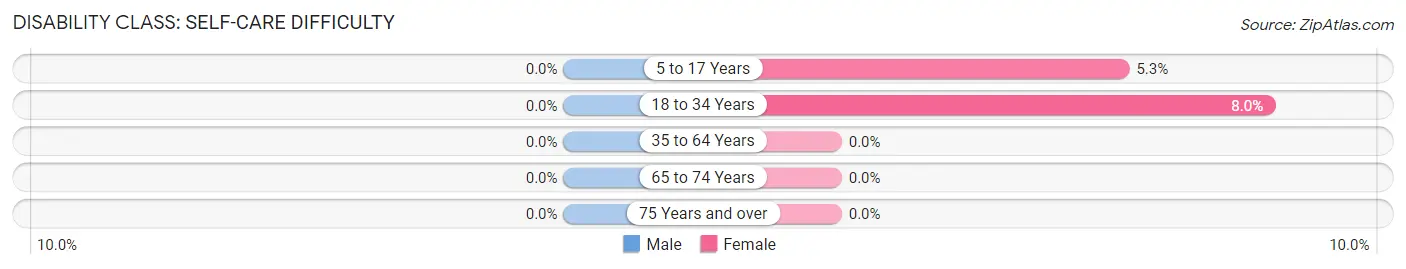
| Age Bracket | Male | Female |
| 5 to 17 Years | 0 (0.0%) | 11 (5.3%) |
| 18 to 34 Years | 0 (0.0%) | 9 (8.0%) |
| 35 to 64 Years | 0 (0.0%) | 0 (0.0%) |
| 65 to 74 Years | 0 (0.0%) | 0 (0.0%) |
| 75 Years and over | 0 (0.0%) | 0 (0.0%) |
Technology Access in Moreland
Computing Device Access in Moreland
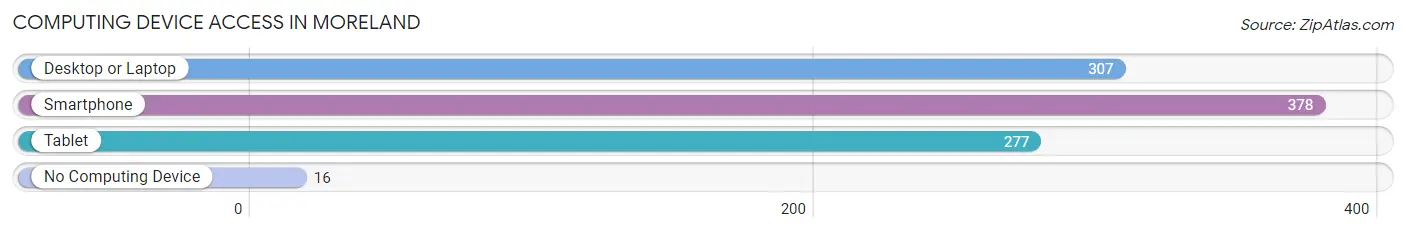
| Device Type | # Households | % Households |
| Desktop or Laptop | 307 | 76.2% |
| Smartphone | 378 | 93.8% |
| Tablet | 277 | 68.7% |
| No Computing Device | 16 | 4.0% |
| Total | 403 | 100.0% |
Internet Access in Moreland
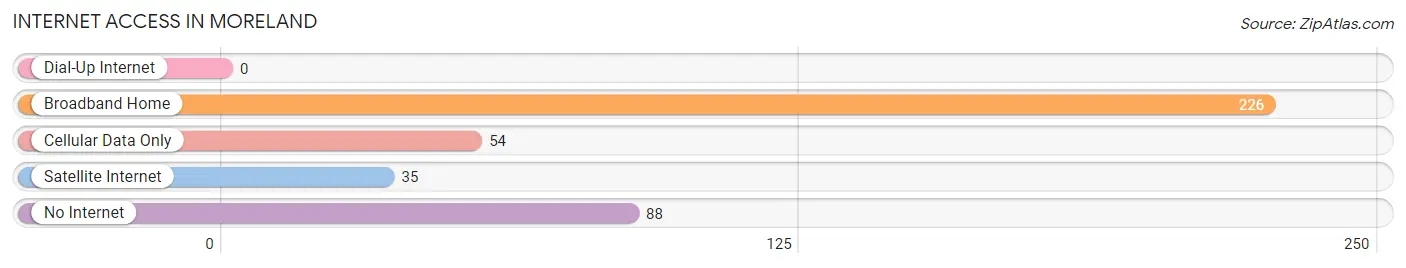
| Internet Type | # Households | % Households |
| Dial-Up Internet | 0 | 0.0% |
| Broadband Home | 226 | 56.1% |
| Cellular Data Only | 54 | 13.4% |
| Satellite Internet | 35 | 8.7% |
| No Internet | 88 | 21.8% |
| Total | 403 | 100.0% |
Moreland Summary
Moreland is a small city located in the southeastern corner of Idaho, in the United States. It is situated in the Snake River Plain, a region of the state known for its agricultural production. The city is located in Bannock County, and is part of the Pocatello metropolitan area. As of the 2010 census, the population of Moreland was 1,845.
History
Moreland was founded in 1883 by a group of settlers from Utah. The city was named after a local rancher, William Moreland. The city was incorporated in 1891, and the first mayor was elected in 1892.
In the early 1900s, Moreland was a thriving agricultural community. The city was home to several large farms, and the local economy was largely based on the production of wheat, barley, and other grains. The city also had a number of small businesses, including a general store, a blacksmith shop, and a hotel.
In the 1920s, Moreland began to experience a decline in population as many of the local farmers moved away in search of better opportunities. The city was also affected by the Great Depression, and many of the businesses closed.
In the 1950s, Moreland began to experience a resurgence in population as the city became a popular destination for retirees. The city also began to attract new businesses, including a lumber mill and a furniture factory.
Geography
Moreland is located in the southeastern corner of Idaho, in the Snake River Plain. The city is situated at an elevation of 4,845 feet (1,477 m) above sea level. The city is located in Bannock County, and is part of the Pocatello metropolitan area.
The city is located near the Portneuf River, which flows through the city. The city is also located near the Blackfoot River, which is a tributary of the Snake River.
Economy
Moreland’s economy is largely based on agriculture. The city is home to several large farms, and the local economy is largely based on the production of wheat, barley, and other grains. The city also has a number of small businesses, including a general store, a blacksmith shop, and a furniture factory.
Demographics
As of the 2010 census, the population of Moreland was 1,845. The racial makeup of the city was 94.3% White, 0.3% African American, 0.7% Native American, 0.2% Asian, 0.1% Pacific Islander, 2.2% from other races, and 2.3% from two or more races. Hispanic or Latino of any race were 4.2% of the population.
The median household income in Moreland was $37,917, and the median family income was $45,938. The per capita income for the city was $17,945. About 11.3% of families and 14.2% of the population were below the poverty line, including 19.2% of those under age 18 and 8.3% of those age 65 or over.
Common Questions
What is the Total Population of Moreland?
Total Population of Moreland is 1,343.
What is the Total Male Population of Moreland?
Total Male Population of Moreland is 673.
What is the Total Female Population of Moreland?
Total Female Population of Moreland is 670.
What is the Ratio of Males per 100 Females in Moreland?
There are 100.45 Males per 100 Females in Moreland.
What is the Ratio of Females per 100 Males in Moreland?
There are 99.55 Females per 100 Males in Moreland.
What is the Median Population Age in Moreland?
Median Population Age in Moreland is 33.9 Years.
What is the Average Family Size in Moreland
Average Family Size in Moreland is 4.2 People.
What is the Average Household Size in Moreland
Average Household Size in Moreland is 3.3 People.
What is Per Capita Income in Moreland?
Per Capita income in Moreland is $21,713.
What is the Median Family Income in Moreland?
Median Family Income in Moreland is $57,123.
What is the Median Household income in Moreland?
Median Household Income in Moreland is $56,391.
What is Income or Wage Gap in Moreland?
Income or Wage Gap in Moreland is 13.1%.
Women in Moreland earn 86.9 cents for every dollar earned by a man.
What is Inequality or Gini Index in Moreland?
Inequality or Gini Index in Moreland is 0.37.
How Large is the Labor Force in Moreland?
There are 514 People in the Labor Forcein in Moreland.
What is the Percentage of People in the Labor Force in Moreland?
54.4% of People are in the Labor Force in Moreland.