Eden, ID
Eden Map
Eden Overview
396
TOTAL POPULATION
178
MALE POPULATION
218
FEMALE POPULATION
81.65
MALES / 100 FEMALES
122.47
FEMALES / 100 MALES
28.1
MEDIAN AGE
4.8
AVG FAMILY SIZE
3.6
AVG HOUSEHOLD SIZE
$13,729
PER CAPITA INCOME
$34,722
AVG FAMILY INCOME
$32,125
AVG HOUSEHOLD INCOME
41.5%
WAGE / INCOME GAP [ % ]
58.5¢/ $1
WAGE / INCOME GAP [ $ ]
0.42
INEQUALITY / GINI INDEX
133
LABOR FORCE [ PEOPLE ]
57.8%
PERCENT IN LABOR FORCE
4.5%
UNEMPLOYMENT RATE
Eden Zip Codes
Eden Area Codes
Race in Eden
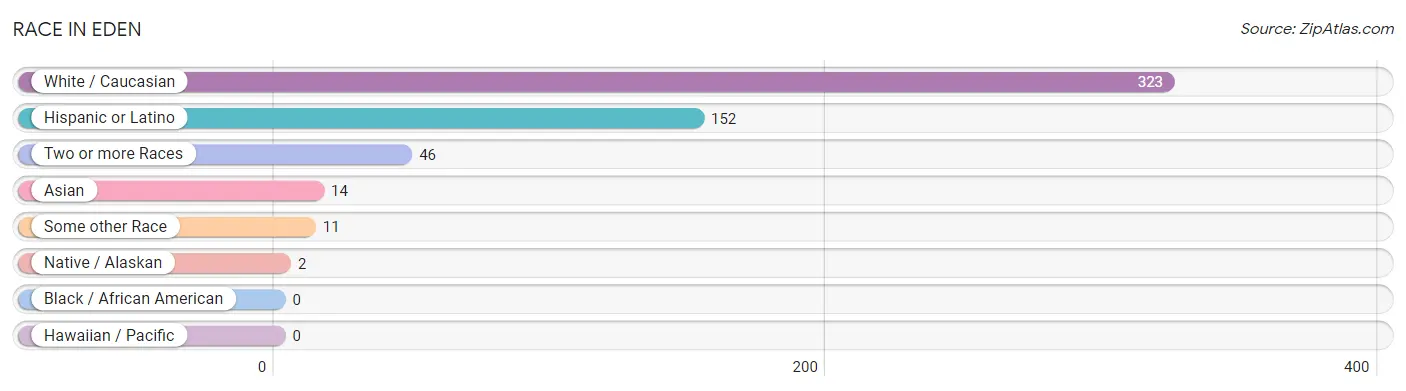
The most populous races in Eden are White / Caucasian (323 | 81.6%), Hispanic or Latino (152 | 38.4%), and Two or more Races (46 | 11.6%).
| Race | # Population | % Population |
| Asian | 14 | 3.5% |
| Black / African American | 0 | 0.0% |
| Hawaiian / Pacific | 0 | 0.0% |
| Hispanic or Latino | 152 | 38.4% |
| Native / Alaskan | 2 | 0.5% |
| White / Caucasian | 323 | 81.6% |
| Two or more Races | 46 | 11.6% |
| Some other Race | 11 | 2.8% |
| Total | 396 | 100.0% |
Ancestry in Eden
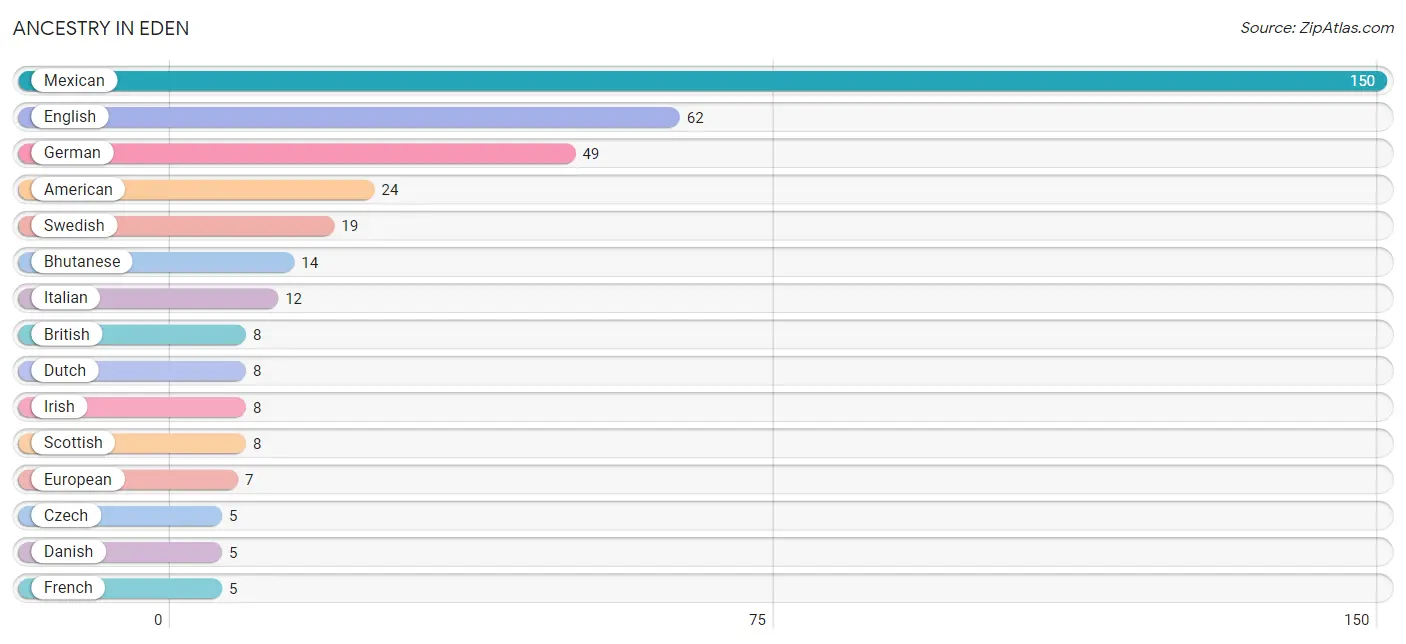
The most populous ancestries reported in Eden are Mexican (150 | 37.9%), English (62 | 15.7%), German (49 | 12.4%), American (24 | 6.1%), and Swedish (19 | 4.8%), together accounting for 76.8% of all Eden residents.
| Ancestry | # Population | % Population |
| American | 24 | 6.1% |
| Bhutanese | 14 | 3.5% |
| Brazilian | 2 | 0.5% |
| British | 8 | 2.0% |
| Czech | 5 | 1.3% |
| Danish | 5 | 1.3% |
| Dutch | 8 | 2.0% |
| English | 62 | 15.7% |
| European | 7 | 1.8% |
| French | 5 | 1.3% |
| German | 49 | 12.4% |
| Irish | 8 | 2.0% |
| Italian | 12 | 3.0% |
| Mexican | 150 | 37.9% |
| Polish | 5 | 1.3% |
| Portuguese | 2 | 0.5% |
| Scotch-Irish | 4 | 1.0% |
| Scottish | 8 | 2.0% |
| Spanish | 2 | 0.5% |
| Swedish | 19 | 4.8% |
| Welsh | 1 | 0.3% | View All 21 Rows |
Immigrants in Eden
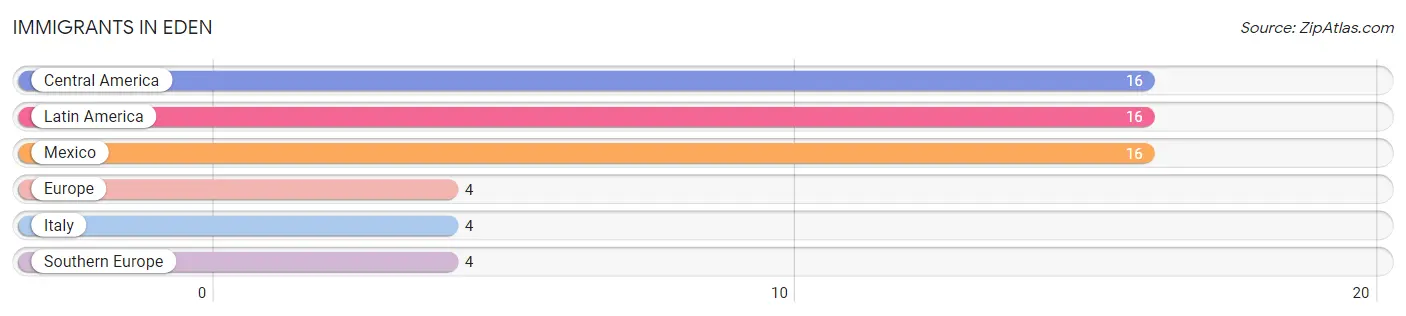
The most numerous immigrant groups reported in Eden came from Central America (16 | 4.0%), Latin America (16 | 4.0%), Mexico (16 | 4.0%), Europe (4 | 1.0%), and Italy (4 | 1.0%), together accounting for 14.1% of all Eden residents.
| Immigration Origin | # Population | % Population |
| Central America | 16 | 4.0% |
| Europe | 4 | 1.0% |
| Italy | 4 | 1.0% |
| Latin America | 16 | 4.0% |
| Mexico | 16 | 4.0% |
| Southern Europe | 4 | 1.0% | View All 6 Rows |
Sex and Age in Eden
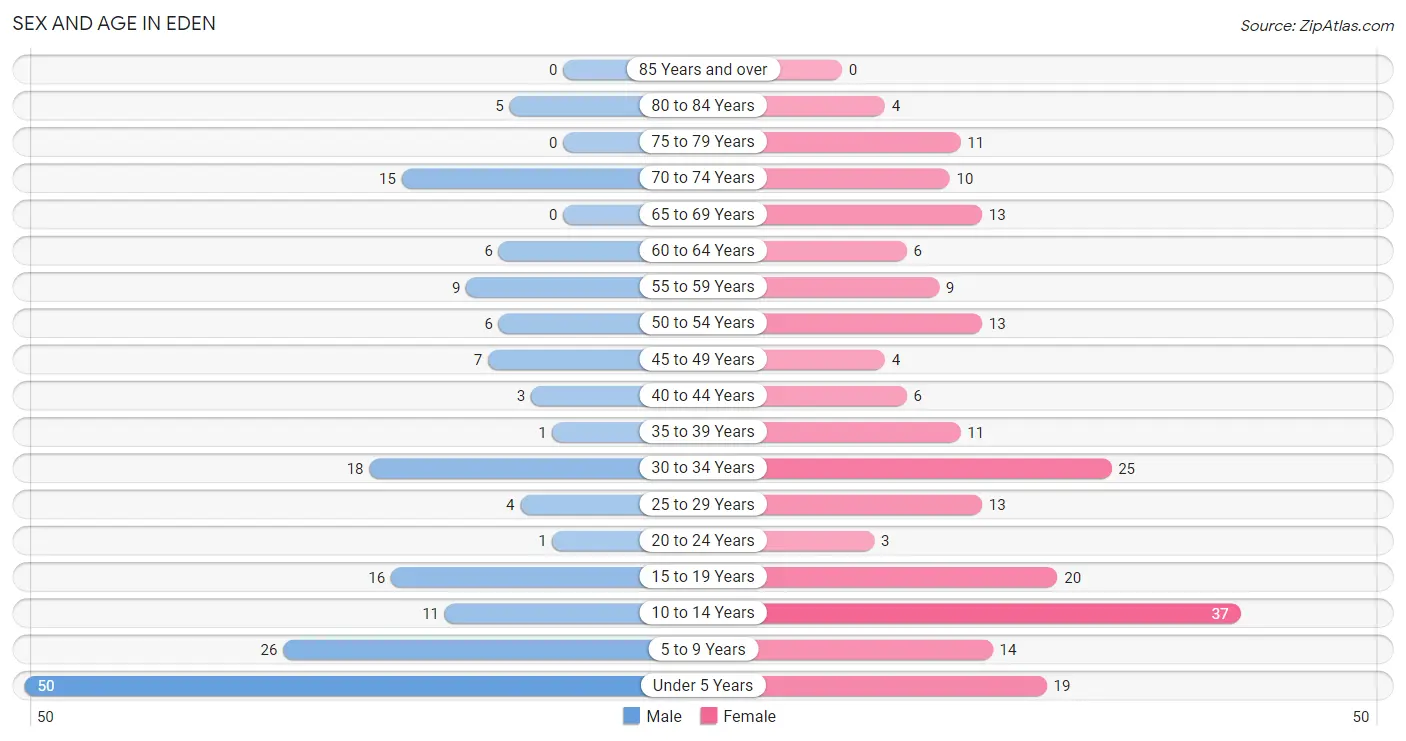
Sex and Age in Eden
The most populous age groups in Eden are Under 5 Years (50 | 28.1%) for men and 10 to 14 Years (37 | 17.0%) for women.
| Age Bracket | Male | Female |
| Under 5 Years | 50 (28.1%) | 19 (8.7%) |
| 5 to 9 Years | 26 (14.6%) | 14 (6.4%) |
| 10 to 14 Years | 11 (6.2%) | 37 (17.0%) |
| 15 to 19 Years | 16 (9.0%) | 20 (9.2%) |
| 20 to 24 Years | 1 (0.6%) | 3 (1.4%) |
| 25 to 29 Years | 4 (2.2%) | 13 (6.0%) |
| 30 to 34 Years | 18 (10.1%) | 25 (11.5%) |
| 35 to 39 Years | 1 (0.6%) | 11 (5.1%) |
| 40 to 44 Years | 3 (1.7%) | 6 (2.8%) |
| 45 to 49 Years | 7 (3.9%) | 4 (1.8%) |
| 50 to 54 Years | 6 (3.4%) | 13 (6.0%) |
| 55 to 59 Years | 9 (5.1%) | 9 (4.1%) |
| 60 to 64 Years | 6 (3.4%) | 6 (2.8%) |
| 65 to 69 Years | 0 (0.0%) | 13 (6.0%) |
| 70 to 74 Years | 15 (8.4%) | 10 (4.6%) |
| 75 to 79 Years | 0 (0.0%) | 11 (5.1%) |
| 80 to 84 Years | 5 (2.8%) | 4 (1.8%) |
| 85 Years and over | 0 (0.0%) | 0 (0.0%) |
| Total | 178 (100.0%) | 218 (100.0%) |
Families and Households in Eden
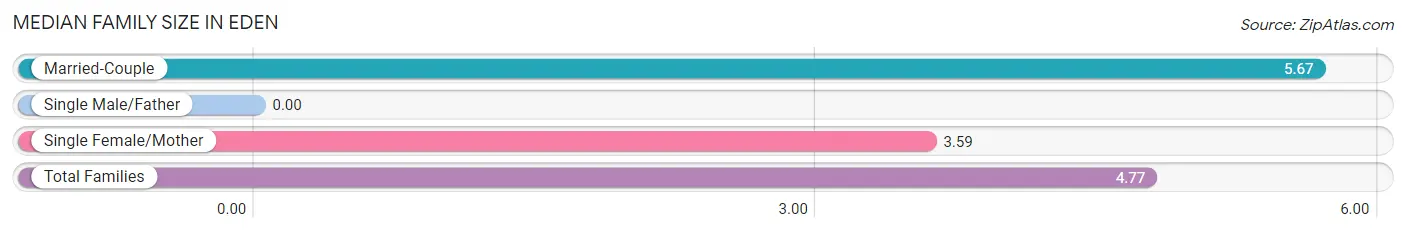
Median Family Size in Eden
| Family Type | # Families | Family Size |
| Married-Couple | 42 (56.8%) | 5.67 |
| Single Male/Father | 0 (0.0%) | - |
| Single Female/Mother | 32 (43.2%) | 3.59 |
| Total Families | 74 (100.0%) | 4.77 |
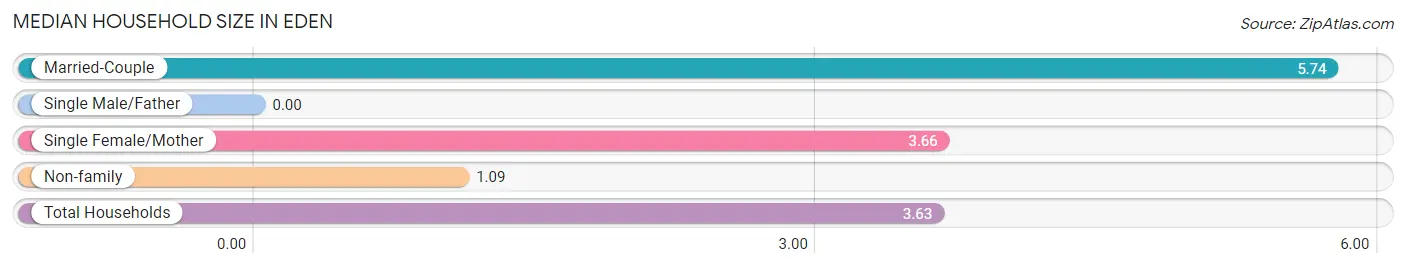
Median Household Size in Eden
| Household Type | # Households | Household Size |
| Married-Couple | 42 (38.5%) | 5.74 |
| Single Male/Father | 0 (0.0%) | - |
| Single Female/Mother | 32 (29.4%) | 3.66 |
| Non-family | 35 (32.1%) | 1.09 |
| Total Households | 109 (100.0%) | 3.63 |
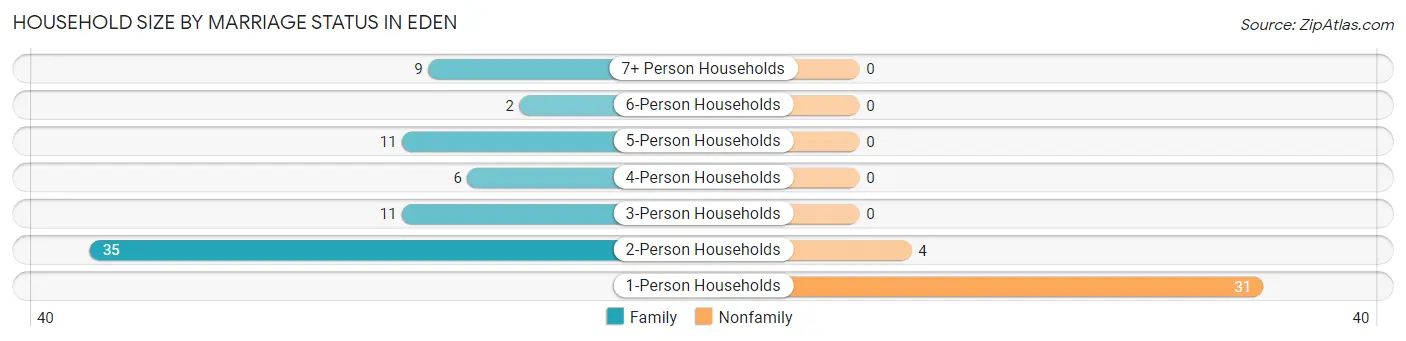
Household Size by Marriage Status in Eden
Out of a total of 109 households in Eden, 74 (67.9%) are family households, while 35 (32.1%) are nonfamily households. The most numerous type of family households are 2-person households, comprising 35, and the most common type of nonfamily households are 1-person households, comprising 31.
| Household Size | Family Households | Nonfamily Households |
| 1-Person Households | - | 31 (28.4%) |
| 2-Person Households | 35 (32.1%) | 4 (3.7%) |
| 3-Person Households | 11 (10.1%) | 0 (0.0%) |
| 4-Person Households | 6 (5.5%) | 0 (0.0%) |
| 5-Person Households | 11 (10.1%) | 0 (0.0%) |
| 6-Person Households | 2 (1.8%) | 0 (0.0%) |
| 7+ Person Households | 9 (8.3%) | 0 (0.0%) |
| Total | 74 (67.9%) | 35 (32.1%) |
Female Fertility in Eden
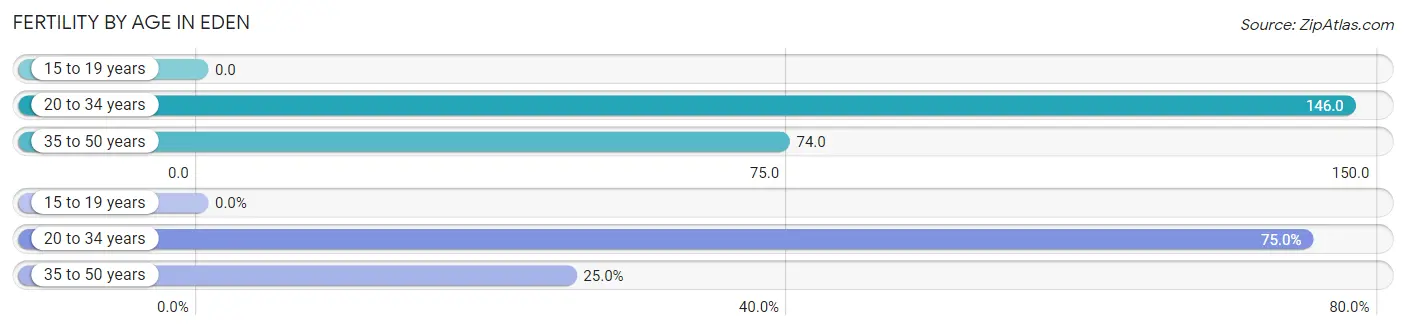
Fertility by Age in Eden
Average fertility rate in Eden is 91.0 births per 1,000 women. Women in the age bracket of 20 to 34 years have the highest fertility rate with 146.0 births per 1,000 women. Women in the age bracket of 20 to 34 years acount for 75.0% of all women with births.
| Age Bracket | Women with Births | Births / 1,000 Women |
| 15 to 19 years | 0 (0.0%) | 0.0 |
| 20 to 34 years | 6 (75.0%) | 146.0 |
| 35 to 50 years | 2 (25.0%) | 74.0 |
| Total | 8 (100.0%) | 91.0 |
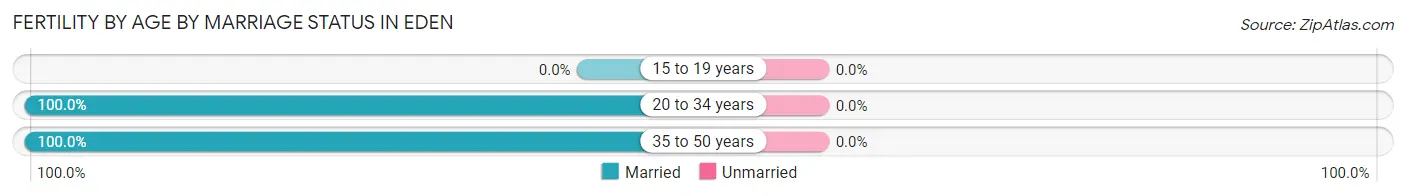
Fertility by Age by Marriage Status in Eden
| Age Bracket | Married | Unmarried |
| 15 to 19 years | 0 (0.0%) | 0 (0.0%) |
| 20 to 34 years | 6 (100.0%) | 0 (0.0%) |
| 35 to 50 years | 2 (100.0%) | 0 (0.0%) |
| Total | 8 (100.0%) | 0 (0.0%) |
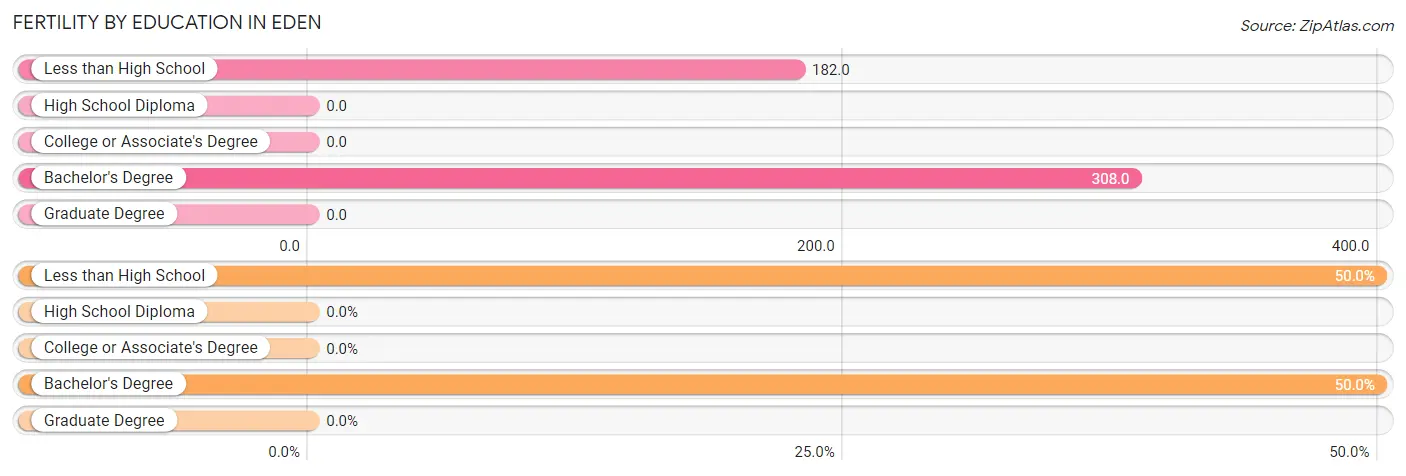
Fertility by Education in Eden
| Educational Attainment | Women with Births | Births / 1,000 Women |
| Less than High School | 4 (50.0%) | 182.0 |
| High School Diploma | 0 (0.0%) | 0.0 |
| College or Associate's Degree | 0 (0.0%) | 0.0 |
| Bachelor's Degree | 4 (50.0%) | 308.0 |
| Graduate Degree | 0 (0.0%) | 0.0 |
| Total | 8 (100.0%) | 91.0 |
Fertility by Education by Marriage Status in Eden

| Educational Attainment | Married | Unmarried |
| Less than High School | 4 (100.0%) | 0 (0.0%) |
| High School Diploma | 0 (0.0%) | 0 (0.0%) |
| College or Associate's Degree | 0 (0.0%) | 0 (0.0%) |
| Bachelor's Degree | 4 (100.0%) | 0 (0.0%) |
| Graduate Degree | 0 (0.0%) | 0 (0.0%) |
| Total | 8 (100.0%) | 0 (0.0%) |
Income in Eden
Income Overview in Eden
Per Capita Income in Eden is $13,729, while median incomes of families and households are $34,722 and $32,125 respectively.
| Characteristic | Number | Measure |
| Per Capita Income | 396 | $13,729 |
| Median Family Income | 74 | $34,722 |
| Mean Family Income | 74 | $60,204 |
| Median Household Income | 109 | $32,125 |
| Mean Household Income | 109 | $50,609 |
| Income Deficit | 74 | $0 |
| Wage / Income Gap (%) | 396 | 41.55% |
| Wage / Income Gap ($) | 396 | 58.45¢ per $1 |
| Gini / Inequality Index | 396 | 0.42 |
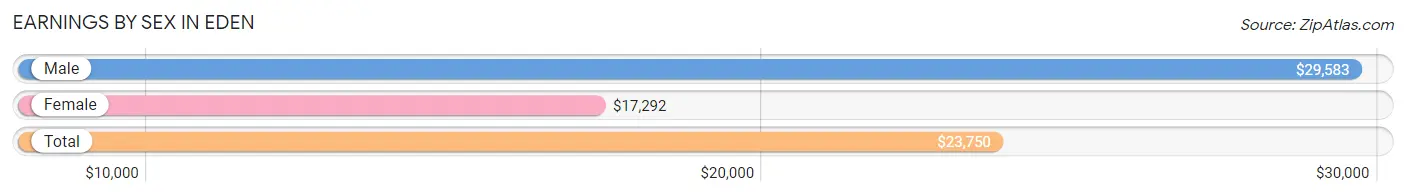
Earnings by Sex in Eden
Average Earnings in Eden are $23,750, $29,583 for men and $17,292 for women, a difference of 41.5%.
| Sex | Number | Average Earnings |
| Male | 60 (42.5%) | $29,583 |
| Female | 81 (57.5%) | $17,292 |
| Total | 141 (100.0%) | $23,750 |
Earnings by Sex by Income Bracket in Eden
The most common earnings brackets in Eden are $15,000 to $17,499 for men (8 | 13.3%) and $7,500 to $9,999 for women (16 | 19.8%).
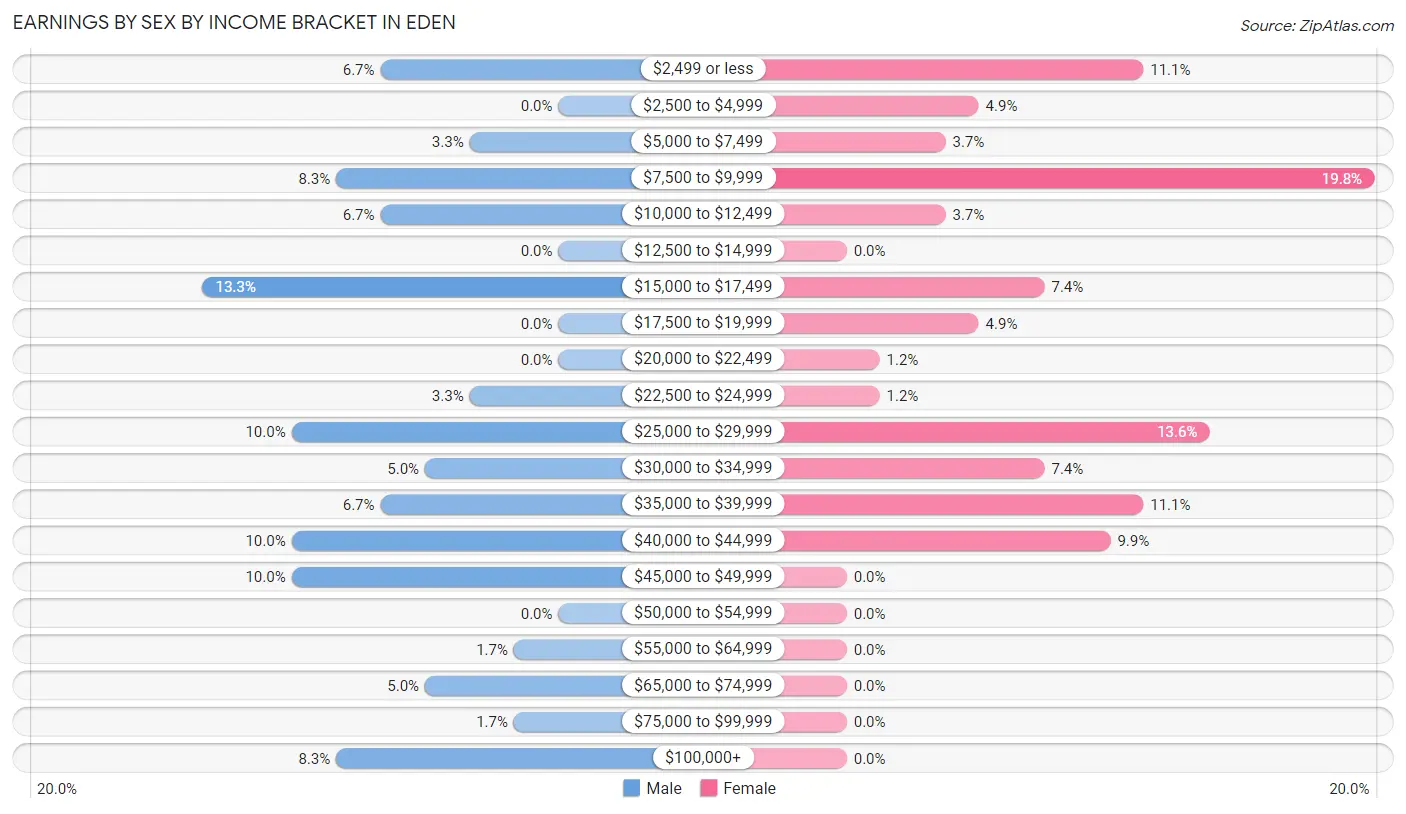
| Income | Male | Female |
| $2,499 or less | 4 (6.7%) | 9 (11.1%) |
| $2,500 to $4,999 | 0 (0.0%) | 4 (4.9%) |
| $5,000 to $7,499 | 2 (3.3%) | 3 (3.7%) |
| $7,500 to $9,999 | 5 (8.3%) | 16 (19.8%) |
| $10,000 to $12,499 | 4 (6.7%) | 3 (3.7%) |
| $12,500 to $14,999 | 0 (0.0%) | 0 (0.0%) |
| $15,000 to $17,499 | 8 (13.3%) | 6 (7.4%) |
| $17,500 to $19,999 | 0 (0.0%) | 4 (4.9%) |
| $20,000 to $22,499 | 0 (0.0%) | 1 (1.2%) |
| $22,500 to $24,999 | 2 (3.3%) | 1 (1.2%) |
| $25,000 to $29,999 | 6 (10.0%) | 11 (13.6%) |
| $30,000 to $34,999 | 3 (5.0%) | 6 (7.4%) |
| $35,000 to $39,999 | 4 (6.7%) | 9 (11.1%) |
| $40,000 to $44,999 | 6 (10.0%) | 8 (9.9%) |
| $45,000 to $49,999 | 6 (10.0%) | 0 (0.0%) |
| $50,000 to $54,999 | 0 (0.0%) | 0 (0.0%) |
| $55,000 to $64,999 | 1 (1.7%) | 0 (0.0%) |
| $65,000 to $74,999 | 3 (5.0%) | 0 (0.0%) |
| $75,000 to $99,999 | 1 (1.7%) | 0 (0.0%) |
| $100,000+ | 5 (8.3%) | 0 (0.0%) |
| Total | 60 (100.0%) | 81 (100.0%) |
Earnings by Sex by Educational Attainment in Eden
Average earnings in Eden are $29,792 for men and $25,536 for women, a difference of 14.3%. Men with an educational attainment of bachelor's degree enjoy the highest average annual earnings of $71,250, while those with less than high school education earn the least with $29,688. Women with an educational attainment of bachelor's degree earn the most with the average annual earnings of $40,625, while those with college or associate's degree education have the smallest earnings of $18,125.
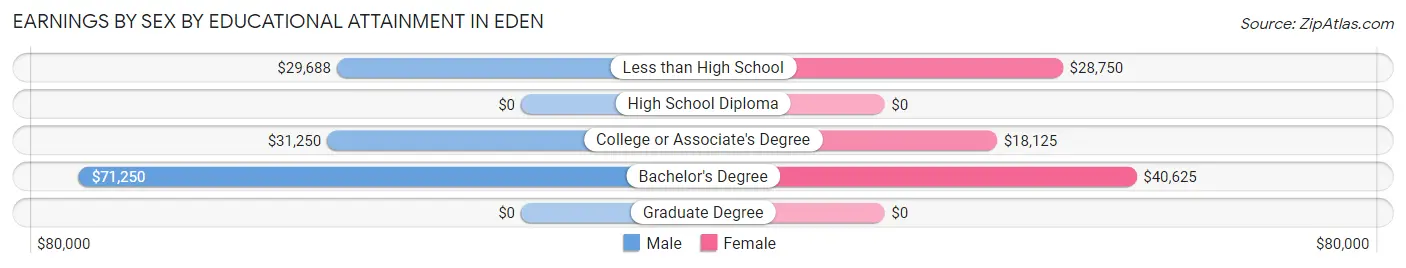
| Educational Attainment | Male Income | Female Income |
| Less than High School | $29,688 | $28,750 |
| High School Diploma | - | - |
| College or Associate's Degree | $31,250 | $18,125 |
| Bachelor's Degree | $71,250 | $40,625 |
| Graduate Degree | - | - |
| Total | $29,792 | $25,536 |
Family Income in Eden
Family Income Brackets in Eden
According to the Eden family income data, there are 22 families falling into the $25,000 to $34,999 income range, which is the most common income bracket and makes up 29.7% of all families.
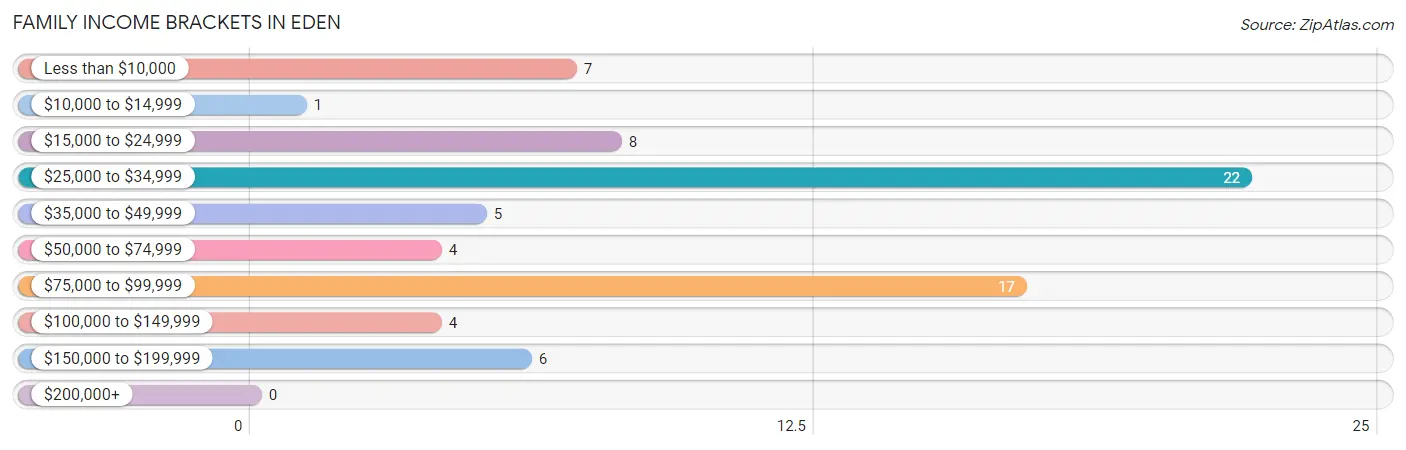
| Income Bracket | # Families | % Families |
| Less than $10,000 | 7 | 9.5% |
| $10,000 to $14,999 | 1 | 1.4% |
| $15,000 to $24,999 | 8 | 10.8% |
| $25,000 to $34,999 | 22 | 29.7% |
| $35,000 to $49,999 | 5 | 6.8% |
| $50,000 to $74,999 | 4 | 5.4% |
| $75,000 to $99,999 | 17 | 23.0% |
| $100,000 to $149,999 | 4 | 5.4% |
| $150,000 to $199,999 | 6 | 8.1% |
| $200,000+ | 0 | 0.0% |
Family Income by Famaliy Size in Eden
3-person families (12 | 16.2%) account for the highest median family income in Eden with $82,000 per family, while 3-person families (12 | 16.2%) have the highest median income of $27,333 per family member.
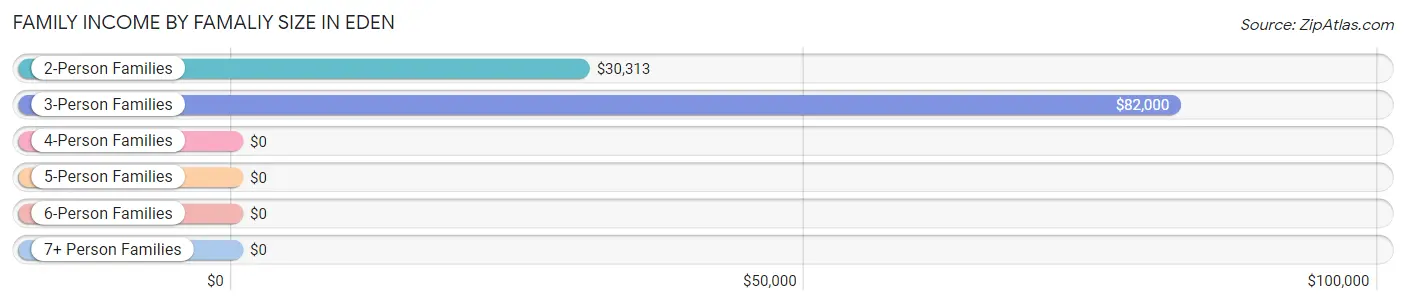
| Income Bracket | # Families | Median Income |
| 2-Person Families | 35 (47.3%) | $30,313 |
| 3-Person Families | 12 (16.2%) | $82,000 |
| 4-Person Families | 5 (6.8%) | $0 |
| 5-Person Families | 11 (14.9%) | $0 |
| 6-Person Families | 6 (8.1%) | $0 |
| 7+ Person Families | 5 (6.8%) | $0 |
| Total | 74 (100.0%) | $34,722 |
Family Income by Number of Earners in Eden
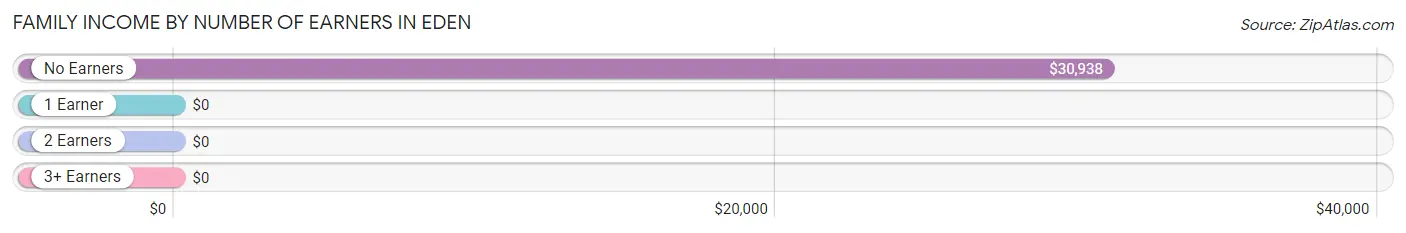
| Number of Earners | # Families | Median Income |
| No Earners | 9 (12.2%) | $30,938 |
| 1 Earner | 20 (27.0%) | $0 |
| 2 Earners | 40 (54.0%) | $0 |
| 3+ Earners | 5 (6.8%) | $0 |
| Total | 74 (100.0%) | $34,722 |
Household Income in Eden
Household Income Brackets in Eden
With 28 households falling in the category, the $15,000 to $24,999 income range is the most frequent in Eden, accounting for 25.7% of all households.
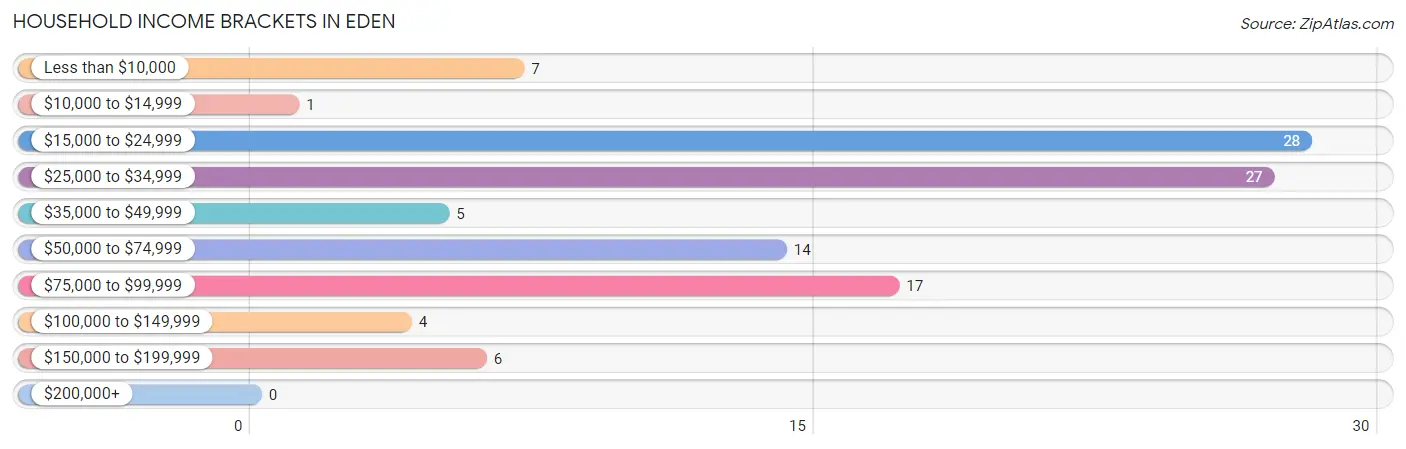
| Income Bracket | # Households | % Households |
| Less than $10,000 | 7 | 6.4% |
| $10,000 to $14,999 | 1 | 0.9% |
| $15,000 to $24,999 | 28 | 25.7% |
| $25,000 to $34,999 | 27 | 24.8% |
| $35,000 to $49,999 | 5 | 4.6% |
| $50,000 to $74,999 | 14 | 12.8% |
| $75,000 to $99,999 | 17 | 15.6% |
| $100,000 to $149,999 | 4 | 3.7% |
| $150,000 to $199,999 | 6 | 5.5% |
| $200,000+ | 0 | 0.0% |
Household Income by Householder Age in Eden
The median household income in Eden is $32,125, with the highest median household income of $67,500 found in the 25 to 44 years age bracket for the primary householder. A total of 34 households (31.2%) fall into this category.
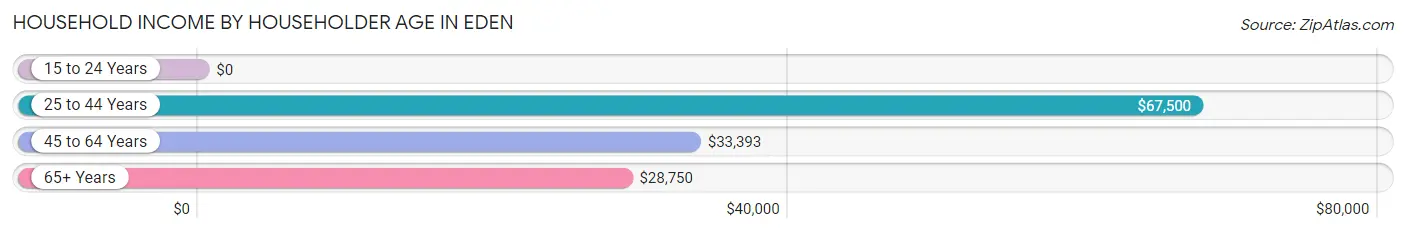
| Income Bracket | # Households | Median Income |
| 15 to 24 Years | 0 (0.0%) | $0 |
| 25 to 44 Years | 34 (31.2%) | $67,500 |
| 45 to 64 Years | 29 (26.6%) | $33,393 |
| 65+ Years | 46 (42.2%) | $28,750 |
| Total | 109 (100.0%) | $32,125 |
Poverty in Eden
Income Below Poverty by Sex and Age in Eden
With 24.7% poverty level for males and 16.1% for females among the residents of Eden, 15 year old males and 18 to 24 year old females are the most vulnerable to poverty, with 9 males (100.0%) and 10 females (76.9%) in their respective age groups living below the poverty level.
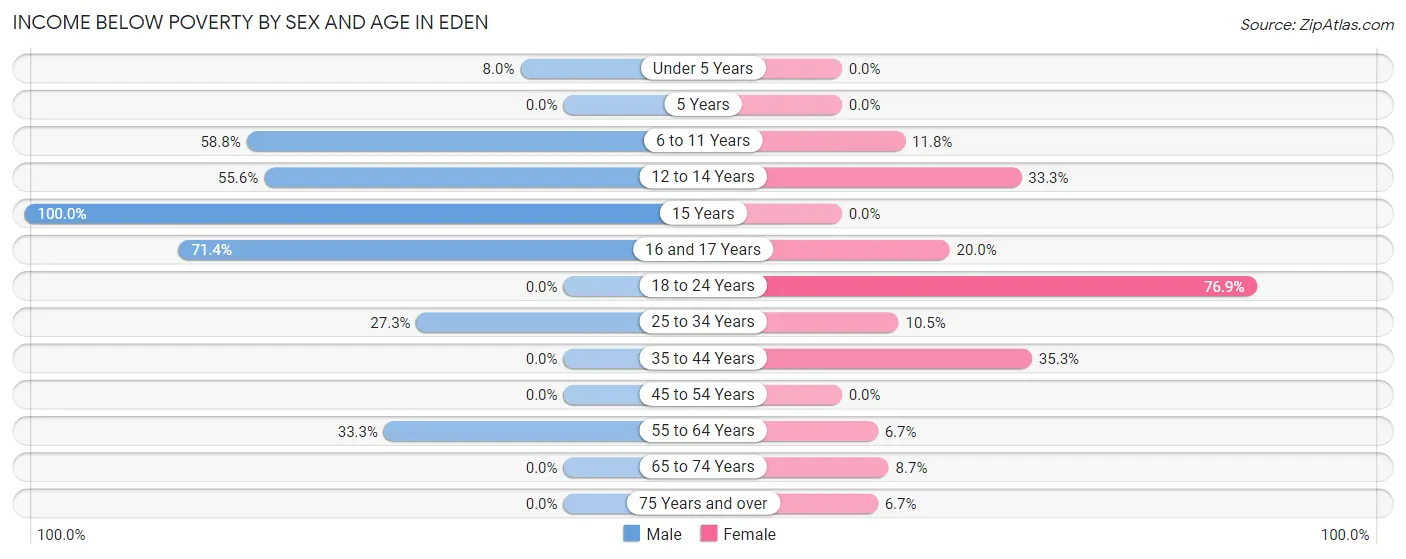
| Age Bracket | Male | Female |
| Under 5 Years | 4 (8.0%) | 0 (0.0%) |
| 5 Years | 0 (0.0%) | 0 (0.0%) |
| 6 to 11 Years | 10 (58.8%) | 4 (11.8%) |
| 12 to 14 Years | 5 (55.6%) | 5 (33.3%) |
| 15 Years | 9 (100.0%) | 0 (0.0%) |
| 16 and 17 Years | 5 (71.4%) | 2 (20.0%) |
| 18 to 24 Years | 0 (0.0%) | 10 (76.9%) |
| 25 to 34 Years | 6 (27.3%) | 4 (10.5%) |
| 35 to 44 Years | 0 (0.0%) | 6 (35.3%) |
| 45 to 54 Years | 0 (0.0%) | 0 (0.0%) |
| 55 to 64 Years | 5 (33.3%) | 1 (6.7%) |
| 65 to 74 Years | 0 (0.0%) | 2 (8.7%) |
| 75 Years and over | 0 (0.0%) | 1 (6.7%) |
| Total | 44 (24.7%) | 35 (16.1%) |
Income Above Poverty by Sex and Age in Eden
According to the poverty statistics in Eden, males aged 5 years and females aged under 5 years are the age groups that are most secure financially, with 100.0% of males and 100.0% of females in these age groups living above the poverty line.
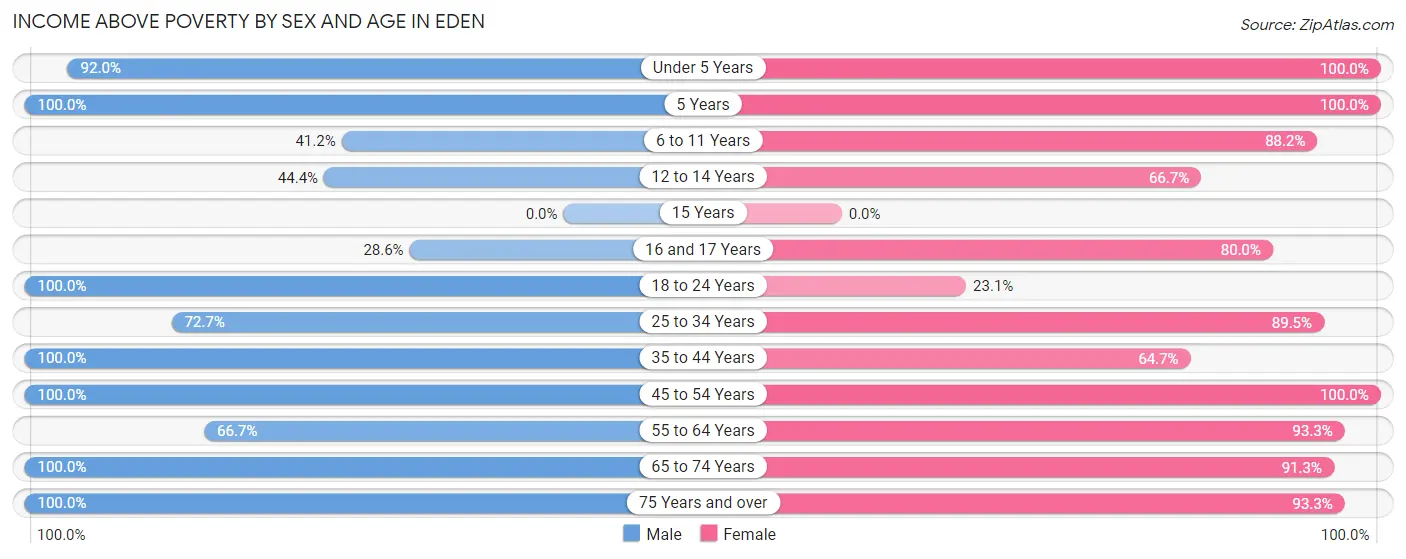
| Age Bracket | Male | Female |
| Under 5 Years | 46 (92.0%) | 19 (100.0%) |
| 5 Years | 11 (100.0%) | 2 (100.0%) |
| 6 to 11 Years | 7 (41.2%) | 30 (88.2%) |
| 12 to 14 Years | 4 (44.4%) | 10 (66.7%) |
| 15 Years | 0 (0.0%) | 0 (0.0%) |
| 16 and 17 Years | 2 (28.6%) | 8 (80.0%) |
| 18 to 24 Years | 1 (100.0%) | 3 (23.1%) |
| 25 to 34 Years | 16 (72.7%) | 34 (89.5%) |
| 35 to 44 Years | 4 (100.0%) | 11 (64.7%) |
| 45 to 54 Years | 13 (100.0%) | 17 (100.0%) |
| 55 to 64 Years | 10 (66.7%) | 14 (93.3%) |
| 65 to 74 Years | 15 (100.0%) | 21 (91.3%) |
| 75 Years and over | 5 (100.0%) | 14 (93.3%) |
| Total | 134 (75.3%) | 183 (83.9%) |
Income Below Poverty Among Married-Couple Families in Eden
The poverty statistics for married-couple families in Eden show that 19.1% or 8 of the total 42 families live below the poverty line. Families with 3 or 4 children have the highest poverty rate of 66.7%, comprising of 4 families. On the other hand, families with 1 or 2 children have the lowest poverty rate of 0.0%, which includes 0 families.
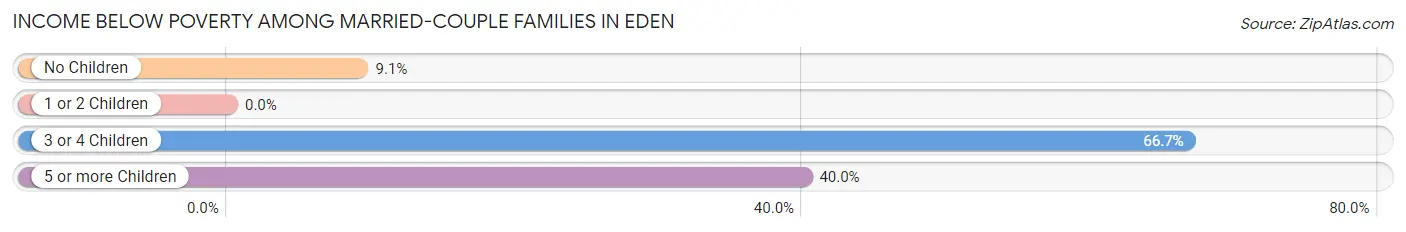
| Children | Above Poverty | Below Poverty |
| No Children | 20 (90.9%) | 2 (9.1%) |
| 1 or 2 Children | 9 (100.0%) | 0 (0.0%) |
| 3 or 4 Children | 2 (33.3%) | 4 (66.7%) |
| 5 or more Children | 3 (60.0%) | 2 (40.0%) |
| Total | 34 (80.9%) | 8 (19.1%) |
Income Below Poverty Among Single-Parent Households in Eden
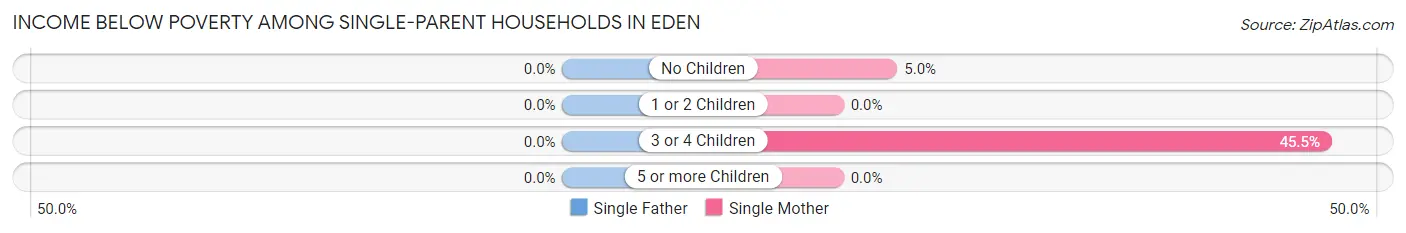
| Children | Single Father | Single Mother |
| No Children | 0 (0.0%) | 1 (5.0%) |
| 1 or 2 Children | 0 (0.0%) | 0 (0.0%) |
| 3 or 4 Children | 0 (0.0%) | 5 (45.5%) |
| 5 or more Children | 0 (0.0%) | 0 (0.0%) |
| Total | 0 (0.0%) | 6 (18.8%) |
Income Below Poverty Among Married-Couple vs Single-Parent Households in Eden
The poverty data for Eden shows that 8 of the married-couple family households (19.1%) and 6 of the single-parent households (18.8%) are living below the poverty level. Within the married-couple family households, those with 3 or 4 children have the highest poverty rate, with 4 households (66.7%) falling below the poverty line. Among the single-parent households, those with 3 or 4 children have the highest poverty rate, with 5 household (45.5%) living below poverty.
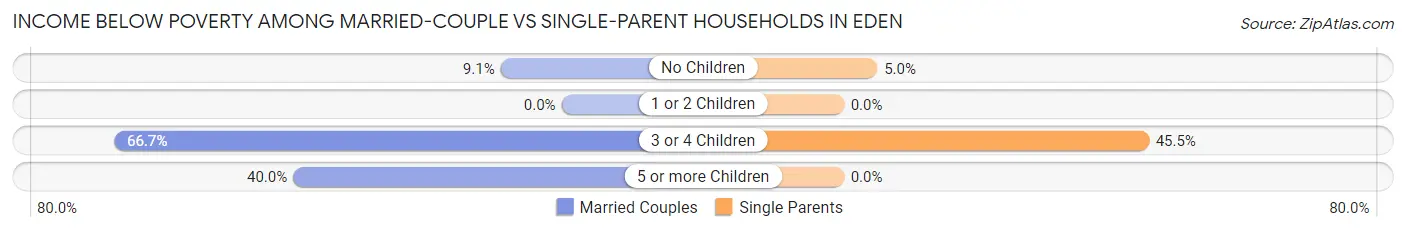
| Children | Married-Couple Families | Single-Parent Households |
| No Children | 2 (9.1%) | 1 (5.0%) |
| 1 or 2 Children | 0 (0.0%) | 0 (0.0%) |
| 3 or 4 Children | 4 (66.7%) | 5 (45.5%) |
| 5 or more Children | 2 (40.0%) | 0 (0.0%) |
| Total | 8 (19.1%) | 6 (18.8%) |
Employment Characteristics in Eden
Employment by Class of Employer in Eden
Among the 124 employed individuals in Eden, private company employees (93 | 75.0%), not-for-profit organizations (14 | 11.3%), and self-employed (not incorporated) (7 | 5.7%) make up the most common classes of employment.
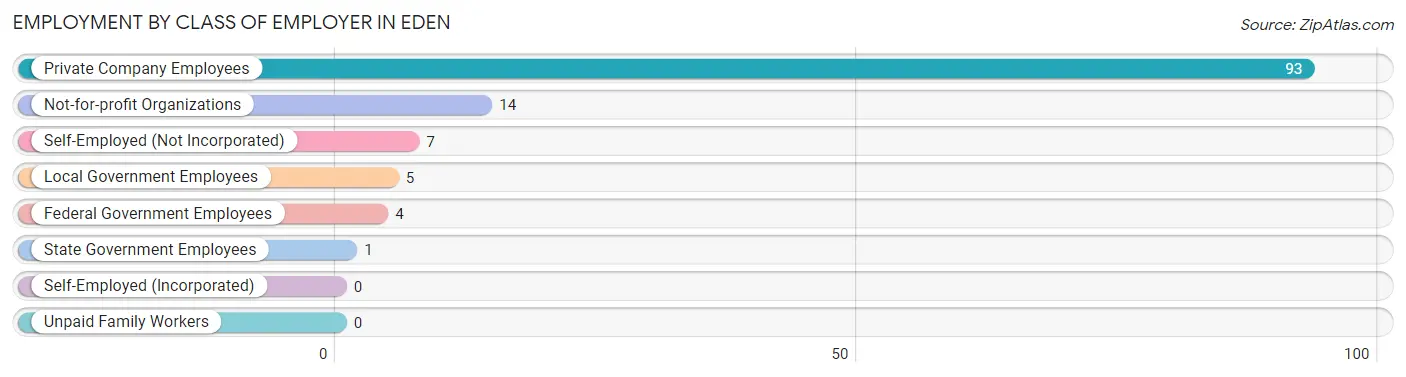
| Employer Class | # Employees | % Employees |
| Private Company Employees | 93 | 75.0% |
| Self-Employed (Incorporated) | 0 | 0.0% |
| Self-Employed (Not Incorporated) | 7 | 5.7% |
| Not-for-profit Organizations | 14 | 11.3% |
| Local Government Employees | 5 | 4.0% |
| State Government Employees | 1 | 0.8% |
| Federal Government Employees | 4 | 3.2% |
| Unpaid Family Workers | 0 | 0.0% |
| Total | 124 | 100.0% |
Employment Status by Age in Eden
According to the labor force statistics for Eden, out of the total population over 16 years of age (230), 57.8% or 133 individuals are in the labor force, with 4.5% or 6 of them unemployed. The age group with the highest labor force participation rate is 20 to 24 years, with 100.0% or 4 individuals in the labor force. Within the labor force, the 60 to 64 years age range has the highest percentage of unemployed individuals, with 100.0% or 4 of them being unemployed.
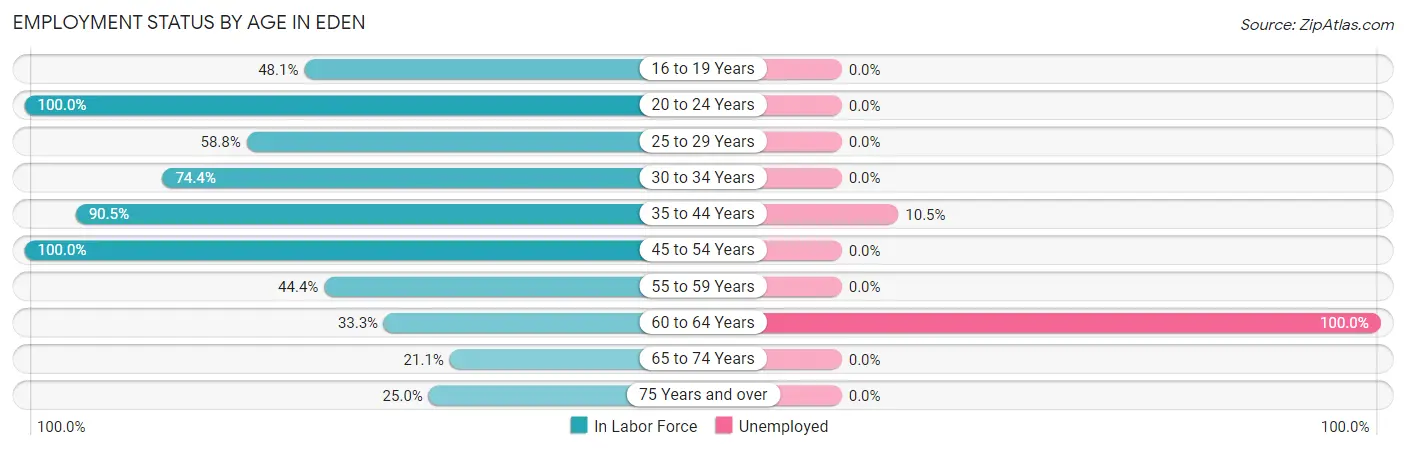
| Age Bracket | In Labor Force | Unemployed |
| 16 to 19 Years | 13 (48.1%) | 0 (0.0%) |
| 20 to 24 Years | 4 (100.0%) | 0 (0.0%) |
| 25 to 29 Years | 10 (58.8%) | 0 (0.0%) |
| 30 to 34 Years | 32 (74.4%) | 0 (0.0%) |
| 35 to 44 Years | 19 (90.5%) | 2 (10.5%) |
| 45 to 54 Years | 30 (100.0%) | 0 (0.0%) |
| 55 to 59 Years | 8 (44.4%) | 0 (0.0%) |
| 60 to 64 Years | 4 (33.3%) | 4 (100.0%) |
| 65 to 74 Years | 8 (21.1%) | 0 (0.0%) |
| 75 Years and over | 5 (25.0%) | 0 (0.0%) |
| Total | 133 (57.8%) | 6 (4.5%) |
Employment Status by Educational Attainment in Eden
According to labor force statistics for Eden, 73.0% of individuals (103) out of the total population between 25 and 64 years of age (141) are in the labor force, with 5.8% or 6 of them being unemployed. The group with the highest labor force participation rate are those with the educational attainment of less than high school, with 100.0% or 29 individuals in the labor force. Within the labor force, individuals with high school diploma education have the highest percentage of unemployment, with 28.6% or 4 of them being unemployed.
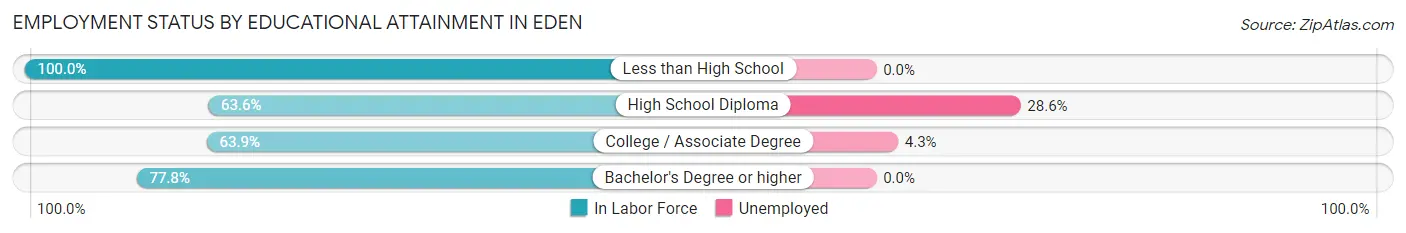
| Educational Attainment | In Labor Force | Unemployed |
| Less than High School | 29 (100.0%) | 0 (0.0%) |
| High School Diploma | 14 (63.6%) | 6 (28.6%) |
| College / Associate Degree | 46 (63.9%) | 3 (4.3%) |
| Bachelor's Degree or higher | 14 (77.8%) | 0 (0.0%) |
| Total | 103 (73.0%) | 8 (5.8%) |
Employment Occupations by Sex in Eden
Management, Business, Science and Arts Occupations
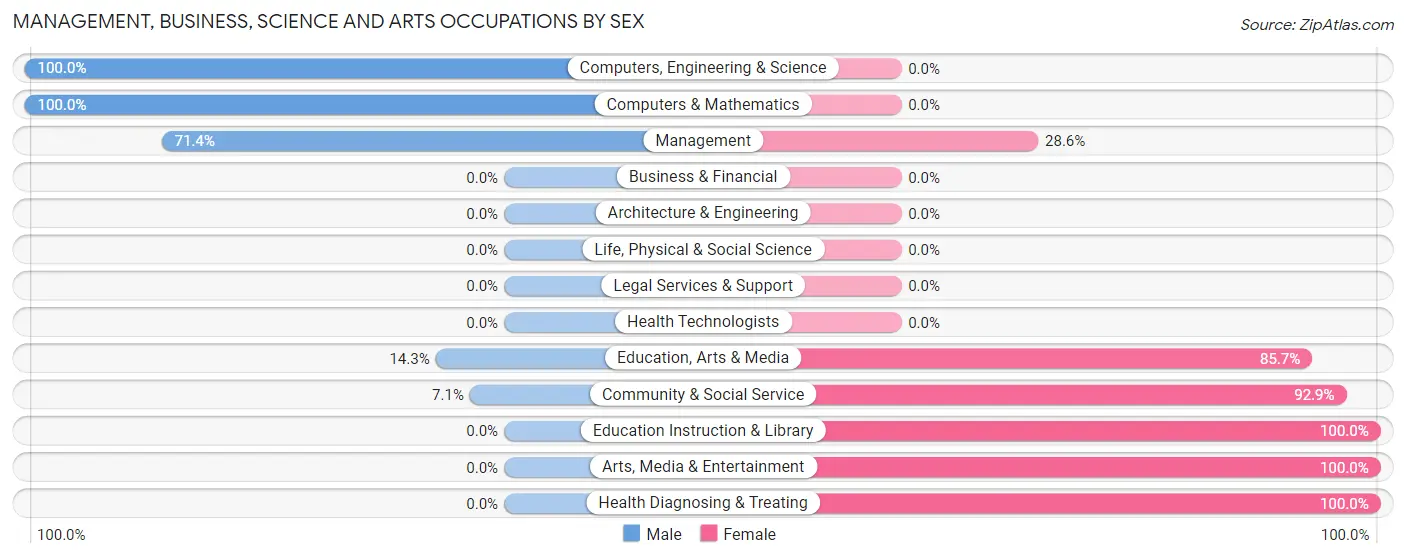
The most common Management, Business, Science and Arts occupations in Eden are Community & Social Service (14 | 11.0%), Management (7 | 5.5%), Education, Arts & Media (7 | 5.5%), Health Diagnosing & Treating (5 | 3.9%), and Education Instruction & Library (4 | 3.2%).
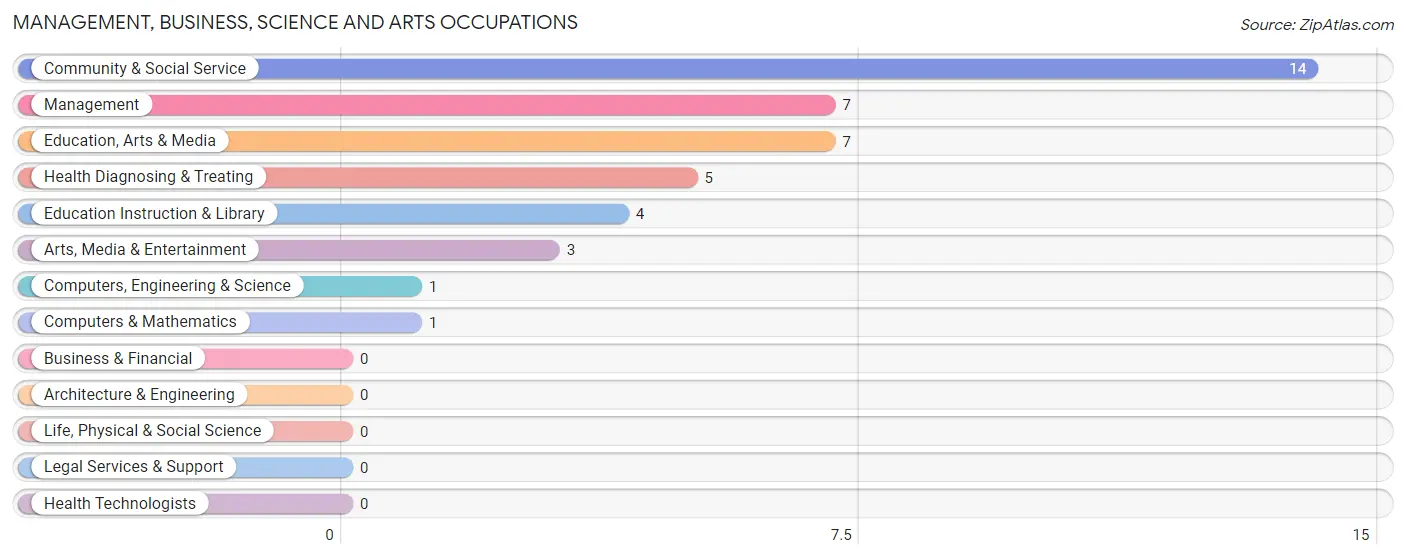
Management, Business, Science and Arts Occupations by Sex
Within the Management, Business, Science and Arts occupations in Eden, the most male-oriented occupations are Computers, Engineering & Science (100.0%), Computers & Mathematics (100.0%), and Management (71.4%), while the most female-oriented occupations are Education Instruction & Library (100.0%), Arts, Media & Entertainment (100.0%), and Health Diagnosing & Treating (100.0%).
| Occupation | Male | Female |
| Management | 5 (71.4%) | 2 (28.6%) |
| Business & Financial | 0 (0.0%) | 0 (0.0%) |
| Computers, Engineering & Science | 1 (100.0%) | 0 (0.0%) |
| Computers & Mathematics | 1 (100.0%) | 0 (0.0%) |
| Architecture & Engineering | 0 (0.0%) | 0 (0.0%) |
| Life, Physical & Social Science | 0 (0.0%) | 0 (0.0%) |
| Community & Social Service | 1 (7.1%) | 13 (92.9%) |
| Education, Arts & Media | 1 (14.3%) | 6 (85.7%) |
| Legal Services & Support | 0 (0.0%) | 0 (0.0%) |
| Education Instruction & Library | 0 (0.0%) | 4 (100.0%) |
| Arts, Media & Entertainment | 0 (0.0%) | 3 (100.0%) |
| Health Diagnosing & Treating | 0 (0.0%) | 5 (100.0%) |
| Health Technologists | 0 (0.0%) | 0 (0.0%) |
| Total (Category) | 7 (25.9%) | 20 (74.1%) |
| Total (Overall) | 50 (39.4%) | 77 (60.6%) |
Services Occupations
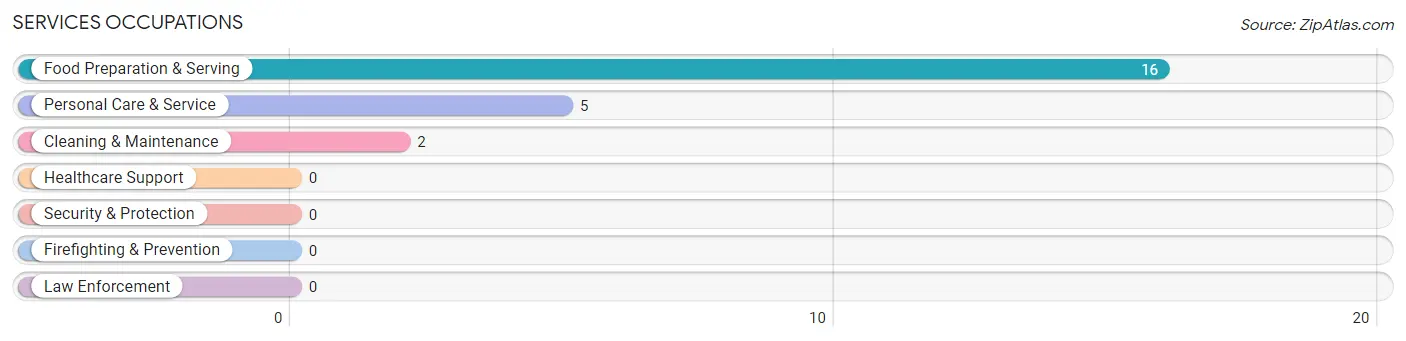
The most common Services occupations in Eden are Food Preparation & Serving (16 | 12.6%), Personal Care & Service (5 | 3.9%), and Cleaning & Maintenance (2 | 1.6%).
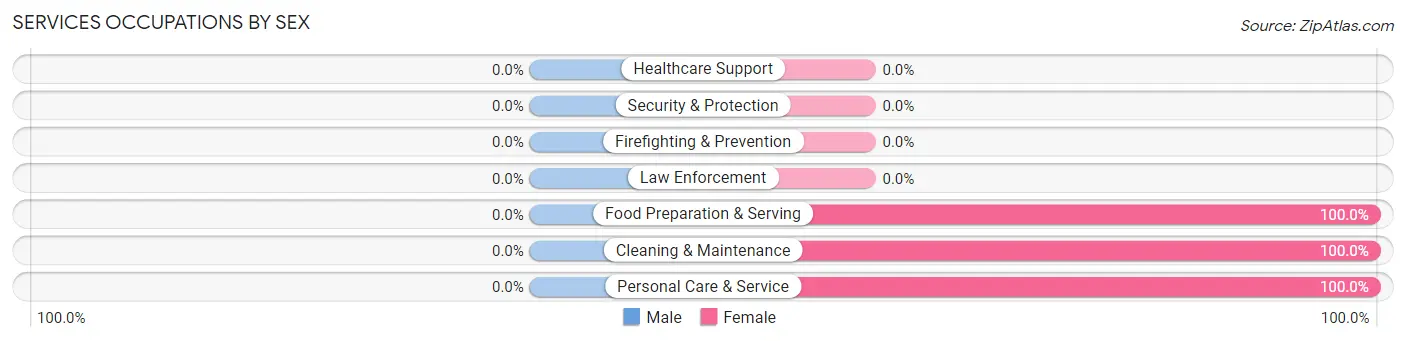
Services Occupations by Sex
| Occupation | Male | Female |
| Healthcare Support | 0 (0.0%) | 0 (0.0%) |
| Security & Protection | 0 (0.0%) | 0 (0.0%) |
| Firefighting & Prevention | 0 (0.0%) | 0 (0.0%) |
| Law Enforcement | 0 (0.0%) | 0 (0.0%) |
| Food Preparation & Serving | 0 (0.0%) | 16 (100.0%) |
| Cleaning & Maintenance | 0 (0.0%) | 2 (100.0%) |
| Personal Care & Service | 0 (0.0%) | 5 (100.0%) |
| Total (Category) | 0 (0.0%) | 23 (100.0%) |
| Total (Overall) | 50 (39.4%) | 77 (60.6%) |
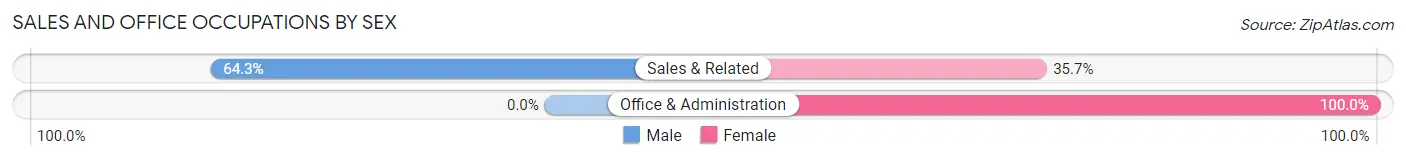
Sales and Office Occupations
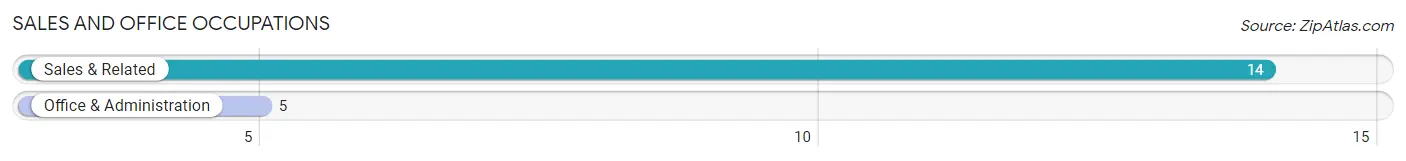
The most common Sales and Office occupations in Eden are Sales & Related (14 | 11.0%), and Office & Administration (5 | 3.9%).
Sales and Office Occupations by Sex
| Occupation | Male | Female |
| Sales & Related | 9 (64.3%) | 5 (35.7%) |
| Office & Administration | 0 (0.0%) | 5 (100.0%) |
| Total (Category) | 9 (47.4%) | 10 (52.6%) |
| Total (Overall) | 50 (39.4%) | 77 (60.6%) |
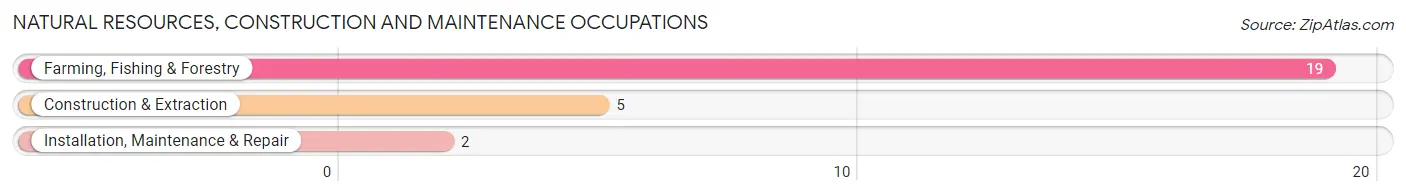
Natural Resources, Construction and Maintenance Occupations
The most common Natural Resources, Construction and Maintenance occupations in Eden are Farming, Fishing & Forestry (19 | 15.0%), Construction & Extraction (5 | 3.9%), and Installation, Maintenance & Repair (2 | 1.6%).
Natural Resources, Construction and Maintenance Occupations by Sex
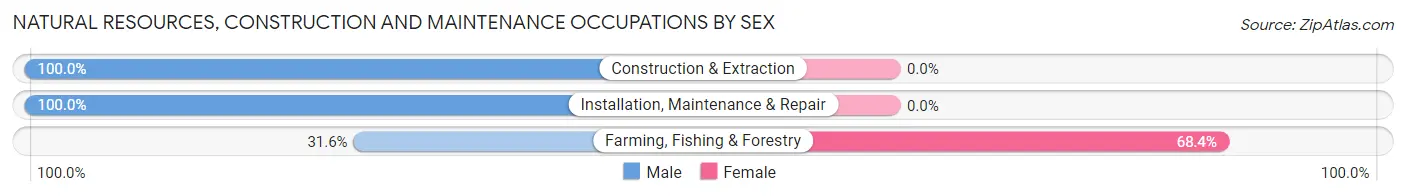
| Occupation | Male | Female |
| Farming, Fishing & Forestry | 6 (31.6%) | 13 (68.4%) |
| Construction & Extraction | 5 (100.0%) | 0 (0.0%) |
| Installation, Maintenance & Repair | 2 (100.0%) | 0 (0.0%) |
| Total (Category) | 13 (50.0%) | 13 (50.0%) |
| Total (Overall) | 50 (39.4%) | 77 (60.6%) |
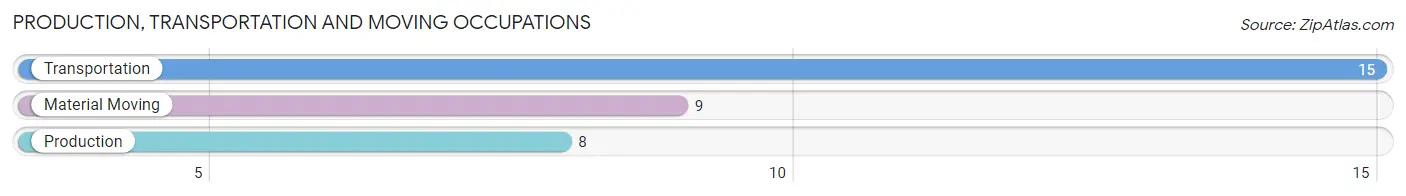
Production, Transportation and Moving Occupations
The most common Production, Transportation and Moving occupations in Eden are Transportation (15 | 11.8%), Material Moving (9 | 7.1%), and Production (8 | 6.3%).
Production, Transportation and Moving Occupations by Sex
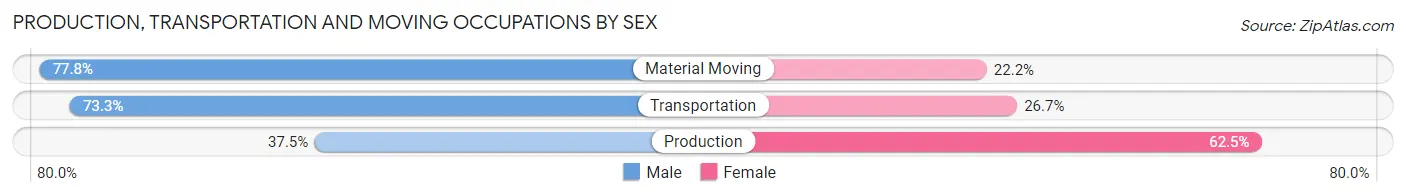
| Occupation | Male | Female |
| Production | 3 (37.5%) | 5 (62.5%) |
| Transportation | 11 (73.3%) | 4 (26.7%) |
| Material Moving | 7 (77.8%) | 2 (22.2%) |
| Total (Category) | 21 (65.6%) | 11 (34.4%) |
| Total (Overall) | 50 (39.4%) | 77 (60.6%) |
Employment Industries by Sex in Eden
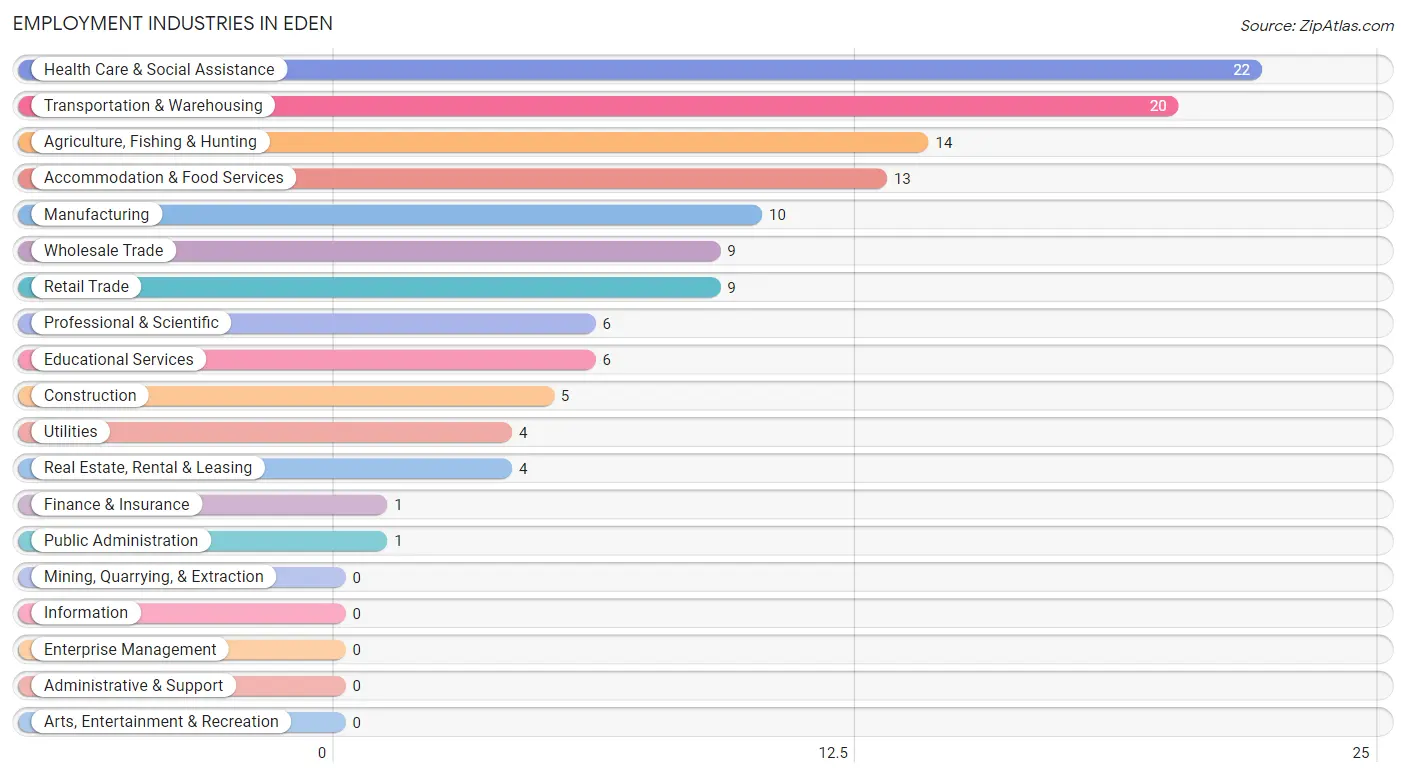
Employment Industries in Eden
The major employment industries in Eden include Health Care & Social Assistance (22 | 17.3%), Transportation & Warehousing (20 | 15.8%), Agriculture, Fishing & Hunting (14 | 11.0%), Accommodation & Food Services (13 | 10.2%), and Manufacturing (10 | 7.9%).
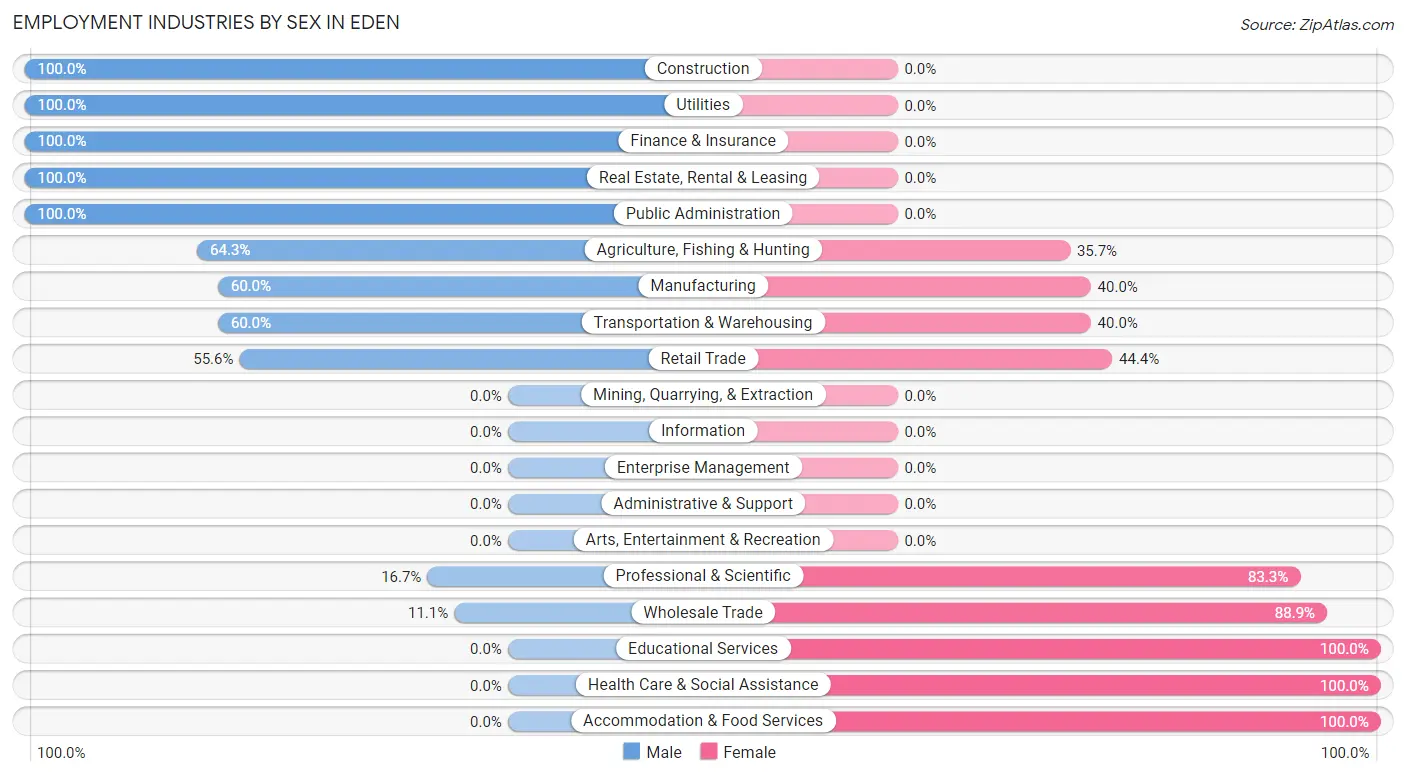
Employment Industries by Sex in Eden
The Eden industries that see more men than women are Construction (100.0%), Utilities (100.0%), and Finance & Insurance (100.0%), whereas the industries that tend to have a higher number of women are Educational Services (100.0%), Health Care & Social Assistance (100.0%), and Accommodation & Food Services (100.0%).
| Industry | Male | Female |
| Agriculture, Fishing & Hunting | 9 (64.3%) | 5 (35.7%) |
| Mining, Quarrying, & Extraction | 0 (0.0%) | 0 (0.0%) |
| Construction | 5 (100.0%) | 0 (0.0%) |
| Manufacturing | 6 (60.0%) | 4 (40.0%) |
| Wholesale Trade | 1 (11.1%) | 8 (88.9%) |
| Retail Trade | 5 (55.6%) | 4 (44.4%) |
| Transportation & Warehousing | 12 (60.0%) | 8 (40.0%) |
| Utilities | 4 (100.0%) | 0 (0.0%) |
| Information | 0 (0.0%) | 0 (0.0%) |
| Finance & Insurance | 1 (100.0%) | 0 (0.0%) |
| Real Estate, Rental & Leasing | 4 (100.0%) | 0 (0.0%) |
| Professional & Scientific | 1 (16.7%) | 5 (83.3%) |
| Enterprise Management | 0 (0.0%) | 0 (0.0%) |
| Administrative & Support | 0 (0.0%) | 0 (0.0%) |
| Educational Services | 0 (0.0%) | 6 (100.0%) |
| Health Care & Social Assistance | 0 (0.0%) | 22 (100.0%) |
| Arts, Entertainment & Recreation | 0 (0.0%) | 0 (0.0%) |
| Accommodation & Food Services | 0 (0.0%) | 13 (100.0%) |
| Public Administration | 1 (100.0%) | 0 (0.0%) |
| Total | 50 (39.4%) | 77 (60.6%) |
Education in Eden
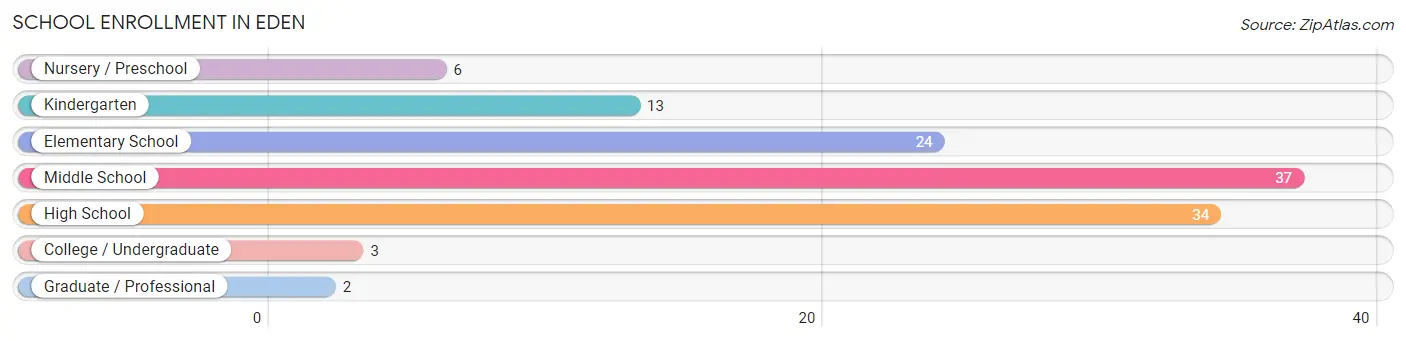
School Enrollment in Eden
The most common levels of schooling among the 119 students in Eden are middle school (37 | 31.1%), high school (34 | 28.6%), and elementary school (24 | 20.2%).
| School Level | # Students | % Students |
| Nursery / Preschool | 6 | 5.0% |
| Kindergarten | 13 | 10.9% |
| Elementary School | 24 | 20.2% |
| Middle School | 37 | 31.1% |
| High School | 34 | 28.6% |
| College / Undergraduate | 3 | 2.5% |
| Graduate / Professional | 2 | 1.7% |
| Total | 119 | 100.0% |
School Enrollment by Age by Funding Source in Eden
Out of a total of 119 students who are enrolled in schools in Eden, 11 (9.2%) attend a private institution, while the remaining 108 (90.8%) are enrolled in public schools. The age group of 20 to 24 year olds has the highest likelihood of being enrolled in private schools, with 3 (100.0% in the age bracket) enrolled. Conversely, the age group of 3 to 4 year olds has the lowest likelihood of being enrolled in a private school, with 3 (100.0% in the age bracket) attending a public institution.
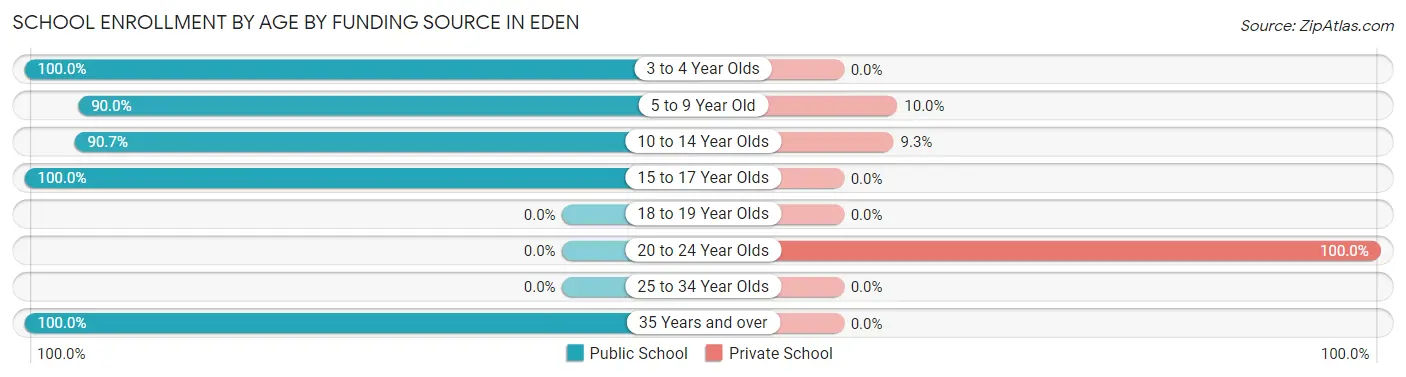
| Age Bracket | Public School | Private School |
| 3 to 4 Year Olds | 3 (100.0%) | 0 (0.0%) |
| 5 to 9 Year Old | 36 (90.0%) | 4 (10.0%) |
| 10 to 14 Year Olds | 39 (90.7%) | 4 (9.3%) |
| 15 to 17 Year Olds | 26 (100.0%) | 0 (0.0%) |
| 18 to 19 Year Olds | 0 (0.0%) | 0 (0.0%) |
| 20 to 24 Year Olds | 0 (0.0%) | 3 (100.0%) |
| 25 to 34 Year Olds | 0 (0.0%) | 0 (0.0%) |
| 35 Years and over | 4 (100.0%) | 0 (0.0%) |
| Total | 108 (90.8%) | 11 (9.2%) |
Educational Attainment by Field of Study in Eden
Bio, nature & agricultural (7 | 22.6%), psychology (6 | 19.4%), business (5 | 16.1%), science & technology (4 | 12.9%), and physical & health sciences (2 | 6.5%) are the most common fields of study among 31 individuals in Eden who have obtained a bachelor's degree or higher.
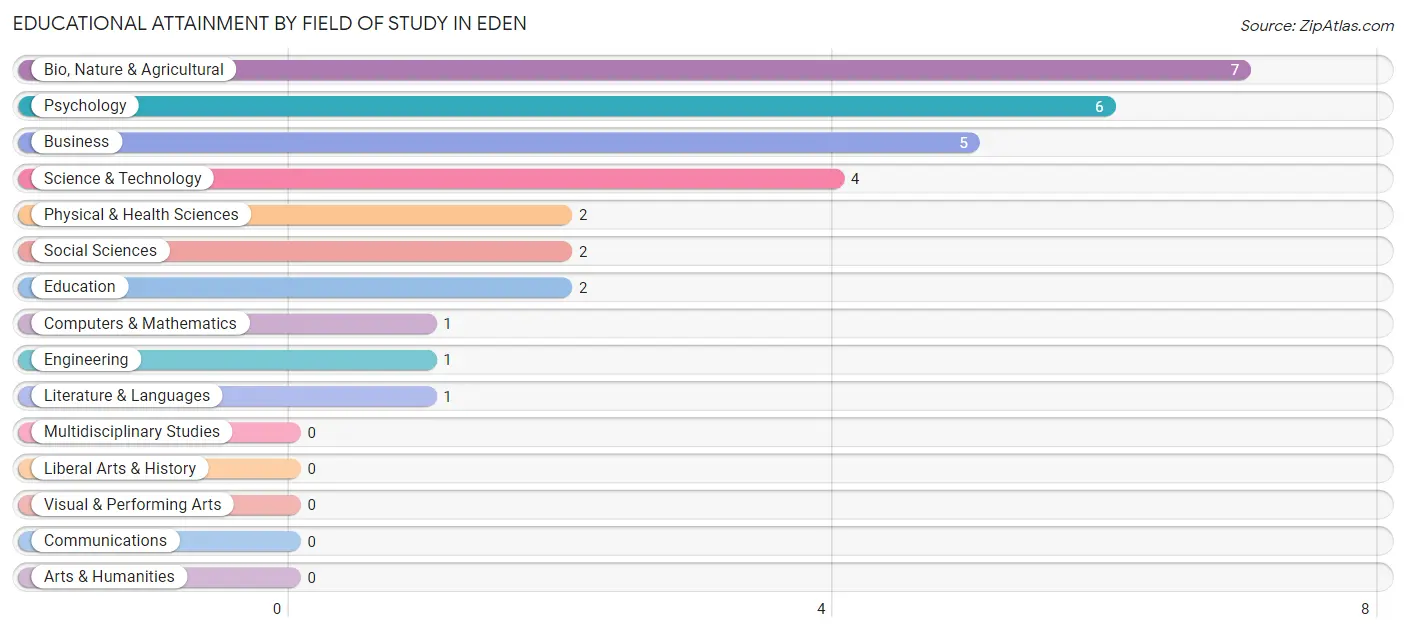
| Field of Study | # Graduates | % Graduates |
| Computers & Mathematics | 1 | 3.2% |
| Bio, Nature & Agricultural | 7 | 22.6% |
| Physical & Health Sciences | 2 | 6.5% |
| Psychology | 6 | 19.4% |
| Social Sciences | 2 | 6.5% |
| Engineering | 1 | 3.2% |
| Multidisciplinary Studies | 0 | 0.0% |
| Science & Technology | 4 | 12.9% |
| Business | 5 | 16.1% |
| Education | 2 | 6.5% |
| Literature & Languages | 1 | 3.2% |
| Liberal Arts & History | 0 | 0.0% |
| Visual & Performing Arts | 0 | 0.0% |
| Communications | 0 | 0.0% |
| Arts & Humanities | 0 | 0.0% |
| Total | 31 | 100.0% |
Transportation & Commute in Eden
Vehicle Availability by Sex in Eden
The most prevalent vehicle ownership categories in Eden are males with 2 vehicles (28, accounting for 59.6%) and females with 2 vehicles (12, making up 36.4%).
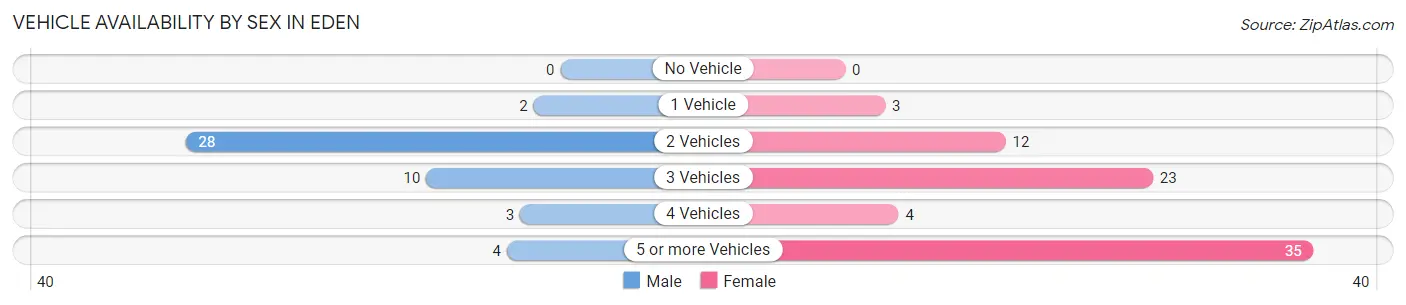
| Vehicles Available | Male | Female |
| No Vehicle | 0 (0.0%) | 0 (0.0%) |
| 1 Vehicle | 2 (4.3%) | 3 (3.9%) |
| 2 Vehicles | 28 (59.6%) | 12 (15.6%) |
| 3 Vehicles | 10 (21.3%) | 23 (29.9%) |
| 4 Vehicles | 3 (6.4%) | 4 (5.2%) |
| 5 or more Vehicles | 4 (8.5%) | 35 (45.5%) |
| Total | 47 (100.0%) | 77 (100.0%) |
Commute Time in Eden
The most frequently occuring commute durations in Eden are 30 to 34 minutes (27 commuters, 22.3%), 20 to 24 minutes (25 commuters, 20.7%), and 5 to 9 minutes (18 commuters, 14.9%).
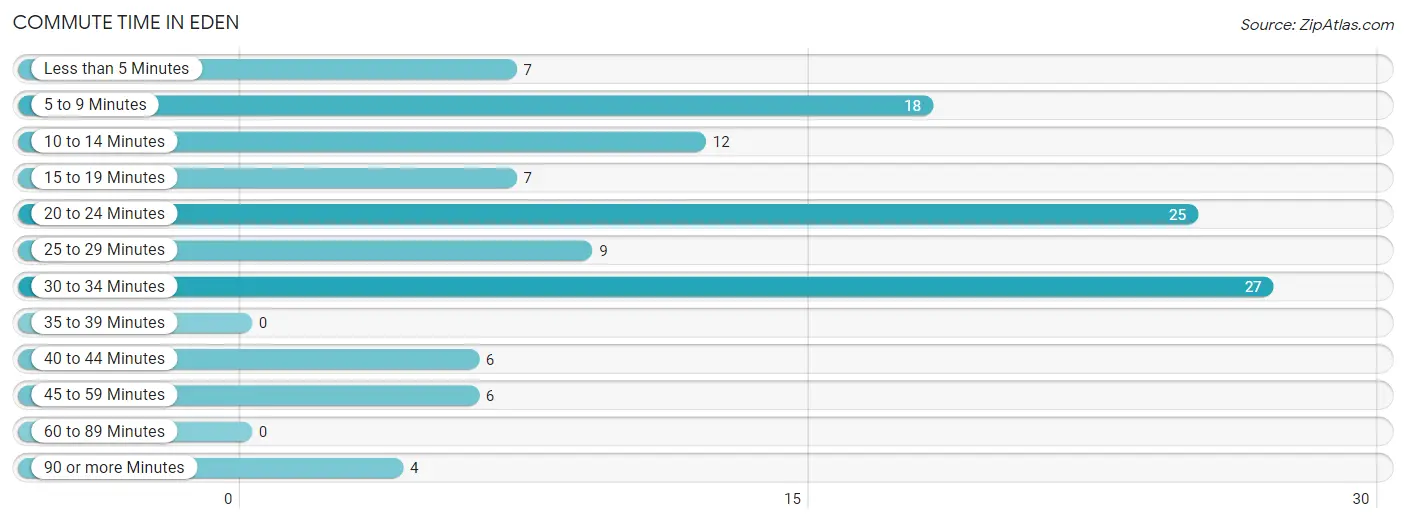
| Commute Time | # Commuters | % Commuters |
| Less than 5 Minutes | 7 | 5.8% |
| 5 to 9 Minutes | 18 | 14.9% |
| 10 to 14 Minutes | 12 | 9.9% |
| 15 to 19 Minutes | 7 | 5.8% |
| 20 to 24 Minutes | 25 | 20.7% |
| 25 to 29 Minutes | 9 | 7.4% |
| 30 to 34 Minutes | 27 | 22.3% |
| 35 to 39 Minutes | 0 | 0.0% |
| 40 to 44 Minutes | 6 | 5.0% |
| 45 to 59 Minutes | 6 | 5.0% |
| 60 to 89 Minutes | 0 | 0.0% |
| 90 or more Minutes | 4 | 3.3% |
Commute Time by Sex in Eden
The most common commute times in Eden are 30 to 34 minutes (11 commuters, 23.9%) for males and 20 to 24 minutes (18 commuters, 24.0%) for females.
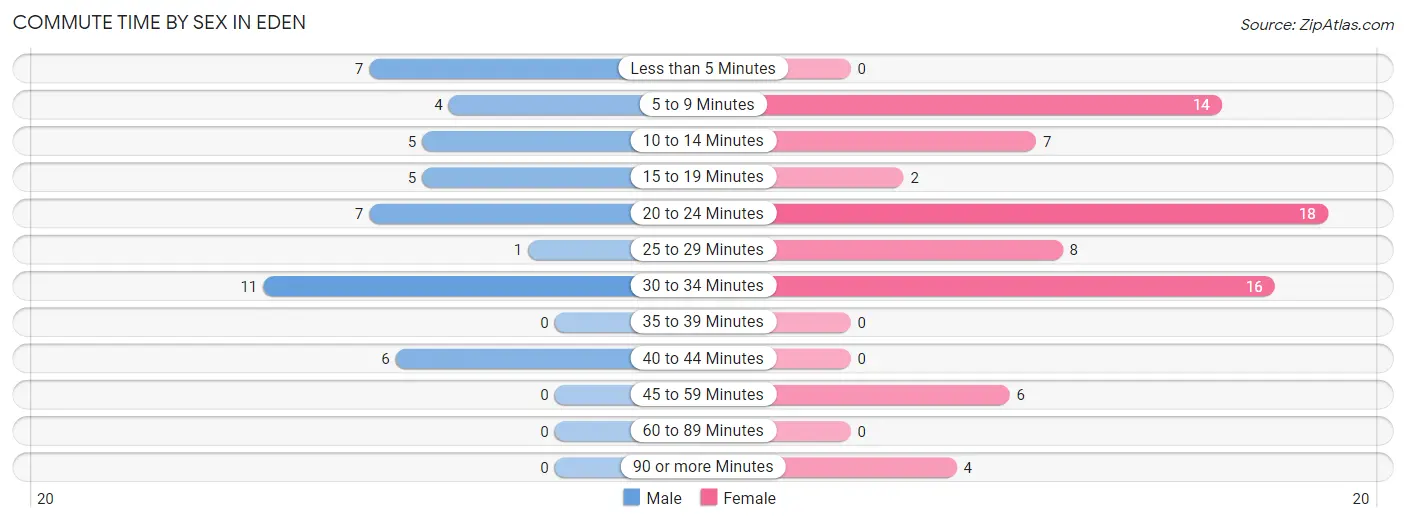
| Commute Time | Male | Female |
| Less than 5 Minutes | 7 (15.2%) | 0 (0.0%) |
| 5 to 9 Minutes | 4 (8.7%) | 14 (18.7%) |
| 10 to 14 Minutes | 5 (10.9%) | 7 (9.3%) |
| 15 to 19 Minutes | 5 (10.9%) | 2 (2.7%) |
| 20 to 24 Minutes | 7 (15.2%) | 18 (24.0%) |
| 25 to 29 Minutes | 1 (2.2%) | 8 (10.7%) |
| 30 to 34 Minutes | 11 (23.9%) | 16 (21.3%) |
| 35 to 39 Minutes | 0 (0.0%) | 0 (0.0%) |
| 40 to 44 Minutes | 6 (13.0%) | 0 (0.0%) |
| 45 to 59 Minutes | 0 (0.0%) | 6 (8.0%) |
| 60 to 89 Minutes | 0 (0.0%) | 0 (0.0%) |
| 90 or more Minutes | 0 (0.0%) | 4 (5.3%) |
Time of Departure to Work by Sex in Eden
The most frequent times of departure to work in Eden are 5:30 AM to 5:59 AM (12, 26.1%) for males and 7:00 AM to 7:29 AM (23, 30.7%) for females.
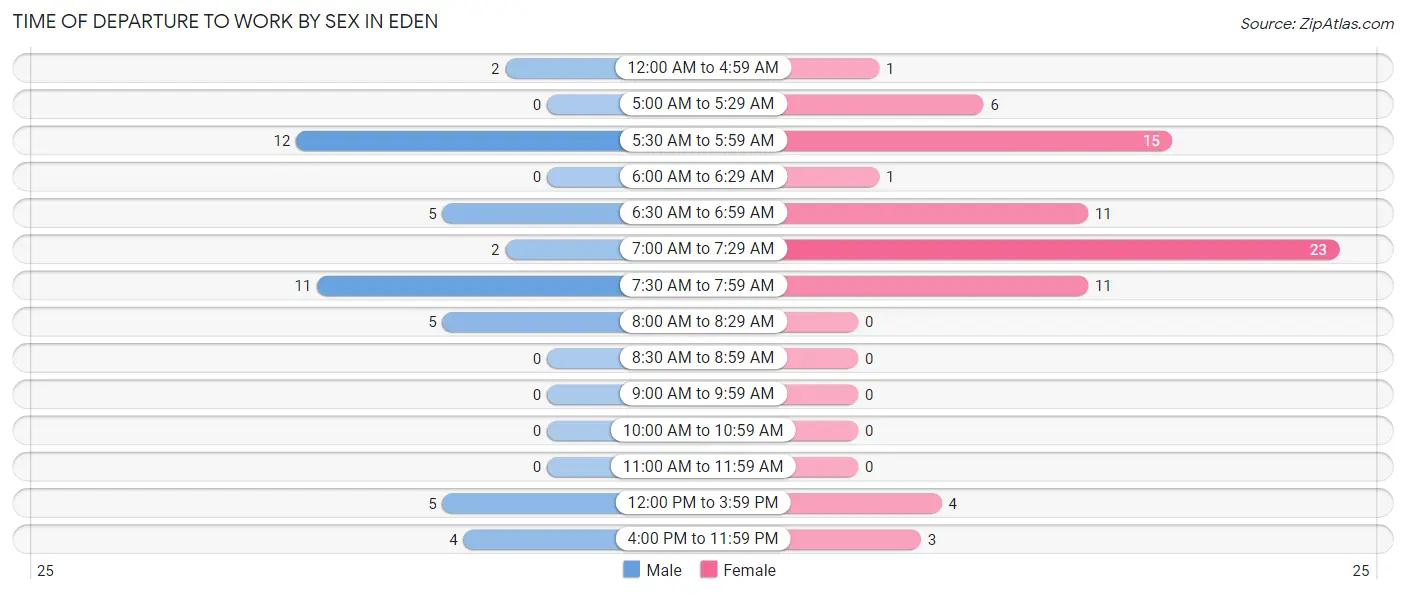
| Time of Departure | Male | Female |
| 12:00 AM to 4:59 AM | 2 (4.3%) | 1 (1.3%) |
| 5:00 AM to 5:29 AM | 0 (0.0%) | 6 (8.0%) |
| 5:30 AM to 5:59 AM | 12 (26.1%) | 15 (20.0%) |
| 6:00 AM to 6:29 AM | 0 (0.0%) | 1 (1.3%) |
| 6:30 AM to 6:59 AM | 5 (10.9%) | 11 (14.7%) |
| 7:00 AM to 7:29 AM | 2 (4.3%) | 23 (30.7%) |
| 7:30 AM to 7:59 AM | 11 (23.9%) | 11 (14.7%) |
| 8:00 AM to 8:29 AM | 5 (10.9%) | 0 (0.0%) |
| 8:30 AM to 8:59 AM | 0 (0.0%) | 0 (0.0%) |
| 9:00 AM to 9:59 AM | 0 (0.0%) | 0 (0.0%) |
| 10:00 AM to 10:59 AM | 0 (0.0%) | 0 (0.0%) |
| 11:00 AM to 11:59 AM | 0 (0.0%) | 0 (0.0%) |
| 12:00 PM to 3:59 PM | 5 (10.9%) | 4 (5.3%) |
| 4:00 PM to 11:59 PM | 4 (8.7%) | 3 (4.0%) |
| Total | 46 (100.0%) | 75 (100.0%) |
Housing Occupancy in Eden
Occupancy by Ownership in Eden
Of the total 109 dwellings in Eden, owner-occupied units account for 84 (77.1%), while renter-occupied units make up 25 (22.9%).
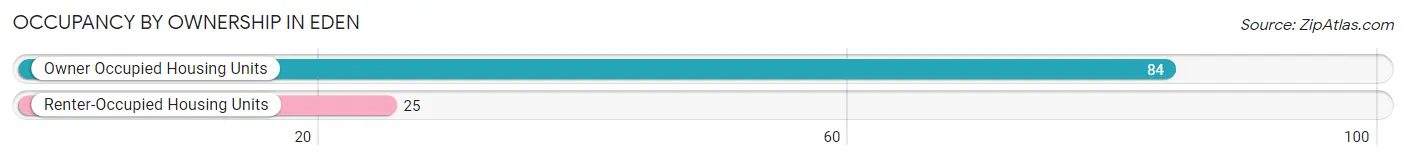
| Occupancy | # Housing Units | % Housing Units |
| Owner Occupied Housing Units | 84 | 77.1% |
| Renter-Occupied Housing Units | 25 | 22.9% |
| Total Occupied Housing Units | 109 | 100.0% |
Occupancy by Household Size in Eden
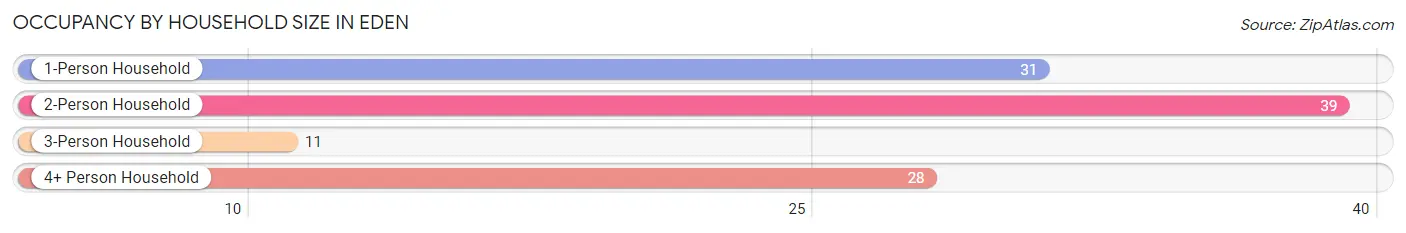
| Household Size | # Housing Units | % Housing Units |
| 1-Person Household | 31 | 28.4% |
| 2-Person Household | 39 | 35.8% |
| 3-Person Household | 11 | 10.1% |
| 4+ Person Household | 28 | 25.7% |
| Total Housing Units | 109 | 100.0% |
Occupancy by Ownership by Household Size in Eden
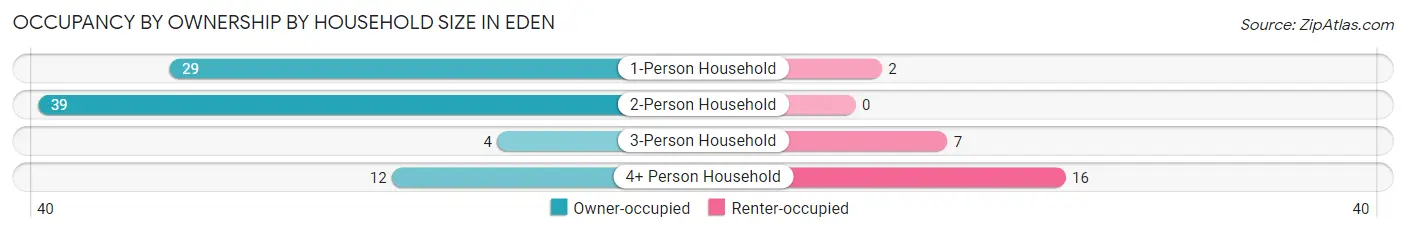
| Household Size | Owner-occupied | Renter-occupied |
| 1-Person Household | 29 (93.5%) | 2 (6.5%) |
| 2-Person Household | 39 (100.0%) | 0 (0.0%) |
| 3-Person Household | 4 (36.4%) | 7 (63.6%) |
| 4+ Person Household | 12 (42.9%) | 16 (57.1%) |
| Total Housing Units | 84 (77.1%) | 25 (22.9%) |
Occupancy by Educational Attainment in Eden
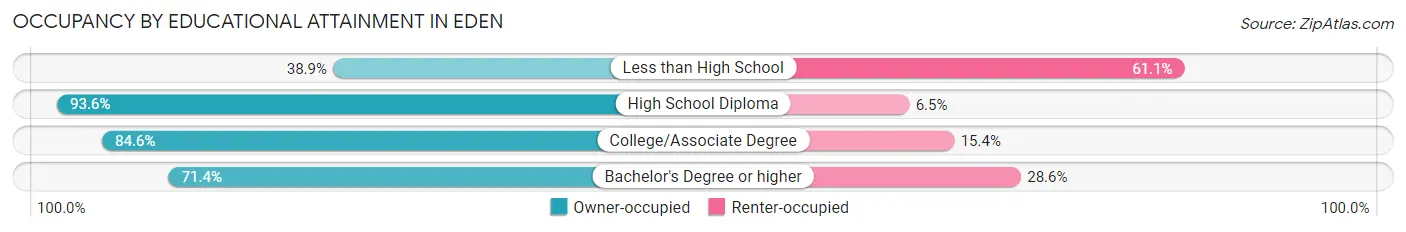
| Household Size | Owner-occupied | Renter-occupied |
| Less than High School | 7 (38.9%) | 11 (61.1%) |
| High School Diploma | 29 (93.5%) | 2 (6.5%) |
| College/Associate Degree | 33 (84.6%) | 6 (15.4%) |
| Bachelor's Degree or higher | 15 (71.4%) | 6 (28.6%) |
Occupancy by Age of Householder in Eden
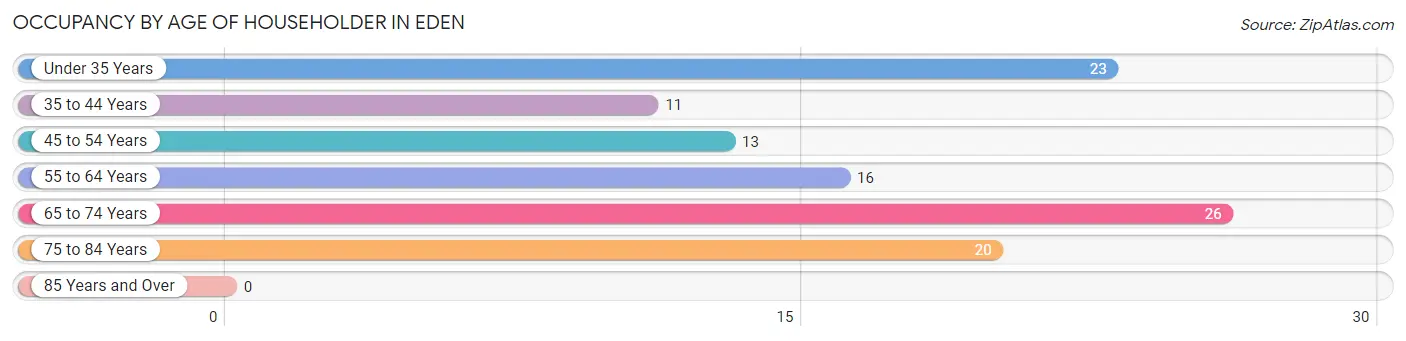
| Age Bracket | # Households | % Households |
| Under 35 Years | 23 | 21.1% |
| 35 to 44 Years | 11 | 10.1% |
| 45 to 54 Years | 13 | 11.9% |
| 55 to 64 Years | 16 | 14.7% |
| 65 to 74 Years | 26 | 23.8% |
| 75 to 84 Years | 20 | 18.3% |
| 85 Years and Over | 0 | 0.0% |
| Total | 109 | 100.0% |
Housing Finances in Eden
Median Income by Occupancy in Eden
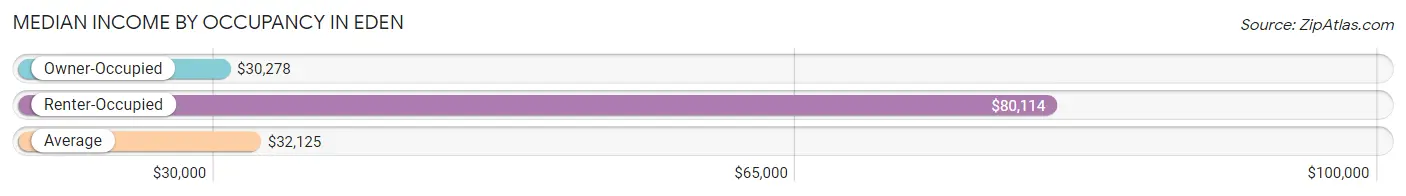
| Occupancy Type | # Households | Median Income |
| Owner-Occupied | 84 (77.1%) | $30,278 |
| Renter-Occupied | 25 (22.9%) | $80,114 |
| Average | 109 (100.0%) | $32,125 |
Occupancy by Householder Income Bracket in Eden
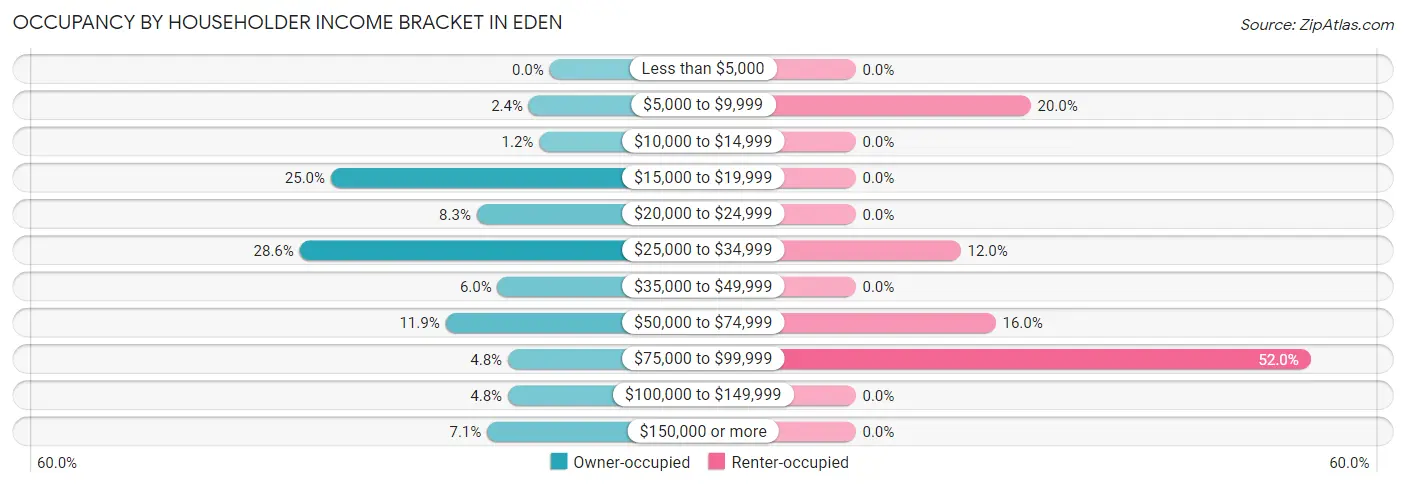
| Income Bracket | Owner-occupied | Renter-occupied |
| Less than $5,000 | 0 (0.0%) | 0 (0.0%) |
| $5,000 to $9,999 | 2 (2.4%) | 5 (20.0%) |
| $10,000 to $14,999 | 1 (1.2%) | 0 (0.0%) |
| $15,000 to $19,999 | 21 (25.0%) | 0 (0.0%) |
| $20,000 to $24,999 | 7 (8.3%) | 0 (0.0%) |
| $25,000 to $34,999 | 24 (28.6%) | 3 (12.0%) |
| $35,000 to $49,999 | 5 (5.9%) | 0 (0.0%) |
| $50,000 to $74,999 | 10 (11.9%) | 4 (16.0%) |
| $75,000 to $99,999 | 4 (4.8%) | 13 (52.0%) |
| $100,000 to $149,999 | 4 (4.8%) | 0 (0.0%) |
| $150,000 or more | 6 (7.1%) | 0 (0.0%) |
| Total | 84 (100.0%) | 25 (100.0%) |
Monthly Housing Cost Tiers in Eden
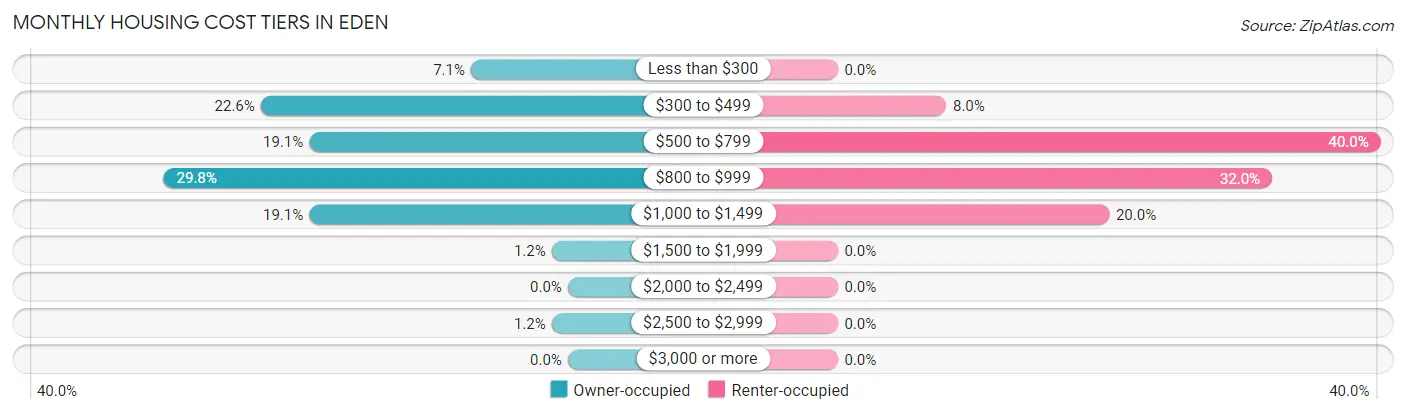
| Monthly Cost | Owner-occupied | Renter-occupied |
| Less than $300 | 6 (7.1%) | 0 (0.0%) |
| $300 to $499 | 19 (22.6%) | 2 (8.0%) |
| $500 to $799 | 16 (19.1%) | 10 (40.0%) |
| $800 to $999 | 25 (29.8%) | 8 (32.0%) |
| $1,000 to $1,499 | 16 (19.1%) | 5 (20.0%) |
| $1,500 to $1,999 | 1 (1.2%) | 0 (0.0%) |
| $2,000 to $2,499 | 0 (0.0%) | 0 (0.0%) |
| $2,500 to $2,999 | 1 (1.2%) | 0 (0.0%) |
| $3,000 or more | 0 (0.0%) | 0 (0.0%) |
| Total | 84 (100.0%) | 25 (100.0%) |
Physical Housing Characteristics in Eden
Housing Structures in Eden
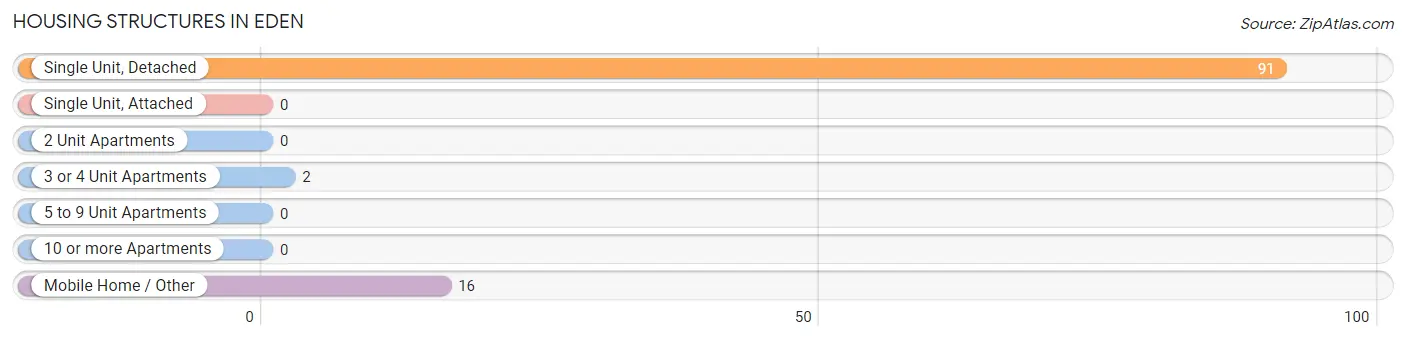
| Structure Type | # Housing Units | % Housing Units |
| Single Unit, Detached | 91 | 83.5% |
| Single Unit, Attached | 0 | 0.0% |
| 2 Unit Apartments | 0 | 0.0% |
| 3 or 4 Unit Apartments | 2 | 1.8% |
| 5 to 9 Unit Apartments | 0 | 0.0% |
| 10 or more Apartments | 0 | 0.0% |
| Mobile Home / Other | 16 | 14.7% |
| Total | 109 | 100.0% |
Housing Structures by Occupancy in Eden
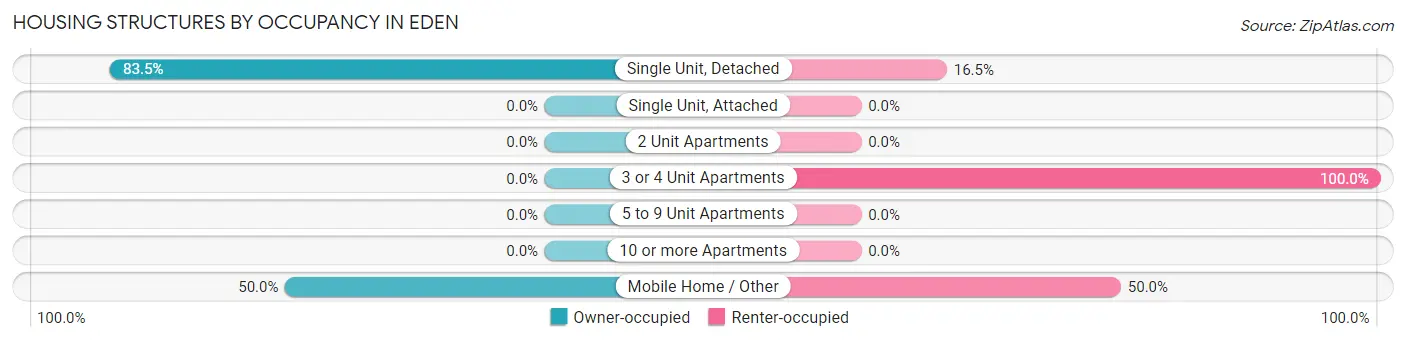
| Structure Type | Owner-occupied | Renter-occupied |
| Single Unit, Detached | 76 (83.5%) | 15 (16.5%) |
| Single Unit, Attached | 0 (0.0%) | 0 (0.0%) |
| 2 Unit Apartments | 0 (0.0%) | 0 (0.0%) |
| 3 or 4 Unit Apartments | 0 (0.0%) | 2 (100.0%) |
| 5 to 9 Unit Apartments | 0 (0.0%) | 0 (0.0%) |
| 10 or more Apartments | 0 (0.0%) | 0 (0.0%) |
| Mobile Home / Other | 8 (50.0%) | 8 (50.0%) |
| Total | 84 (77.1%) | 25 (22.9%) |
Housing Structures by Number of Rooms in Eden
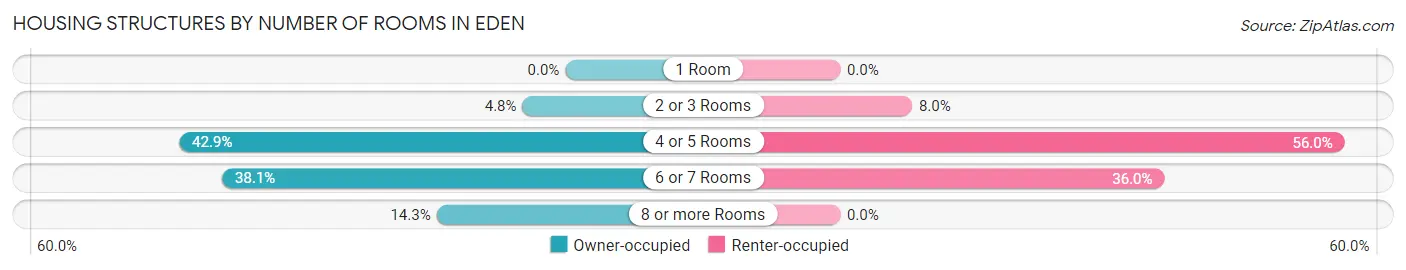
| Number of Rooms | Owner-occupied | Renter-occupied |
| 1 Room | 0 (0.0%) | 0 (0.0%) |
| 2 or 3 Rooms | 4 (4.8%) | 2 (8.0%) |
| 4 or 5 Rooms | 36 (42.9%) | 14 (56.0%) |
| 6 or 7 Rooms | 32 (38.1%) | 9 (36.0%) |
| 8 or more Rooms | 12 (14.3%) | 0 (0.0%) |
| Total | 84 (100.0%) | 25 (100.0%) |
Housing Structure by Heating Type in Eden
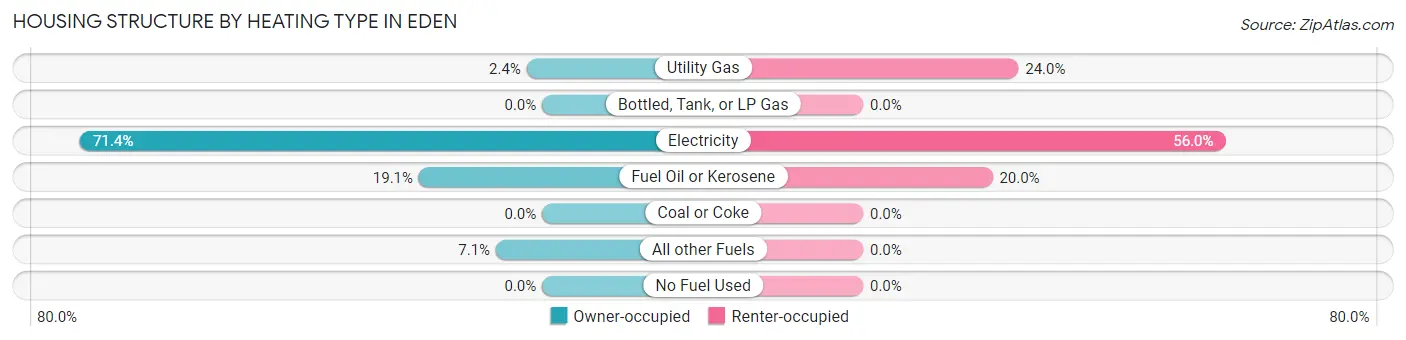
| Heating Type | Owner-occupied | Renter-occupied |
| Utility Gas | 2 (2.4%) | 6 (24.0%) |
| Bottled, Tank, or LP Gas | 0 (0.0%) | 0 (0.0%) |
| Electricity | 60 (71.4%) | 14 (56.0%) |
| Fuel Oil or Kerosene | 16 (19.1%) | 5 (20.0%) |
| Coal or Coke | 0 (0.0%) | 0 (0.0%) |
| All other Fuels | 6 (7.1%) | 0 (0.0%) |
| No Fuel Used | 0 (0.0%) | 0 (0.0%) |
| Total | 84 (100.0%) | 25 (100.0%) |
Household Vehicle Usage in Eden
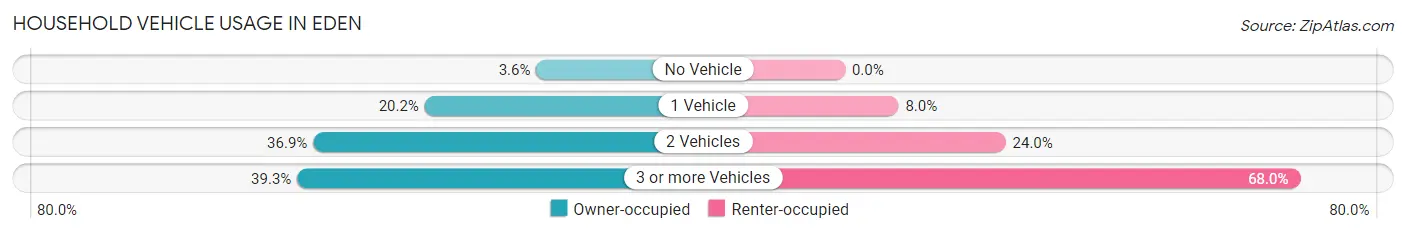
| Vehicles per Household | Owner-occupied | Renter-occupied |
| No Vehicle | 3 (3.6%) | 0 (0.0%) |
| 1 Vehicle | 17 (20.2%) | 2 (8.0%) |
| 2 Vehicles | 31 (36.9%) | 6 (24.0%) |
| 3 or more Vehicles | 33 (39.3%) | 17 (68.0%) |
| Total | 84 (100.0%) | 25 (100.0%) |
Real Estate & Mortgages in Eden
Real Estate and Mortgage Overview in Eden
| Characteristic | Without Mortgage | With Mortgage |
| Housing Units | 24 | 60 |
| Median Property Value | $158,300 | $129,200 |
| Median Household Income | $28,750 | $6 |
| Monthly Housing Costs | $338 | $0 |
| Real Estate Taxes | $571 | $5 |
Property Value by Mortgage Status in Eden
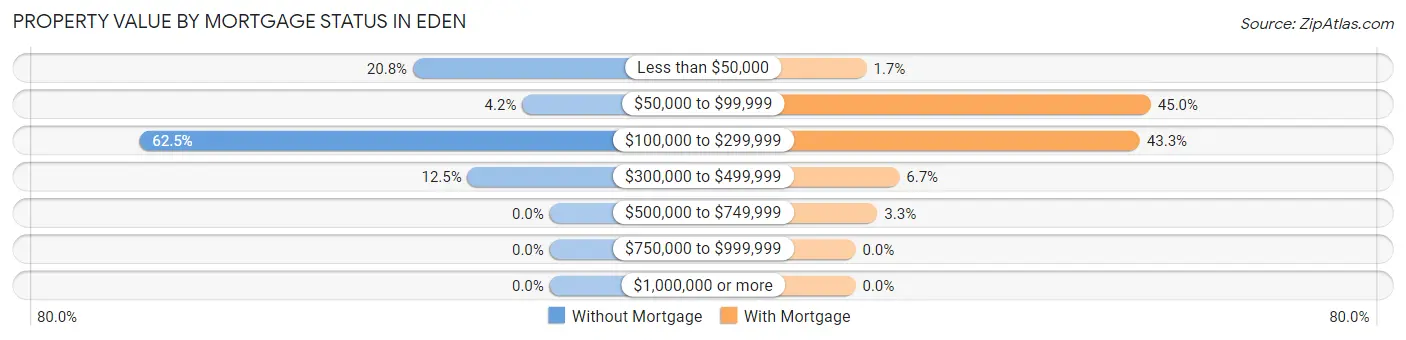
| Property Value | Without Mortgage | With Mortgage |
| Less than $50,000 | 5 (20.8%) | 1 (1.7%) |
| $50,000 to $99,999 | 1 (4.2%) | 27 (45.0%) |
| $100,000 to $299,999 | 15 (62.5%) | 26 (43.3%) |
| $300,000 to $499,999 | 3 (12.5%) | 4 (6.7%) |
| $500,000 to $749,999 | 0 (0.0%) | 2 (3.3%) |
| $750,000 to $999,999 | 0 (0.0%) | 0 (0.0%) |
| $1,000,000 or more | 0 (0.0%) | 0 (0.0%) |
| Total | 24 (100.0%) | 60 (100.0%) |
Household Income by Mortgage Status in Eden
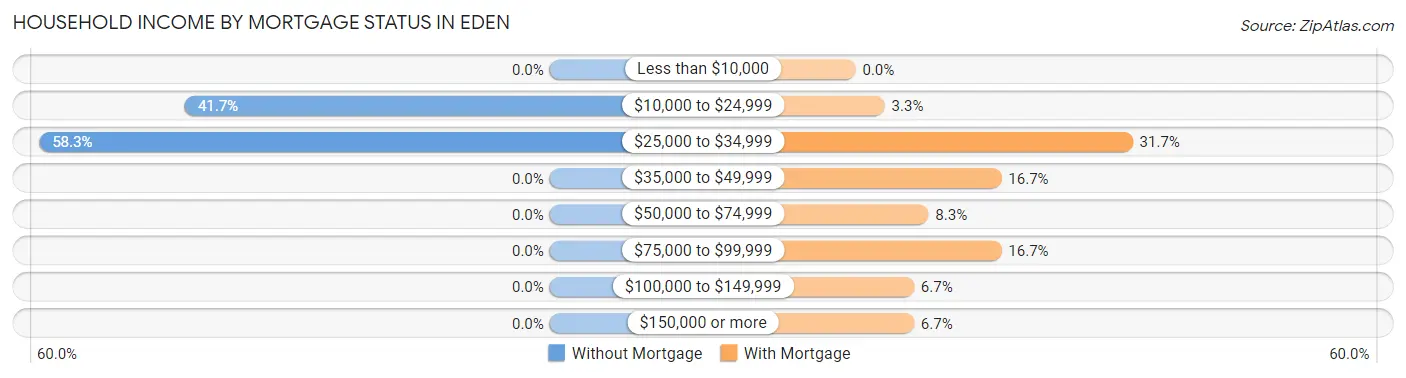
| Household Income | Without Mortgage | With Mortgage |
| Less than $10,000 | 0 (0.0%) | 0 (0.0%) |
| $10,000 to $24,999 | 10 (41.7%) | 2 (3.3%) |
| $25,000 to $34,999 | 14 (58.3%) | 19 (31.7%) |
| $35,000 to $49,999 | 0 (0.0%) | 10 (16.7%) |
| $50,000 to $74,999 | 0 (0.0%) | 5 (8.3%) |
| $75,000 to $99,999 | 0 (0.0%) | 10 (16.7%) |
| $100,000 to $149,999 | 0 (0.0%) | 4 (6.7%) |
| $150,000 or more | 0 (0.0%) | 4 (6.7%) |
| Total | 24 (100.0%) | 60 (100.0%) |
Property Value to Household Income Ratio in Eden
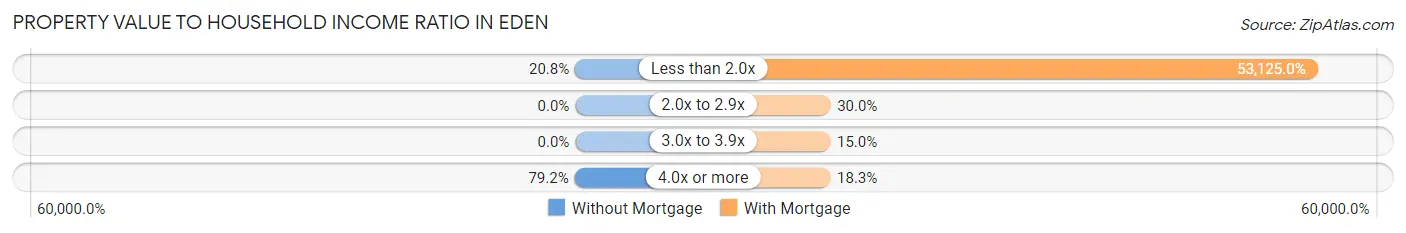
| Value-to-Income Ratio | Without Mortgage | With Mortgage |
| Less than 2.0x | 5 (20.8%) | 31,875 (53,125.0%) |
| 2.0x to 2.9x | 0 (0.0%) | 18 (30.0%) |
| 3.0x to 3.9x | 0 (0.0%) | 9 (15.0%) |
| 4.0x or more | 19 (79.2%) | 11 (18.3%) |
| Total | 24 (100.0%) | 60 (100.0%) |
Real Estate Taxes by Mortgage Status in Eden
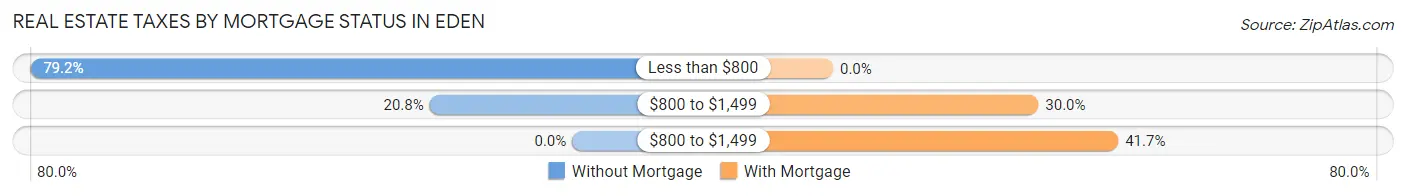
| Property Taxes | Without Mortgage | With Mortgage |
| Less than $800 | 19 (79.2%) | 0 (0.0%) |
| $800 to $1,499 | 5 (20.8%) | 18 (30.0%) |
| $800 to $1,499 | 0 (0.0%) | 25 (41.7%) |
| Total | 24 (100.0%) | 60 (100.0%) |
Health & Disability in Eden
Health Insurance Coverage by Age in Eden
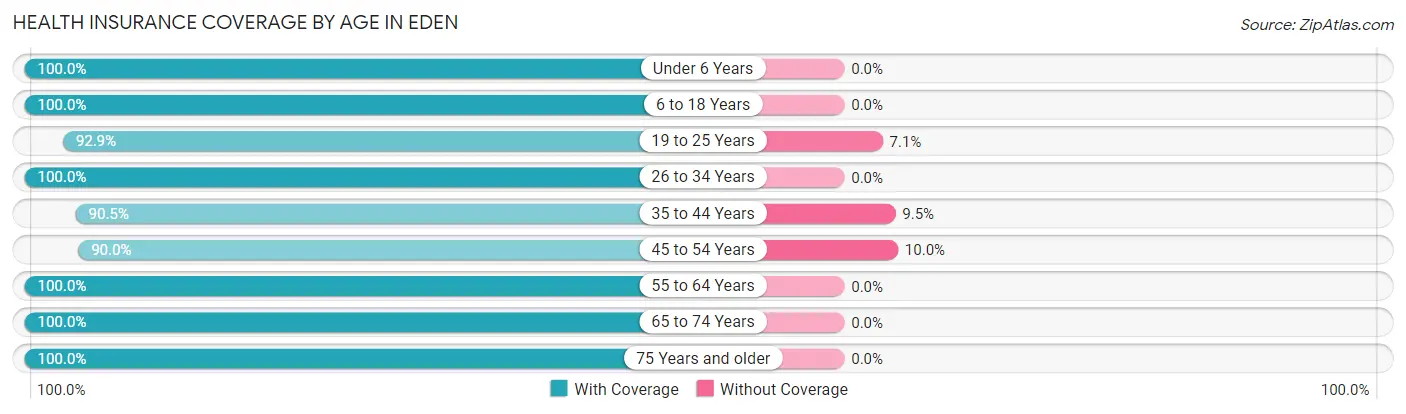
| Age Bracket | With Coverage | Without Coverage |
| Under 6 Years | 82 (100.0%) | 0 (0.0%) |
| 6 to 18 Years | 101 (100.0%) | 0 (0.0%) |
| 19 to 25 Years | 13 (92.9%) | 1 (7.1%) |
| 26 to 34 Years | 60 (100.0%) | 0 (0.0%) |
| 35 to 44 Years | 19 (90.5%) | 2 (9.5%) |
| 45 to 54 Years | 27 (90.0%) | 3 (10.0%) |
| 55 to 64 Years | 30 (100.0%) | 0 (0.0%) |
| 65 to 74 Years | 38 (100.0%) | 0 (0.0%) |
| 75 Years and older | 20 (100.0%) | 0 (0.0%) |
| Total | 390 (98.5%) | 6 (1.5%) |
Health Insurance Coverage by Citizenship Status in Eden
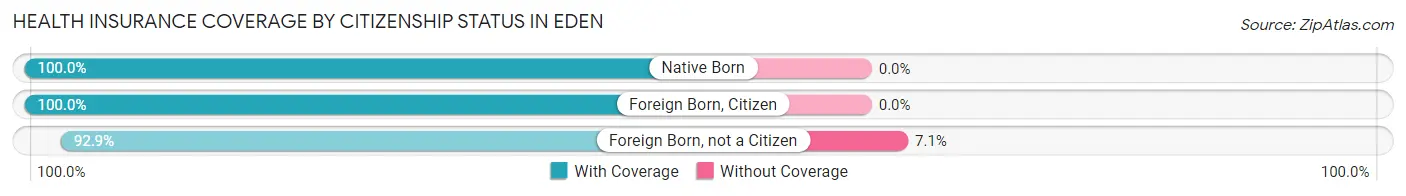
| Citizenship Status | With Coverage | Without Coverage |
| Native Born | 82 (100.0%) | 0 (0.0%) |
| Foreign Born, Citizen | 101 (100.0%) | 0 (0.0%) |
| Foreign Born, not a Citizen | 13 (92.9%) | 1 (7.1%) |
Health Insurance Coverage by Household Income in Eden
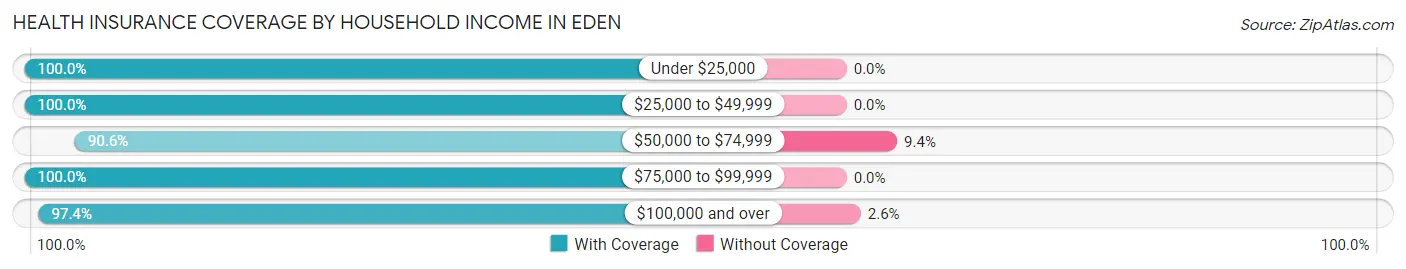
| Household Income | With Coverage | Without Coverage |
| Under $25,000 | 85 (100.0%) | 0 (0.0%) |
| $25,000 to $49,999 | 142 (100.0%) | 0 (0.0%) |
| $50,000 to $74,999 | 48 (90.6%) | 5 (9.4%) |
| $75,000 to $99,999 | 78 (100.0%) | 0 (0.0%) |
| $100,000 and over | 37 (97.4%) | 1 (2.6%) |
Public vs Private Health Insurance Coverage by Age in Eden
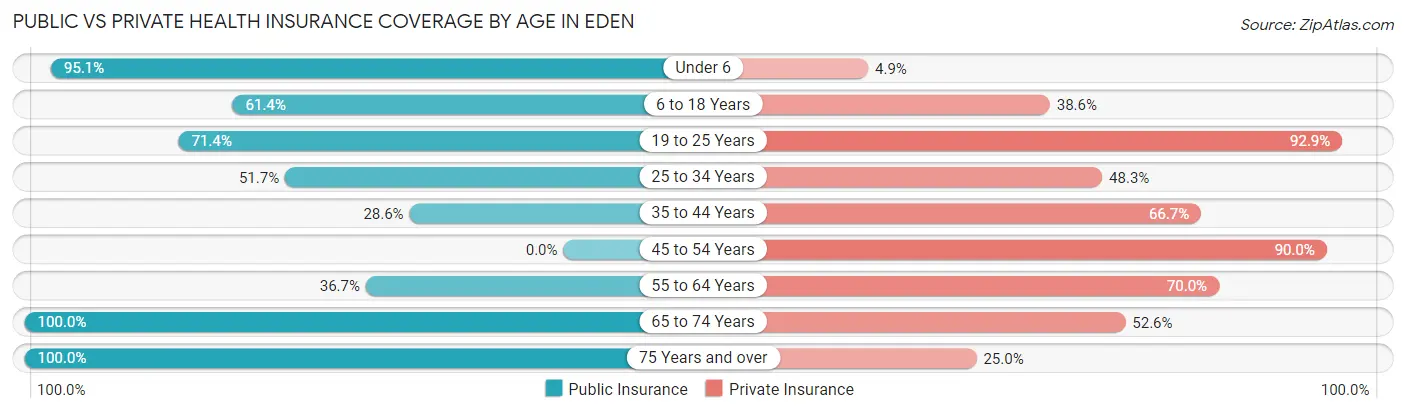
| Age Bracket | Public Insurance | Private Insurance |
| Under 6 | 78 (95.1%) | 4 (4.9%) |
| 6 to 18 Years | 62 (61.4%) | 39 (38.6%) |
| 19 to 25 Years | 10 (71.4%) | 13 (92.9%) |
| 25 to 34 Years | 31 (51.7%) | 29 (48.3%) |
| 35 to 44 Years | 6 (28.6%) | 14 (66.7%) |
| 45 to 54 Years | 0 (0.0%) | 27 (90.0%) |
| 55 to 64 Years | 11 (36.7%) | 21 (70.0%) |
| 65 to 74 Years | 38 (100.0%) | 20 (52.6%) |
| 75 Years and over | 20 (100.0%) | 5 (25.0%) |
| Total | 256 (64.6%) | 172 (43.4%) |
Disability Status by Sex by Age in Eden
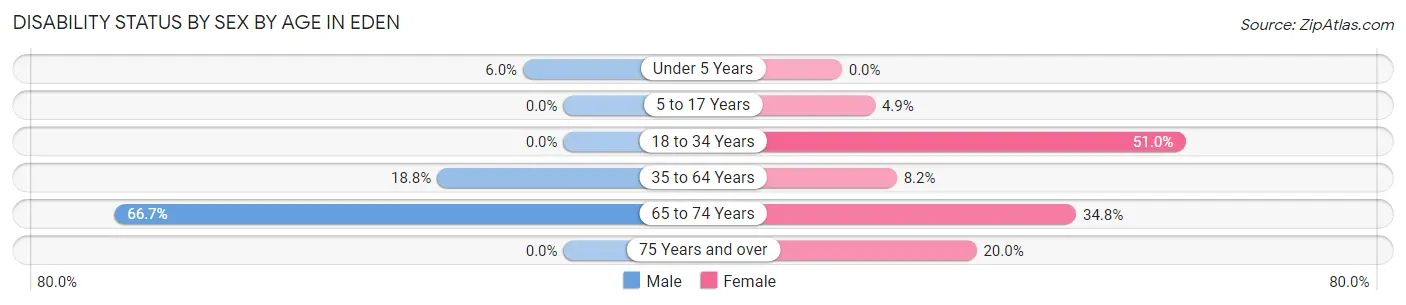
| Age Bracket | Male | Female |
| Under 5 Years | 3 (6.0%) | 0 (0.0%) |
| 5 to 17 Years | 0 (0.0%) | 3 (4.9%) |
| 18 to 34 Years | 0 (0.0%) | 26 (51.0%) |
| 35 to 64 Years | 6 (18.8%) | 4 (8.2%) |
| 65 to 74 Years | 10 (66.7%) | 8 (34.8%) |
| 75 Years and over | 0 (0.0%) | 3 (20.0%) |
Disability Class by Sex by Age in Eden
Disability Class: Hearing Difficulty
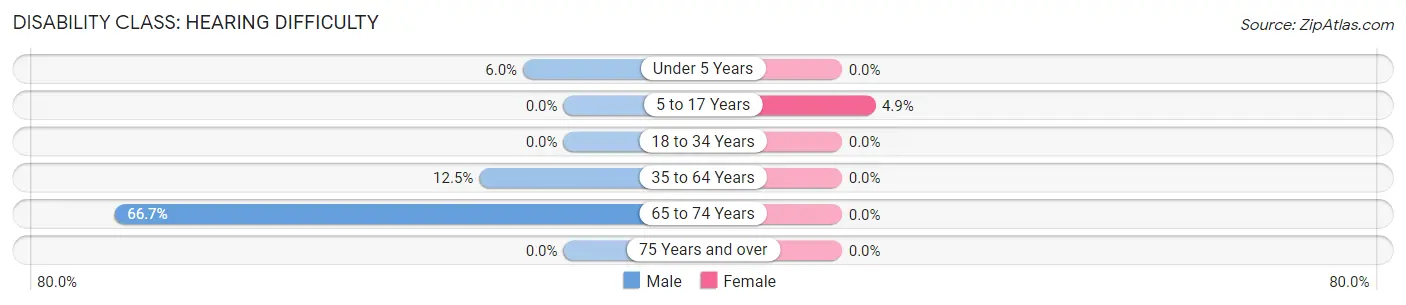
| Age Bracket | Male | Female |
| Under 5 Years | 3 (6.0%) | 0 (0.0%) |
| 5 to 17 Years | 0 (0.0%) | 3 (4.9%) |
| 18 to 34 Years | 0 (0.0%) | 0 (0.0%) |
| 35 to 64 Years | 4 (12.5%) | 0 (0.0%) |
| 65 to 74 Years | 10 (66.7%) | 0 (0.0%) |
| 75 Years and over | 0 (0.0%) | 0 (0.0%) |
Disability Class: Vision Difficulty
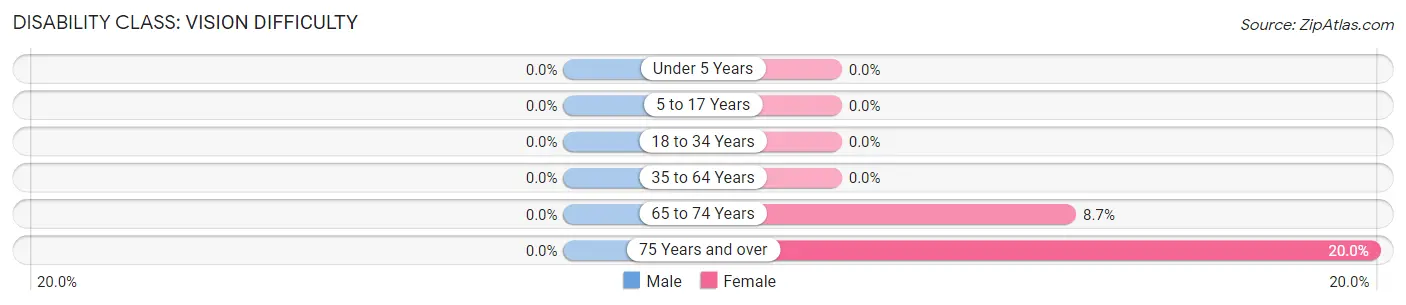
| Age Bracket | Male | Female |
| Under 5 Years | 0 (0.0%) | 0 (0.0%) |
| 5 to 17 Years | 0 (0.0%) | 0 (0.0%) |
| 18 to 34 Years | 0 (0.0%) | 0 (0.0%) |
| 35 to 64 Years | 0 (0.0%) | 0 (0.0%) |
| 65 to 74 Years | 0 (0.0%) | 2 (8.7%) |
| 75 Years and over | 0 (0.0%) | 3 (20.0%) |
Disability Class: Cognitive Difficulty
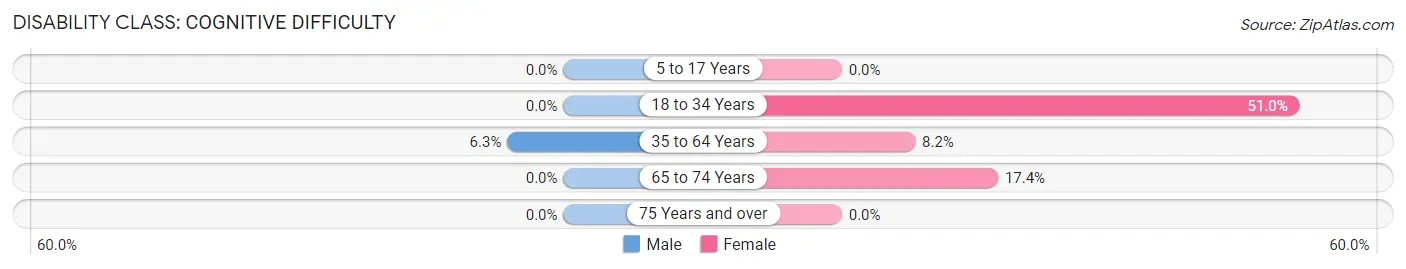
| Age Bracket | Male | Female |
| 5 to 17 Years | 0 (0.0%) | 0 (0.0%) |
| 18 to 34 Years | 0 (0.0%) | 26 (51.0%) |
| 35 to 64 Years | 2 (6.2%) | 4 (8.2%) |
| 65 to 74 Years | 0 (0.0%) | 4 (17.4%) |
| 75 Years and over | 0 (0.0%) | 0 (0.0%) |
Disability Class: Ambulatory Difficulty
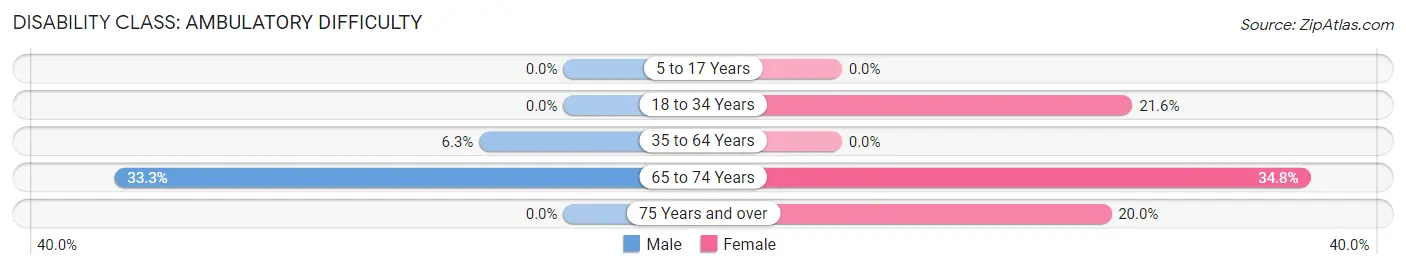
| Age Bracket | Male | Female |
| 5 to 17 Years | 0 (0.0%) | 0 (0.0%) |
| 18 to 34 Years | 0 (0.0%) | 11 (21.6%) |
| 35 to 64 Years | 2 (6.2%) | 0 (0.0%) |
| 65 to 74 Years | 5 (33.3%) | 8 (34.8%) |
| 75 Years and over | 0 (0.0%) | 3 (20.0%) |
Disability Class: Self-Care Difficulty
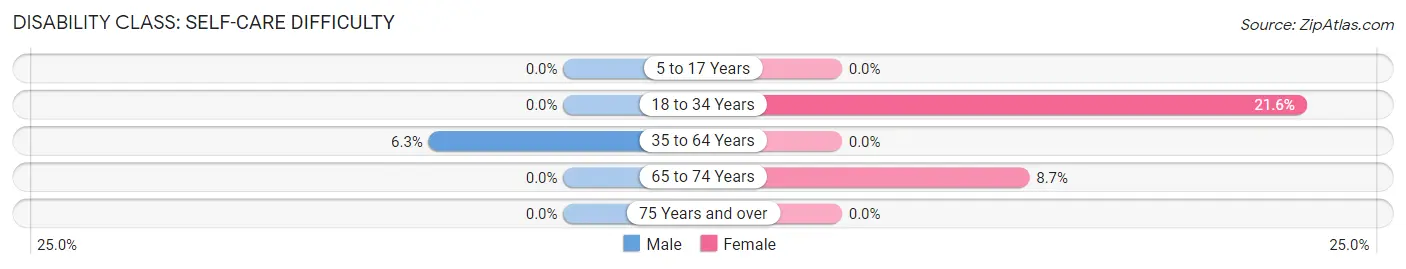
| Age Bracket | Male | Female |
| 5 to 17 Years | 0 (0.0%) | 0 (0.0%) |
| 18 to 34 Years | 0 (0.0%) | 11 (21.6%) |
| 35 to 64 Years | 2 (6.2%) | 0 (0.0%) |
| 65 to 74 Years | 0 (0.0%) | 2 (8.7%) |
| 75 Years and over | 0 (0.0%) | 0 (0.0%) |
Technology Access in Eden
Computing Device Access in Eden
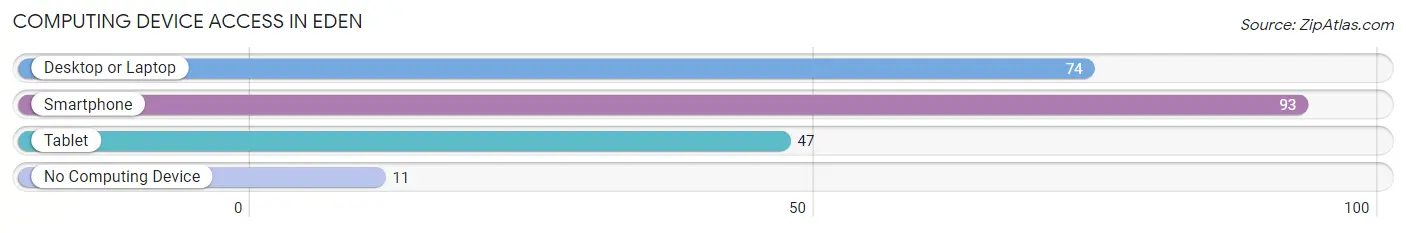
| Device Type | # Households | % Households |
| Desktop or Laptop | 74 | 67.9% |
| Smartphone | 93 | 85.3% |
| Tablet | 47 | 43.1% |
| No Computing Device | 11 | 10.1% |
| Total | 109 | 100.0% |
Internet Access in Eden
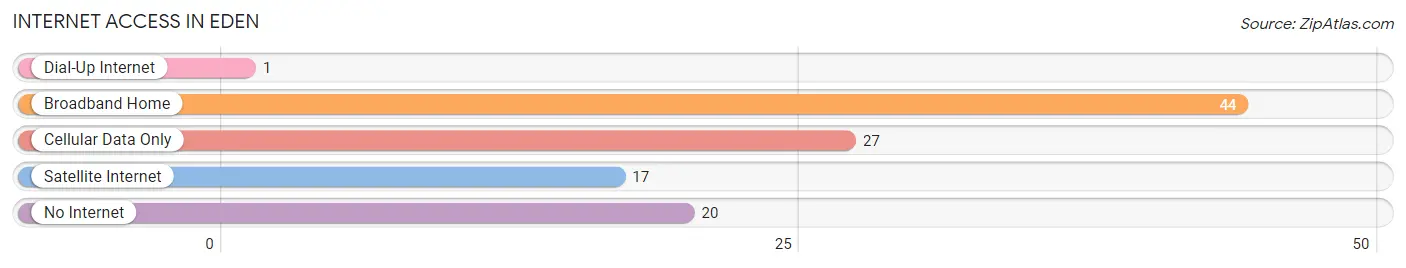
| Internet Type | # Households | % Households |
| Dial-Up Internet | 1 | 0.9% |
| Broadband Home | 44 | 40.4% |
| Cellular Data Only | 27 | 24.8% |
| Satellite Internet | 17 | 15.6% |
| No Internet | 20 | 18.3% |
| Total | 109 | 100.0% |
Eden Summary
Eden, Idaho is a small city located in Bonneville County in the southeastern part of the state. It is situated on the Snake River, just north of Idaho Falls. The city has a population of approximately 4,000 people and is part of the Idaho Falls Metropolitan Statistical Area.
History
The area that is now Eden was first settled in the late 1800s by Mormon pioneers. The city was originally known as “Edenville” and was incorporated in 1902. The name was changed to Eden in 1910.
The city was originally an agricultural community, with many of the early settlers growing potatoes and other crops. In the early 1900s, the city began to grow as a railroad hub, with the Union Pacific Railroad running through the city.
In the 1950s, the city began to experience a population boom as the nearby Idaho National Laboratory (INL) was established. The INL is a nuclear research facility and is the largest employer in the area.
Geography
Eden is located in the Snake River Plain, a large area of flat land in the southeastern part of the state. The city is situated on the Snake River, just north of Idaho Falls. The city is surrounded by farmland and is located near the foothills of the Rocky Mountains.
The climate in Eden is semi-arid, with hot summers and cold winters. The average annual temperature is around 50 degrees Fahrenheit.
Economy
The economy of Eden is largely based on agriculture and the Idaho National Laboratory. The city is home to several large potato farms, as well as other agricultural operations.
The INL is the largest employer in the area, providing jobs for over 5,000 people. The facility is a major research center for nuclear energy and is responsible for the development of several nuclear power plants in the region.
Demographics
As of the 2010 census, the population of Eden was 4,092. The racial makeup of the city was 95.3% White, 0.7% African American, 0.4% Native American, 0.7% Asian, 0.1% Pacific Islander, and 2.8% from other races. Hispanic or Latino of any race were 4.2% of the population.
The median household income in Eden was $45,938, and the median family income was $51,938. The per capita income was $20,938. About 8.3% of families and 10.2% of the population were below the poverty line.
Eden is a small city with a rich history and a diverse population. The city is home to a large agricultural industry and the Idaho National Laboratory, providing jobs and economic stability to the area. The city is also a popular tourist destination, with its proximity to the Snake River and the Rocky Mountains.
Common Questions
What is the Total Population of Eden?
Total Population of Eden is 396.
What is the Total Male Population of Eden?
Total Male Population of Eden is 178.
What is the Total Female Population of Eden?
Total Female Population of Eden is 218.
What is the Ratio of Males per 100 Females in Eden?
There are 81.65 Males per 100 Females in Eden.
What is the Ratio of Females per 100 Males in Eden?
There are 122.47 Females per 100 Males in Eden.
What is the Median Population Age in Eden?
Median Population Age in Eden is 28.1 Years.
What is the Average Family Size in Eden
Average Family Size in Eden is 4.8 People.
What is the Average Household Size in Eden
Average Household Size in Eden is 3.6 People.
What is Per Capita Income in Eden?
Per Capita income in Eden is $13,729.
What is the Median Family Income in Eden?
Median Family Income in Eden is $34,722.
What is the Median Household income in Eden?
Median Household Income in Eden is $32,125.
What is Income or Wage Gap in Eden?
Income or Wage Gap in Eden is 41.5%.
Women in Eden earn 58.5 cents for every dollar earned by a man.
What is Inequality or Gini Index in Eden?
Inequality or Gini Index in Eden is 0.42.
How Large is the Labor Force in Eden?
There are 133 People in the Labor Forcein in Eden.
What is the Percentage of People in the Labor Force in Eden?
57.8% of People are in the Labor Force in Eden.
What is the Unemployment Rate in Eden?
Unemployment Rate in Eden is 4.5%.