Honokaa, HI
Honokaa Map
Honokaa Overview
2,290
TOTAL POPULATION
1,139
MALE POPULATION
1,151
FEMALE POPULATION
98.96
MALES / 100 FEMALES
101.05
FEMALES / 100 MALES
40.8
MEDIAN AGE
3.8
AVG FAMILY SIZE
3.2
AVG HOUSEHOLD SIZE
$28,258
PER CAPITA INCOME
$87,500
AVG FAMILY INCOME
$70,819
AVG HOUSEHOLD INCOME
34.4%
WAGE / INCOME GAP [ % ]
65.6¢/ $1
WAGE / INCOME GAP [ $ ]
0.42
INEQUALITY / GINI INDEX
1,103
LABOR FORCE [ PEOPLE ]
61.1%
PERCENT IN LABOR FORCE
4.7%
UNEMPLOYMENT RATE
Honokaa Zip Codes
Honokaa Area Codes
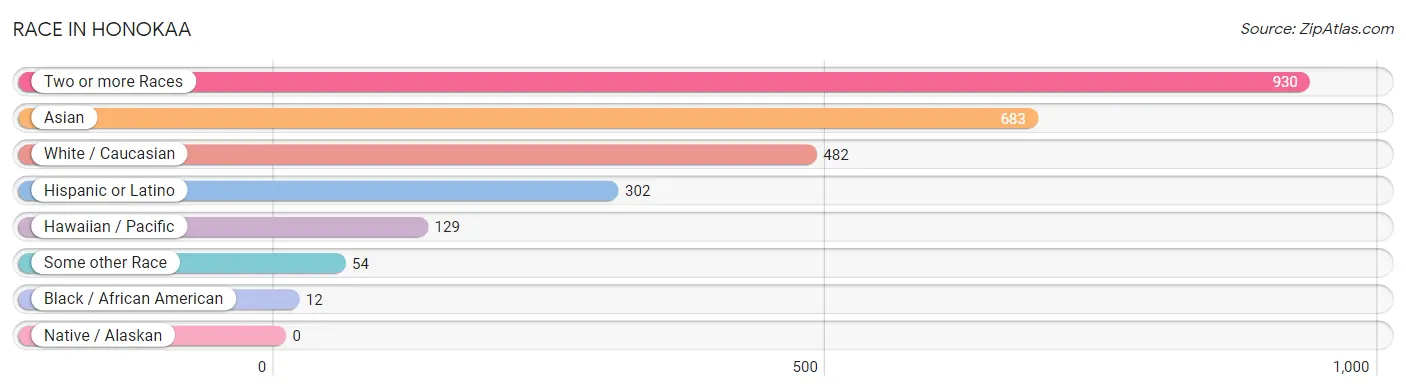
Race in Honokaa
The most populous races in Honokaa are Two or more Races (930 | 40.6%), Asian (683 | 29.8%), and White / Caucasian (482 | 21.0%).
| Race | # Population | % Population |
| Asian | 683 | 29.8% |
| Black / African American | 12 | 0.5% |
| Hawaiian / Pacific | 129 | 5.6% |
| Hispanic or Latino | 302 | 13.2% |
| Native / Alaskan | 0 | 0.0% |
| White / Caucasian | 482 | 21.0% |
| Two or more Races | 930 | 40.6% |
| Some other Race | 54 | 2.4% |
| Total | 2,290 | 100.0% |
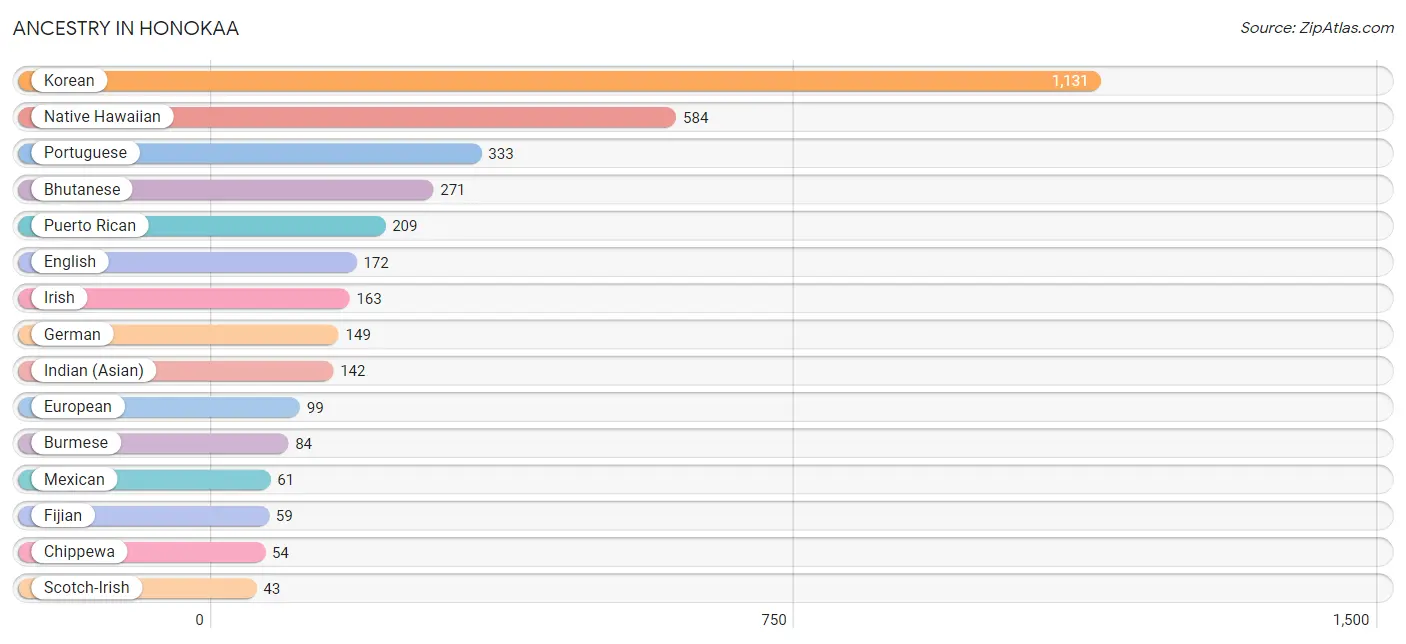
Ancestry in Honokaa
The most populous ancestries reported in Honokaa are Korean (1,131 | 49.4%), Native Hawaiian (584 | 25.5%), Portuguese (333 | 14.5%), Bhutanese (271 | 11.8%), and Puerto Rican (209 | 9.1%), together accounting for 110.4% of all Honokaa residents.
| Ancestry | # Population | % Population |
| African | 12 | 0.5% |
| American | 36 | 1.6% |
| Arab | 12 | 0.5% |
| Bhutanese | 271 | 11.8% |
| Burmese | 84 | 3.7% |
| Cherokee | 9 | 0.4% |
| Chinese | 17 | 0.7% |
| Chippewa | 54 | 2.4% |
| Creek | 9 | 0.4% |
| Croatian | 17 | 0.7% |
| Dutch | 19 | 0.8% |
| Eastern European | 19 | 0.8% |
| English | 172 | 7.5% |
| European | 99 | 4.3% |
| Fijian | 59 | 2.6% |
| French | 4 | 0.2% |
| German | 149 | 6.5% |
| Indian (Asian) | 142 | 6.2% |
| Irish | 163 | 7.1% |
| Italian | 4 | 0.2% |
| Korean | 1,131 | 49.4% |
| Laotian | 21 | 0.9% |
| Mexican | 61 | 2.7% |
| Moroccan | 12 | 0.5% |
| Native Hawaiian | 584 | 25.5% |
| Paiute | 37 | 1.6% |
| Pakistani | 23 | 1.0% |
| Portuguese | 333 | 14.5% |
| Pueblo | 9 | 0.4% |
| Puerto Rican | 209 | 9.1% |
| Romanian | 6 | 0.3% |
| Russian | 27 | 1.2% |
| Samoan | 41 | 1.8% |
| Scotch-Irish | 43 | 1.9% |
| Scottish | 35 | 1.5% |
| Spanish | 32 | 1.4% |
| Subsaharan African | 12 | 0.5% |
| Welsh | 25 | 1.1% | View All 38 Rows |
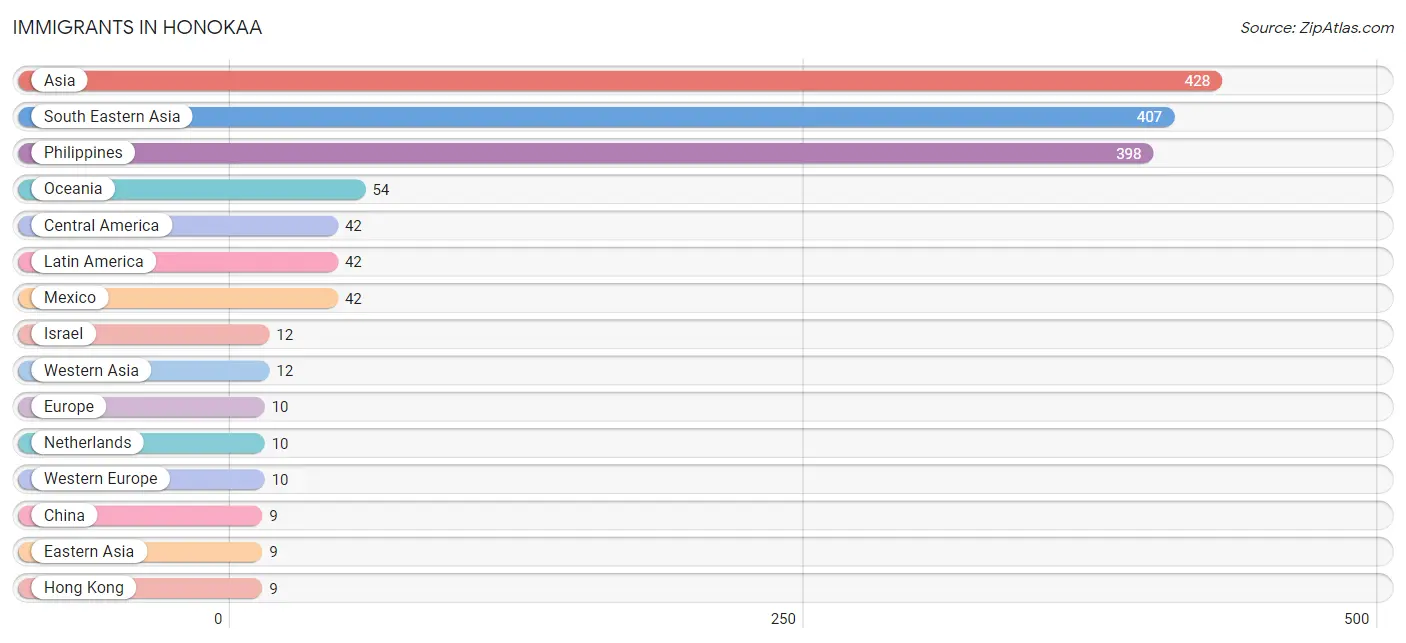
Immigrants in Honokaa
The most numerous immigrant groups reported in Honokaa came from Asia (428 | 18.7%), South Eastern Asia (407 | 17.8%), Philippines (398 | 17.4%), Oceania (54 | 2.4%), and Central America (42 | 1.8%), together accounting for 58.0% of all Honokaa residents.
| Immigration Origin | # Population | % Population |
| Africa | 4 | 0.2% |
| Asia | 428 | 18.7% |
| Canada | 6 | 0.3% |
| Central America | 42 | 1.8% |
| China | 9 | 0.4% |
| Eastern Asia | 9 | 0.4% |
| Europe | 10 | 0.4% |
| Hong Kong | 9 | 0.4% |
| Israel | 12 | 0.5% |
| Latin America | 42 | 1.8% |
| Mexico | 42 | 1.8% |
| Netherlands | 10 | 0.4% |
| Northern Africa | 4 | 0.2% |
| Oceania | 54 | 2.4% |
| Philippines | 398 | 17.4% |
| South Eastern Asia | 407 | 17.8% |
| Thailand | 9 | 0.4% |
| Western Asia | 12 | 0.5% |
| Western Europe | 10 | 0.4% | View All 19 Rows |
Sex and Age in Honokaa
Sex and Age in Honokaa
The most populous age groups in Honokaa are 5 to 9 Years (119 | 10.4%) for men and 45 to 49 Years (105 | 9.1%) for women.
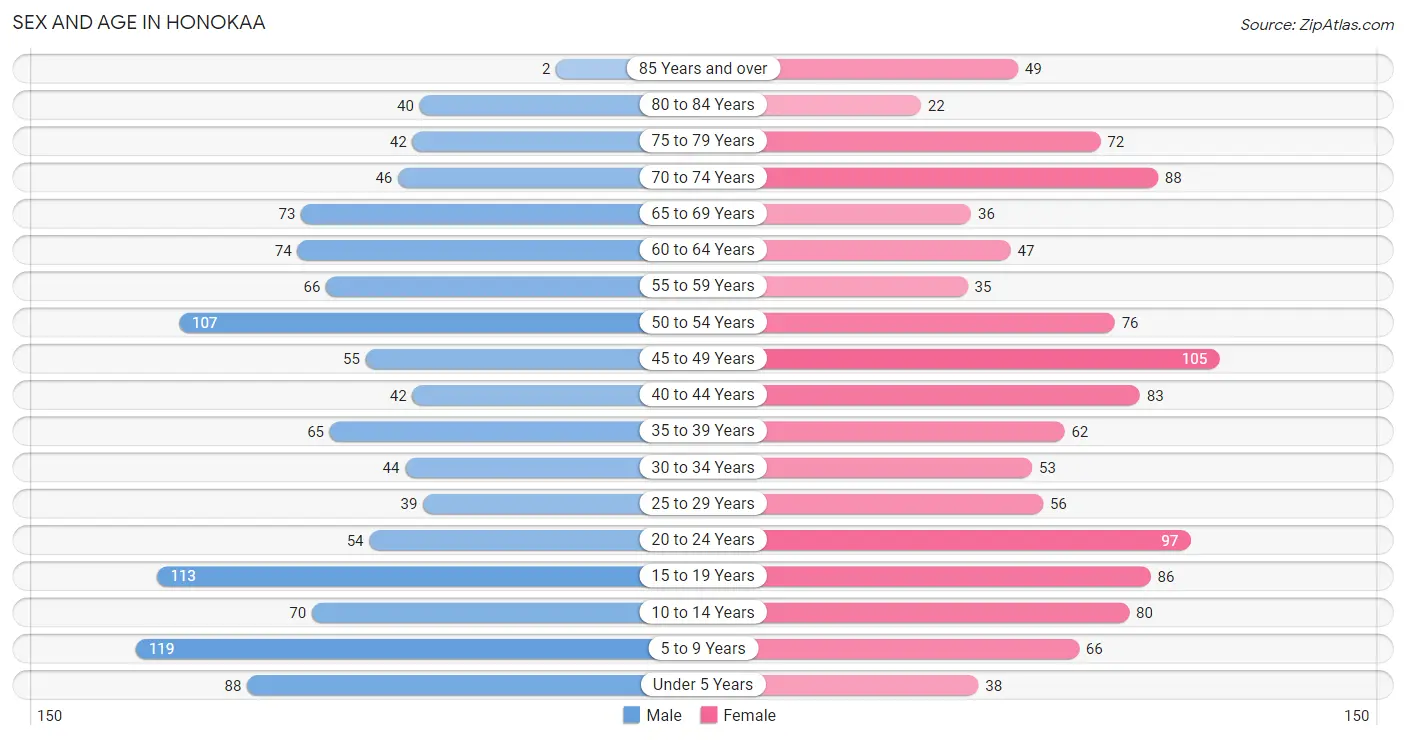
| Age Bracket | Male | Female |
| Under 5 Years | 88 (7.7%) | 38 (3.3%) |
| 5 to 9 Years | 119 (10.4%) | 66 (5.7%) |
| 10 to 14 Years | 70 (6.1%) | 80 (7.0%) |
| 15 to 19 Years | 113 (9.9%) | 86 (7.5%) |
| 20 to 24 Years | 54 (4.7%) | 97 (8.4%) |
| 25 to 29 Years | 39 (3.4%) | 56 (4.9%) |
| 30 to 34 Years | 44 (3.9%) | 53 (4.6%) |
| 35 to 39 Years | 65 (5.7%) | 62 (5.4%) |
| 40 to 44 Years | 42 (3.7%) | 83 (7.2%) |
| 45 to 49 Years | 55 (4.8%) | 105 (9.1%) |
| 50 to 54 Years | 107 (9.4%) | 76 (6.6%) |
| 55 to 59 Years | 66 (5.8%) | 35 (3.0%) |
| 60 to 64 Years | 74 (6.5%) | 47 (4.1%) |
| 65 to 69 Years | 73 (6.4%) | 36 (3.1%) |
| 70 to 74 Years | 46 (4.0%) | 88 (7.6%) |
| 75 to 79 Years | 42 (3.7%) | 72 (6.3%) |
| 80 to 84 Years | 40 (3.5%) | 22 (1.9%) |
| 85 Years and over | 2 (0.2%) | 49 (4.3%) |
| Total | 1,139 (100.0%) | 1,151 (100.0%) |
Families and Households in Honokaa
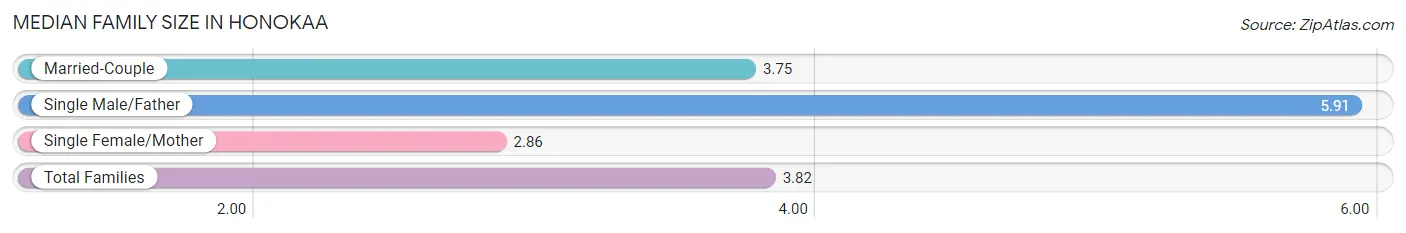
Median Family Size in Honokaa
The median family size in Honokaa is 3.82 persons per family, with single male/father families (64 | 12.9%) accounting for the largest median family size of 5.91 persons per family. On the other hand, single female/mother families (116 | 23.3%) represent the smallest median family size with 2.86 persons per family.
| Family Type | # Families | Family Size |
| Married-Couple | 318 (63.9%) | 3.75 |
| Single Male/Father | 64 (12.9%) | 5.91 |
| Single Female/Mother | 116 (23.3%) | 2.86 |
| Total Families | 498 (100.0%) | 3.82 |
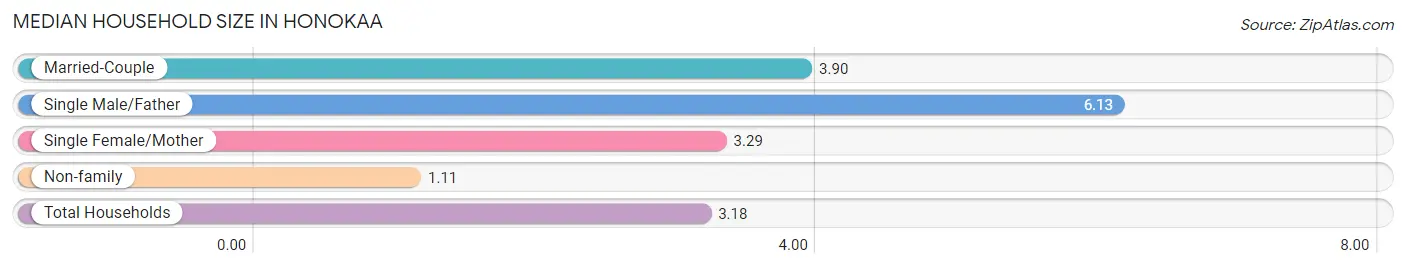
Median Household Size in Honokaa
The median household size in Honokaa is 3.18 persons per household, with single male/father households (64 | 9.1%) accounting for the largest median household size of 6.13 persons per household. non-family households (207 | 29.4%) represent the smallest median household size with 1.11 persons per household.
| Household Type | # Households | Household Size |
| Married-Couple | 318 (45.1%) | 3.90 |
| Single Male/Father | 64 (9.1%) | 6.13 |
| Single Female/Mother | 116 (16.5%) | 3.29 |
| Non-family | 207 (29.4%) | 1.11 |
| Total Households | 705 (100.0%) | 3.18 |
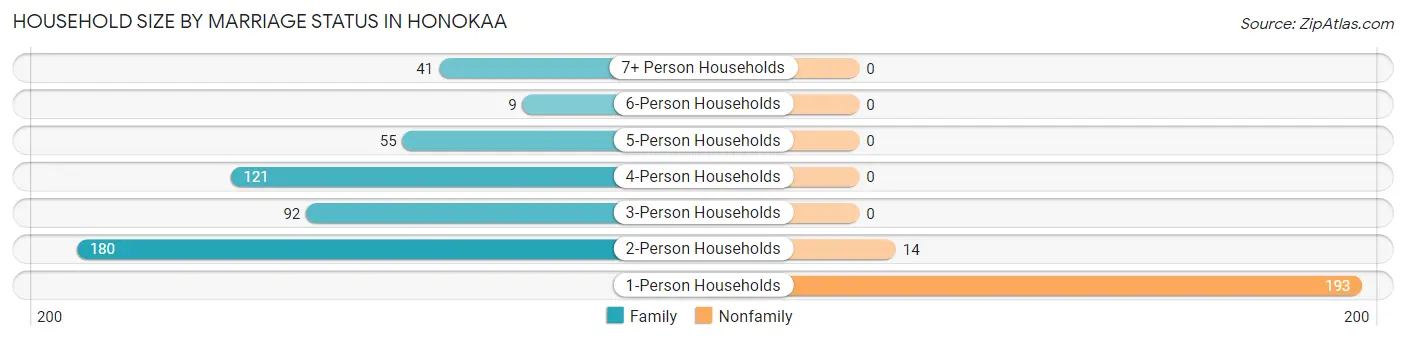
Household Size by Marriage Status in Honokaa
Out of a total of 705 households in Honokaa, 498 (70.6%) are family households, while 207 (29.4%) are nonfamily households. The most numerous type of family households are 2-person households, comprising 180, and the most common type of nonfamily households are 1-person households, comprising 193.
| Household Size | Family Households | Nonfamily Households |
| 1-Person Households | - | 193 (27.4%) |
| 2-Person Households | 180 (25.5%) | 14 (2.0%) |
| 3-Person Households | 92 (13.1%) | 0 (0.0%) |
| 4-Person Households | 121 (17.2%) | 0 (0.0%) |
| 5-Person Households | 55 (7.8%) | 0 (0.0%) |
| 6-Person Households | 9 (1.3%) | 0 (0.0%) |
| 7+ Person Households | 41 (5.8%) | 0 (0.0%) |
| Total | 498 (70.6%) | 207 (29.4%) |
Female Fertility in Honokaa
Fertility by Age in Honokaa
Average fertility rate in Honokaa is 22.0 births per 1,000 women. Women in the age bracket of 20 to 34 years have the highest fertility rate with 58.0 births per 1,000 women. Women in the age bracket of 20 to 34 years acount for 100.0% of all women with births.
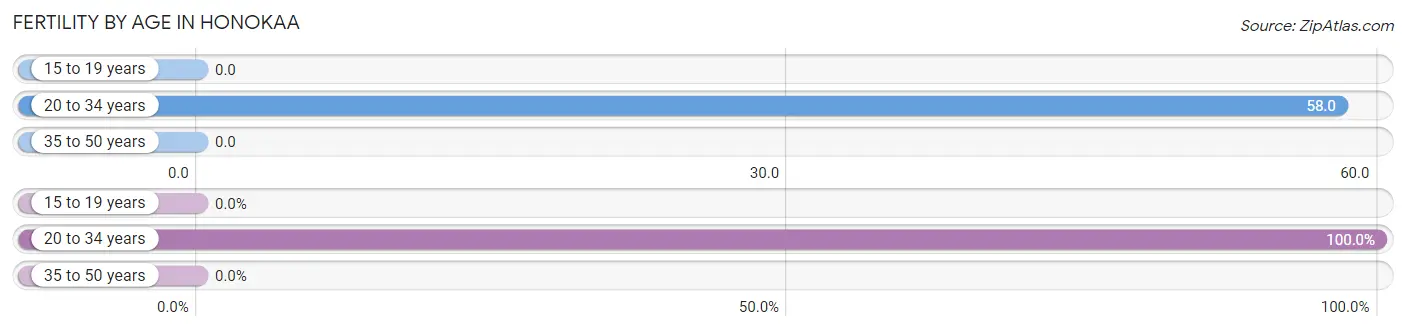
| Age Bracket | Women with Births | Births / 1,000 Women |
| 15 to 19 years | 0 (0.0%) | 0.0 |
| 20 to 34 years | 12 (100.0%) | 58.0 |
| 35 to 50 years | 0 (0.0%) | 0.0 |
| Total | 12 (100.0%) | 22.0 |
Fertility by Age by Marriage Status in Honokaa
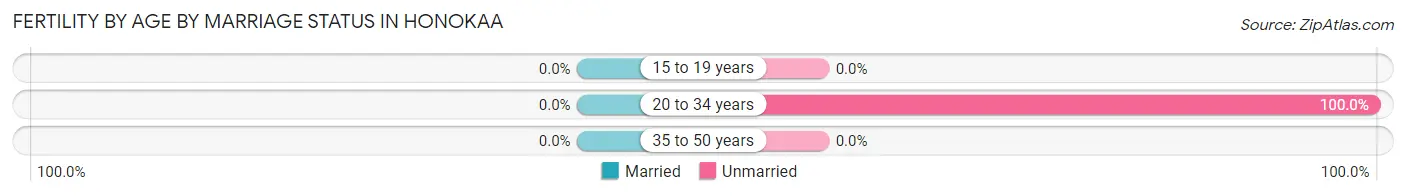
| Age Bracket | Married | Unmarried |
| 15 to 19 years | 0 (0.0%) | 0 (0.0%) |
| 20 to 34 years | 0 (0.0%) | 12 (100.0%) |
| 35 to 50 years | 0 (0.0%) | 0 (0.0%) |
| Total | 0 (0.0%) | 12 (100.0%) |
Fertility by Education in Honokaa
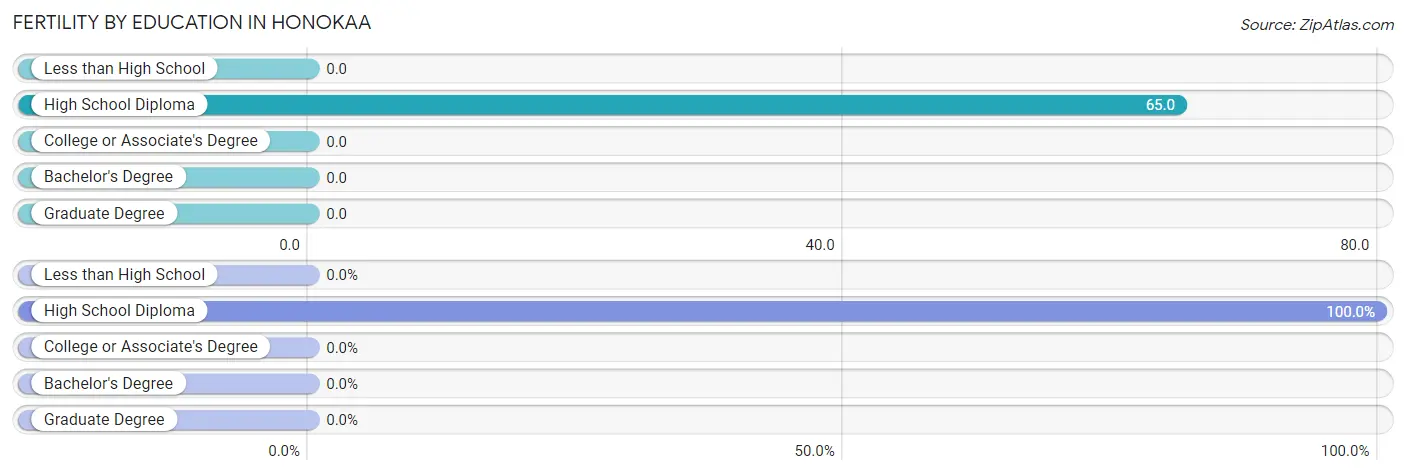
| Educational Attainment | Women with Births | Births / 1,000 Women |
| Less than High School | 0 (0.0%) | 0.0 |
| High School Diploma | 12 (100.0%) | 65.0 |
| College or Associate's Degree | 0 (0.0%) | 0.0 |
| Bachelor's Degree | 0 (0.0%) | 0.0 |
| Graduate Degree | 0 (0.0%) | 0.0 |
| Total | 12 (100.0%) | 22.0 |
Fertility by Education by Marriage Status in Honokaa
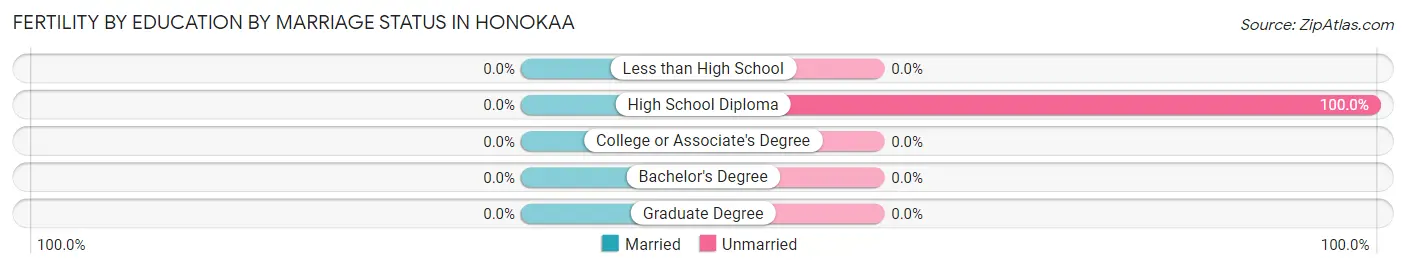
| Educational Attainment | Married | Unmarried |
| Less than High School | 0 (0.0%) | 0 (0.0%) |
| High School Diploma | 0 (0.0%) | 12 (100.0%) |
| College or Associate's Degree | 0 (0.0%) | 0 (0.0%) |
| Bachelor's Degree | 0 (0.0%) | 0 (0.0%) |
| Graduate Degree | 0 (0.0%) | 0 (0.0%) |
| Total | 0 (0.0%) | 12 (100.0%) |
Income in Honokaa
Income Overview in Honokaa
Per Capita Income in Honokaa is $28,258, while median incomes of families and households are $87,500 and $70,819 respectively.
| Characteristic | Number | Measure |
| Per Capita Income | 2,290 | $28,258 |
| Median Family Income | 498 | $87,500 |
| Mean Family Income | 498 | $98,258 |
| Median Household Income | 705 | $70,819 |
| Mean Household Income | 705 | $83,986 |
| Income Deficit | 498 | $0 |
| Wage / Income Gap (%) | 2,290 | 34.44% |
| Wage / Income Gap ($) | 2,290 | 65.56¢ per $1 |
| Gini / Inequality Index | 2,290 | 0.42 |
Earnings by Sex in Honokaa
Average Earnings in Honokaa are $34,555, $48,750 for men and $31,960 for women, a difference of 34.4%.
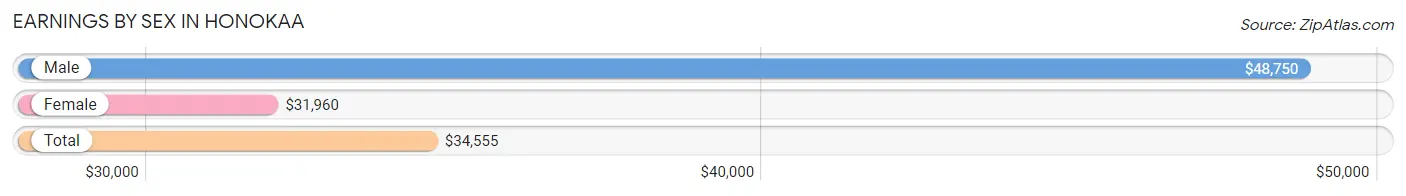
| Sex | Number | Average Earnings |
| Male | 552 (50.2%) | $48,750 |
| Female | 547 (49.8%) | $31,960 |
| Total | 1,099 (100.0%) | $34,555 |
Earnings by Sex by Income Bracket in Honokaa
The most common earnings brackets in Honokaa are $75,000 to $99,999 for men (71 | 12.9%) and $30,000 to $34,999 for women (134 | 24.5%).
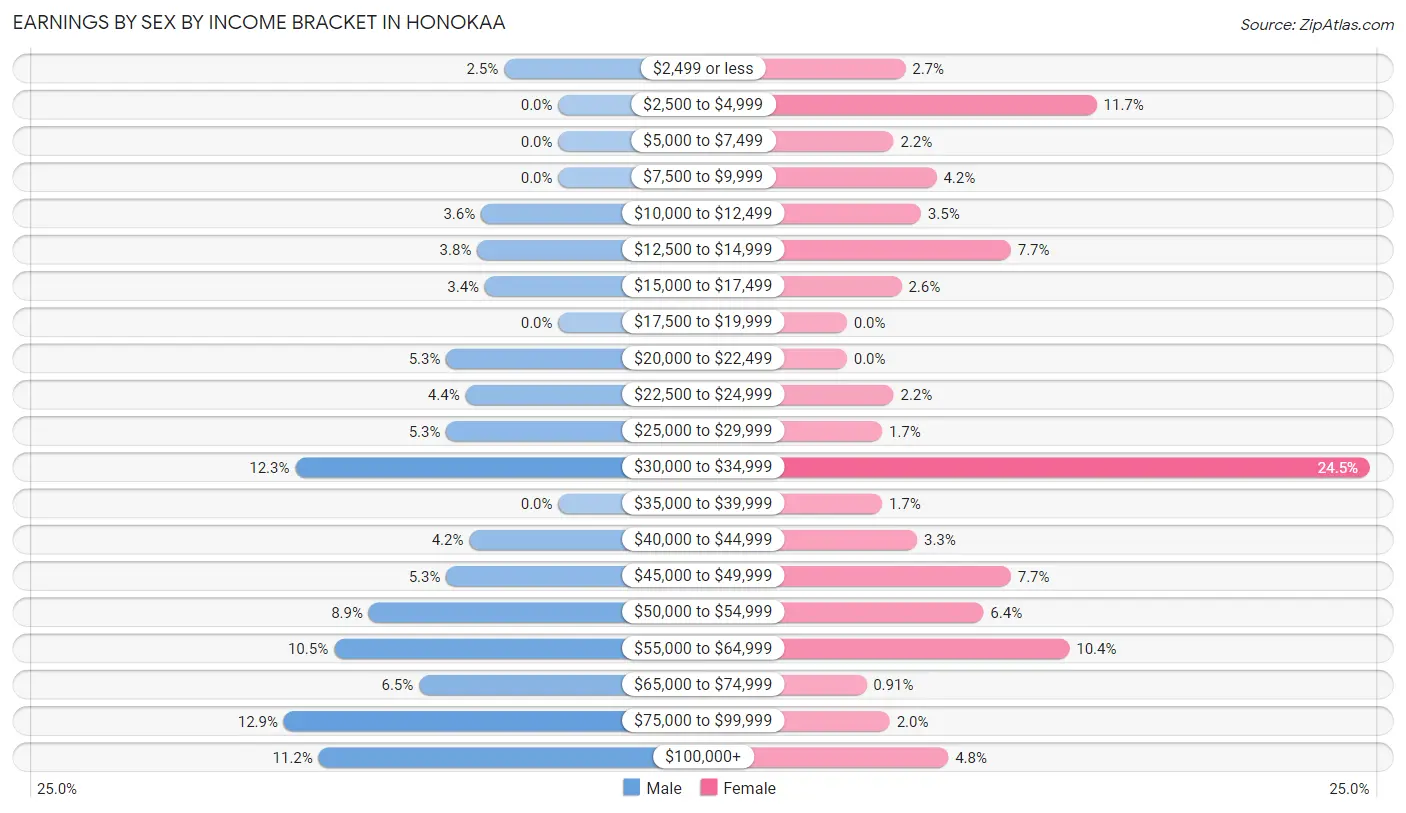
| Income | Male | Female |
| $2,499 or less | 14 (2.5%) | 15 (2.7%) |
| $2,500 to $4,999 | 0 (0.0%) | 64 (11.7%) |
| $5,000 to $7,499 | 0 (0.0%) | 12 (2.2%) |
| $7,500 to $9,999 | 0 (0.0%) | 23 (4.2%) |
| $10,000 to $12,499 | 20 (3.6%) | 19 (3.5%) |
| $12,500 to $14,999 | 21 (3.8%) | 42 (7.7%) |
| $15,000 to $17,499 | 19 (3.4%) | 14 (2.6%) |
| $17,500 to $19,999 | 0 (0.0%) | 0 (0.0%) |
| $20,000 to $22,499 | 29 (5.2%) | 0 (0.0%) |
| $22,500 to $24,999 | 24 (4.3%) | 12 (2.2%) |
| $25,000 to $29,999 | 29 (5.2%) | 9 (1.7%) |
| $30,000 to $34,999 | 68 (12.3%) | 134 (24.5%) |
| $35,000 to $39,999 | 0 (0.0%) | 9 (1.7%) |
| $40,000 to $44,999 | 23 (4.2%) | 18 (3.3%) |
| $45,000 to $49,999 | 29 (5.2%) | 42 (7.7%) |
| $50,000 to $54,999 | 49 (8.9%) | 35 (6.4%) |
| $55,000 to $64,999 | 58 (10.5%) | 57 (10.4%) |
| $65,000 to $74,999 | 36 (6.5%) | 5 (0.9%) |
| $75,000 to $99,999 | 71 (12.9%) | 11 (2.0%) |
| $100,000+ | 62 (11.2%) | 26 (4.8%) |
| Total | 552 (100.0%) | 547 (100.0%) |
Earnings by Sex by Educational Attainment in Honokaa
Average earnings in Honokaa are $46,369 for men and $33,420 for women, a difference of 27.9%. Men with an educational attainment of bachelor's degree enjoy the highest average annual earnings of $80,855, while those with high school diploma education earn the least with $33,125. Women with an educational attainment of less than high school earn the most with the average annual earnings of $48,347, while those with high school diploma education have the smallest earnings of $30,313.
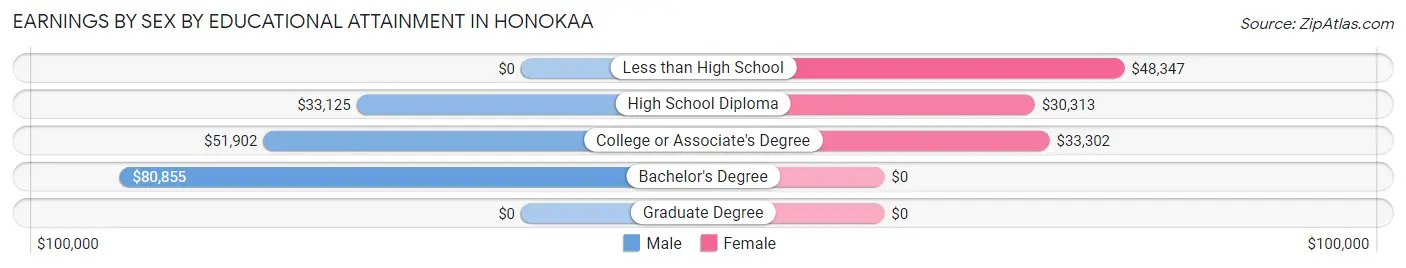
| Educational Attainment | Male Income | Female Income |
| Less than High School | - | - |
| High School Diploma | $33,125 | $30,313 |
| College or Associate's Degree | $51,902 | $33,302 |
| Bachelor's Degree | $80,855 | $0 |
| Graduate Degree | - | - |
| Total | $46,369 | $33,420 |
Family Income in Honokaa
Family Income Brackets in Honokaa
According to the Honokaa family income data, there are 103 families falling into the $50,000 to $74,999 income range, which is the most common income bracket and makes up 20.7% of all families.
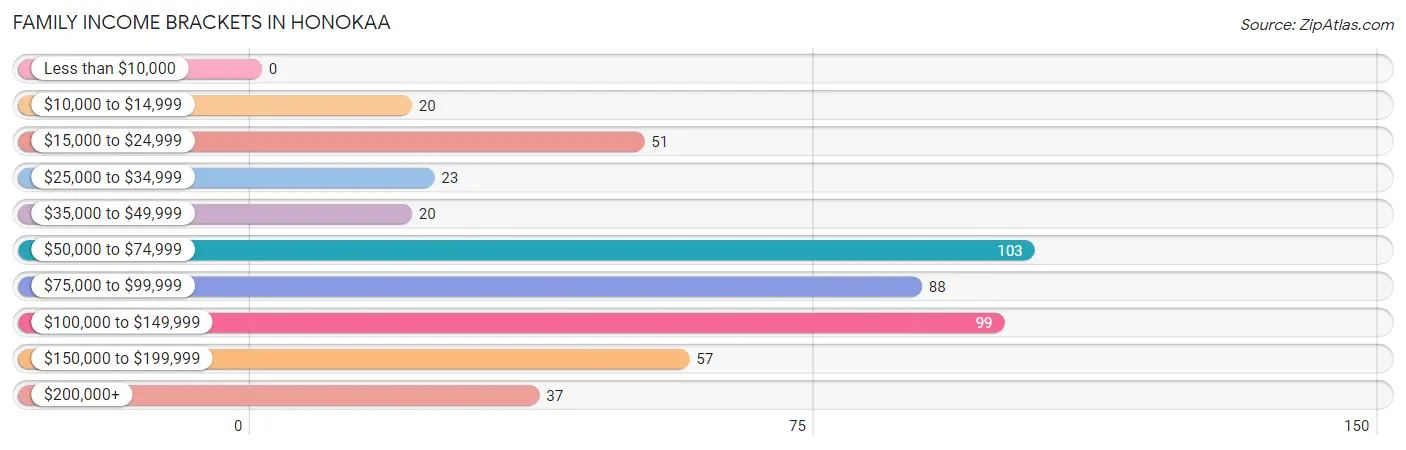
| Income Bracket | # Families | % Families |
| Less than $10,000 | 0 | 0.0% |
| $10,000 to $14,999 | 20 | 4.0% |
| $15,000 to $24,999 | 51 | 10.2% |
| $25,000 to $34,999 | 23 | 4.6% |
| $35,000 to $49,999 | 20 | 4.0% |
| $50,000 to $74,999 | 103 | 20.7% |
| $75,000 to $99,999 | 88 | 17.7% |
| $100,000 to $149,999 | 99 | 19.9% |
| $150,000 to $199,999 | 57 | 11.4% |
| $200,000+ | 37 | 7.4% |
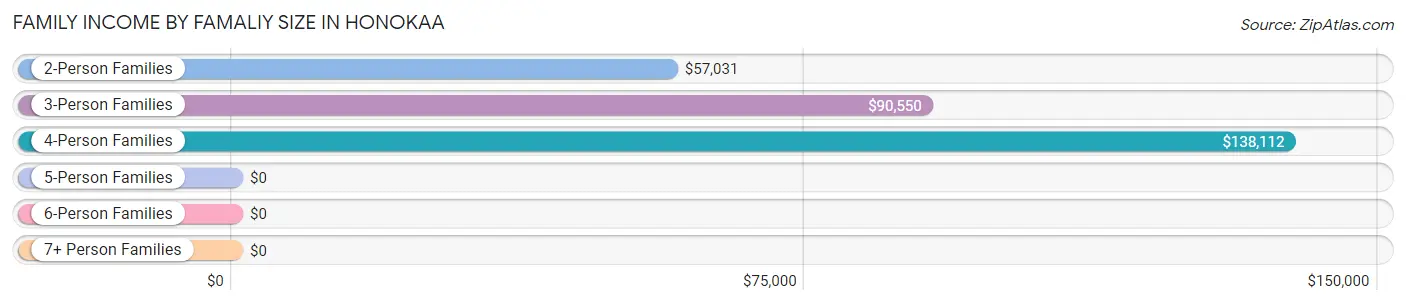
Family Income by Famaliy Size in Honokaa
4-person families (110 | 22.1%) account for the highest median family income in Honokaa with $138,112 per family, while 4-person families (110 | 22.1%) have the highest median income of $34,528 per family member.
| Income Bracket | # Families | Median Income |
| 2-Person Families | 192 (38.6%) | $57,031 |
| 3-Person Families | 99 (19.9%) | $90,550 |
| 4-Person Families | 110 (22.1%) | $138,112 |
| 5-Person Families | 47 (9.4%) | $0 |
| 6-Person Families | 21 (4.2%) | $0 |
| 7+ Person Families | 29 (5.8%) | $0 |
| Total | 498 (100.0%) | $87,500 |
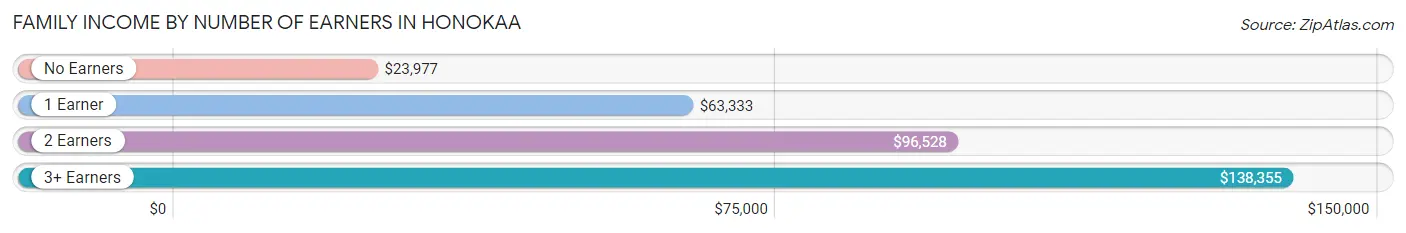
Family Income by Number of Earners in Honokaa
The median family income in Honokaa is $87,500, with families comprising 3+ earners (100) having the highest median family income of $138,355, while families with no earners (77) have the lowest median family income of $23,977, accounting for 20.1% and 15.5% of families, respectively.
| Number of Earners | # Families | Median Income |
| No Earners | 77 (15.5%) | $23,977 |
| 1 Earner | 114 (22.9%) | $63,333 |
| 2 Earners | 207 (41.6%) | $96,528 |
| 3+ Earners | 100 (20.1%) | $138,355 |
| Total | 498 (100.0%) | $87,500 |
Household Income in Honokaa
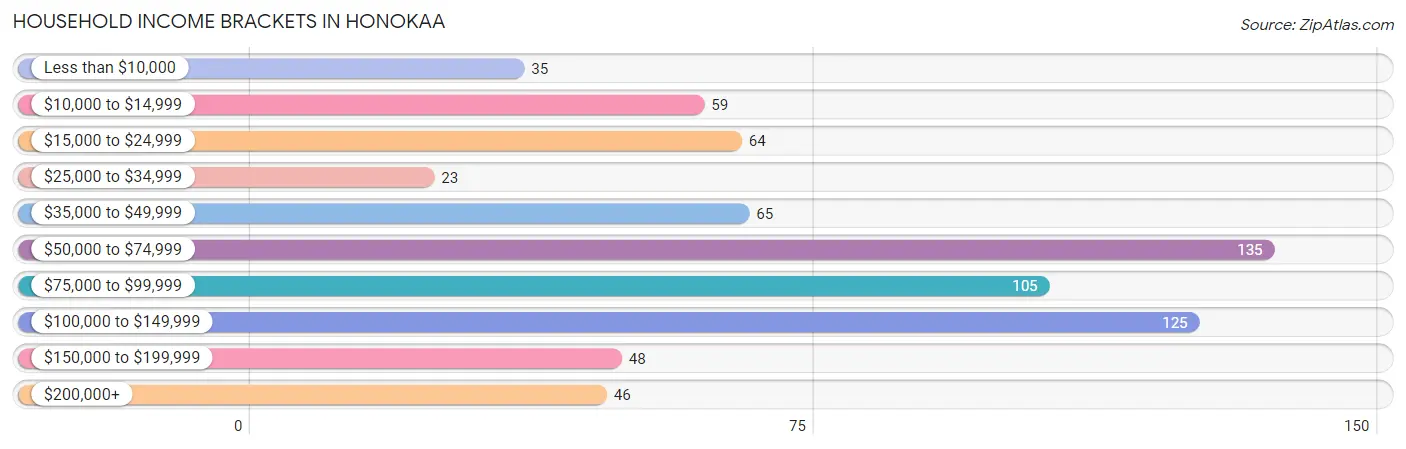
Household Income Brackets in Honokaa
With 135 households falling in the category, the $50,000 to $74,999 income range is the most frequent in Honokaa, accounting for 19.2% of all households. In contrast, only 23 households (3.3%) fall into the $25,000 to $34,999 income bracket, making it the least populous group.
| Income Bracket | # Households | % Households |
| Less than $10,000 | 35 | 5.0% |
| $10,000 to $14,999 | 59 | 8.4% |
| $15,000 to $24,999 | 64 | 9.1% |
| $25,000 to $34,999 | 23 | 3.3% |
| $35,000 to $49,999 | 65 | 9.2% |
| $50,000 to $74,999 | 135 | 19.1% |
| $75,000 to $99,999 | 105 | 14.9% |
| $100,000 to $149,999 | 125 | 17.7% |
| $150,000 to $199,999 | 48 | 6.8% |
| $200,000+ | 46 | 6.5% |
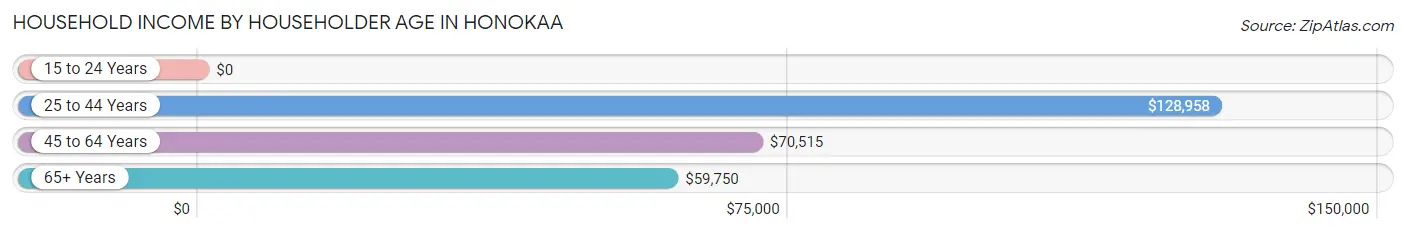
Household Income by Householder Age in Honokaa
The median household income in Honokaa is $70,819, with the highest median household income of $128,958 found in the 25 to 44 years age bracket for the primary householder. A total of 160 households (22.7%) fall into this category.
| Income Bracket | # Households | Median Income |
| 15 to 24 Years | 0 (0.0%) | $0 |
| 25 to 44 Years | 160 (22.7%) | $128,958 |
| 45 to 64 Years | 225 (31.9%) | $70,515 |
| 65+ Years | 320 (45.4%) | $59,750 |
| Total | 705 (100.0%) | $70,819 |
Poverty in Honokaa
Income Below Poverty by Sex and Age in Honokaa
With 9.6% poverty level for males and 6.7% for females among the residents of Honokaa, 55 to 64 year old males and 16 and 17 year old females are the most vulnerable to poverty, with 44 males (32.8%) and 11 females (100.0%) in their respective age groups living below the poverty level.
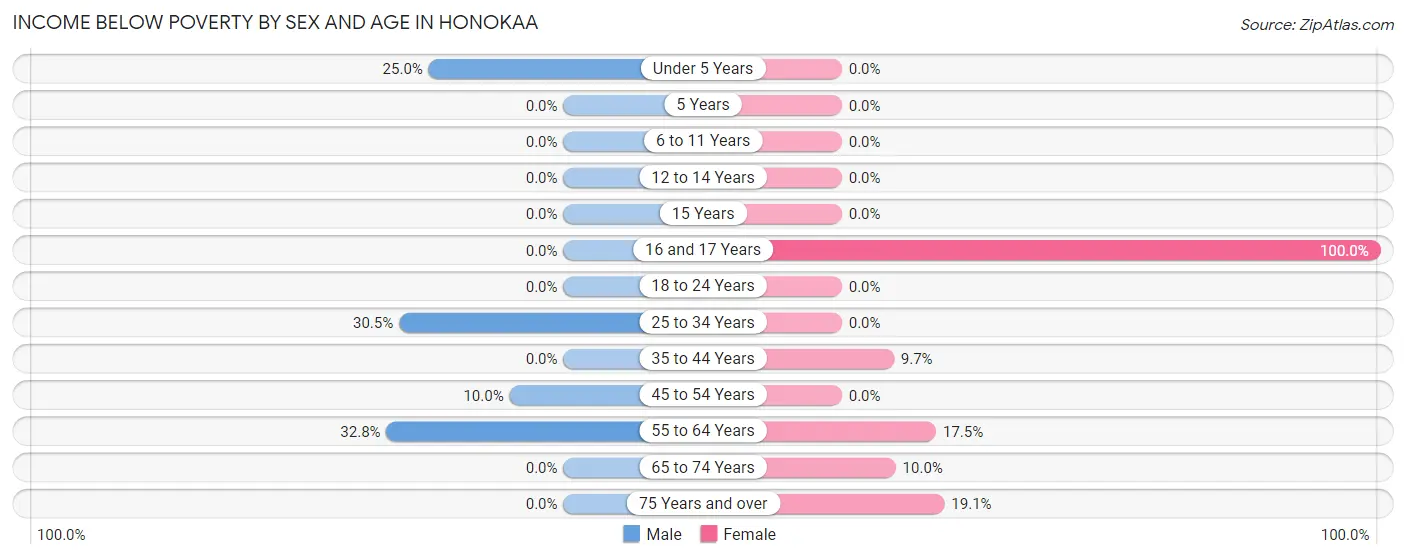
| Age Bracket | Male | Female |
| Under 5 Years | 22 (25.0%) | 0 (0.0%) |
| 5 Years | 0 (0.0%) | 0 (0.0%) |
| 6 to 11 Years | 0 (0.0%) | 0 (0.0%) |
| 12 to 14 Years | 0 (0.0%) | 0 (0.0%) |
| 15 Years | 0 (0.0%) | 0 (0.0%) |
| 16 and 17 Years | 0 (0.0%) | 11 (100.0%) |
| 18 to 24 Years | 0 (0.0%) | 0 (0.0%) |
| 25 to 34 Years | 25 (30.5%) | 0 (0.0%) |
| 35 to 44 Years | 0 (0.0%) | 14 (9.7%) |
| 45 to 54 Years | 16 (10.0%) | 0 (0.0%) |
| 55 to 64 Years | 44 (32.8%) | 14 (17.5%) |
| 65 to 74 Years | 0 (0.0%) | 12 (10.0%) |
| 75 Years and over | 0 (0.0%) | 24 (19.1%) |
| Total | 107 (9.6%) | 75 (6.7%) |
Income Above Poverty by Sex and Age in Honokaa
According to the poverty statistics in Honokaa, males aged 5 years and females aged under 5 years are the age groups that are most secure financially, with 100.0% of males and 100.0% of females in these age groups living above the poverty line.
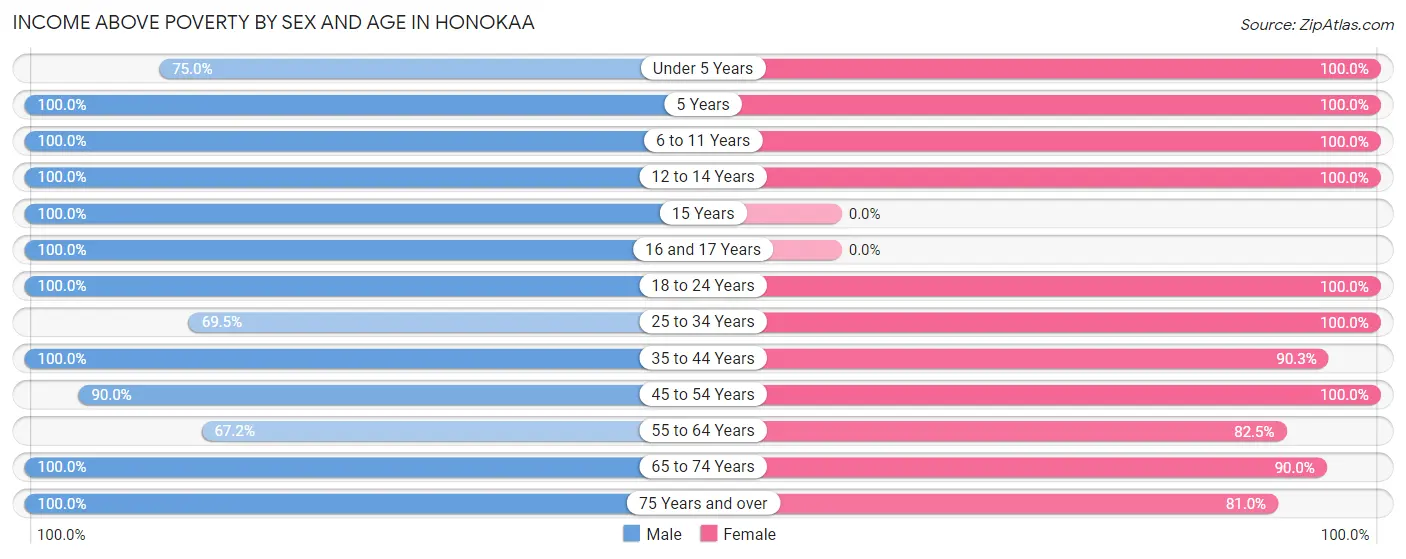
| Age Bracket | Male | Female |
| Under 5 Years | 66 (75.0%) | 38 (100.0%) |
| 5 Years | 23 (100.0%) | 9 (100.0%) |
| 6 to 11 Years | 99 (100.0%) | 60 (100.0%) |
| 12 to 14 Years | 67 (100.0%) | 77 (100.0%) |
| 15 Years | 24 (100.0%) | 0 (0.0%) |
| 16 and 17 Years | 70 (100.0%) | 0 (0.0%) |
| 18 to 24 Years | 73 (100.0%) | 172 (100.0%) |
| 25 to 34 Years | 57 (69.5%) | 107 (100.0%) |
| 35 to 44 Years | 107 (100.0%) | 131 (90.3%) |
| 45 to 54 Years | 144 (90.0%) | 181 (100.0%) |
| 55 to 64 Years | 90 (67.2%) | 66 (82.5%) |
| 65 to 74 Years | 115 (100.0%) | 108 (90.0%) |
| 75 Years and over | 78 (100.0%) | 102 (80.9%) |
| Total | 1,013 (90.4%) | 1,051 (93.3%) |
Income Below Poverty Among Married-Couple Families in Honokaa
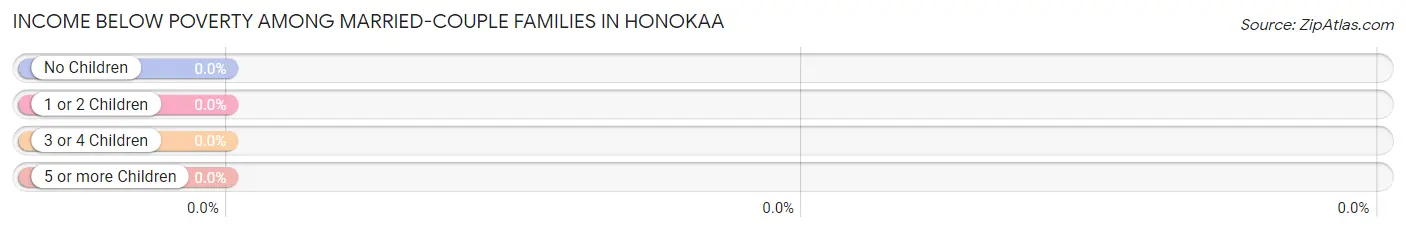
| Children | Above Poverty | Below Poverty |
| No Children | 187 (100.0%) | 0 (0.0%) |
| 1 or 2 Children | 84 (100.0%) | 0 (0.0%) |
| 3 or 4 Children | 47 (100.0%) | 0 (0.0%) |
| 5 or more Children | 0 (0.0%) | 0 (0.0%) |
| Total | 318 (100.0%) | 0 (0.0%) |
Income Below Poverty Among Single-Parent Households in Honokaa
According to the poverty data in Honokaa, 31.2% or 20 single-father households and 12.1% or 14 single-mother households are living below the poverty line. Among single-father households, those with 1 or 2 children have the highest poverty rate, with 20 households (95.2%) experiencing poverty. Likewise, among single-mother households, those with no children have the highest poverty rate, with 14 households (18.4%) falling below the poverty line.
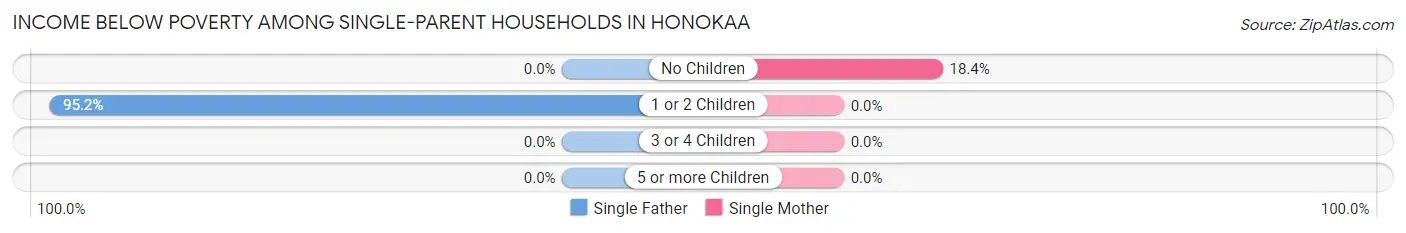
| Children | Single Father | Single Mother |
| No Children | 0 (0.0%) | 14 (18.4%) |
| 1 or 2 Children | 20 (95.2%) | 0 (0.0%) |
| 3 or 4 Children | 0 (0.0%) | 0 (0.0%) |
| 5 or more Children | 0 (0.0%) | 0 (0.0%) |
| Total | 20 (31.2%) | 14 (12.1%) |
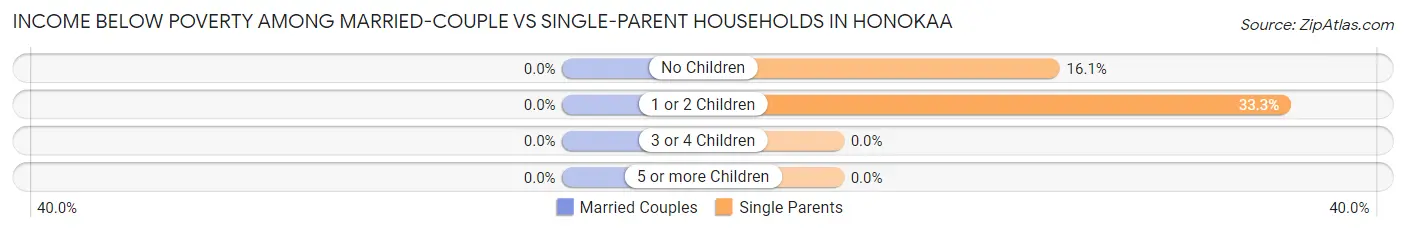
Income Below Poverty Among Married-Couple vs Single-Parent Households in Honokaa
| Children | Married-Couple Families | Single-Parent Households |
| No Children | 0 (0.0%) | 14 (16.1%) |
| 1 or 2 Children | 0 (0.0%) | 20 (33.3%) |
| 3 or 4 Children | 0 (0.0%) | 0 (0.0%) |
| 5 or more Children | 0 (0.0%) | 0 (0.0%) |
| Total | 0 (0.0%) | 34 (18.9%) |
Employment Characteristics in Honokaa
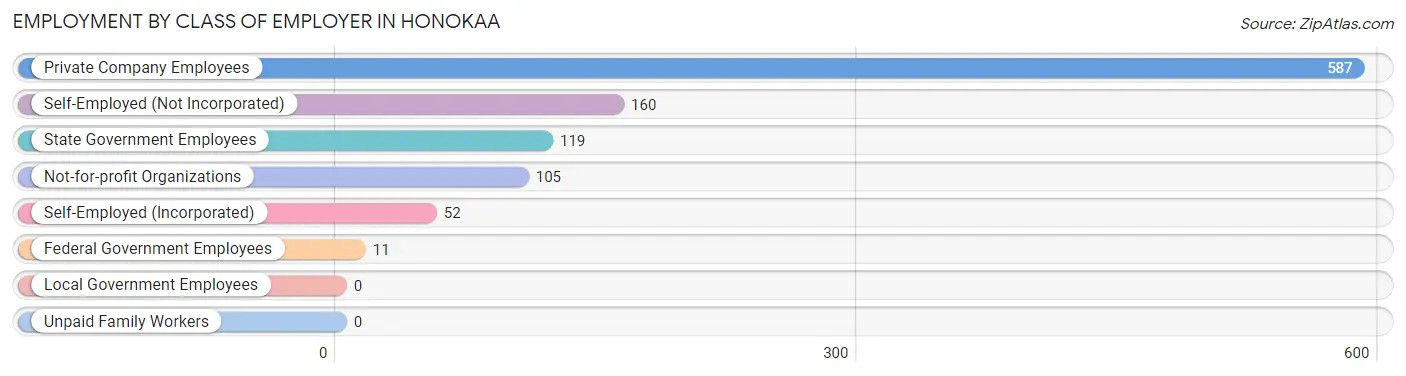
Employment by Class of Employer in Honokaa
Among the 1,034 employed individuals in Honokaa, private company employees (587 | 56.8%), self-employed (not incorporated) (160 | 15.5%), and state government employees (119 | 11.5%) make up the most common classes of employment.
| Employer Class | # Employees | % Employees |
| Private Company Employees | 587 | 56.8% |
| Self-Employed (Incorporated) | 52 | 5.0% |
| Self-Employed (Not Incorporated) | 160 | 15.5% |
| Not-for-profit Organizations | 105 | 10.2% |
| Local Government Employees | 0 | 0.0% |
| State Government Employees | 119 | 11.5% |
| Federal Government Employees | 11 | 1.1% |
| Unpaid Family Workers | 0 | 0.0% |
| Total | 1,034 | 100.0% |
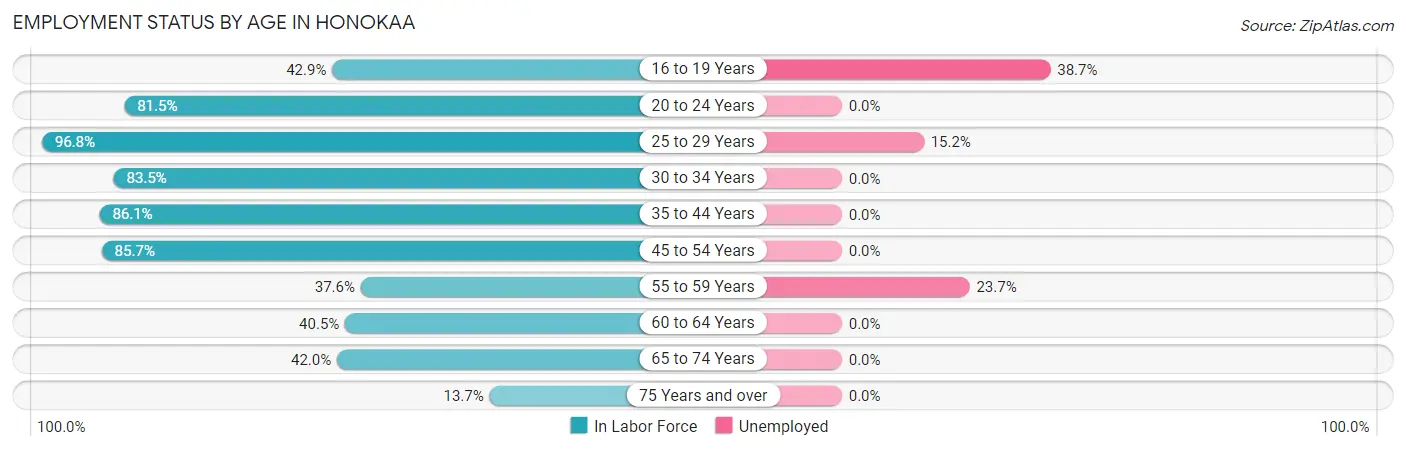
Employment Status by Age in Honokaa
According to the labor force statistics for Honokaa, out of the total population over 16 years of age (1,805), 61.1% or 1,103 individuals are in the labor force, with 4.7% or 52 of them unemployed. The age group with the highest labor force participation rate is 25 to 29 years, with 96.8% or 92 individuals in the labor force. Within the labor force, the 16 to 19 years age range has the highest percentage of unemployed individuals, with 38.7% or 29 of them being unemployed.
| Age Bracket | In Labor Force | Unemployed |
| 16 to 19 Years | 75 (42.9%) | 29 (38.7%) |
| 20 to 24 Years | 123 (81.5%) | 0 (0.0%) |
| 25 to 29 Years | 92 (96.8%) | 14 (15.2%) |
| 30 to 34 Years | 81 (83.5%) | 0 (0.0%) |
| 35 to 44 Years | 217 (86.1%) | 0 (0.0%) |
| 45 to 54 Years | 294 (85.7%) | 0 (0.0%) |
| 55 to 59 Years | 38 (37.6%) | 9 (23.7%) |
| 60 to 64 Years | 49 (40.5%) | 0 (0.0%) |
| 65 to 74 Years | 102 (42.0%) | 0 (0.0%) |
| 75 Years and over | 31 (13.7%) | 0 (0.0%) |
| Total | 1,103 (61.1%) | 52 (4.7%) |
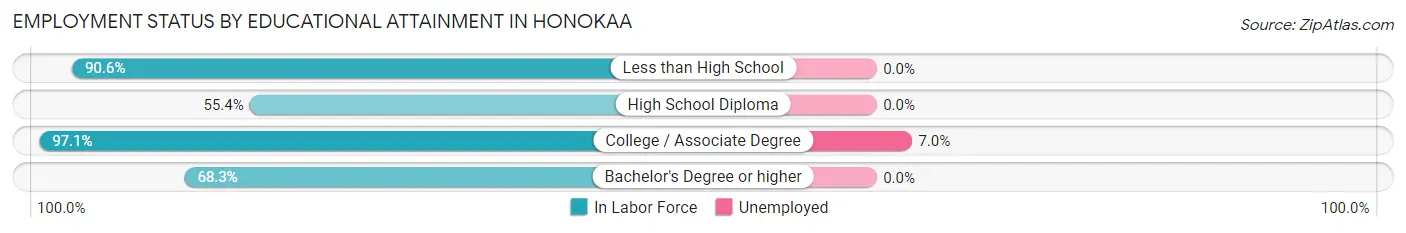
Employment Status by Educational Attainment in Honokaa
According to labor force statistics for Honokaa, 76.4% of individuals (771) out of the total population between 25 and 64 years of age (1,009) are in the labor force, with 3.0% or 23 of them being unemployed. The group with the highest labor force participation rate are those with the educational attainment of college / associate degree, with 97.1% or 329 individuals in the labor force. Within the labor force, individuals with college / associate degree education have the highest percentage of unemployment, with 7.0% or 23 of them being unemployed.
| Educational Attainment | In Labor Force | Unemployed |
| Less than High School | 106 (90.6%) | 0 (0.0%) |
| High School Diploma | 179 (55.4%) | 0 (0.0%) |
| College / Associate Degree | 329 (97.1%) | 24 (7.0%) |
| Bachelor's Degree or higher | 157 (68.3%) | 0 (0.0%) |
| Total | 771 (76.4%) | 30 (3.0%) |
Employment Occupations by Sex in Honokaa
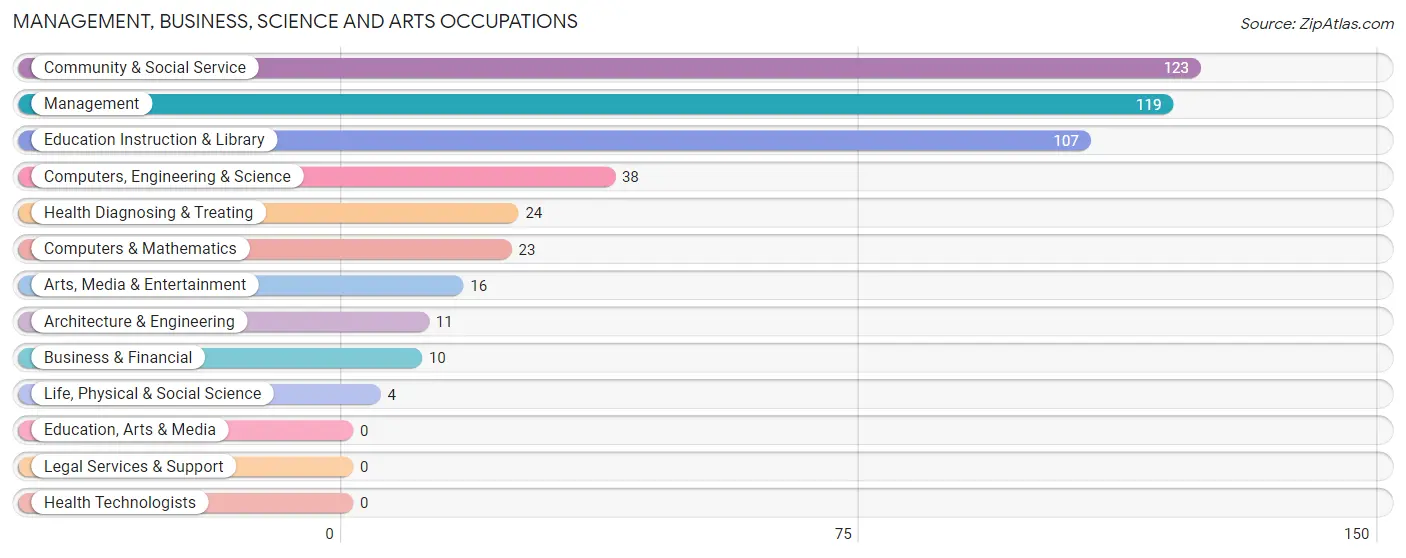
Management, Business, Science and Arts Occupations
The most common Management, Business, Science and Arts occupations in Honokaa are Community & Social Service (123 | 11.7%), Management (119 | 11.3%), Education Instruction & Library (107 | 10.2%), Computers, Engineering & Science (38 | 3.6%), and Health Diagnosing & Treating (24 | 2.3%).
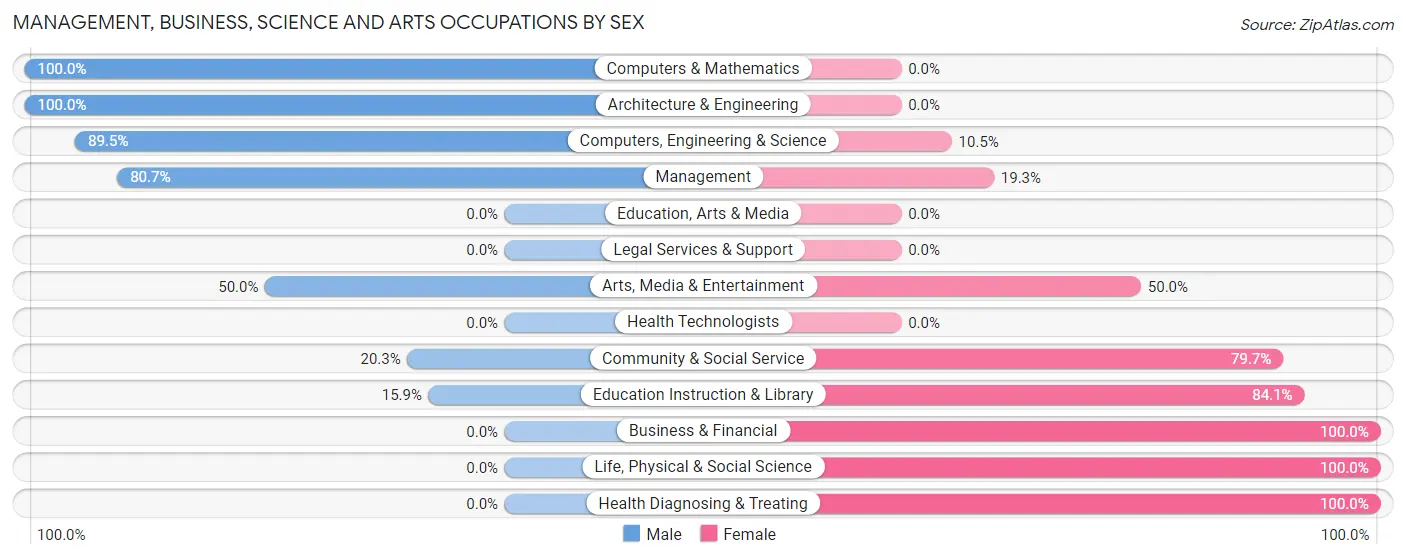
Management, Business, Science and Arts Occupations by Sex
Within the Management, Business, Science and Arts occupations in Honokaa, the most male-oriented occupations are Computers & Mathematics (100.0%), Architecture & Engineering (100.0%), and Computers, Engineering & Science (89.5%), while the most female-oriented occupations are Business & Financial (100.0%), Life, Physical & Social Science (100.0%), and Health Diagnosing & Treating (100.0%).
| Occupation | Male | Female |
| Management | 96 (80.7%) | 23 (19.3%) |
| Business & Financial | 0 (0.0%) | 10 (100.0%) |
| Computers, Engineering & Science | 34 (89.5%) | 4 (10.5%) |
| Computers & Mathematics | 23 (100.0%) | 0 (0.0%) |
| Architecture & Engineering | 11 (100.0%) | 0 (0.0%) |
| Life, Physical & Social Science | 0 (0.0%) | 4 (100.0%) |
| Community & Social Service | 25 (20.3%) | 98 (79.7%) |
| Education, Arts & Media | 0 (0.0%) | 0 (0.0%) |
| Legal Services & Support | 0 (0.0%) | 0 (0.0%) |
| Education Instruction & Library | 17 (15.9%) | 90 (84.1%) |
| Arts, Media & Entertainment | 8 (50.0%) | 8 (50.0%) |
| Health Diagnosing & Treating | 0 (0.0%) | 24 (100.0%) |
| Health Technologists | 0 (0.0%) | 0 (0.0%) |
| Total (Category) | 155 (49.4%) | 159 (50.6%) |
| Total (Overall) | 527 (50.2%) | 523 (49.8%) |
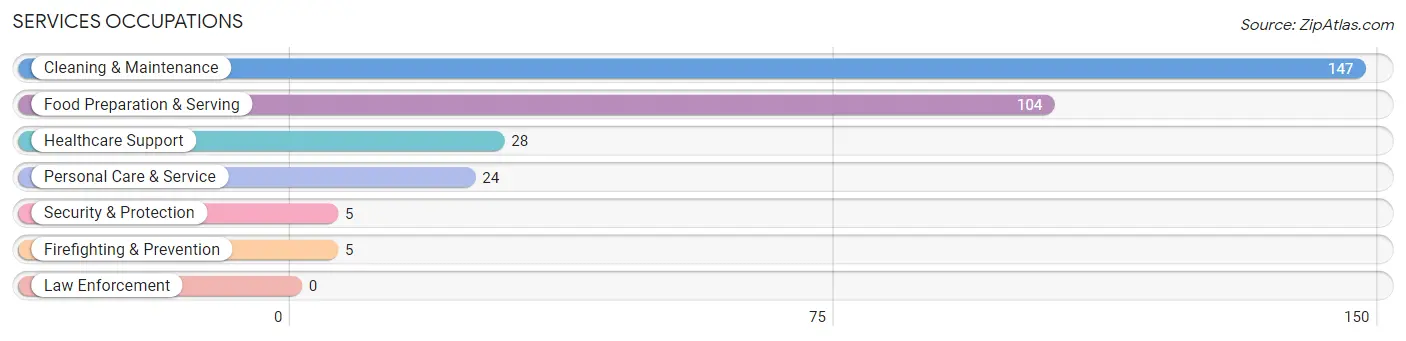
Services Occupations
The most common Services occupations in Honokaa are Cleaning & Maintenance (147 | 14.0%), Food Preparation & Serving (104 | 9.9%), Healthcare Support (28 | 2.7%), Personal Care & Service (24 | 2.3%), and Security & Protection (5 | 0.5%).
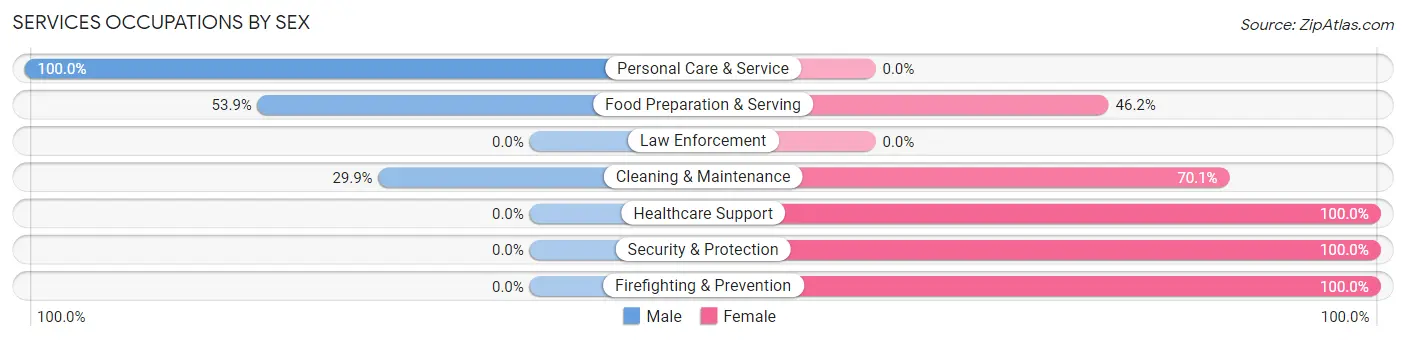
Services Occupations by Sex
Within the Services occupations in Honokaa, the most male-oriented occupations are Personal Care & Service (100.0%), Food Preparation & Serving (53.8%), and Cleaning & Maintenance (29.9%), while the most female-oriented occupations are Healthcare Support (100.0%), Security & Protection (100.0%), and Firefighting & Prevention (100.0%).
| Occupation | Male | Female |
| Healthcare Support | 0 (0.0%) | 28 (100.0%) |
| Security & Protection | 0 (0.0%) | 5 (100.0%) |
| Firefighting & Prevention | 0 (0.0%) | 5 (100.0%) |
| Law Enforcement | 0 (0.0%) | 0 (0.0%) |
| Food Preparation & Serving | 56 (53.8%) | 48 (46.2%) |
| Cleaning & Maintenance | 44 (29.9%) | 103 (70.1%) |
| Personal Care & Service | 24 (100.0%) | 0 (0.0%) |
| Total (Category) | 124 (40.3%) | 184 (59.7%) |
| Total (Overall) | 527 (50.2%) | 523 (49.8%) |
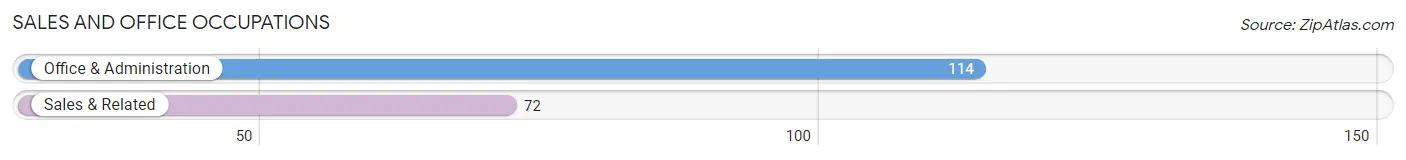
Sales and Office Occupations
The most common Sales and Office occupations in Honokaa are Office & Administration (114 | 10.9%), and Sales & Related (72 | 6.9%).
Sales and Office Occupations by Sex
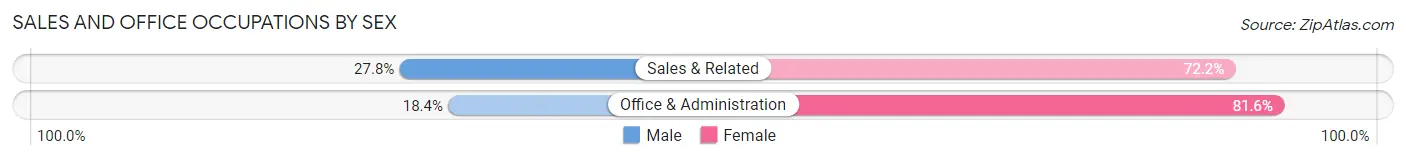
| Occupation | Male | Female |
| Sales & Related | 20 (27.8%) | 52 (72.2%) |
| Office & Administration | 21 (18.4%) | 93 (81.6%) |
| Total (Category) | 41 (22.0%) | 145 (78.0%) |
| Total (Overall) | 527 (50.2%) | 523 (49.8%) |
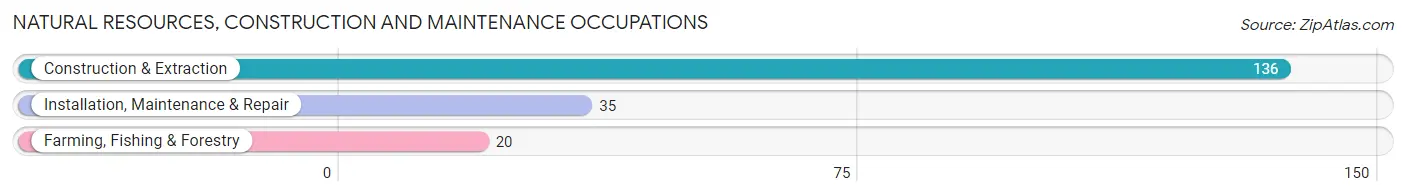
Natural Resources, Construction and Maintenance Occupations
The most common Natural Resources, Construction and Maintenance occupations in Honokaa are Construction & Extraction (136 | 13.0%), Installation, Maintenance & Repair (35 | 3.3%), and Farming, Fishing & Forestry (20 | 1.9%).
Natural Resources, Construction and Maintenance Occupations by Sex
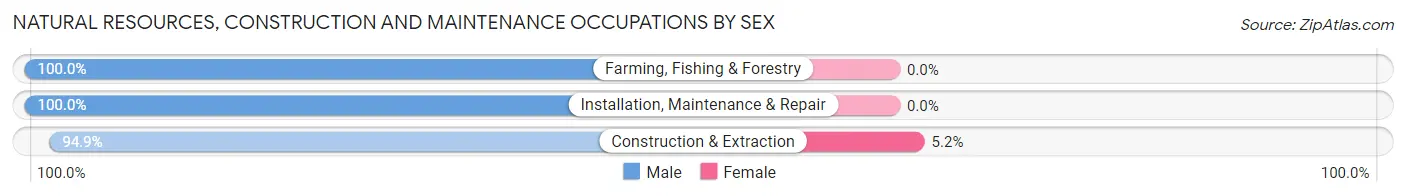
| Occupation | Male | Female |
| Farming, Fishing & Forestry | 20 (100.0%) | 0 (0.0%) |
| Construction & Extraction | 129 (94.9%) | 7 (5.1%) |
| Installation, Maintenance & Repair | 35 (100.0%) | 0 (0.0%) |
| Total (Category) | 184 (96.3%) | 7 (3.7%) |
| Total (Overall) | 527 (50.2%) | 523 (49.8%) |
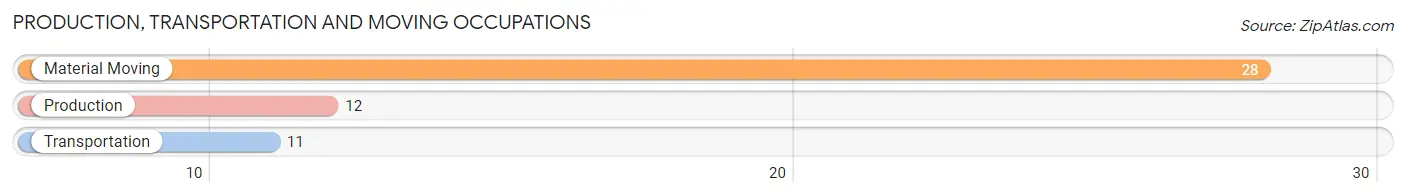
Production, Transportation and Moving Occupations
The most common Production, Transportation and Moving occupations in Honokaa are Material Moving (28 | 2.7%), Production (12 | 1.1%), and Transportation (11 | 1.1%).
Production, Transportation and Moving Occupations by Sex
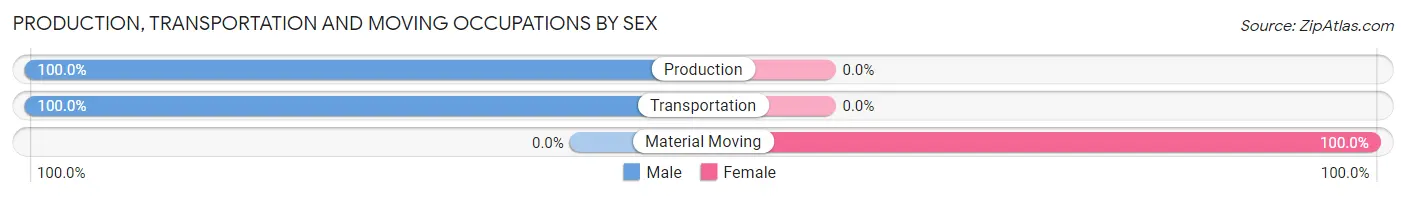
| Occupation | Male | Female |
| Production | 12 (100.0%) | 0 (0.0%) |
| Transportation | 11 (100.0%) | 0 (0.0%) |
| Material Moving | 0 (0.0%) | 28 (100.0%) |
| Total (Category) | 23 (45.1%) | 28 (54.9%) |
| Total (Overall) | 527 (50.2%) | 523 (49.8%) |
Employment Industries by Sex in Honokaa
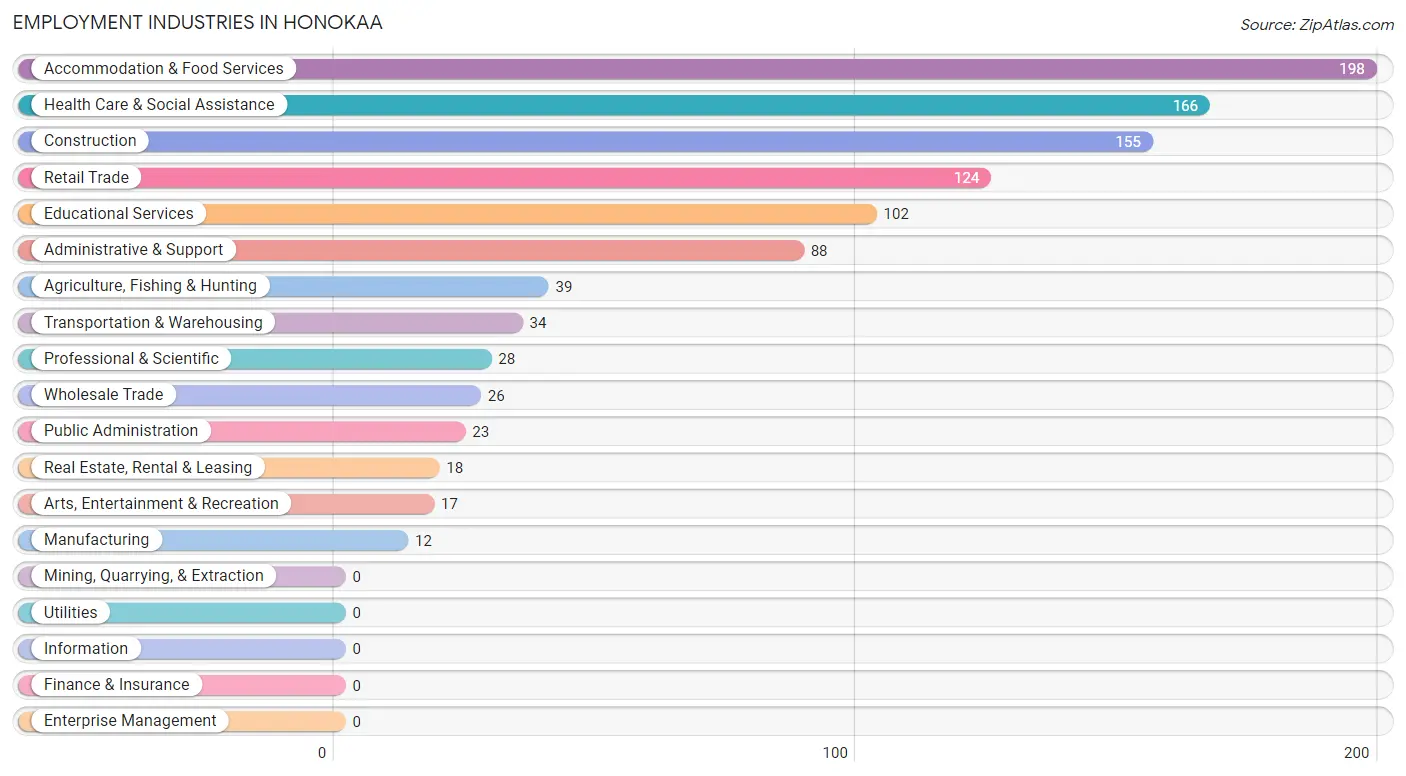
Employment Industries in Honokaa
The major employment industries in Honokaa include Accommodation & Food Services (198 | 18.9%), Health Care & Social Assistance (166 | 15.8%), Construction (155 | 14.8%), Retail Trade (124 | 11.8%), and Educational Services (102 | 9.7%).
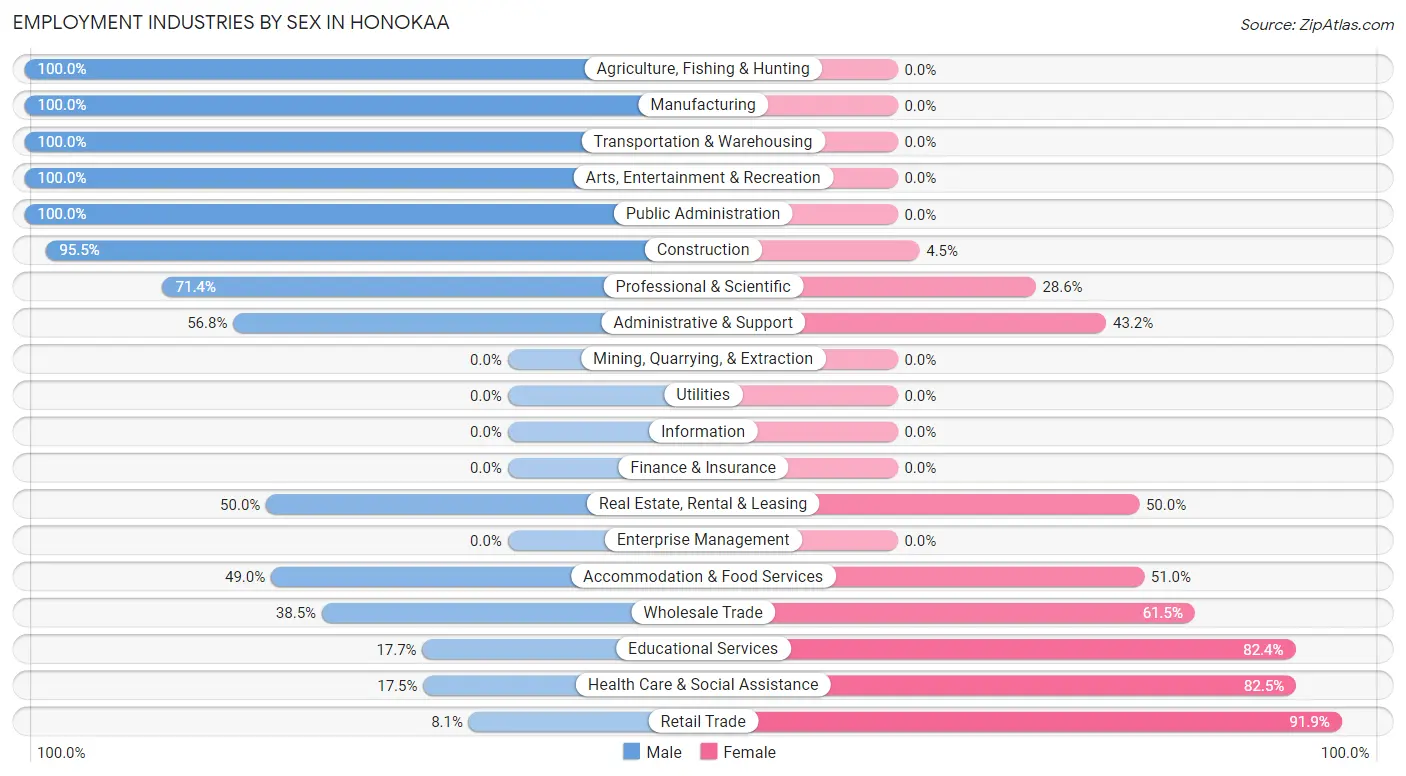
Employment Industries by Sex in Honokaa
The Honokaa industries that see more men than women are Agriculture, Fishing & Hunting (100.0%), Manufacturing (100.0%), and Transportation & Warehousing (100.0%), whereas the industries that tend to have a higher number of women are Retail Trade (91.9%), Health Care & Social Assistance (82.5%), and Educational Services (82.4%).
| Industry | Male | Female |
| Agriculture, Fishing & Hunting | 39 (100.0%) | 0 (0.0%) |
| Mining, Quarrying, & Extraction | 0 (0.0%) | 0 (0.0%) |
| Construction | 148 (95.5%) | 7 (4.5%) |
| Manufacturing | 12 (100.0%) | 0 (0.0%) |
| Wholesale Trade | 10 (38.5%) | 16 (61.5%) |
| Retail Trade | 10 (8.1%) | 114 (91.9%) |
| Transportation & Warehousing | 34 (100.0%) | 0 (0.0%) |
| Utilities | 0 (0.0%) | 0 (0.0%) |
| Information | 0 (0.0%) | 0 (0.0%) |
| Finance & Insurance | 0 (0.0%) | 0 (0.0%) |
| Real Estate, Rental & Leasing | 9 (50.0%) | 9 (50.0%) |
| Professional & Scientific | 20 (71.4%) | 8 (28.6%) |
| Enterprise Management | 0 (0.0%) | 0 (0.0%) |
| Administrative & Support | 50 (56.8%) | 38 (43.2%) |
| Educational Services | 18 (17.6%) | 84 (82.4%) |
| Health Care & Social Assistance | 29 (17.5%) | 137 (82.5%) |
| Arts, Entertainment & Recreation | 17 (100.0%) | 0 (0.0%) |
| Accommodation & Food Services | 97 (49.0%) | 101 (51.0%) |
| Public Administration | 23 (100.0%) | 0 (0.0%) |
| Total | 527 (50.2%) | 523 (49.8%) |
Education in Honokaa
School Enrollment in Honokaa
The most common levels of schooling among the 591 students in Honokaa are high school (179 | 30.3%), college / undergraduate (116 | 19.6%), and elementary school (88 | 14.9%).
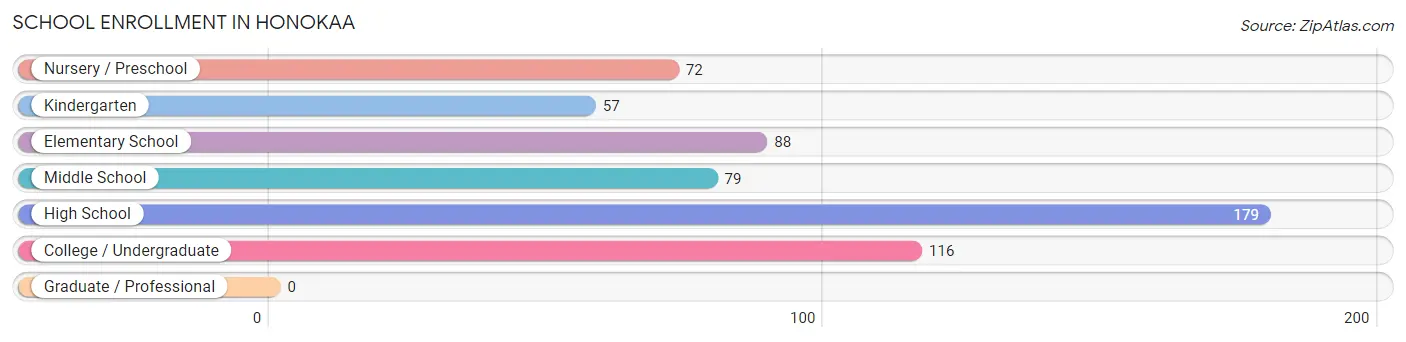
| School Level | # Students | % Students |
| Nursery / Preschool | 72 | 12.2% |
| Kindergarten | 57 | 9.6% |
| Elementary School | 88 | 14.9% |
| Middle School | 79 | 13.4% |
| High School | 179 | 30.3% |
| College / Undergraduate | 116 | 19.6% |
| Graduate / Professional | 0 | 0.0% |
| Total | 591 | 100.0% |
School Enrollment by Age by Funding Source in Honokaa
Out of a total of 591 students who are enrolled in schools in Honokaa, 170 (28.8%) attend a private institution, while the remaining 421 (71.2%) are enrolled in public schools. The age group of 35 years and over has the highest likelihood of being enrolled in private schools, with 13 (92.9% in the age bracket) enrolled. Conversely, the age group of 18 to 19 year olds has the lowest likelihood of being enrolled in a private school, with 33 (100.0% in the age bracket) attending a public institution.
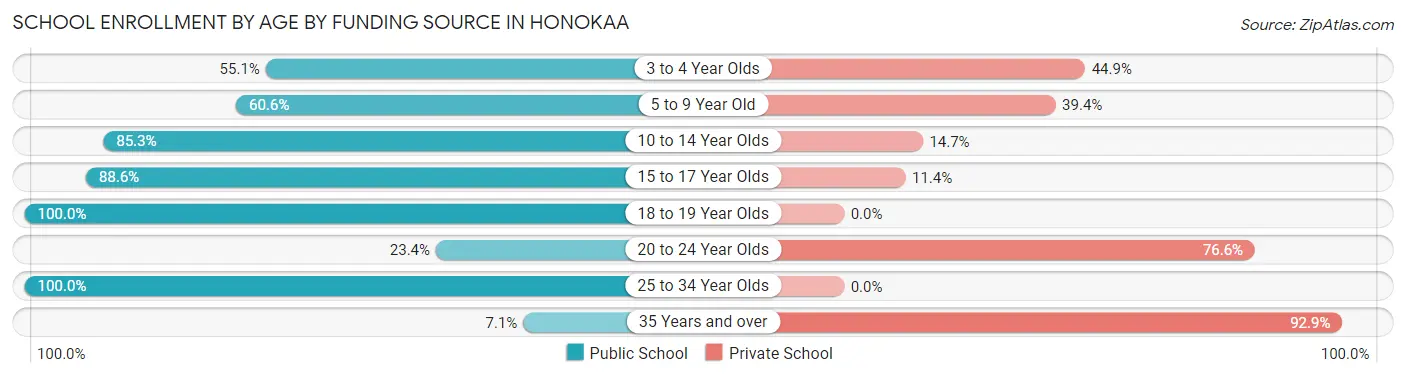
| Age Bracket | Public School | Private School |
| 3 to 4 Year Olds | 27 (55.1%) | 22 (44.9%) |
| 5 to 9 Year Old | 100 (60.6%) | 65 (39.4%) |
| 10 to 14 Year Olds | 128 (85.3%) | 22 (14.7%) |
| 15 to 17 Year Olds | 93 (88.6%) | 12 (11.4%) |
| 18 to 19 Year Olds | 33 (100.0%) | 0 (0.0%) |
| 20 to 24 Year Olds | 11 (23.4%) | 36 (76.6%) |
| 25 to 34 Year Olds | 28 (100.0%) | 0 (0.0%) |
| 35 Years and over | 1 (7.1%) | 13 (92.9%) |
| Total | 421 (71.2%) | 170 (28.8%) |
Educational Attainment by Field of Study in Honokaa
Business (55 | 15.4%), arts & humanities (50 | 14.0%), education (45 | 12.6%), social sciences (38 | 10.6%), and literature & languages (38 | 10.6%) are the most common fields of study among 357 individuals in Honokaa who have obtained a bachelor's degree or higher.
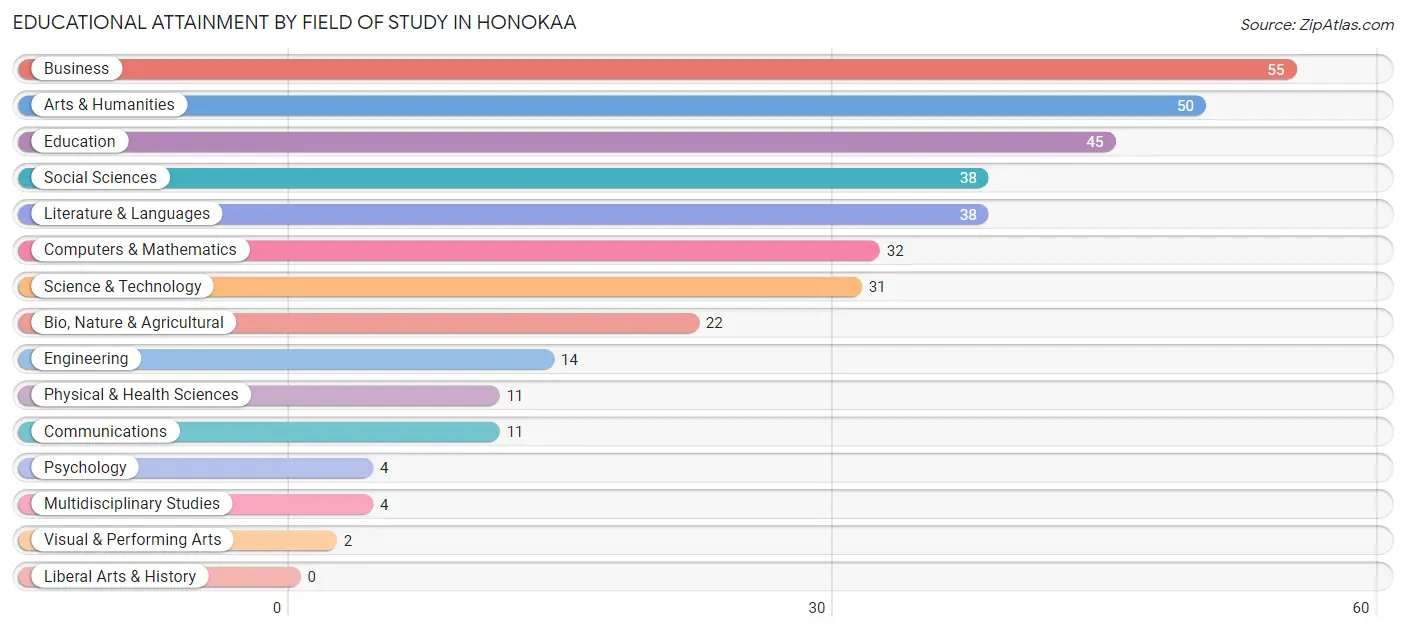
| Field of Study | # Graduates | % Graduates |
| Computers & Mathematics | 32 | 9.0% |
| Bio, Nature & Agricultural | 22 | 6.2% |
| Physical & Health Sciences | 11 | 3.1% |
| Psychology | 4 | 1.1% |
| Social Sciences | 38 | 10.6% |
| Engineering | 14 | 3.9% |
| Multidisciplinary Studies | 4 | 1.1% |
| Science & Technology | 31 | 8.7% |
| Business | 55 | 15.4% |
| Education | 45 | 12.6% |
| Literature & Languages | 38 | 10.6% |
| Liberal Arts & History | 0 | 0.0% |
| Visual & Performing Arts | 2 | 0.6% |
| Communications | 11 | 3.1% |
| Arts & Humanities | 50 | 14.0% |
| Total | 357 | 100.0% |
Transportation & Commute in Honokaa
Vehicle Availability by Sex in Honokaa
The most prevalent vehicle ownership categories in Honokaa are males with 2 vehicles (260, accounting for 49.3%) and females with 2 vehicles (186, making up 51.3%).
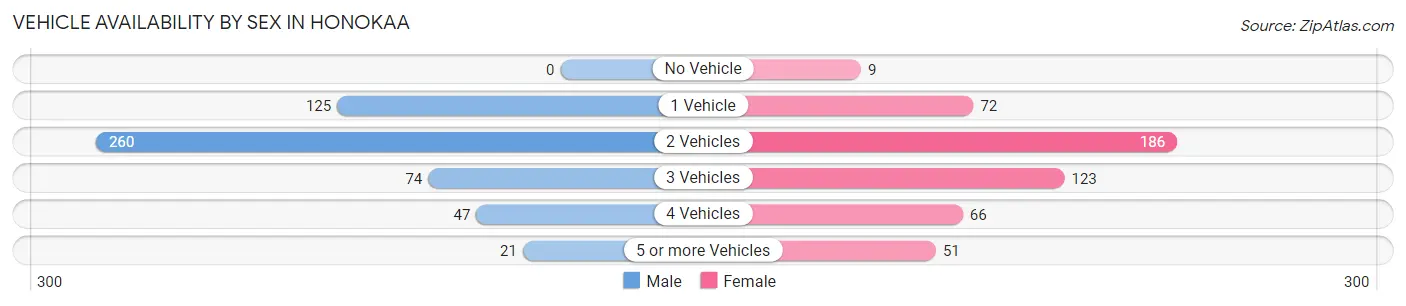
| Vehicles Available | Male | Female |
| No Vehicle | 0 (0.0%) | 9 (1.8%) |
| 1 Vehicle | 125 (23.7%) | 72 (14.2%) |
| 2 Vehicles | 260 (49.3%) | 186 (36.7%) |
| 3 Vehicles | 74 (14.0%) | 123 (24.3%) |
| 4 Vehicles | 47 (8.9%) | 66 (13.0%) |
| 5 or more Vehicles | 21 (4.0%) | 51 (10.1%) |
| Total | 527 (100.0%) | 507 (100.0%) |
Commute Time in Honokaa
The most frequently occuring commute durations in Honokaa are 45 to 59 minutes (243 commuters, 23.8%), 60 to 89 minutes (167 commuters, 16.3%), and 10 to 14 minutes (138 commuters, 13.5%).
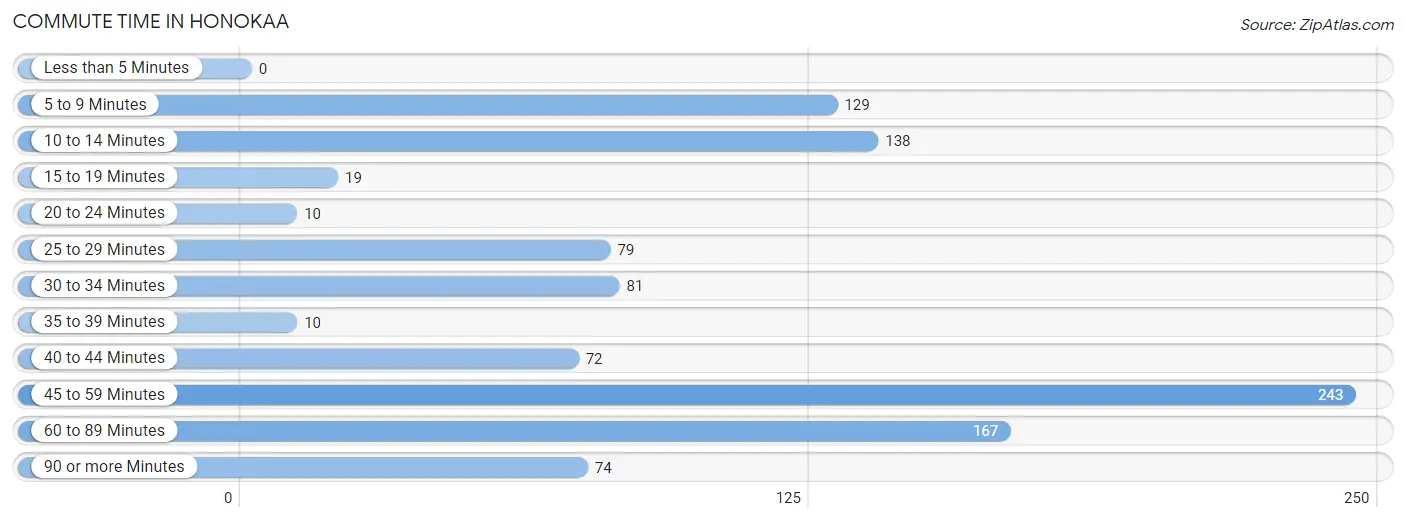
| Commute Time | # Commuters | % Commuters |
| Less than 5 Minutes | 0 | 0.0% |
| 5 to 9 Minutes | 129 | 12.6% |
| 10 to 14 Minutes | 138 | 13.5% |
| 15 to 19 Minutes | 19 | 1.9% |
| 20 to 24 Minutes | 10 | 1.0% |
| 25 to 29 Minutes | 79 | 7.7% |
| 30 to 34 Minutes | 81 | 7.9% |
| 35 to 39 Minutes | 10 | 1.0% |
| 40 to 44 Minutes | 72 | 7.0% |
| 45 to 59 Minutes | 243 | 23.8% |
| 60 to 89 Minutes | 167 | 16.3% |
| 90 or more Minutes | 74 | 7.2% |
Commute Time by Sex in Honokaa
The most common commute times in Honokaa are 45 to 59 minutes (158 commuters, 30.7%) for males and 10 to 14 minutes (95 commuters, 18.7%) for females.
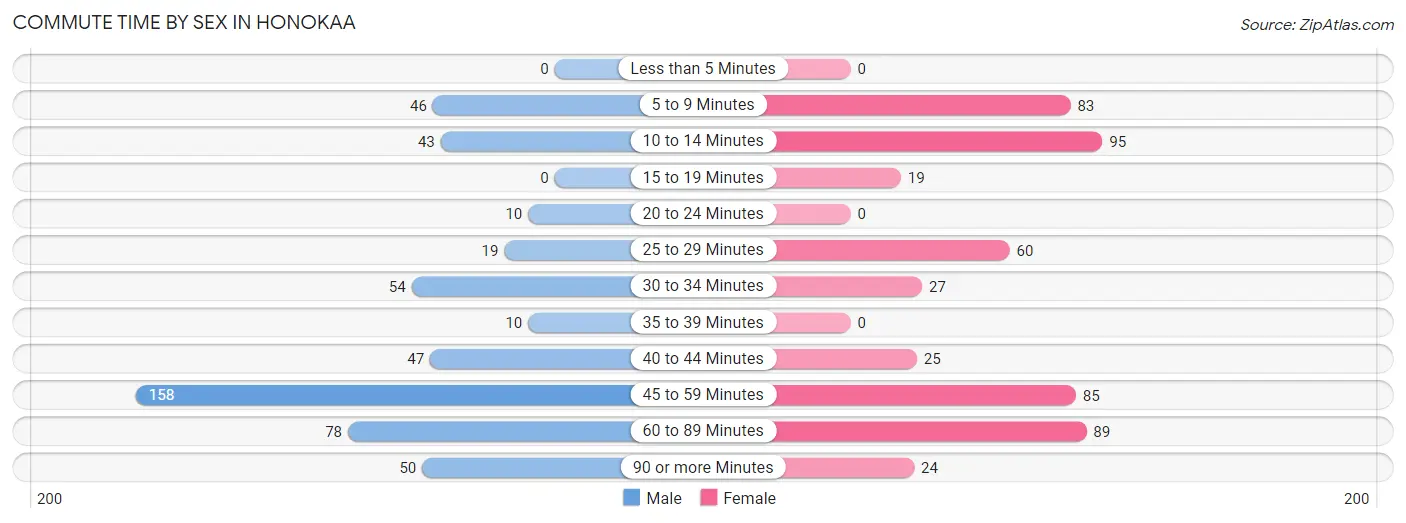
| Commute Time | Male | Female |
| Less than 5 Minutes | 0 (0.0%) | 0 (0.0%) |
| 5 to 9 Minutes | 46 (8.9%) | 83 (16.4%) |
| 10 to 14 Minutes | 43 (8.4%) | 95 (18.7%) |
| 15 to 19 Minutes | 0 (0.0%) | 19 (3.7%) |
| 20 to 24 Minutes | 10 (1.9%) | 0 (0.0%) |
| 25 to 29 Minutes | 19 (3.7%) | 60 (11.8%) |
| 30 to 34 Minutes | 54 (10.5%) | 27 (5.3%) |
| 35 to 39 Minutes | 10 (1.9%) | 0 (0.0%) |
| 40 to 44 Minutes | 47 (9.1%) | 25 (4.9%) |
| 45 to 59 Minutes | 158 (30.7%) | 85 (16.8%) |
| 60 to 89 Minutes | 78 (15.1%) | 89 (17.5%) |
| 90 or more Minutes | 50 (9.7%) | 24 (4.7%) |
Time of Departure to Work by Sex in Honokaa
The most frequent times of departure to work in Honokaa are 7:00 AM to 7:29 AM (108, 21.0%) for males and 12:00 AM to 4:59 AM (77, 15.2%) for females.
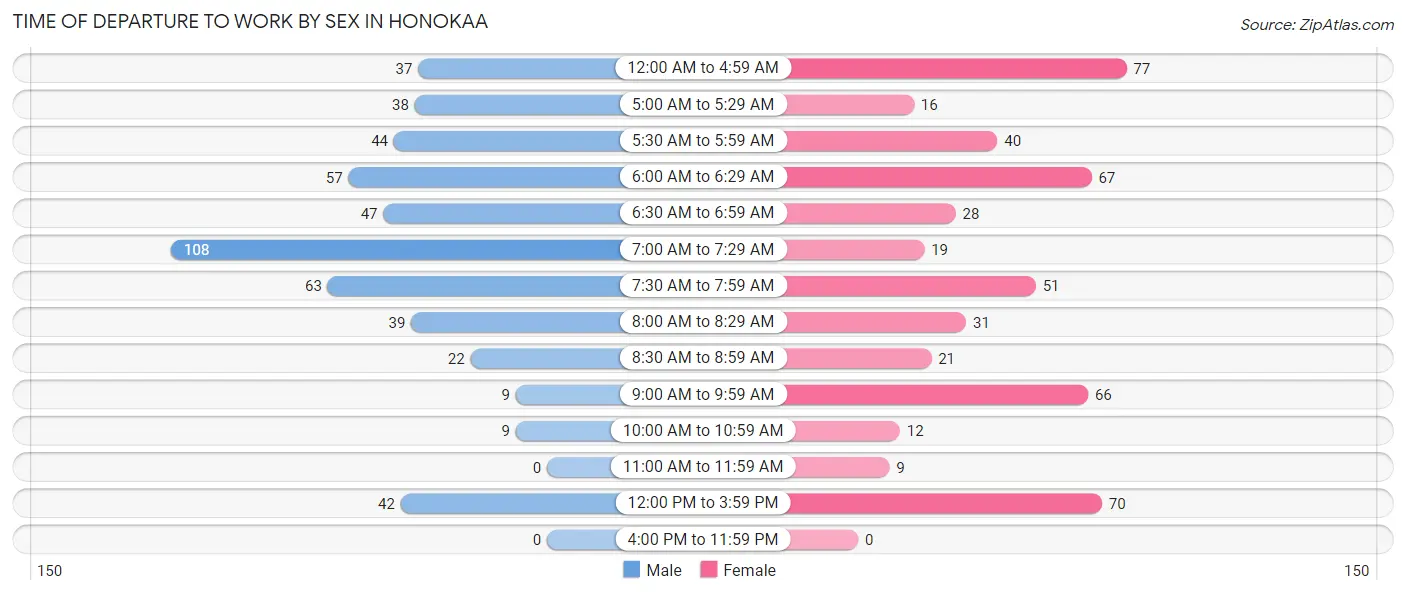
| Time of Departure | Male | Female |
| 12:00 AM to 4:59 AM | 37 (7.2%) | 77 (15.2%) |
| 5:00 AM to 5:29 AM | 38 (7.4%) | 16 (3.2%) |
| 5:30 AM to 5:59 AM | 44 (8.5%) | 40 (7.9%) |
| 6:00 AM to 6:29 AM | 57 (11.1%) | 67 (13.2%) |
| 6:30 AM to 6:59 AM | 47 (9.1%) | 28 (5.5%) |
| 7:00 AM to 7:29 AM | 108 (21.0%) | 19 (3.7%) |
| 7:30 AM to 7:59 AM | 63 (12.2%) | 51 (10.1%) |
| 8:00 AM to 8:29 AM | 39 (7.6%) | 31 (6.1%) |
| 8:30 AM to 8:59 AM | 22 (4.3%) | 21 (4.1%) |
| 9:00 AM to 9:59 AM | 9 (1.8%) | 66 (13.0%) |
| 10:00 AM to 10:59 AM | 9 (1.8%) | 12 (2.4%) |
| 11:00 AM to 11:59 AM | 0 (0.0%) | 9 (1.8%) |
| 12:00 PM to 3:59 PM | 42 (8.2%) | 70 (13.8%) |
| 4:00 PM to 11:59 PM | 0 (0.0%) | 0 (0.0%) |
| Total | 515 (100.0%) | 507 (100.0%) |
Housing Occupancy in Honokaa
Occupancy by Ownership in Honokaa
Of the total 705 dwellings in Honokaa, owner-occupied units account for 512 (72.6%), while renter-occupied units make up 193 (27.4%).
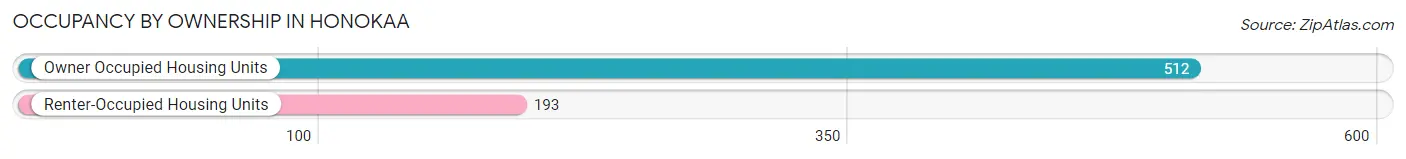
| Occupancy | # Housing Units | % Housing Units |
| Owner Occupied Housing Units | 512 | 72.6% |
| Renter-Occupied Housing Units | 193 | 27.4% |
| Total Occupied Housing Units | 705 | 100.0% |
Occupancy by Household Size in Honokaa
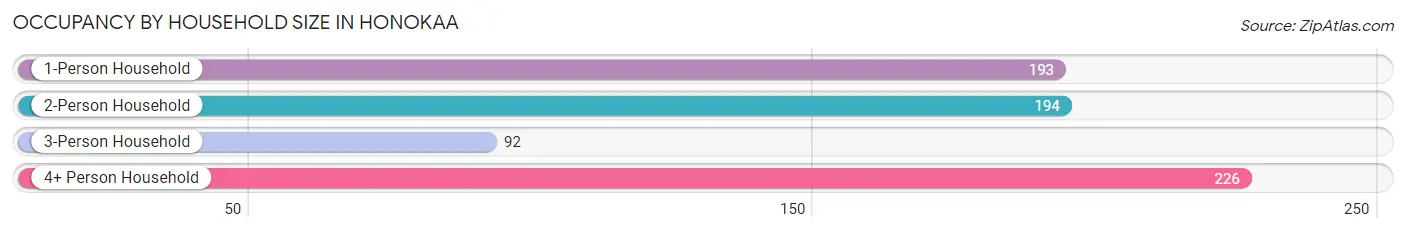
| Household Size | # Housing Units | % Housing Units |
| 1-Person Household | 193 | 27.4% |
| 2-Person Household | 194 | 27.5% |
| 3-Person Household | 92 | 13.1% |
| 4+ Person Household | 226 | 32.1% |
| Total Housing Units | 705 | 100.0% |
Occupancy by Ownership by Household Size in Honokaa
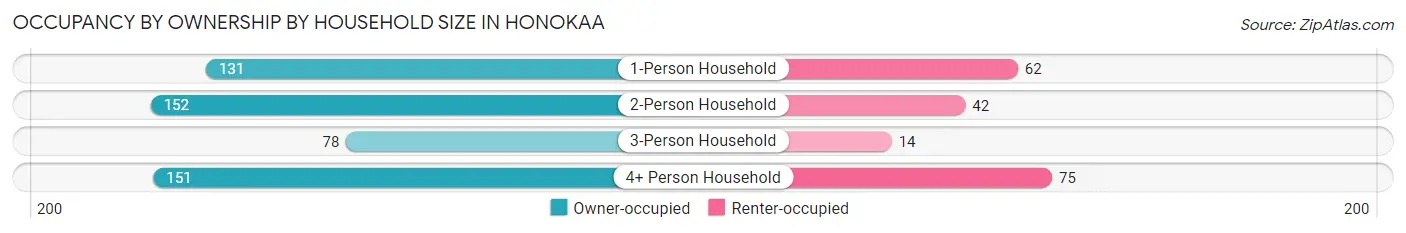
| Household Size | Owner-occupied | Renter-occupied |
| 1-Person Household | 131 (67.9%) | 62 (32.1%) |
| 2-Person Household | 152 (78.3%) | 42 (21.6%) |
| 3-Person Household | 78 (84.8%) | 14 (15.2%) |
| 4+ Person Household | 151 (66.8%) | 75 (33.2%) |
| Total Housing Units | 512 (72.6%) | 193 (27.4%) |
Occupancy by Educational Attainment in Honokaa
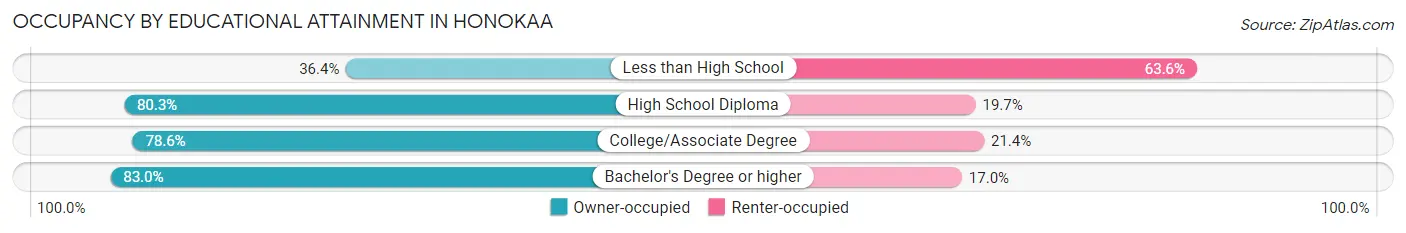
| Household Size | Owner-occupied | Renter-occupied |
| Less than High School | 47 (36.4%) | 82 (63.6%) |
| High School Diploma | 163 (80.3%) | 40 (19.7%) |
| College/Associate Degree | 136 (78.6%) | 37 (21.4%) |
| Bachelor's Degree or higher | 166 (83.0%) | 34 (17.0%) |
Occupancy by Age of Householder in Honokaa
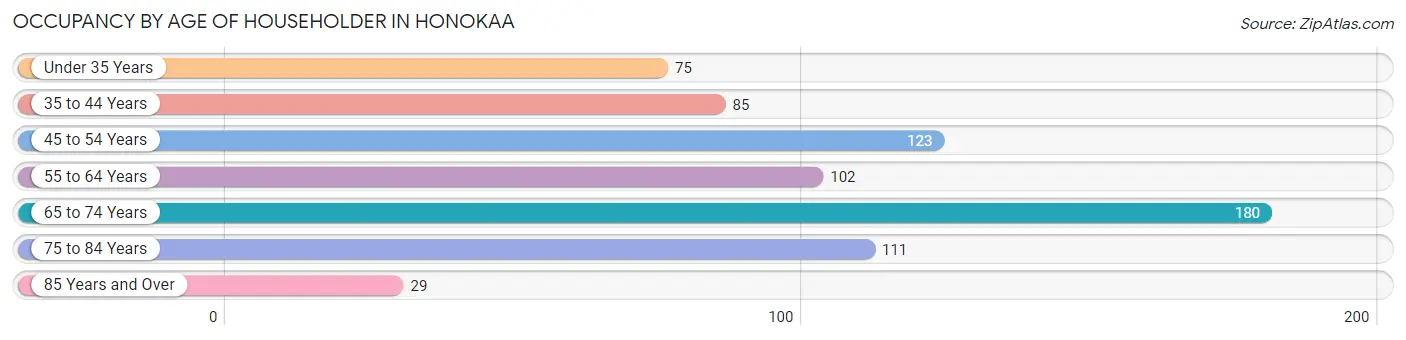
| Age Bracket | # Households | % Households |
| Under 35 Years | 75 | 10.6% |
| 35 to 44 Years | 85 | 12.1% |
| 45 to 54 Years | 123 | 17.4% |
| 55 to 64 Years | 102 | 14.5% |
| 65 to 74 Years | 180 | 25.5% |
| 75 to 84 Years | 111 | 15.7% |
| 85 Years and Over | 29 | 4.1% |
| Total | 705 | 100.0% |
Housing Finances in Honokaa
Median Income by Occupancy in Honokaa
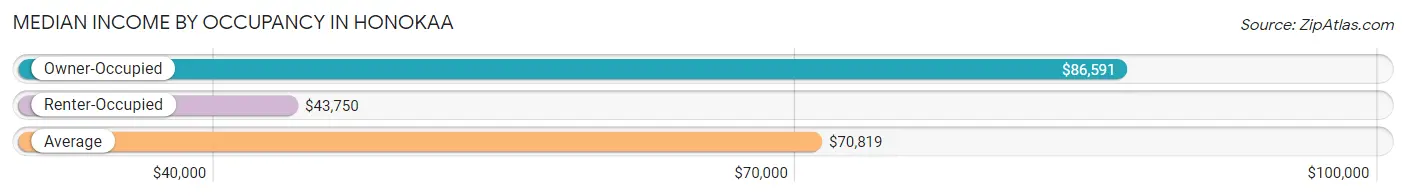
| Occupancy Type | # Households | Median Income |
| Owner-Occupied | 512 (72.6%) | $86,591 |
| Renter-Occupied | 193 (27.4%) | $43,750 |
| Average | 705 (100.0%) | $70,819 |
Occupancy by Householder Income Bracket in Honokaa
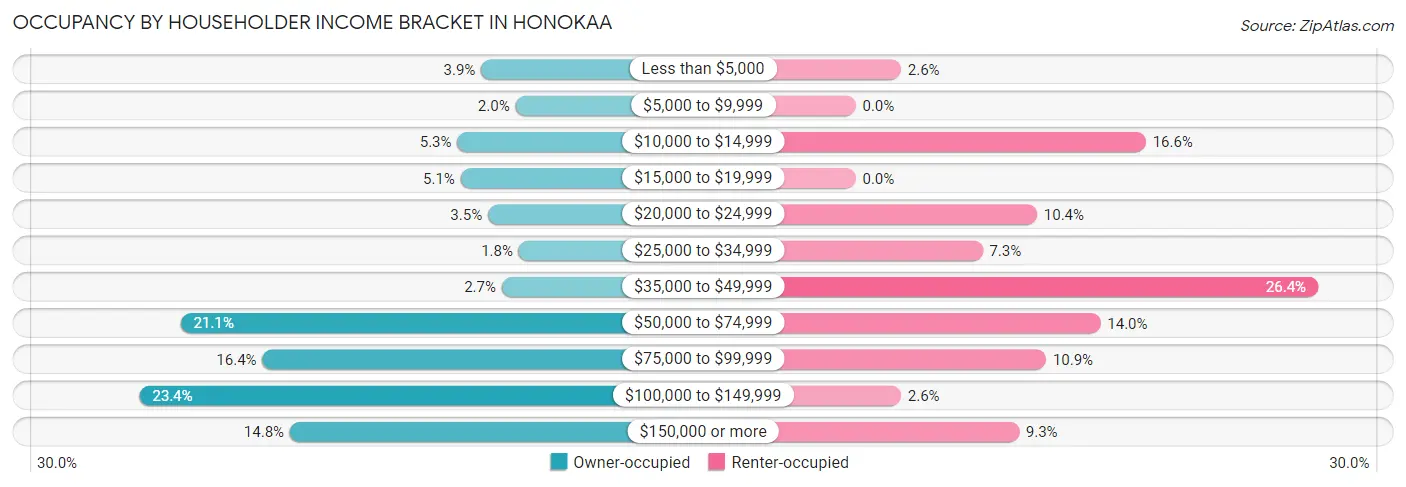
| Income Bracket | Owner-occupied | Renter-occupied |
| Less than $5,000 | 20 (3.9%) | 5 (2.6%) |
| $5,000 to $9,999 | 10 (1.9%) | 0 (0.0%) |
| $10,000 to $14,999 | 27 (5.3%) | 32 (16.6%) |
| $15,000 to $19,999 | 26 (5.1%) | 0 (0.0%) |
| $20,000 to $24,999 | 18 (3.5%) | 20 (10.4%) |
| $25,000 to $34,999 | 9 (1.8%) | 14 (7.2%) |
| $35,000 to $49,999 | 14 (2.7%) | 51 (26.4%) |
| $50,000 to $74,999 | 108 (21.1%) | 27 (14.0%) |
| $75,000 to $99,999 | 84 (16.4%) | 21 (10.9%) |
| $100,000 to $149,999 | 120 (23.4%) | 5 (2.6%) |
| $150,000 or more | 76 (14.8%) | 18 (9.3%) |
| Total | 512 (100.0%) | 193 (100.0%) |
Monthly Housing Cost Tiers in Honokaa
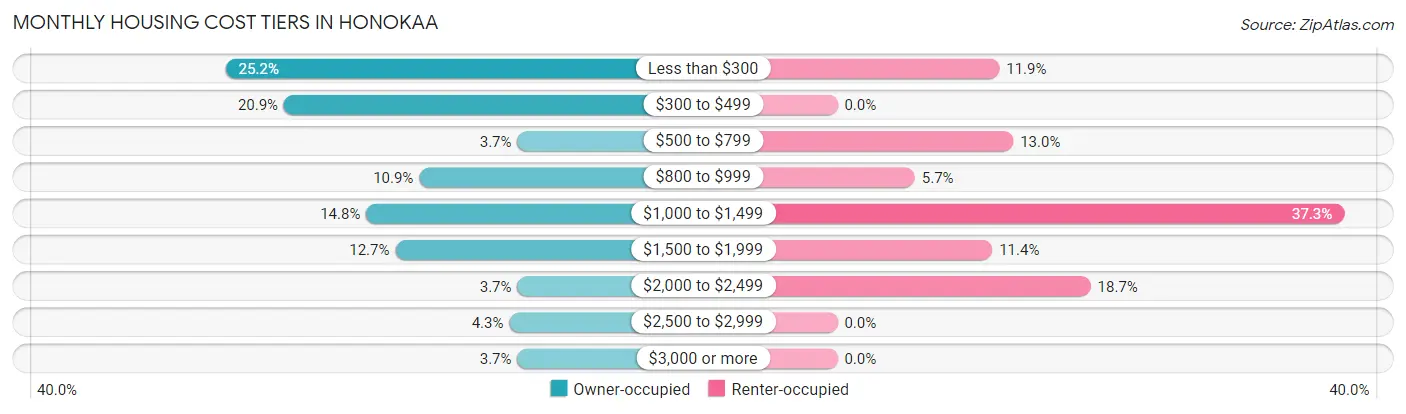
| Monthly Cost | Owner-occupied | Renter-occupied |
| Less than $300 | 129 (25.2%) | 23 (11.9%) |
| $300 to $499 | 107 (20.9%) | 0 (0.0%) |
| $500 to $799 | 19 (3.7%) | 25 (13.0%) |
| $800 to $999 | 56 (10.9%) | 11 (5.7%) |
| $1,000 to $1,499 | 76 (14.8%) | 72 (37.3%) |
| $1,500 to $1,999 | 65 (12.7%) | 22 (11.4%) |
| $2,000 to $2,499 | 19 (3.7%) | 36 (18.6%) |
| $2,500 to $2,999 | 22 (4.3%) | 0 (0.0%) |
| $3,000 or more | 19 (3.7%) | 0 (0.0%) |
| Total | 512 (100.0%) | 193 (100.0%) |
Physical Housing Characteristics in Honokaa
Housing Structures in Honokaa
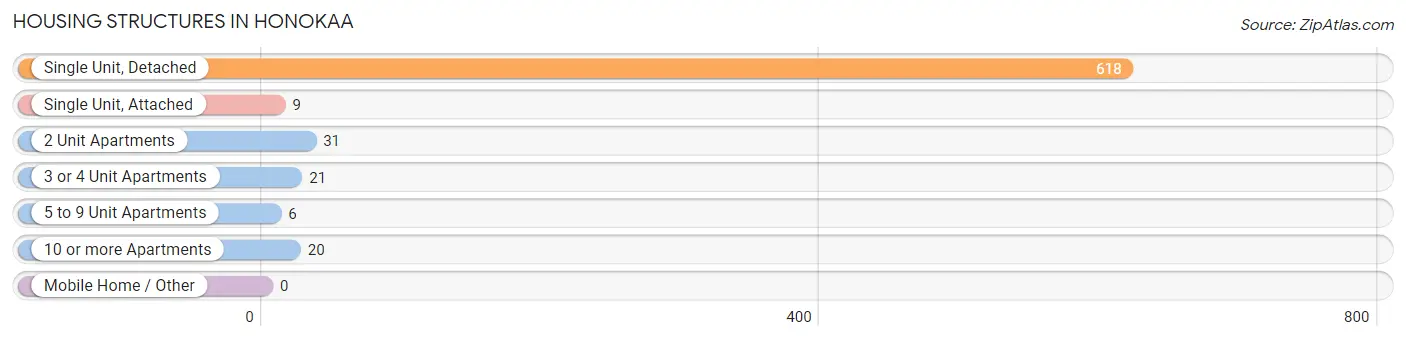
| Structure Type | # Housing Units | % Housing Units |
| Single Unit, Detached | 618 | 87.7% |
| Single Unit, Attached | 9 | 1.3% |
| 2 Unit Apartments | 31 | 4.4% |
| 3 or 4 Unit Apartments | 21 | 3.0% |
| 5 to 9 Unit Apartments | 6 | 0.9% |
| 10 or more Apartments | 20 | 2.8% |
| Mobile Home / Other | 0 | 0.0% |
| Total | 705 | 100.0% |
Housing Structures by Occupancy in Honokaa
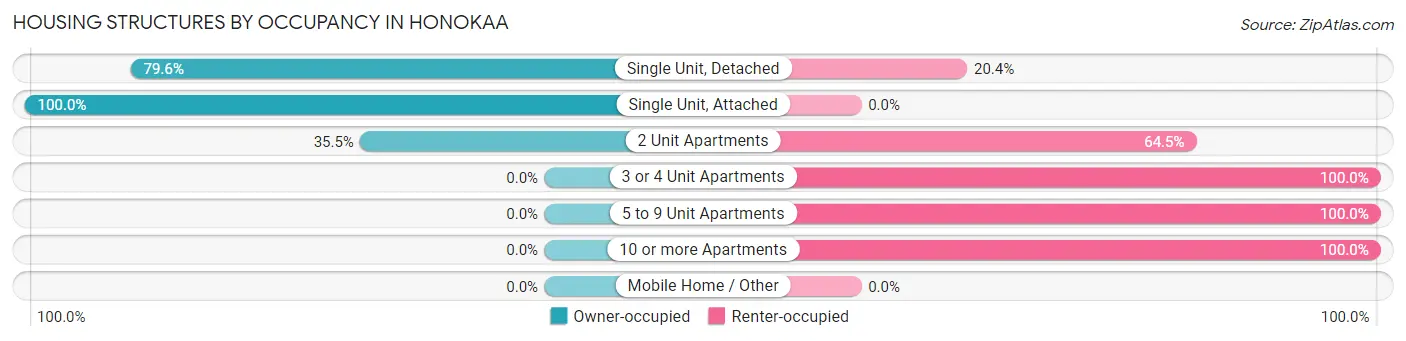
| Structure Type | Owner-occupied | Renter-occupied |
| Single Unit, Detached | 492 (79.6%) | 126 (20.4%) |
| Single Unit, Attached | 9 (100.0%) | 0 (0.0%) |
| 2 Unit Apartments | 11 (35.5%) | 20 (64.5%) |
| 3 or 4 Unit Apartments | 0 (0.0%) | 21 (100.0%) |
| 5 to 9 Unit Apartments | 0 (0.0%) | 6 (100.0%) |
| 10 or more Apartments | 0 (0.0%) | 20 (100.0%) |
| Mobile Home / Other | 0 (0.0%) | 0 (0.0%) |
| Total | 512 (72.6%) | 193 (27.4%) |
Housing Structures by Number of Rooms in Honokaa
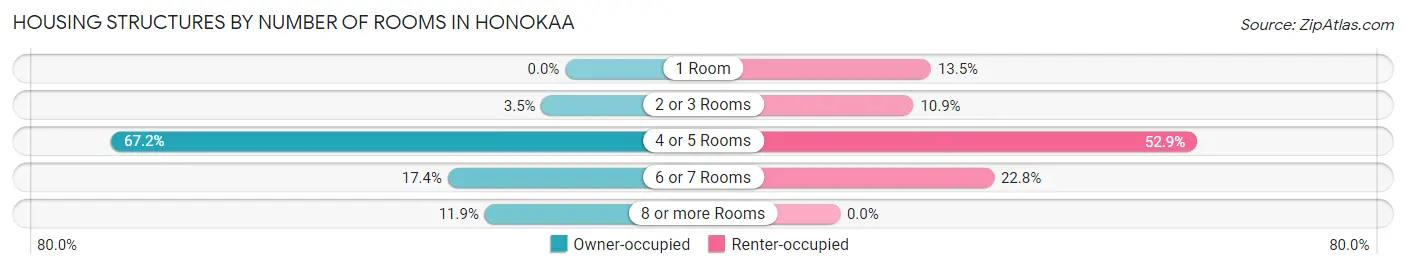
| Number of Rooms | Owner-occupied | Renter-occupied |
| 1 Room | 0 (0.0%) | 26 (13.5%) |
| 2 or 3 Rooms | 18 (3.5%) | 21 (10.9%) |
| 4 or 5 Rooms | 344 (67.2%) | 102 (52.8%) |
| 6 or 7 Rooms | 89 (17.4%) | 44 (22.8%) |
| 8 or more Rooms | 61 (11.9%) | 0 (0.0%) |
| Total | 512 (100.0%) | 193 (100.0%) |
Housing Structure by Heating Type in Honokaa
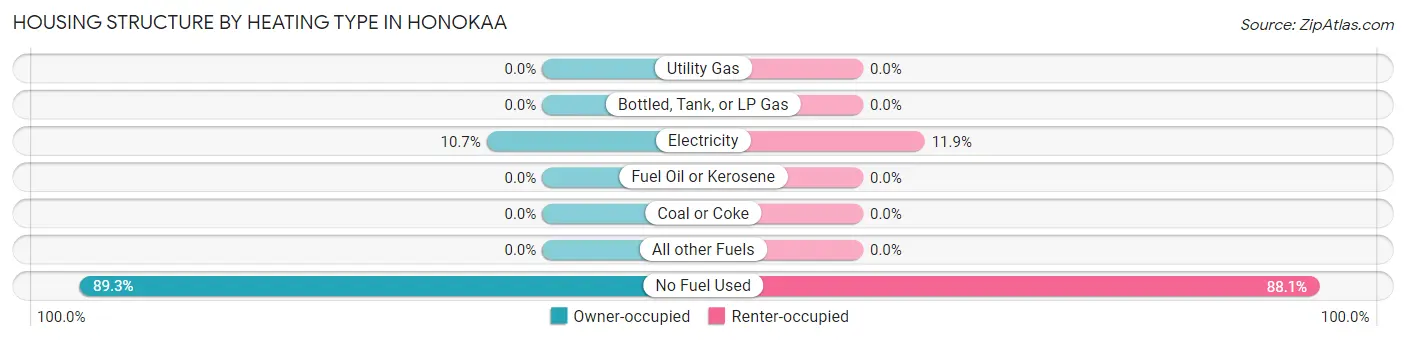
| Heating Type | Owner-occupied | Renter-occupied |
| Utility Gas | 0 (0.0%) | 0 (0.0%) |
| Bottled, Tank, or LP Gas | 0 (0.0%) | 0 (0.0%) |
| Electricity | 55 (10.7%) | 23 (11.9%) |
| Fuel Oil or Kerosene | 0 (0.0%) | 0 (0.0%) |
| Coal or Coke | 0 (0.0%) | 0 (0.0%) |
| All other Fuels | 0 (0.0%) | 0 (0.0%) |
| No Fuel Used | 457 (89.3%) | 170 (88.1%) |
| Total | 512 (100.0%) | 193 (100.0%) |
Household Vehicle Usage in Honokaa
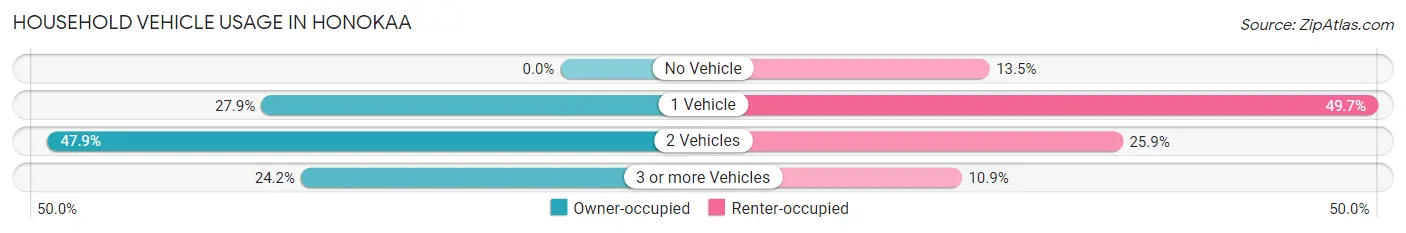
| Vehicles per Household | Owner-occupied | Renter-occupied |
| No Vehicle | 0 (0.0%) | 26 (13.5%) |
| 1 Vehicle | 143 (27.9%) | 96 (49.7%) |
| 2 Vehicles | 245 (47.8%) | 50 (25.9%) |
| 3 or more Vehicles | 124 (24.2%) | 21 (10.9%) |
| Total | 512 (100.0%) | 193 (100.0%) |
Real Estate & Mortgages in Honokaa
Real Estate and Mortgage Overview in Honokaa
| Characteristic | Without Mortgage | With Mortgage |
| Housing Units | 253 | 259 |
| Median Property Value | $513,900 | $483,100 |
| Median Household Income | $56,477 | $50 |
| Monthly Housing Costs | $298 | $19 |
| Real Estate Taxes | $519 | $0 |
Property Value by Mortgage Status in Honokaa
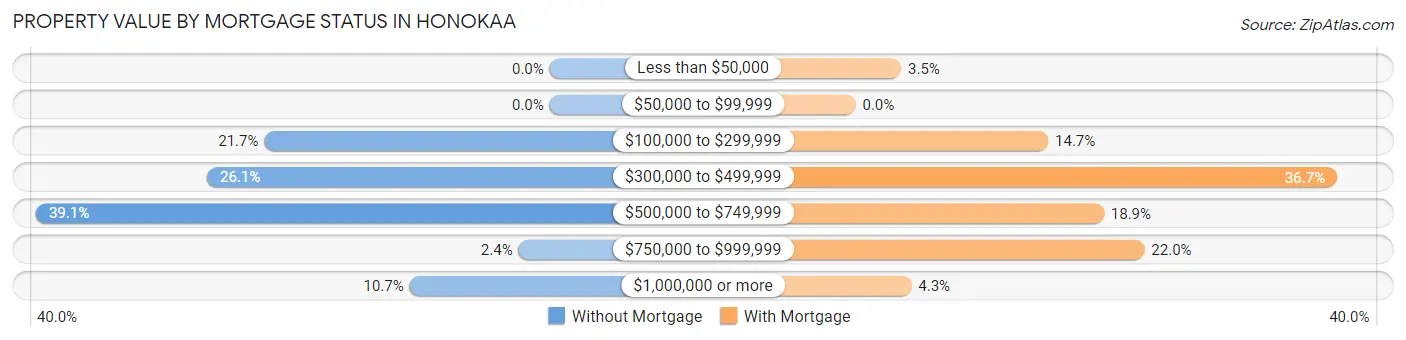
| Property Value | Without Mortgage | With Mortgage |
| Less than $50,000 | 0 (0.0%) | 9 (3.5%) |
| $50,000 to $99,999 | 0 (0.0%) | 0 (0.0%) |
| $100,000 to $299,999 | 55 (21.7%) | 38 (14.7%) |
| $300,000 to $499,999 | 66 (26.1%) | 95 (36.7%) |
| $500,000 to $749,999 | 99 (39.1%) | 49 (18.9%) |
| $750,000 to $999,999 | 6 (2.4%) | 57 (22.0%) |
| $1,000,000 or more | 27 (10.7%) | 11 (4.3%) |
| Total | 253 (100.0%) | 259 (100.0%) |
Household Income by Mortgage Status in Honokaa
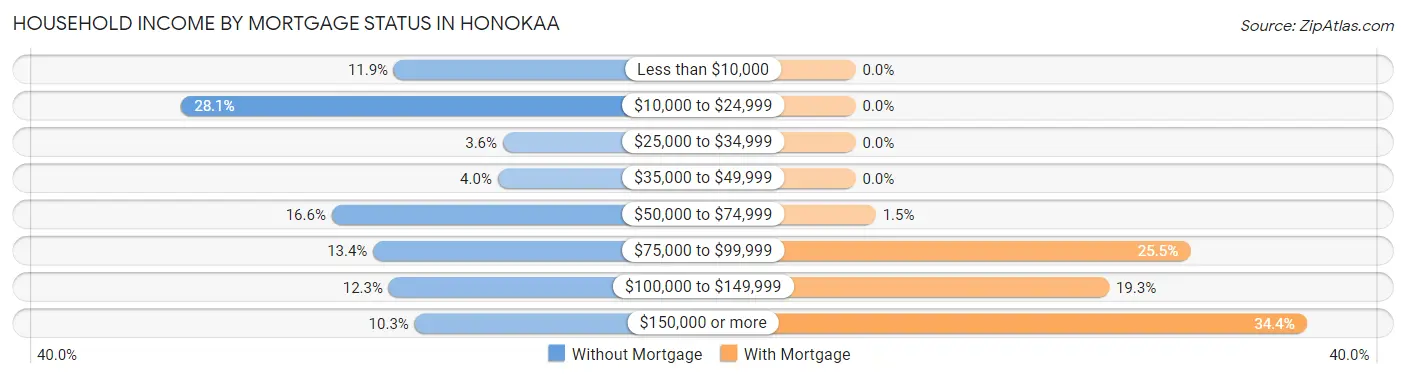
| Household Income | Without Mortgage | With Mortgage |
| Less than $10,000 | 30 (11.9%) | 0 (0.0%) |
| $10,000 to $24,999 | 71 (28.1%) | 0 (0.0%) |
| $25,000 to $34,999 | 9 (3.6%) | 0 (0.0%) |
| $35,000 to $49,999 | 10 (4.0%) | 0 (0.0%) |
| $50,000 to $74,999 | 42 (16.6%) | 4 (1.5%) |
| $75,000 to $99,999 | 34 (13.4%) | 66 (25.5%) |
| $100,000 to $149,999 | 31 (12.2%) | 50 (19.3%) |
| $150,000 or more | 26 (10.3%) | 89 (34.4%) |
| Total | 253 (100.0%) | 259 (100.0%) |
Property Value to Household Income Ratio in Honokaa
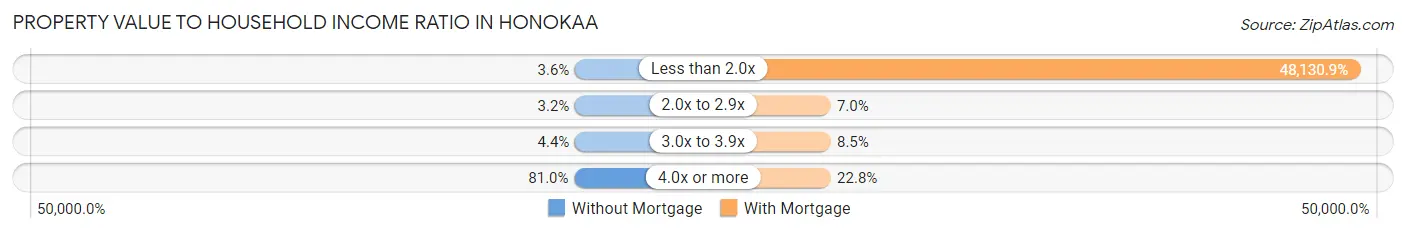
| Value-to-Income Ratio | Without Mortgage | With Mortgage |
| Less than 2.0x | 9 (3.6%) | 124,659 (48,130.9%) |
| 2.0x to 2.9x | 8 (3.2%) | 18 (7.0%) |
| 3.0x to 3.9x | 11 (4.3%) | 22 (8.5%) |
| 4.0x or more | 205 (81.0%) | 59 (22.8%) |
| Total | 253 (100.0%) | 259 (100.0%) |
Real Estate Taxes by Mortgage Status in Honokaa
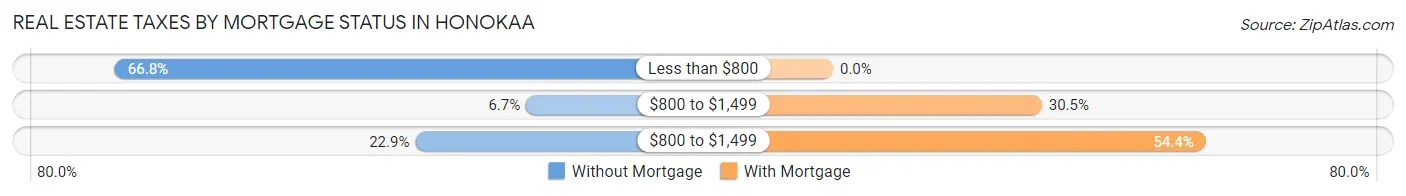
| Property Taxes | Without Mortgage | With Mortgage |
| Less than $800 | 169 (66.8%) | 0 (0.0%) |
| $800 to $1,499 | 17 (6.7%) | 79 (30.5%) |
| $800 to $1,499 | 58 (22.9%) | 141 (54.4%) |
| Total | 253 (100.0%) | 259 (100.0%) |
Health & Disability in Honokaa
Health Insurance Coverage by Age in Honokaa
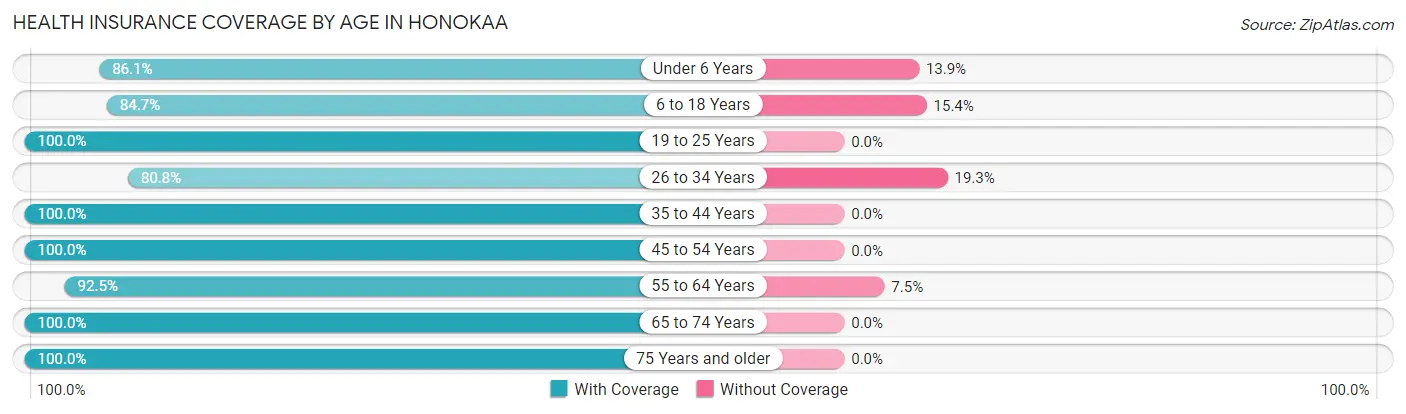
| Age Bracket | With Coverage | Without Coverage |
| Under 6 Years | 136 (86.1%) | 22 (13.9%) |
| 6 to 18 Years | 386 (84.7%) | 70 (15.3%) |
| 19 to 25 Years | 225 (100.0%) | 0 (0.0%) |
| 26 to 34 Years | 130 (80.7%) | 31 (19.3%) |
| 35 to 44 Years | 252 (100.0%) | 0 (0.0%) |
| 45 to 54 Years | 341 (100.0%) | 0 (0.0%) |
| 55 to 64 Years | 198 (92.5%) | 16 (7.5%) |
| 65 to 74 Years | 235 (100.0%) | 0 (0.0%) |
| 75 Years and older | 204 (100.0%) | 0 (0.0%) |
| Total | 2,107 (93.8%) | 139 (6.2%) |
Health Insurance Coverage by Citizenship Status in Honokaa
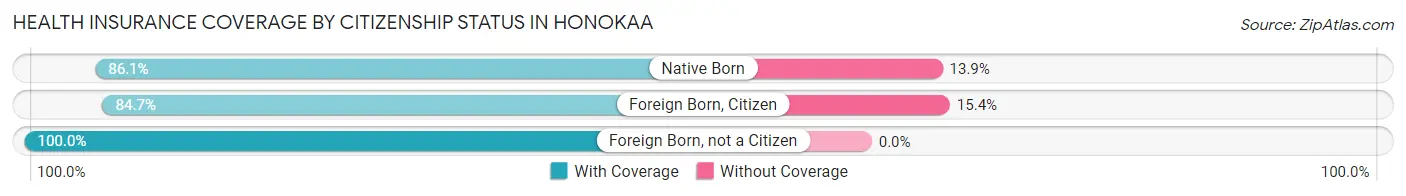
| Citizenship Status | With Coverage | Without Coverage |
| Native Born | 136 (86.1%) | 22 (13.9%) |
| Foreign Born, Citizen | 386 (84.7%) | 70 (15.3%) |
| Foreign Born, not a Citizen | 225 (100.0%) | 0 (0.0%) |
Health Insurance Coverage by Household Income in Honokaa
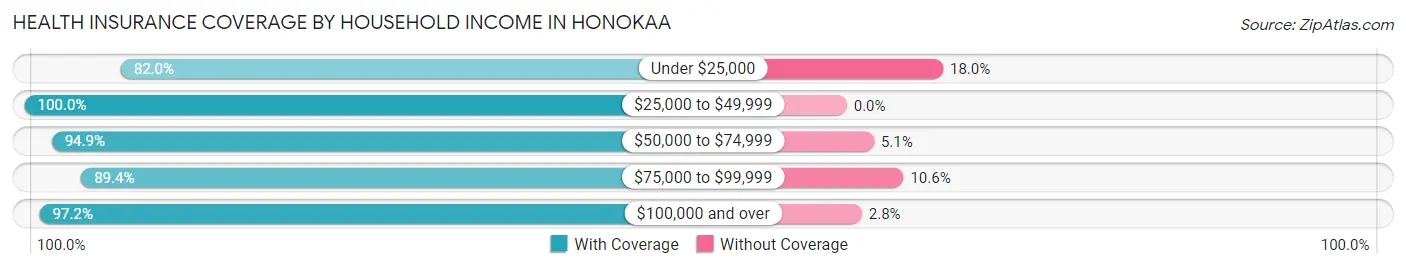
| Household Income | With Coverage | Without Coverage |
| Under $25,000 | 191 (82.0%) | 42 (18.0%) |
| $25,000 to $49,999 | 220 (100.0%) | 0 (0.0%) |
| $50,000 to $74,999 | 317 (94.9%) | 17 (5.1%) |
| $75,000 to $99,999 | 446 (89.4%) | 53 (10.6%) |
| $100,000 and over | 931 (97.2%) | 27 (2.8%) |
Public vs Private Health Insurance Coverage by Age in Honokaa
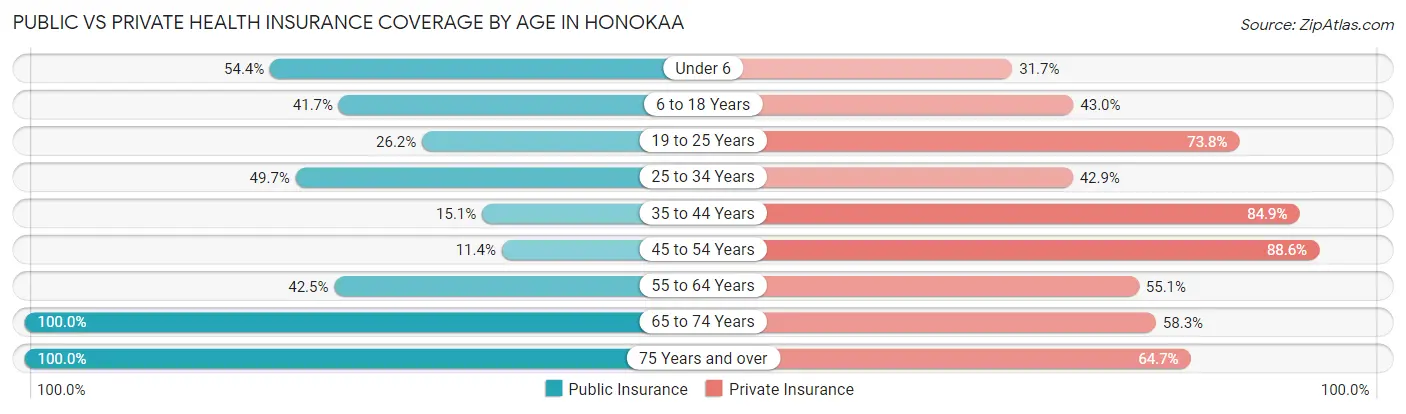
| Age Bracket | Public Insurance | Private Insurance |
| Under 6 | 86 (54.4%) | 50 (31.7%) |
| 6 to 18 Years | 190 (41.7%) | 196 (43.0%) |
| 19 to 25 Years | 59 (26.2%) | 166 (73.8%) |
| 25 to 34 Years | 80 (49.7%) | 69 (42.9%) |
| 35 to 44 Years | 38 (15.1%) | 214 (84.9%) |
| 45 to 54 Years | 39 (11.4%) | 302 (88.6%) |
| 55 to 64 Years | 91 (42.5%) | 118 (55.1%) |
| 65 to 74 Years | 235 (100.0%) | 137 (58.3%) |
| 75 Years and over | 204 (100.0%) | 132 (64.7%) |
| Total | 1,022 (45.5%) | 1,384 (61.6%) |
Disability Status by Sex by Age in Honokaa
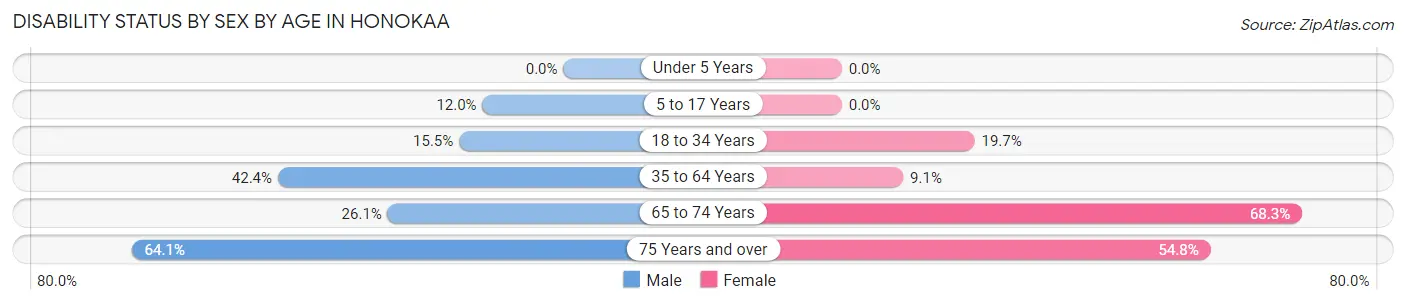
| Age Bracket | Male | Female |
| Under 5 Years | 0 (0.0%) | 0 (0.0%) |
| 5 to 17 Years | 34 (12.0%) | 0 (0.0%) |
| 18 to 34 Years | 24 (15.5%) | 55 (19.7%) |
| 35 to 64 Years | 170 (42.4%) | 37 (9.1%) |
| 65 to 74 Years | 30 (26.1%) | 82 (68.3%) |
| 75 Years and over | 50 (64.1%) | 69 (54.8%) |
Disability Class by Sex by Age in Honokaa
Disability Class: Hearing Difficulty
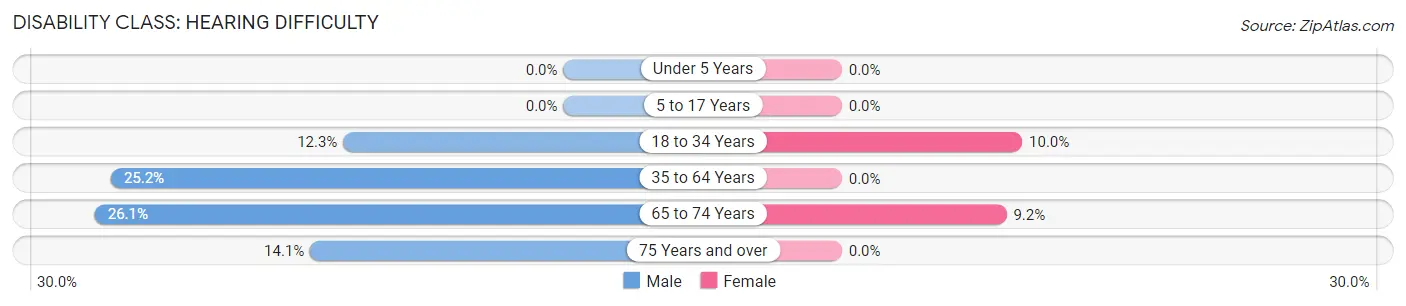
| Age Bracket | Male | Female |
| Under 5 Years | 0 (0.0%) | 0 (0.0%) |
| 5 to 17 Years | 0 (0.0%) | 0 (0.0%) |
| 18 to 34 Years | 19 (12.3%) | 28 (10.0%) |
| 35 to 64 Years | 101 (25.2%) | 0 (0.0%) |
| 65 to 74 Years | 30 (26.1%) | 11 (9.2%) |
| 75 Years and over | 11 (14.1%) | 0 (0.0%) |
Disability Class: Vision Difficulty
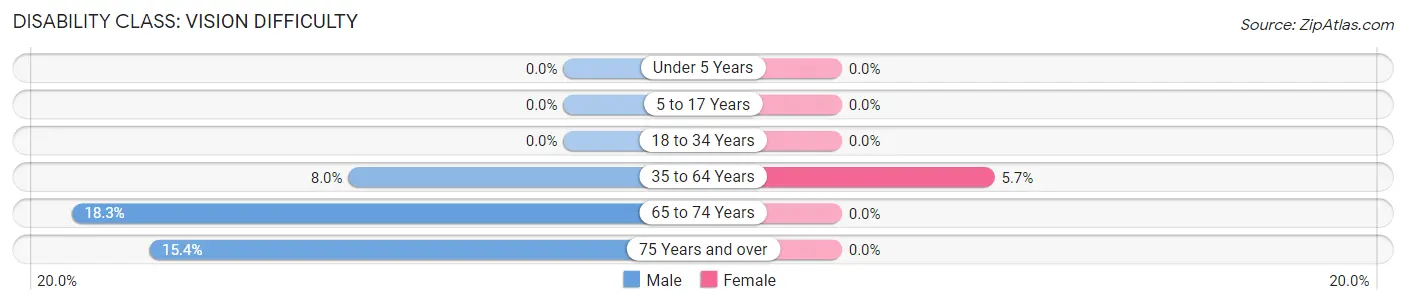
| Age Bracket | Male | Female |
| Under 5 Years | 0 (0.0%) | 0 (0.0%) |
| 5 to 17 Years | 0 (0.0%) | 0 (0.0%) |
| 18 to 34 Years | 0 (0.0%) | 0 (0.0%) |
| 35 to 64 Years | 32 (8.0%) | 23 (5.7%) |
| 65 to 74 Years | 21 (18.3%) | 0 (0.0%) |
| 75 Years and over | 12 (15.4%) | 0 (0.0%) |
Disability Class: Cognitive Difficulty
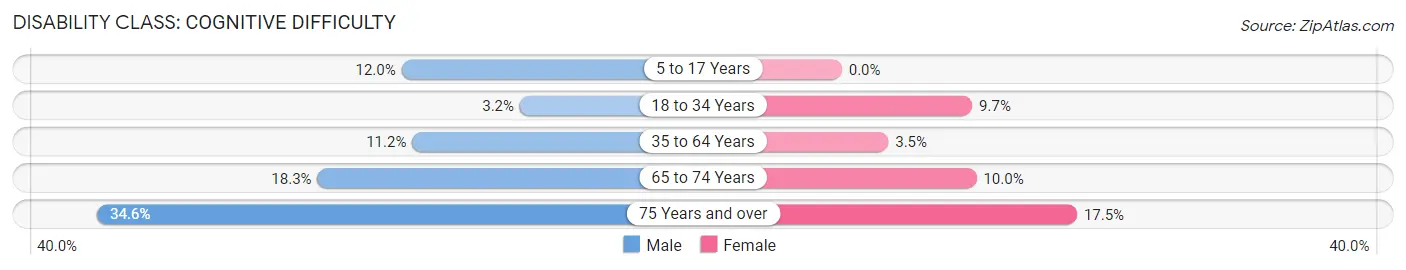
| Age Bracket | Male | Female |
| 5 to 17 Years | 34 (12.0%) | 0 (0.0%) |
| 18 to 34 Years | 5 (3.2%) | 27 (9.7%) |
| 35 to 64 Years | 45 (11.2%) | 14 (3.5%) |
| 65 to 74 Years | 21 (18.3%) | 12 (10.0%) |
| 75 Years and over | 27 (34.6%) | 22 (17.5%) |
Disability Class: Ambulatory Difficulty
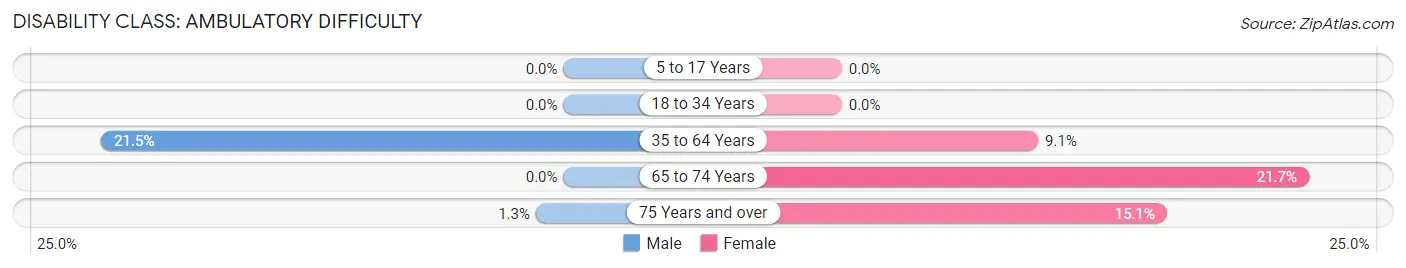
| Age Bracket | Male | Female |
| 5 to 17 Years | 0 (0.0%) | 0 (0.0%) |
| 18 to 34 Years | 0 (0.0%) | 0 (0.0%) |
| 35 to 64 Years | 86 (21.4%) | 37 (9.1%) |
| 65 to 74 Years | 0 (0.0%) | 26 (21.7%) |
| 75 Years and over | 1 (1.3%) | 19 (15.1%) |
Disability Class: Self-Care Difficulty
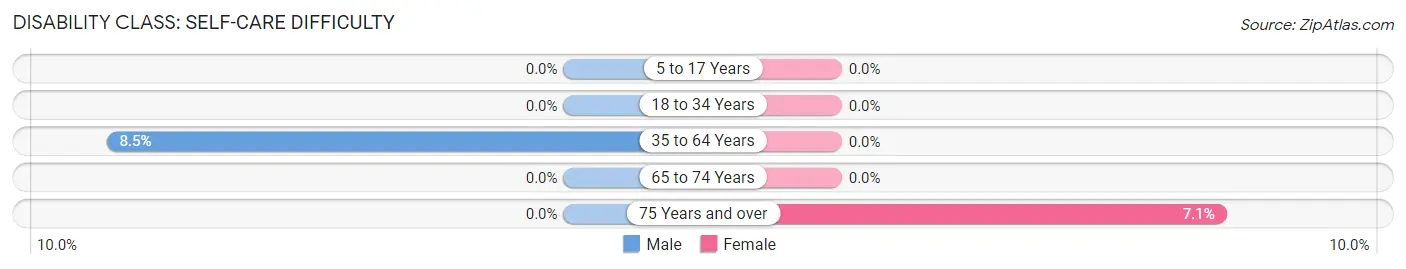
| Age Bracket | Male | Female |
| 5 to 17 Years | 0 (0.0%) | 0 (0.0%) |
| 18 to 34 Years | 0 (0.0%) | 0 (0.0%) |
| 35 to 64 Years | 34 (8.5%) | 0 (0.0%) |
| 65 to 74 Years | 0 (0.0%) | 0 (0.0%) |
| 75 Years and over | 0 (0.0%) | 9 (7.1%) |
Technology Access in Honokaa
Computing Device Access in Honokaa
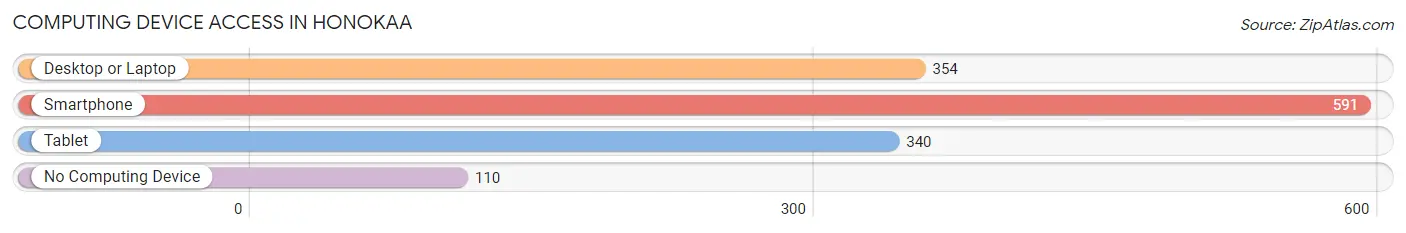
| Device Type | # Households | % Households |
| Desktop or Laptop | 354 | 50.2% |
| Smartphone | 591 | 83.8% |
| Tablet | 340 | 48.2% |
| No Computing Device | 110 | 15.6% |
| Total | 705 | 100.0% |
Internet Access in Honokaa
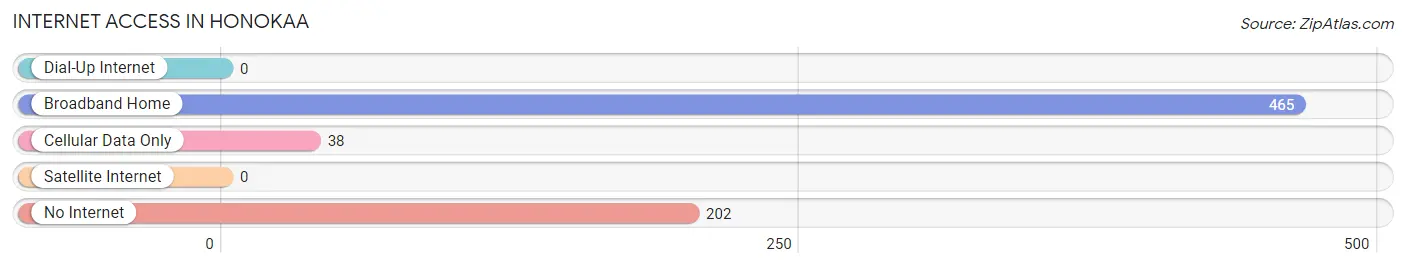
| Internet Type | # Households | % Households |
| Dial-Up Internet | 0 | 0.0% |
| Broadband Home | 465 | 66.0% |
| Cellular Data Only | 38 | 5.4% |
| Satellite Internet | 0 | 0.0% |
| No Internet | 202 | 28.6% |
| Total | 705 | 100.0% |
Honokaa Summary
Honokaa is a small town located on the Big Island of Hawaii. It is situated in the Hamakua District, about 25 miles north of Hilo. The town is known for its rich history, diverse geography, and vibrant economy.
History
Honokaa has a long and rich history. The area was first settled by Polynesian voyagers in the late 1700s. They established a small fishing village and named it Honokaa, which means “bay of the sun” in Hawaiian. The town grew slowly over the next century, and by the late 1800s, it had become a bustling port town. During this time, Honokaa was a major hub for the sugar industry, and the town was home to several large sugar plantations.
In the early 1900s, Honokaa began to experience a decline in the sugar industry. This led to a period of economic hardship for the town. However, in the mid-1900s, the town experienced a resurgence in the economy. This was due to the development of the Honokaa-Waipio Valley Road, which connected the town to the rest of the island. This allowed for increased tourism and commerce, and the town began to thrive once again.
Geography
Honokaa is located in the Hamakua District of the Big Island of Hawaii. The town is situated in a lush, tropical valley, surrounded by mountains and lush vegetation. The town is located at an elevation of about 1,000 feet, and the climate is mild and pleasant year-round.
The town is home to several rivers, including the Honokaa River, which flows through the town and into the Pacific Ocean. The town is also home to several waterfalls, including the Hiilawe Falls, which is one of the tallest waterfalls in Hawaii.
Economy
Honokaa’s economy is largely based on tourism and agriculture. The town is home to several tourist attractions, including the Honokaa Cultural Center, which showcases the town’s history and culture. The town is also home to several farms, which produce a variety of fruits and vegetables.
The town is also home to several small businesses, including restaurants, shops, and galleries. The town is also home to several small manufacturing companies, which produce a variety of products, including furniture and clothing.
Demographics
As of the 2010 census, the population of Honokaa was 2,845. The town is home to a diverse population, with people of various ethnic backgrounds, including Native Hawaiian, Filipino, Japanese, and Caucasian. The town is also home to a large number of retirees, as well as a growing number of young professionals.
Honokaa is a vibrant and diverse town, with a rich history, diverse geography, and vibrant economy. The town is home to a diverse population, and is a great place to live, work, and visit.
Common Questions
What is the Total Population of Honokaa?
Total Population of Honokaa is 2,290.
What is the Total Male Population of Honokaa?
Total Male Population of Honokaa is 1,139.
What is the Total Female Population of Honokaa?
Total Female Population of Honokaa is 1,151.
What is the Ratio of Males per 100 Females in Honokaa?
There are 98.96 Males per 100 Females in Honokaa.
What is the Ratio of Females per 100 Males in Honokaa?
There are 101.05 Females per 100 Males in Honokaa.
What is the Median Population Age in Honokaa?
Median Population Age in Honokaa is 40.8 Years.
What is the Average Family Size in Honokaa
Average Family Size in Honokaa is 3.8 People.
What is the Average Household Size in Honokaa
Average Household Size in Honokaa is 3.2 People.
What is Per Capita Income in Honokaa?
Per Capita income in Honokaa is $28,258.
What is the Median Family Income in Honokaa?
Median Family Income in Honokaa is $87,500.
What is the Median Household income in Honokaa?
Median Household Income in Honokaa is $70,819.
What is Income or Wage Gap in Honokaa?
Income or Wage Gap in Honokaa is 34.4%.
Women in Honokaa earn 65.6 cents for every dollar earned by a man.
What is Inequality or Gini Index in Honokaa?
Inequality or Gini Index in Honokaa is 0.42.
How Large is the Labor Force in Honokaa?
There are 1,103 People in the Labor Forcein in Honokaa.
What is the Percentage of People in the Labor Force in Honokaa?
61.1% of People are in the Labor Force in Honokaa.
What is the Unemployment Rate in Honokaa?
Unemployment Rate in Honokaa is 4.7%.