Leilani Estates, HI
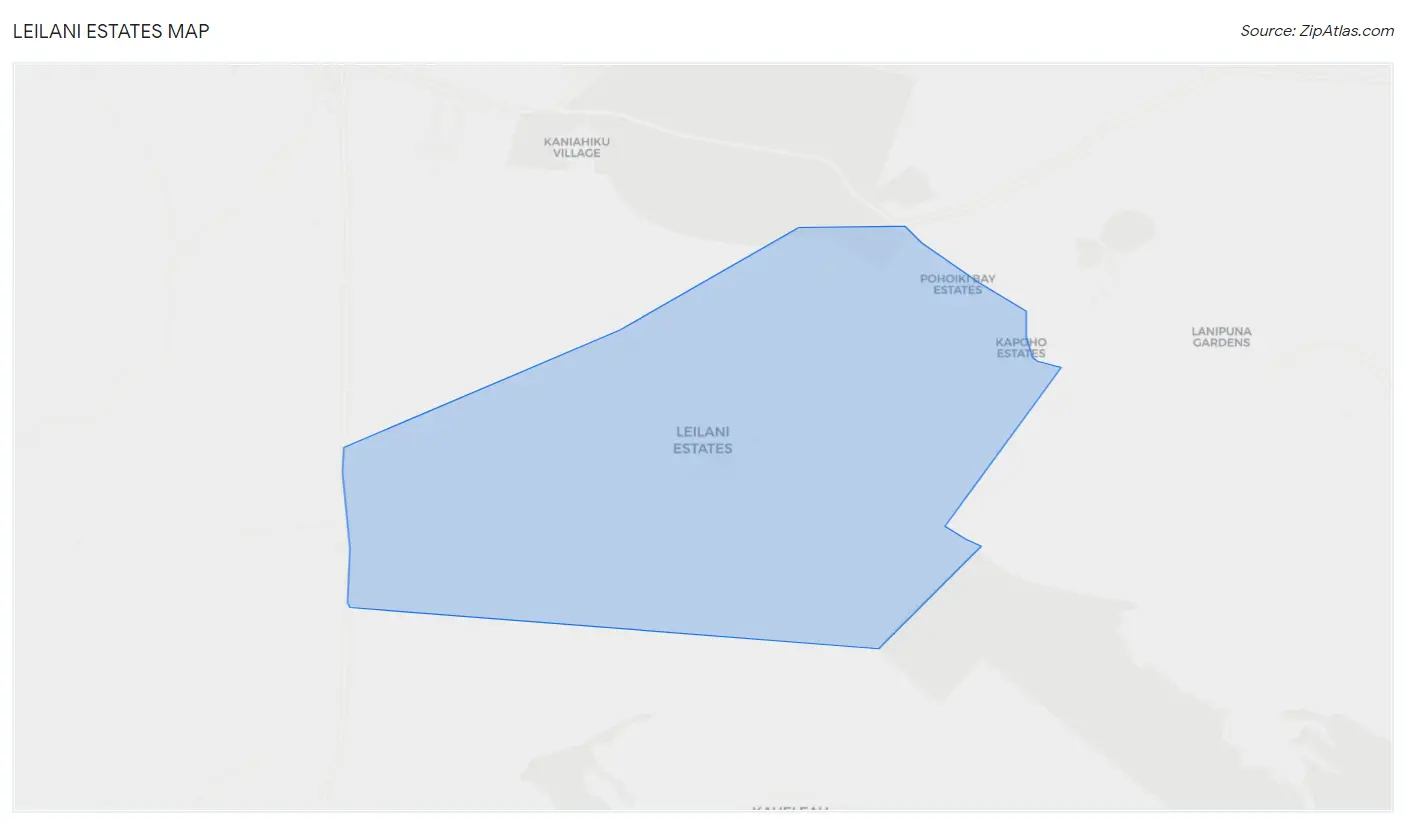
Leilani Estates Map
Leilani Estates Overview
1,611
TOTAL POPULATION
1,021
MALE POPULATION
590
FEMALE POPULATION
173.05
MALES / 100 FEMALES
57.79
FEMALES / 100 MALES
49.3
MEDIAN AGE
3.1
AVG FAMILY SIZE
2.3
AVG HOUSEHOLD SIZE
$24,787
PER CAPITA INCOME
$36,726
AVG FAMILY INCOME
$23,750
AVG HOUSEHOLD INCOME
36.4%
WAGE / INCOME GAP [ % ]
63.6¢/ $1
WAGE / INCOME GAP [ $ ]
0.56
INEQUALITY / GINI INDEX
687
LABOR FORCE [ PEOPLE ]
53.3%
PERCENT IN LABOR FORCE
19.2%
UNEMPLOYMENT RATE
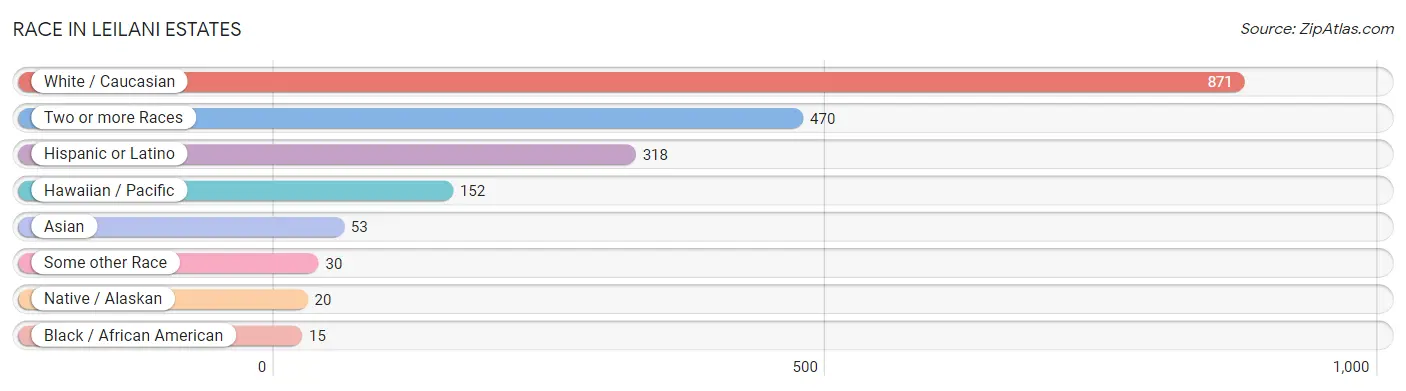
Race in Leilani Estates
The most populous races in Leilani Estates are White / Caucasian (871 | 54.1%), Two or more Races (470 | 29.2%), and Hispanic or Latino (318 | 19.7%).
| Race | # Population | % Population |
| Asian | 53 | 3.3% |
| Black / African American | 15 | 0.9% |
| Hawaiian / Pacific | 152 | 9.4% |
| Hispanic or Latino | 318 | 19.7% |
| Native / Alaskan | 20 | 1.2% |
| White / Caucasian | 871 | 54.1% |
| Two or more Races | 470 | 29.2% |
| Some other Race | 30 | 1.9% |
| Total | 1,611 | 100.0% |
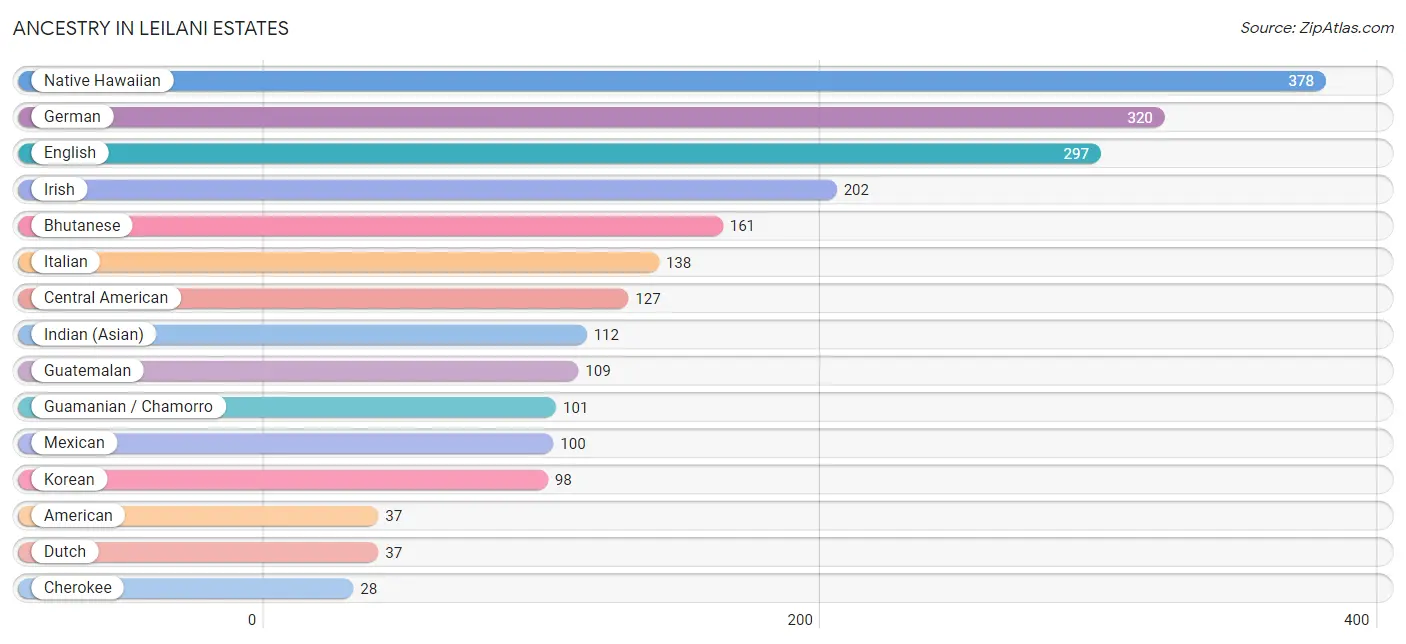
Ancestry in Leilani Estates
The most populous ancestries reported in Leilani Estates are Native Hawaiian (378 | 23.5%), German (320 | 19.9%), English (297 | 18.4%), Irish (202 | 12.5%), and Bhutanese (161 | 10.0%), together accounting for 84.3% of all Leilani Estates residents.
| Ancestry | # Population | % Population |
| American | 37 | 2.3% |
| Apache | 13 | 0.8% |
| Arab | 13 | 0.8% |
| Austrian | 4 | 0.3% |
| Bhutanese | 161 | 10.0% |
| Blackfeet | 4 | 0.3% |
| Canadian | 8 | 0.5% |
| Central American | 127 | 7.9% |
| Central American Indian | 6 | 0.4% |
| Cherokee | 28 | 1.7% |
| Chickasaw | 6 | 0.4% |
| Chilean | 16 | 1.0% |
| Cuban | 18 | 1.1% |
| Czechoslovakian | 2 | 0.1% |
| Danish | 9 | 0.6% |
| Dutch | 37 | 2.3% |
| Eastern European | 12 | 0.7% |
| English | 297 | 18.4% |
| European | 21 | 1.3% |
| French | 19 | 1.2% |
| German | 320 | 19.9% |
| Greek | 5 | 0.3% |
| Guamanian / Chamorro | 101 | 6.3% |
| Guatemalan | 109 | 6.8% |
| Indian (Asian) | 112 | 7.0% |
| Iranian | 4 | 0.3% |
| Irish | 202 | 12.5% |
| Italian | 138 | 8.6% |
| Jamaican | 4 | 0.3% |
| Korean | 98 | 6.1% |
| Lithuanian | 4 | 0.3% |
| Mexican | 100 | 6.2% |
| Native Hawaiian | 378 | 23.5% |
| Navajo | 14 | 0.9% |
| Northern European | 5 | 0.3% |
| Norwegian | 16 | 1.0% |
| Pakistani | 8 | 0.5% |
| Polish | 27 | 1.7% |
| Portuguese | 17 | 1.1% |
| Puerto Rican | 24 | 1.5% |
| Russian | 11 | 0.7% |
| Salvadoran | 18 | 1.1% |
| Scandinavian | 7 | 0.4% |
| Scotch-Irish | 12 | 0.7% |
| Scottish | 13 | 0.8% |
| Sioux | 2 | 0.1% |
| Slovene | 6 | 0.4% |
| South American | 16 | 1.0% |
| Spanish | 16 | 1.0% |
| Sri Lankan | 4 | 0.3% |
| Swedish | 11 | 0.7% |
| Swiss | 5 | 0.3% |
| Syrian | 13 | 0.8% |
| Ukrainian | 12 | 0.7% |
| Welsh | 8 | 0.5% | View All 55 Rows |
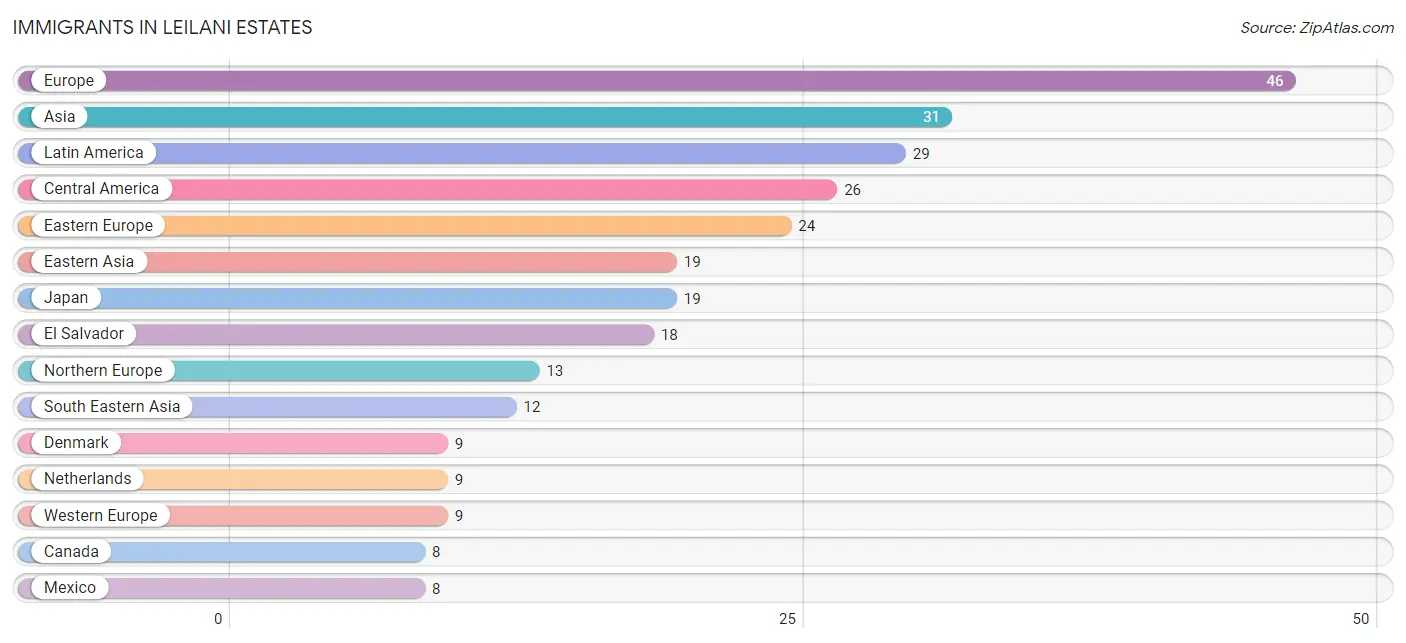
Immigrants in Leilani Estates
The most numerous immigrant groups reported in Leilani Estates came from Europe (46 | 2.9%), Asia (31 | 1.9%), Latin America (29 | 1.8%), Central America (26 | 1.6%), and Eastern Europe (24 | 1.5%), together accounting for 9.7% of all Leilani Estates residents.
| Immigration Origin | # Population | % Population |
| Asia | 31 | 1.9% |
| Canada | 8 | 0.5% |
| Central America | 26 | 1.6% |
| Czechoslovakia | 4 | 0.3% |
| Denmark | 9 | 0.6% |
| Eastern Asia | 19 | 1.2% |
| Eastern Europe | 24 | 1.5% |
| El Salvador | 18 | 1.1% |
| England | 4 | 0.3% |
| Europe | 46 | 2.9% |
| Japan | 19 | 1.2% |
| Latin America | 29 | 1.8% |
| Mexico | 8 | 0.5% |
| Micronesia | 6 | 0.4% |
| Netherlands | 9 | 0.6% |
| Northern Europe | 13 | 0.8% |
| Oceania | 6 | 0.4% |
| Poland | 8 | 0.5% |
| Russia | 8 | 0.5% |
| South America | 3 | 0.2% |
| South Eastern Asia | 12 | 0.7% |
| Thailand | 8 | 0.5% |
| Ukraine | 4 | 0.3% |
| Venezuela | 3 | 0.2% |
| Vietnam | 4 | 0.3% |
| Western Europe | 9 | 0.6% | View All 26 Rows |
Sex and Age in Leilani Estates
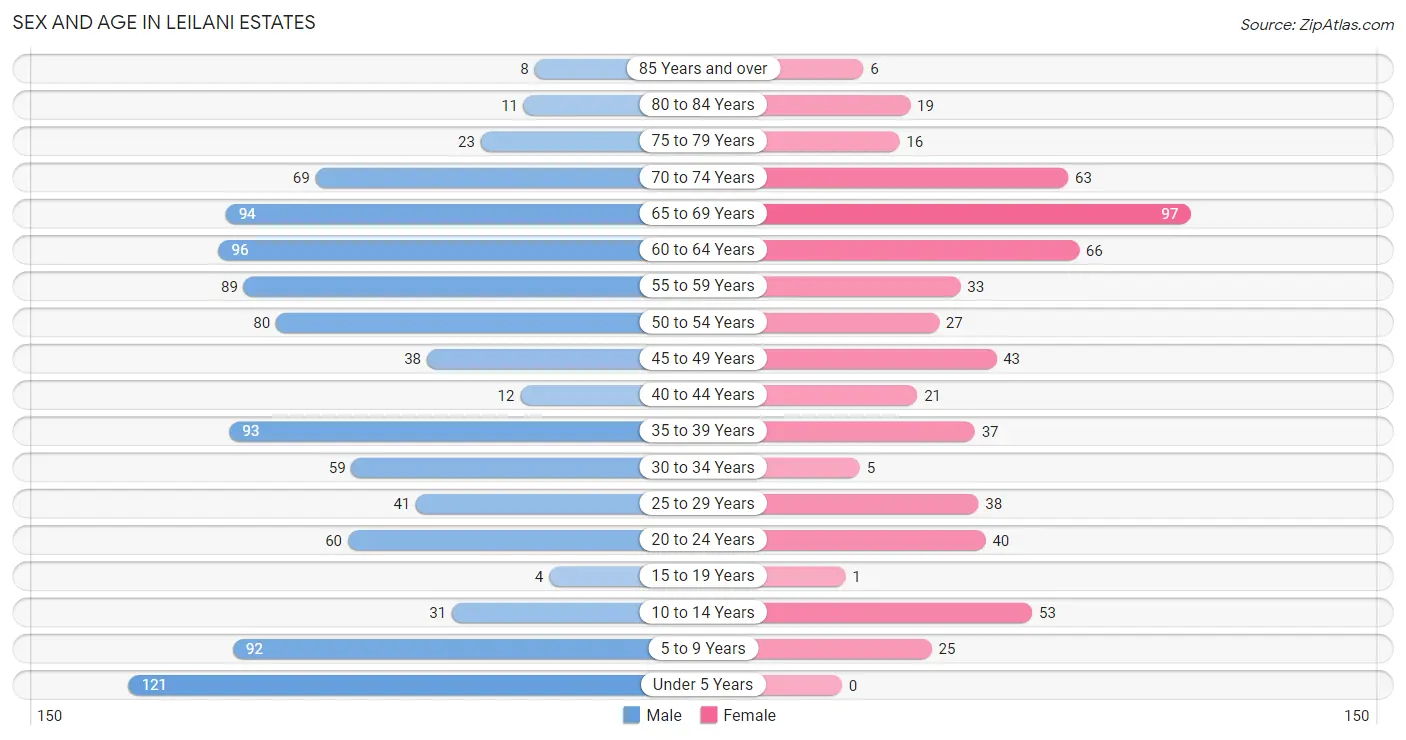
Sex and Age in Leilani Estates
The most populous age groups in Leilani Estates are Under 5 Years (121 | 11.8%) for men and 65 to 69 Years (97 | 16.4%) for women.
| Age Bracket | Male | Female |
| Under 5 Years | 121 (11.8%) | 0 (0.0%) |
| 5 to 9 Years | 92 (9.0%) | 25 (4.2%) |
| 10 to 14 Years | 31 (3.0%) | 53 (9.0%) |
| 15 to 19 Years | 4 (0.4%) | 1 (0.2%) |
| 20 to 24 Years | 60 (5.9%) | 40 (6.8%) |
| 25 to 29 Years | 41 (4.0%) | 38 (6.4%) |
| 30 to 34 Years | 59 (5.8%) | 5 (0.9%) |
| 35 to 39 Years | 93 (9.1%) | 37 (6.3%) |
| 40 to 44 Years | 12 (1.2%) | 21 (3.6%) |
| 45 to 49 Years | 38 (3.7%) | 43 (7.3%) |
| 50 to 54 Years | 80 (7.8%) | 27 (4.6%) |
| 55 to 59 Years | 89 (8.7%) | 33 (5.6%) |
| 60 to 64 Years | 96 (9.4%) | 66 (11.2%) |
| 65 to 69 Years | 94 (9.2%) | 97 (16.4%) |
| 70 to 74 Years | 69 (6.8%) | 63 (10.7%) |
| 75 to 79 Years | 23 (2.2%) | 16 (2.7%) |
| 80 to 84 Years | 11 (1.1%) | 19 (3.2%) |
| 85 Years and over | 8 (0.8%) | 6 (1.0%) |
| Total | 1,021 (100.0%) | 590 (100.0%) |
Families and Households in Leilani Estates
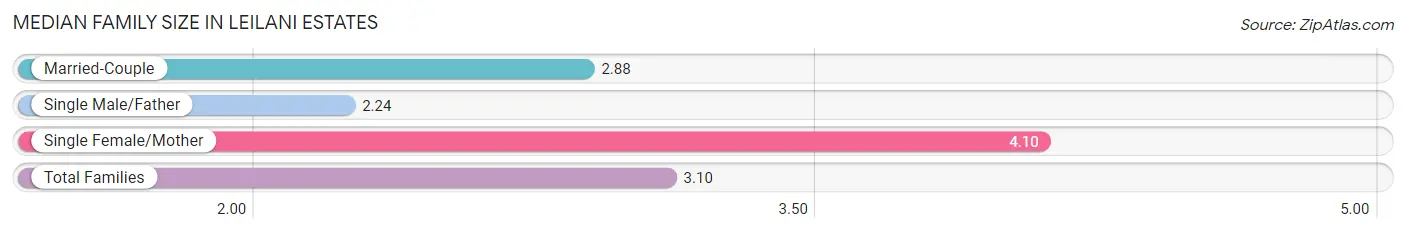
Median Family Size in Leilani Estates
The median family size in Leilani Estates is 3.10 persons per family, with single female/mother families (82 | 23.9%) accounting for the largest median family size of 4.1 persons per family. On the other hand, single male/father families (38 | 11.1%) represent the smallest median family size with 2.24 persons per family.
| Family Type | # Families | Family Size |
| Married-Couple | 223 (65.0%) | 2.88 |
| Single Male/Father | 38 (11.1%) | 2.24 |
| Single Female/Mother | 82 (23.9%) | 4.10 |
| Total Families | 343 (100.0%) | 3.10 |
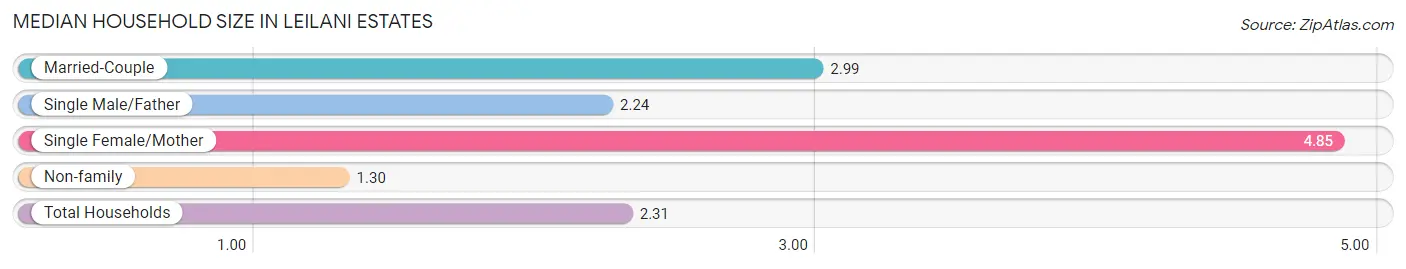
Median Household Size in Leilani Estates
The median household size in Leilani Estates is 2.31 persons per household, with single female/mother households (82 | 11.8%) accounting for the largest median household size of 4.85 persons per household. non-family households (354 | 50.8%) represent the smallest median household size with 1.30 persons per household.
| Household Type | # Households | Household Size |
| Married-Couple | 223 (32.0%) | 2.99 |
| Single Male/Father | 38 (5.4%) | 2.24 |
| Single Female/Mother | 82 (11.8%) | 4.85 |
| Non-family | 354 (50.8%) | 1.30 |
| Total Households | 697 (100.0%) | 2.31 |
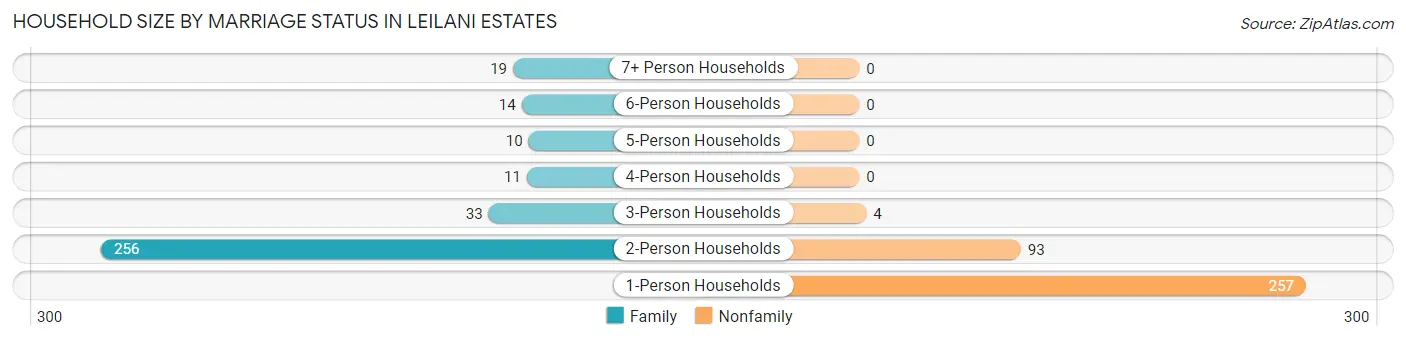
Household Size by Marriage Status in Leilani Estates
Out of a total of 697 households in Leilani Estates, 343 (49.2%) are family households, while 354 (50.8%) are nonfamily households. The most numerous type of family households are 2-person households, comprising 256, and the most common type of nonfamily households are 1-person households, comprising 257.
| Household Size | Family Households | Nonfamily Households |
| 1-Person Households | - | 257 (36.9%) |
| 2-Person Households | 256 (36.7%) | 93 (13.3%) |
| 3-Person Households | 33 (4.7%) | 4 (0.6%) |
| 4-Person Households | 11 (1.6%) | 0 (0.0%) |
| 5-Person Households | 10 (1.4%) | 0 (0.0%) |
| 6-Person Households | 14 (2.0%) | 0 (0.0%) |
| 7+ Person Households | 19 (2.7%) | 0 (0.0%) |
| Total | 343 (49.2%) | 354 (50.8%) |
Female Fertility in Leilani Estates
Fertility by Age in Leilani Estates
| Age Bracket | Women with Births | Births / 1,000 Women |
| 15 to 19 years | 0 (0.0%) | 0.0 |
| 20 to 34 years | 0 (0.0%) | 0.0 |
| 35 to 50 years | 0 (0.0%) | 0.0 |
| Total | 0 (0.0%) | 0.0 |
Fertility by Age by Marriage Status in Leilani Estates
| Age Bracket | Married | Unmarried |
| 15 to 19 years | 0 (0.0%) | 0 (0.0%) |
| 20 to 34 years | 0 (0.0%) | 0 (0.0%) |
| 35 to 50 years | 0 (0.0%) | 0 (0.0%) |
| Total | 0 (0.0%) | 0 (0.0%) |
Fertility by Education in Leilani Estates
| Educational Attainment | Women with Births | Births / 1,000 Women |
| Less than High School | 0 (0.0%) | 0.0 |
| High School Diploma | 0 (0.0%) | 0.0 |
| College or Associate's Degree | 0 (0.0%) | 0.0 |
| Bachelor's Degree | 0 (0.0%) | 0.0 |
| Graduate Degree | 0 (0.0%) | 0.0 |
| Total | 0 (0.0%) | 0.0 |
Fertility by Education by Marriage Status in Leilani Estates
| Educational Attainment | Married | Unmarried |
| Less than High School | 0 (0.0%) | 0 (0.0%) |
| High School Diploma | 0 (0.0%) | 0 (0.0%) |
| College or Associate's Degree | 0 (0.0%) | 0 (0.0%) |
| Bachelor's Degree | 0 (0.0%) | 0 (0.0%) |
| Graduate Degree | 0 (0.0%) | 0 (0.0%) |
| Total | 0 (0.0%) | 0 (0.0%) |
Income in Leilani Estates
Income Overview in Leilani Estates
Per Capita Income in Leilani Estates is $24,787, while median incomes of families and households are $36,726 and $23,750 respectively.
| Characteristic | Number | Measure |
| Per Capita Income | 1,611 | $24,787 |
| Median Family Income | 343 | $36,726 |
| Mean Family Income | 343 | $62,616 |
| Median Household Income | 697 | $23,750 |
| Mean Household Income | 697 | $53,986 |
| Income Deficit | 343 | $0 |
| Wage / Income Gap (%) | 1,611 | 36.39% |
| Wage / Income Gap ($) | 1,611 | 63.61¢ per $1 |
| Gini / Inequality Index | 1,611 | 0.56 |
Earnings by Sex in Leilani Estates
Average Earnings in Leilani Estates are $19,279, $15,938 for men and $25,054 for women, a difference of 36.4%.
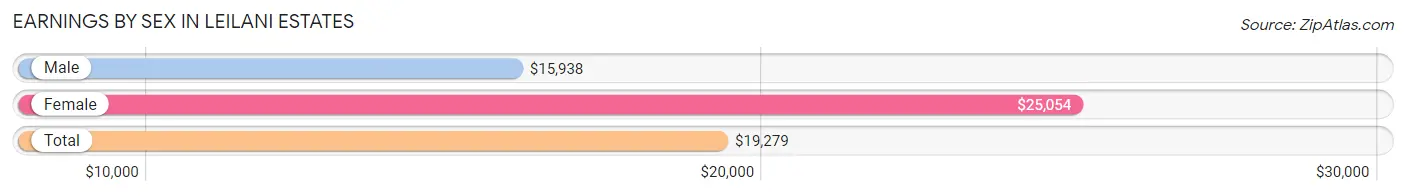
| Sex | Number | Average Earnings |
| Male | 456 (66.6%) | $15,938 |
| Female | 229 (33.4%) | $25,054 |
| Total | 685 (100.0%) | $19,279 |
Earnings by Sex by Income Bracket in Leilani Estates
The most common earnings brackets in Leilani Estates are $10,000 to $12,499 for men (58 | 12.7%) and $25,000 to $29,999 for women (28 | 12.2%).
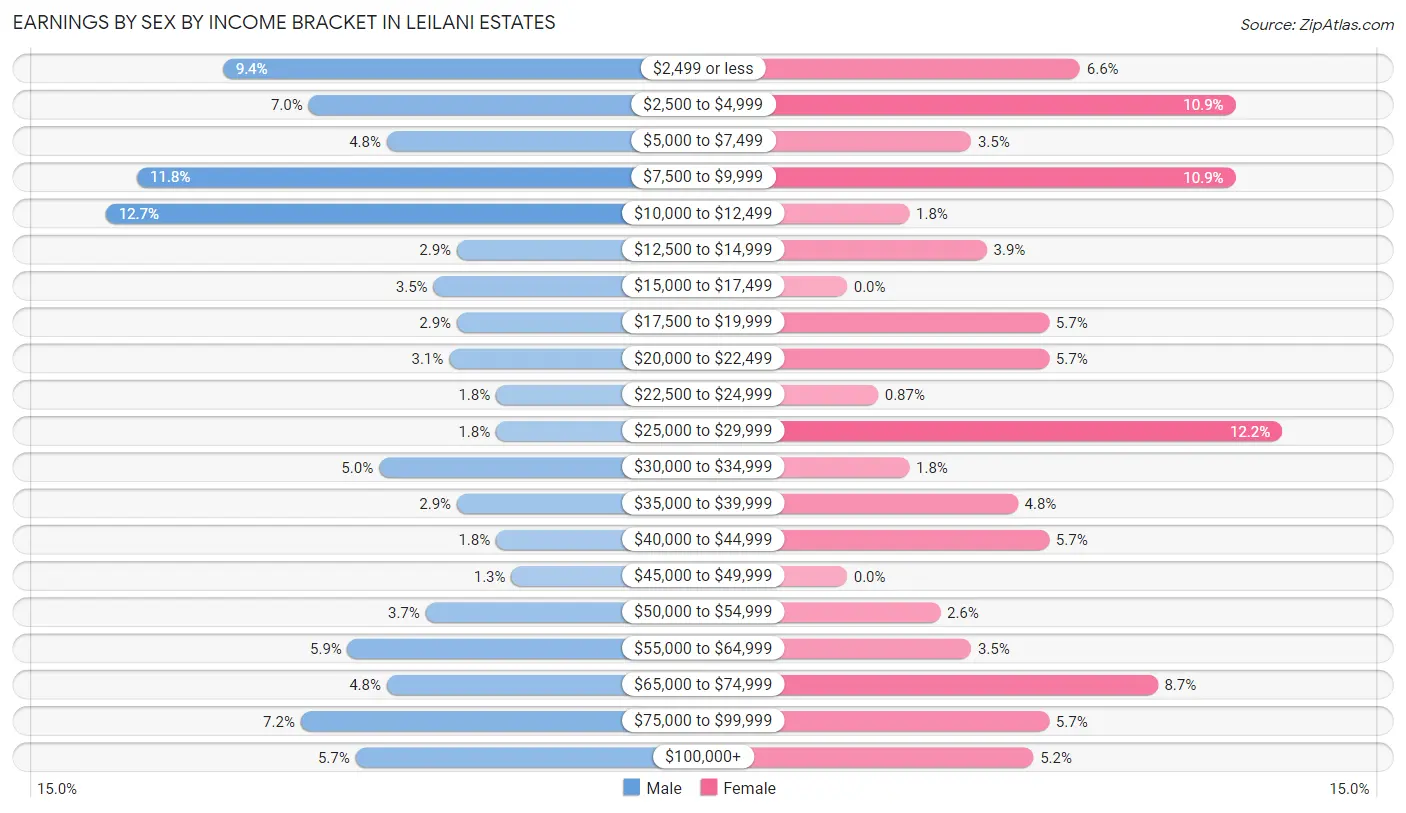
| Income | Male | Female |
| $2,499 or less | 43 (9.4%) | 15 (6.6%) |
| $2,500 to $4,999 | 32 (7.0%) | 25 (10.9%) |
| $5,000 to $7,499 | 22 (4.8%) | 8 (3.5%) |
| $7,500 to $9,999 | 54 (11.8%) | 25 (10.9%) |
| $10,000 to $12,499 | 58 (12.7%) | 4 (1.8%) |
| $12,500 to $14,999 | 13 (2.9%) | 9 (3.9%) |
| $15,000 to $17,499 | 16 (3.5%) | 0 (0.0%) |
| $17,500 to $19,999 | 13 (2.9%) | 13 (5.7%) |
| $20,000 to $22,499 | 14 (3.1%) | 13 (5.7%) |
| $22,500 to $24,999 | 8 (1.8%) | 2 (0.9%) |
| $25,000 to $29,999 | 8 (1.8%) | 28 (12.2%) |
| $30,000 to $34,999 | 23 (5.0%) | 4 (1.8%) |
| $35,000 to $39,999 | 13 (2.9%) | 11 (4.8%) |
| $40,000 to $44,999 | 8 (1.8%) | 13 (5.7%) |
| $45,000 to $49,999 | 6 (1.3%) | 0 (0.0%) |
| $50,000 to $54,999 | 17 (3.7%) | 6 (2.6%) |
| $55,000 to $64,999 | 27 (5.9%) | 8 (3.5%) |
| $65,000 to $74,999 | 22 (4.8%) | 20 (8.7%) |
| $75,000 to $99,999 | 33 (7.2%) | 13 (5.7%) |
| $100,000+ | 26 (5.7%) | 12 (5.2%) |
| Total | 456 (100.0%) | 229 (100.0%) |
Earnings by Sex by Educational Attainment in Leilani Estates
Average earnings in Leilani Estates are $20,750 for men and $22,404 for women, a difference of 7.4%. Men with an educational attainment of graduate degree enjoy the highest average annual earnings of $64,083, while those with high school diploma education earn the least with $11,556. Women with an educational attainment of bachelor's degree earn the most with the average annual earnings of $68,636, while those with college or associate's degree education have the smallest earnings of $18,365.
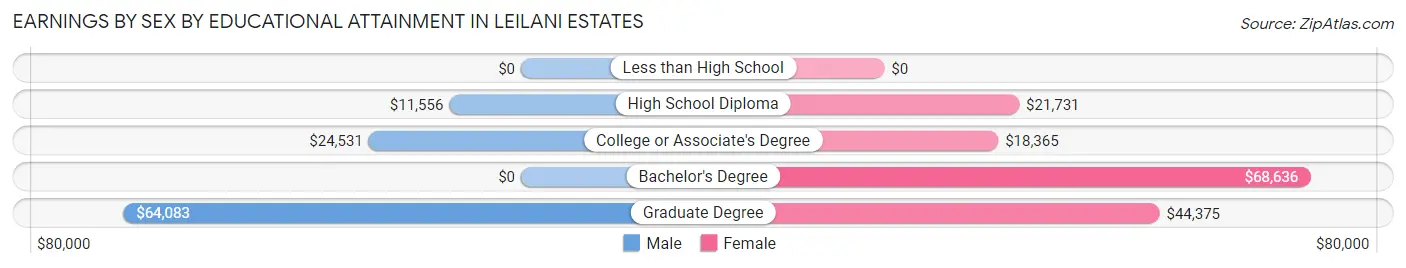
| Educational Attainment | Male Income | Female Income |
| Less than High School | - | - |
| High School Diploma | $11,556 | $21,731 |
| College or Associate's Degree | $24,531 | $18,365 |
| Bachelor's Degree | - | - |
| Graduate Degree | $64,083 | $44,375 |
| Total | $20,750 | $22,404 |
Family Income in Leilani Estates
Family Income Brackets in Leilani Estates
According to the Leilani Estates family income data, there are 63 families falling into the $15,000 to $24,999 income range, which is the most common income bracket and makes up 18.4% of all families.
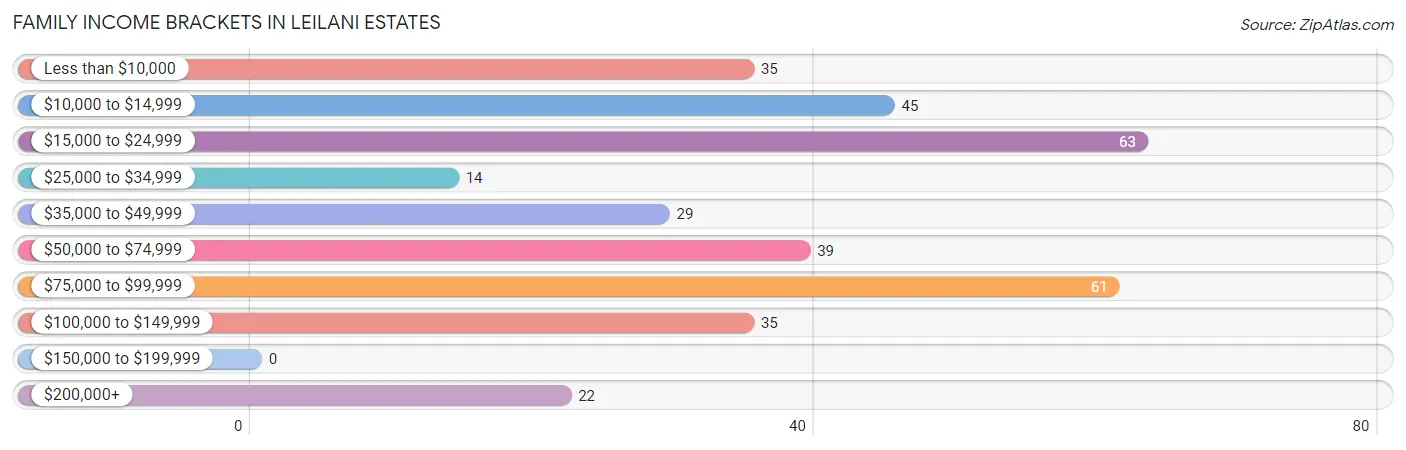
| Income Bracket | # Families | % Families |
| Less than $10,000 | 35 | 10.2% |
| $10,000 to $14,999 | 45 | 13.1% |
| $15,000 to $24,999 | 63 | 18.4% |
| $25,000 to $34,999 | 14 | 4.1% |
| $35,000 to $49,999 | 29 | 8.5% |
| $50,000 to $74,999 | 39 | 11.4% |
| $75,000 to $99,999 | 61 | 17.8% |
| $100,000 to $149,999 | 35 | 10.2% |
| $150,000 to $199,999 | 0 | 0.0% |
| $200,000+ | 22 | 6.4% |
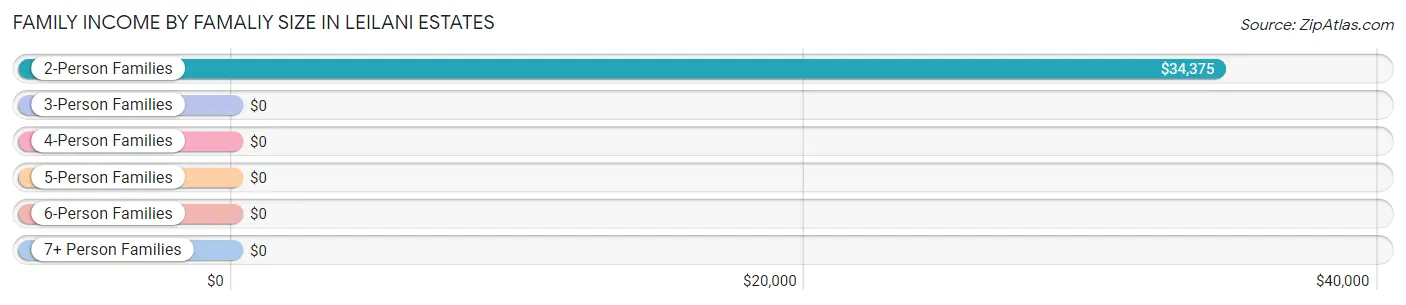
Family Income by Famaliy Size in Leilani Estates
2-person families (275 | 80.2%) account for the highest median family income in Leilani Estates with $34,375 per family, while 2-person families (275 | 80.2%) have the highest median income of $17,188 per family member.
| Income Bracket | # Families | Median Income |
| 2-Person Families | 275 (80.2%) | $34,375 |
| 3-Person Families | 20 (5.8%) | $0 |
| 4-Person Families | 7 (2.0%) | $0 |
| 5-Person Families | 22 (6.4%) | $0 |
| 6-Person Families | 0 (0.0%) | $0 |
| 7+ Person Families | 19 (5.5%) | $0 |
| Total | 343 (100.0%) | $36,726 |
Family Income by Number of Earners in Leilani Estates
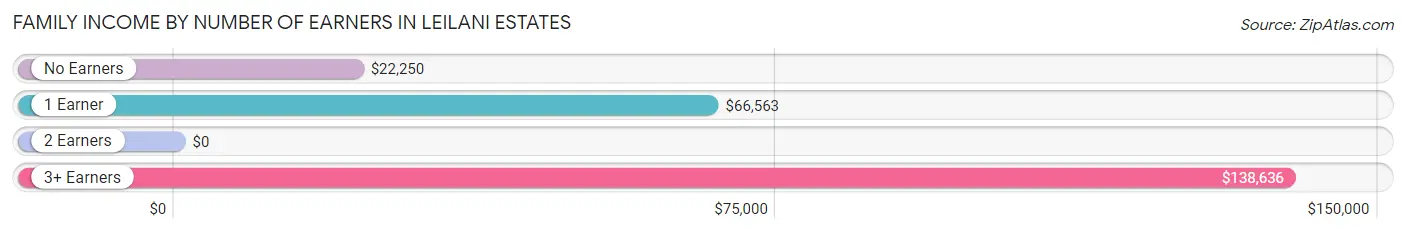
| Number of Earners | # Families | Median Income |
| No Earners | 121 (35.3%) | $22,250 |
| 1 Earner | 95 (27.7%) | $66,563 |
| 2 Earners | 101 (29.4%) | $0 |
| 3+ Earners | 26 (7.6%) | $138,636 |
| Total | 343 (100.0%) | $36,726 |
Household Income in Leilani Estates
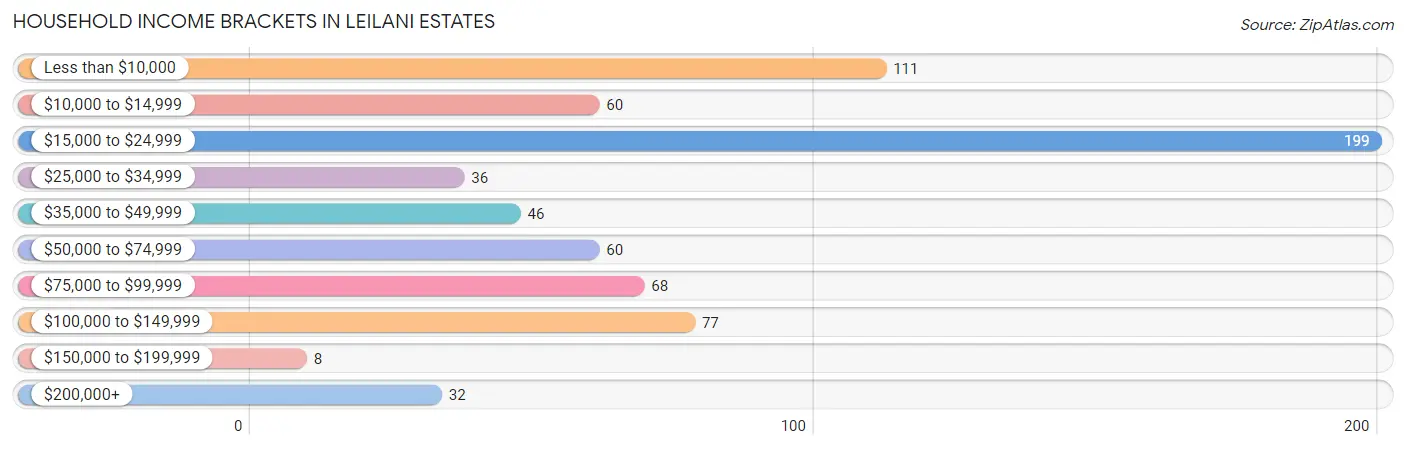
Household Income Brackets in Leilani Estates
With 199 households falling in the category, the $15,000 to $24,999 income range is the most frequent in Leilani Estates, accounting for 28.5% of all households. In contrast, only 8 households (1.1%) fall into the $150,000 to $199,999 income bracket, making it the least populous group.
| Income Bracket | # Households | % Households |
| Less than $10,000 | 111 | 15.9% |
| $10,000 to $14,999 | 60 | 8.6% |
| $15,000 to $24,999 | 199 | 28.6% |
| $25,000 to $34,999 | 36 | 5.2% |
| $35,000 to $49,999 | 46 | 6.6% |
| $50,000 to $74,999 | 60 | 8.6% |
| $75,000 to $99,999 | 68 | 9.8% |
| $100,000 to $149,999 | 77 | 11.0% |
| $150,000 to $199,999 | 8 | 1.1% |
| $200,000+ | 32 | 4.6% |
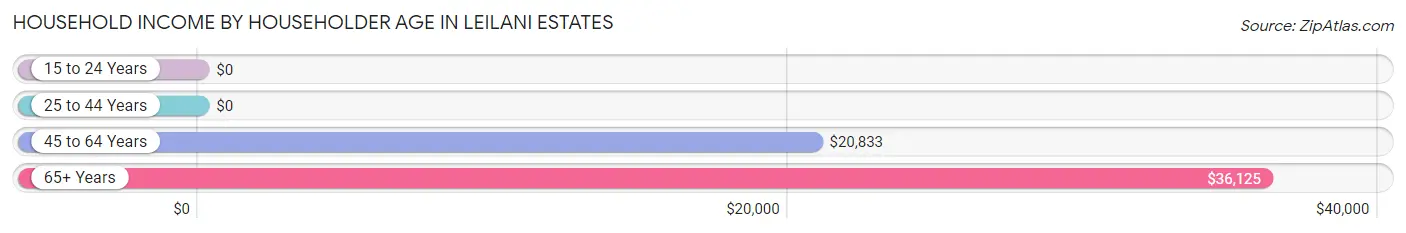
Household Income by Householder Age in Leilani Estates
The median household income in Leilani Estates is $23,750, with the highest median household income of $36,125 found in the 65+ years age bracket for the primary householder. A total of 266 households (38.2%) fall into this category. Meanwhile, the 15 to 24 years age bracket for the primary householder has the lowest median household income of $0, with 8 households (1.1%) in this group.
| Income Bracket | # Households | Median Income |
| 15 to 24 Years | 8 (1.1%) | $0 |
| 25 to 44 Years | 117 (16.8%) | $0 |
| 45 to 64 Years | 306 (43.9%) | $20,833 |
| 65+ Years | 266 (38.2%) | $36,125 |
| Total | 697 (100.0%) | $23,750 |
Poverty in Leilani Estates
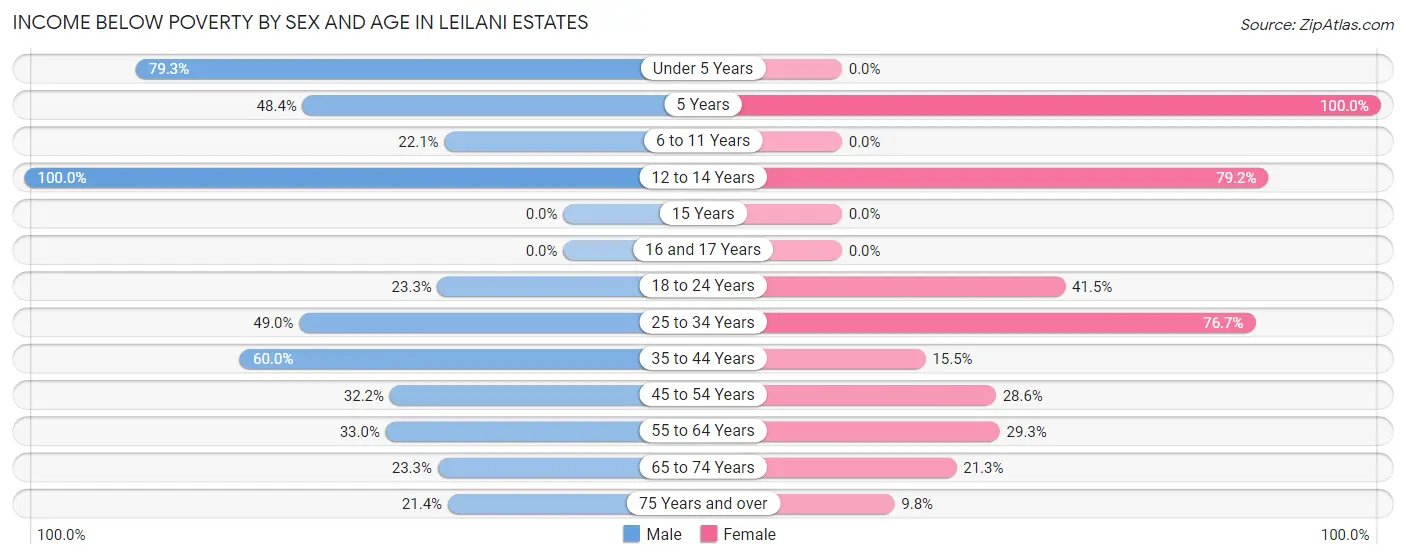
Income Below Poverty by Sex and Age in Leilani Estates
With 40.6% poverty level for males and 30.2% for females among the residents of Leilani Estates, 12 to 14 year old males and 5 year old females are the most vulnerable to poverty, with 15 males (100.0%) and 13 females (100.0%) in their respective age groups living below the poverty level.
| Age Bracket | Male | Female |
| Under 5 Years | 96 (79.3%) | 0 (0.0%) |
| 5 Years | 15 (48.4%) | 13 (100.0%) |
| 6 to 11 Years | 17 (22.1%) | 0 (0.0%) |
| 12 to 14 Years | 15 (100.0%) | 19 (79.2%) |
| 15 Years | 0 (0.0%) | 0 (0.0%) |
| 16 and 17 Years | 0 (0.0%) | 0 (0.0%) |
| 18 to 24 Years | 14 (23.3%) | 17 (41.5%) |
| 25 to 34 Years | 49 (49.0%) | 33 (76.7%) |
| 35 to 44 Years | 63 (60.0%) | 9 (15.5%) |
| 45 to 54 Years | 38 (32.2%) | 20 (28.6%) |
| 55 to 64 Years | 61 (33.0%) | 29 (29.3%) |
| 65 to 74 Years | 38 (23.3%) | 34 (21.2%) |
| 75 Years and over | 9 (21.4%) | 4 (9.8%) |
| Total | 415 (40.6%) | 178 (30.2%) |
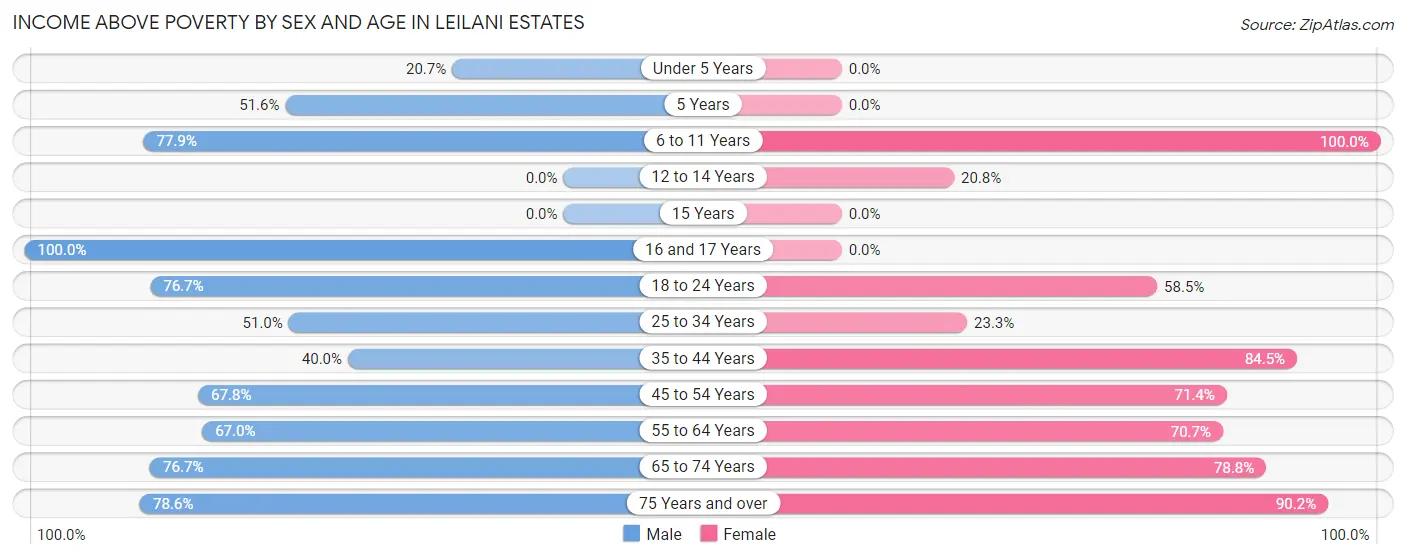
Income Above Poverty by Sex and Age in Leilani Estates
According to the poverty statistics in Leilani Estates, males aged 16 and 17 years and females aged 6 to 11 years are the age groups that are most secure financially, with 100.0% of males and 100.0% of females in these age groups living above the poverty line.
| Age Bracket | Male | Female |
| Under 5 Years | 25 (20.7%) | 0 (0.0%) |
| 5 Years | 16 (51.6%) | 0 (0.0%) |
| 6 to 11 Years | 60 (77.9%) | 41 (100.0%) |
| 12 to 14 Years | 0 (0.0%) | 5 (20.8%) |
| 15 Years | 0 (0.0%) | 0 (0.0%) |
| 16 and 17 Years | 4 (100.0%) | 0 (0.0%) |
| 18 to 24 Years | 46 (76.7%) | 24 (58.5%) |
| 25 to 34 Years | 51 (51.0%) | 10 (23.3%) |
| 35 to 44 Years | 42 (40.0%) | 49 (84.5%) |
| 45 to 54 Years | 80 (67.8%) | 50 (71.4%) |
| 55 to 64 Years | 124 (67.0%) | 70 (70.7%) |
| 65 to 74 Years | 125 (76.7%) | 126 (78.7%) |
| 75 Years and over | 33 (78.6%) | 37 (90.2%) |
| Total | 606 (59.4%) | 412 (69.8%) |
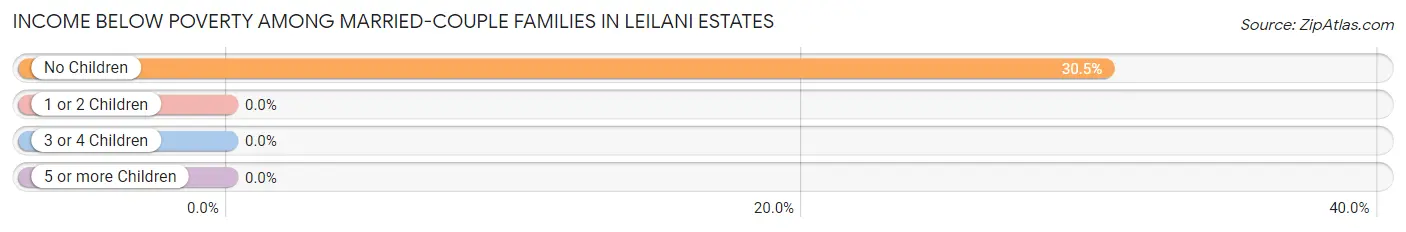
Income Below Poverty Among Married-Couple Families in Leilani Estates
The poverty statistics for married-couple families in Leilani Estates show that 27.4% or 61 of the total 223 families live below the poverty line. Families with no children have the highest poverty rate of 30.5%, comprising of 61 families. On the other hand, families with 1 or 2 children have the lowest poverty rate of 0.0%, which includes 0 families.
| Children | Above Poverty | Below Poverty |
| No Children | 139 (69.5%) | 61 (30.5%) |
| 1 or 2 Children | 12 (100.0%) | 0 (0.0%) |
| 3 or 4 Children | 0 (0.0%) | 0 (0.0%) |
| 5 or more Children | 11 (100.0%) | 0 (0.0%) |
| Total | 162 (72.7%) | 61 (27.4%) |
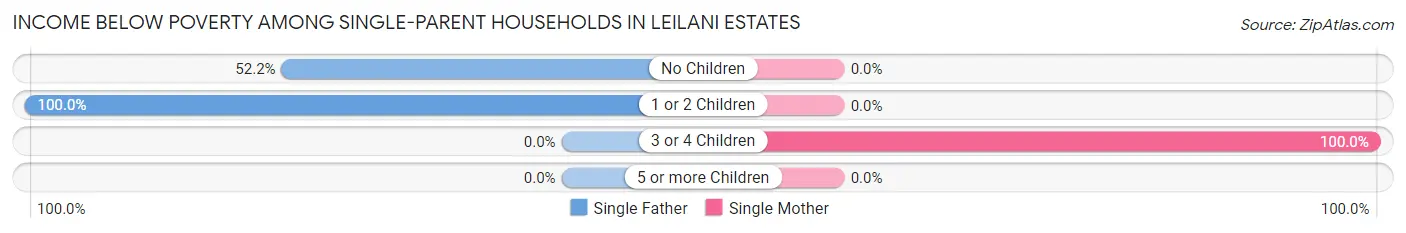
Income Below Poverty Among Single-Parent Households in Leilani Estates
According to the poverty data in Leilani Estates, 71.1% or 27 single-father households and 26.8% or 22 single-mother households are living below the poverty line. Among single-father households, those with 1 or 2 children have the highest poverty rate, with 15 households (100.0%) experiencing poverty. Likewise, among single-mother households, those with 3 or 4 children have the highest poverty rate, with 22 households (100.0%) falling below the poverty line.
| Children | Single Father | Single Mother |
| No Children | 12 (52.2%) | 0 (0.0%) |
| 1 or 2 Children | 15 (100.0%) | 0 (0.0%) |
| 3 or 4 Children | 0 (0.0%) | 22 (100.0%) |
| 5 or more Children | 0 (0.0%) | 0 (0.0%) |
| Total | 27 (71.1%) | 22 (26.8%) |
Income Below Poverty Among Married-Couple vs Single-Parent Households in Leilani Estates
The poverty data for Leilani Estates shows that 61 of the married-couple family households (27.4%) and 49 of the single-parent households (40.8%) are living below the poverty level. Within the married-couple family households, those with no children have the highest poverty rate, with 61 households (30.5%) falling below the poverty line. Among the single-parent households, those with 3 or 4 children have the highest poverty rate, with 22 household (100.0%) living below poverty.
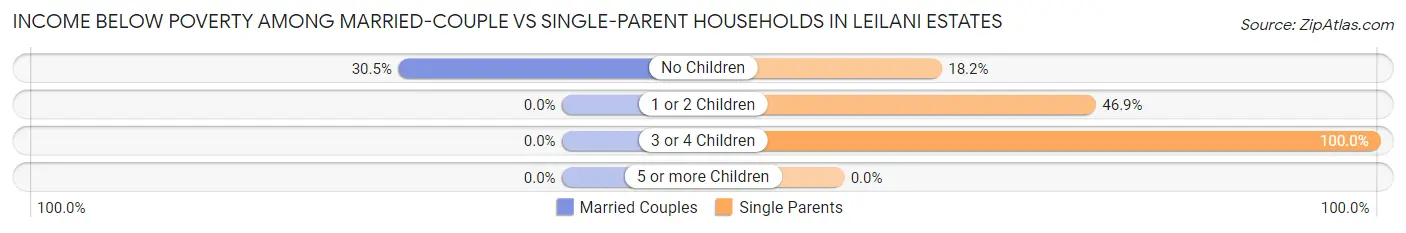
| Children | Married-Couple Families | Single-Parent Households |
| No Children | 61 (30.5%) | 12 (18.2%) |
| 1 or 2 Children | 0 (0.0%) | 15 (46.9%) |
| 3 or 4 Children | 0 (0.0%) | 22 (100.0%) |
| 5 or more Children | 0 (0.0%) | 0 (0.0%) |
| Total | 61 (27.4%) | 49 (40.8%) |
Employment Characteristics in Leilani Estates
Employment by Class of Employer in Leilani Estates
Among the 534 employed individuals in Leilani Estates, private company employees (295 | 55.2%), self-employed (not incorporated) (82 | 15.4%), and state government employees (68 | 12.7%) make up the most common classes of employment.
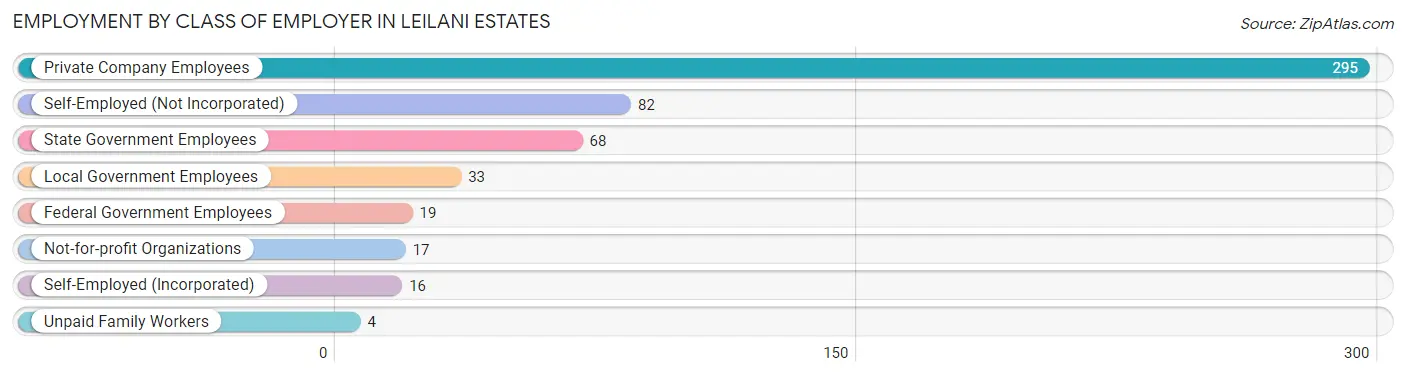
| Employer Class | # Employees | % Employees |
| Private Company Employees | 295 | 55.2% |
| Self-Employed (Incorporated) | 16 | 3.0% |
| Self-Employed (Not Incorporated) | 82 | 15.4% |
| Not-for-profit Organizations | 17 | 3.2% |
| Local Government Employees | 33 | 6.2% |
| State Government Employees | 68 | 12.7% |
| Federal Government Employees | 19 | 3.6% |
| Unpaid Family Workers | 4 | 0.7% |
| Total | 534 | 100.0% |
Employment Status by Age in Leilani Estates
According to the labor force statistics for Leilani Estates, out of the total population over 16 years of age (1,289), 53.3% or 687 individuals are in the labor force, with 19.2% or 132 of them unemployed. The age group with the highest labor force participation rate is 20 to 24 years, with 88.0% or 88 individuals in the labor force. Within the labor force, the 55 to 59 years age range has the highest percentage of unemployed individuals, with 47.2% or 50 of them being unemployed.
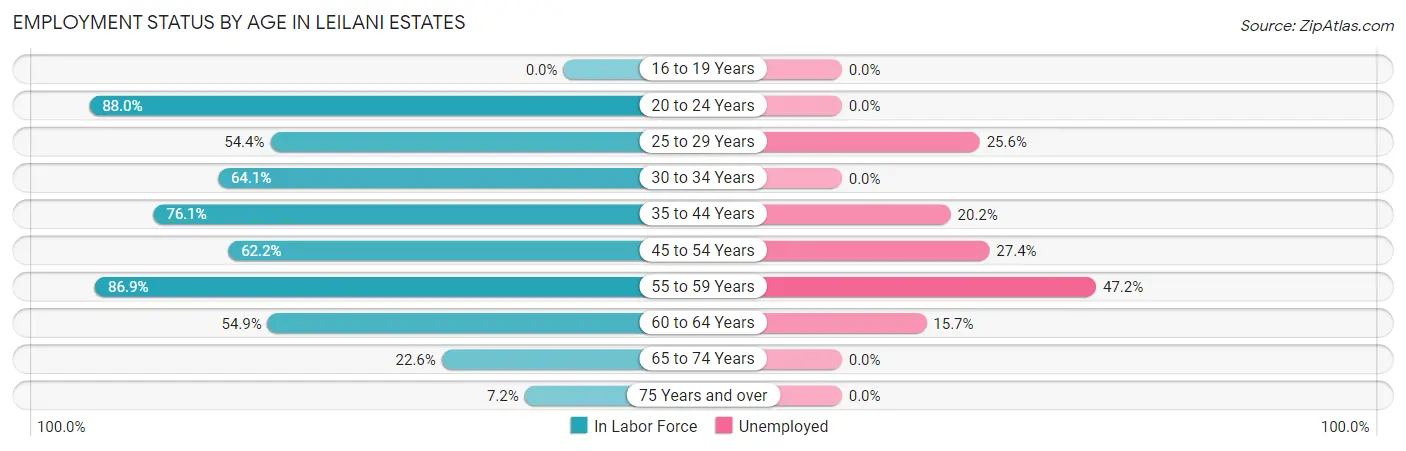
| Age Bracket | In Labor Force | Unemployed |
| 16 to 19 Years | 0 (0.0%) | 0 (0.0%) |
| 20 to 24 Years | 88 (88.0%) | 0 (0.0%) |
| 25 to 29 Years | 43 (54.4%) | 11 (25.6%) |
| 30 to 34 Years | 41 (64.1%) | 0 (0.0%) |
| 35 to 44 Years | 124 (76.1%) | 25 (20.2%) |
| 45 to 54 Years | 117 (62.2%) | 32 (27.4%) |
| 55 to 59 Years | 106 (86.9%) | 50 (47.2%) |
| 60 to 64 Years | 89 (54.9%) | 14 (15.7%) |
| 65 to 74 Years | 73 (22.6%) | 0 (0.0%) |
| 75 Years and over | 6 (7.2%) | 0 (0.0%) |
| Total | 687 (53.3%) | 132 (19.2%) |
Employment Status by Educational Attainment in Leilani Estates
According to labor force statistics for Leilani Estates, 66.8% of individuals (520) out of the total population between 25 and 64 years of age (778) are in the labor force, with 25.4% or 132 of them being unemployed. The group with the highest labor force participation rate are those with the educational attainment of college / associate degree, with 84.9% or 203 individuals in the labor force. Within the labor force, individuals with college / associate degree education have the highest percentage of unemployment, with 38.9% or 79 of them being unemployed.
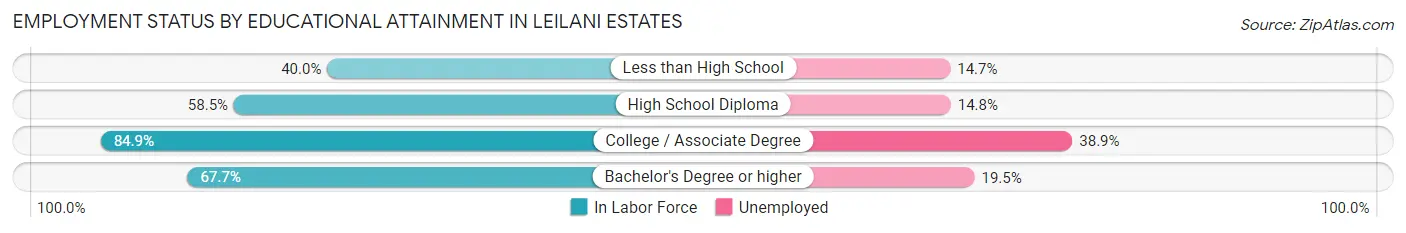
| Educational Attainment | In Labor Force | Unemployed |
| Less than High School | 34 (40.0%) | 12 (14.7%) |
| High School Diploma | 155 (58.5%) | 39 (14.8%) |
| College / Associate Degree | 203 (84.9%) | 93 (38.9%) |
| Bachelor's Degree or higher | 128 (67.7%) | 37 (19.5%) |
| Total | 520 (66.8%) | 198 (25.4%) |
Employment Occupations by Sex in Leilani Estates
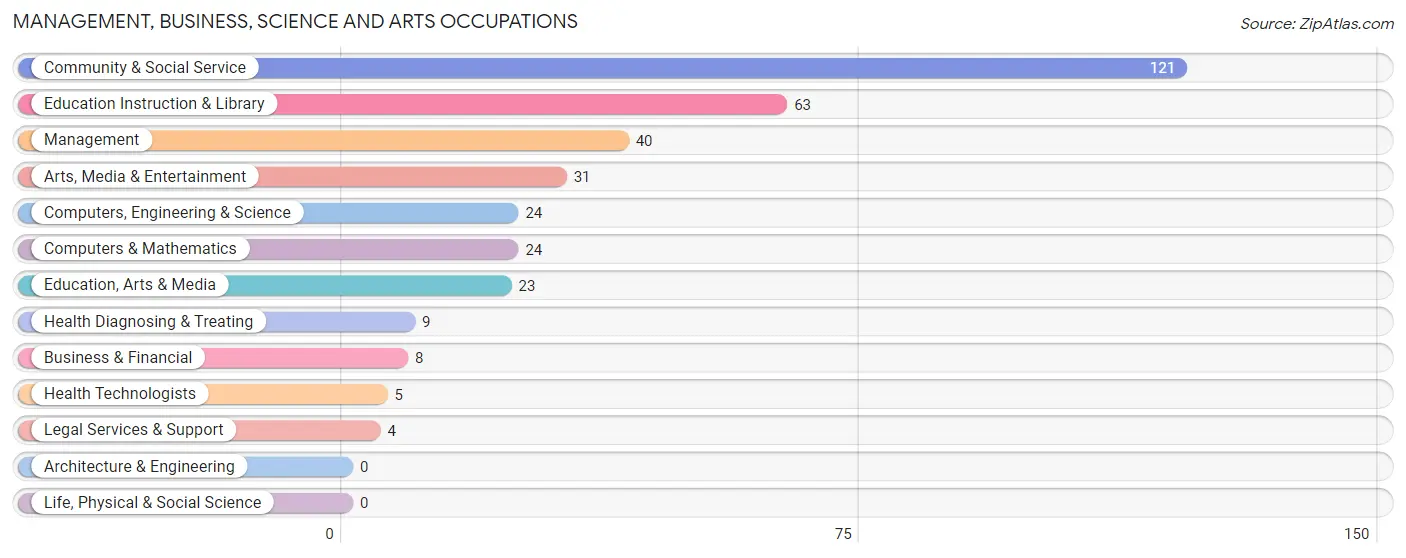
Management, Business, Science and Arts Occupations
The most common Management, Business, Science and Arts occupations in Leilani Estates are Community & Social Service (121 | 21.8%), Education Instruction & Library (63 | 11.4%), Management (40 | 7.2%), Arts, Media & Entertainment (31 | 5.6%), and Computers, Engineering & Science (24 | 4.3%).
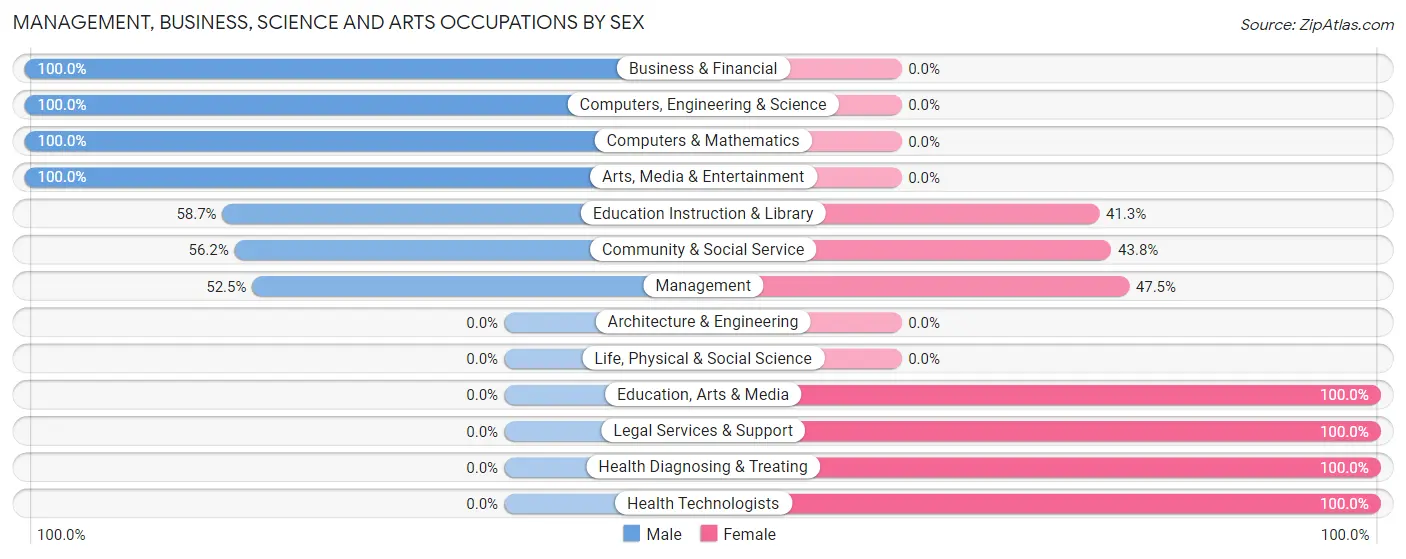
Management, Business, Science and Arts Occupations by Sex
Within the Management, Business, Science and Arts occupations in Leilani Estates, the most male-oriented occupations are Business & Financial (100.0%), Computers, Engineering & Science (100.0%), and Computers & Mathematics (100.0%), while the most female-oriented occupations are Education, Arts & Media (100.0%), Legal Services & Support (100.0%), and Health Diagnosing & Treating (100.0%).
| Occupation | Male | Female |
| Management | 21 (52.5%) | 19 (47.5%) |
| Business & Financial | 8 (100.0%) | 0 (0.0%) |
| Computers, Engineering & Science | 24 (100.0%) | 0 (0.0%) |
| Computers & Mathematics | 24 (100.0%) | 0 (0.0%) |
| Architecture & Engineering | 0 (0.0%) | 0 (0.0%) |
| Life, Physical & Social Science | 0 (0.0%) | 0 (0.0%) |
| Community & Social Service | 68 (56.2%) | 53 (43.8%) |
| Education, Arts & Media | 0 (0.0%) | 23 (100.0%) |
| Legal Services & Support | 0 (0.0%) | 4 (100.0%) |
| Education Instruction & Library | 37 (58.7%) | 26 (41.3%) |
| Arts, Media & Entertainment | 31 (100.0%) | 0 (0.0%) |
| Health Diagnosing & Treating | 0 (0.0%) | 9 (100.0%) |
| Health Technologists | 0 (0.0%) | 5 (100.0%) |
| Total (Category) | 121 (59.9%) | 81 (40.1%) |
| Total (Overall) | 358 (64.5%) | 197 (35.5%) |
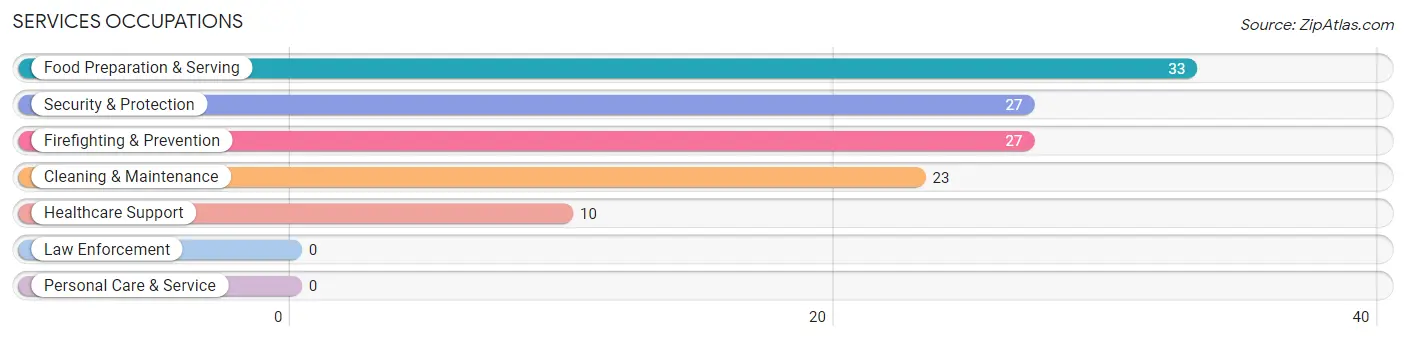
Services Occupations
The most common Services occupations in Leilani Estates are Food Preparation & Serving (33 | 5.9%), Security & Protection (27 | 4.9%), Firefighting & Prevention (27 | 4.9%), Cleaning & Maintenance (23 | 4.1%), and Healthcare Support (10 | 1.8%).
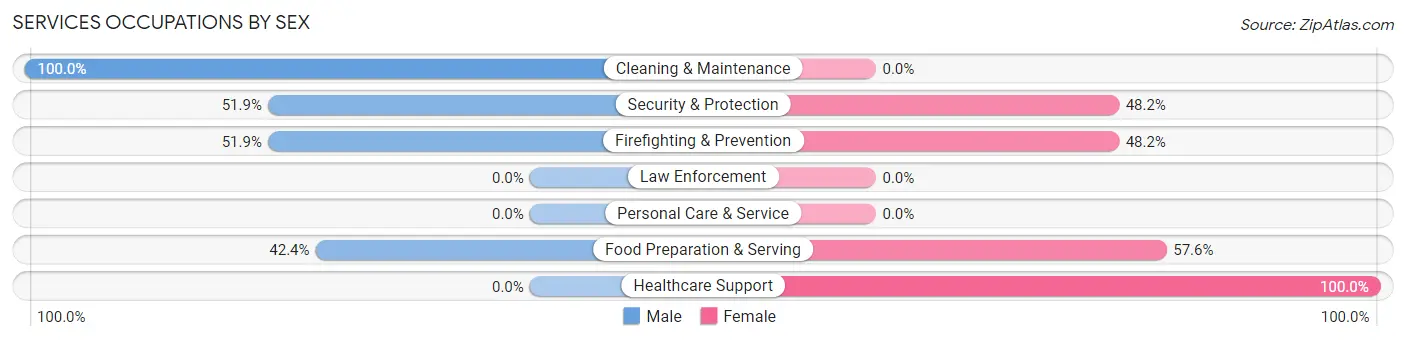
Services Occupations by Sex
Within the Services occupations in Leilani Estates, the most male-oriented occupations are Cleaning & Maintenance (100.0%), Security & Protection (51.8%), and Firefighting & Prevention (51.8%), while the most female-oriented occupations are Healthcare Support (100.0%), Food Preparation & Serving (57.6%), and Security & Protection (48.1%).
| Occupation | Male | Female |
| Healthcare Support | 0 (0.0%) | 10 (100.0%) |
| Security & Protection | 14 (51.8%) | 13 (48.1%) |
| Firefighting & Prevention | 14 (51.8%) | 13 (48.1%) |
| Law Enforcement | 0 (0.0%) | 0 (0.0%) |
| Food Preparation & Serving | 14 (42.4%) | 19 (57.6%) |
| Cleaning & Maintenance | 23 (100.0%) | 0 (0.0%) |
| Personal Care & Service | 0 (0.0%) | 0 (0.0%) |
| Total (Category) | 51 (54.8%) | 42 (45.2%) |
| Total (Overall) | 358 (64.5%) | 197 (35.5%) |
Sales and Office Occupations
The most common Sales and Office occupations in Leilani Estates are Sales & Related (79 | 14.2%), and Office & Administration (29 | 5.2%).
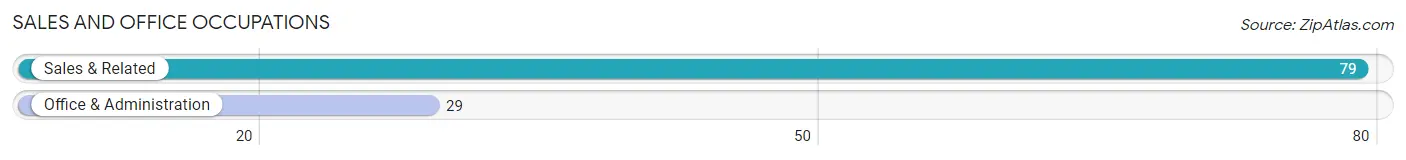
Sales and Office Occupations by Sex
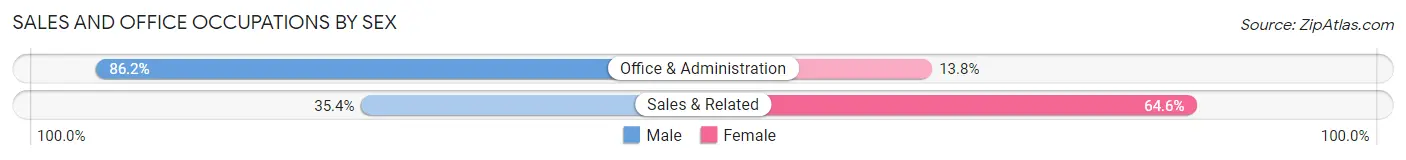
| Occupation | Male | Female |
| Sales & Related | 28 (35.4%) | 51 (64.6%) |
| Office & Administration | 25 (86.2%) | 4 (13.8%) |
| Total (Category) | 53 (49.1%) | 55 (50.9%) |
| Total (Overall) | 358 (64.5%) | 197 (35.5%) |
Natural Resources, Construction and Maintenance Occupations
The most common Natural Resources, Construction and Maintenance occupations in Leilani Estates are Construction & Extraction (65 | 11.7%), Installation, Maintenance & Repair (15 | 2.7%), and Farming, Fishing & Forestry (11 | 2.0%).
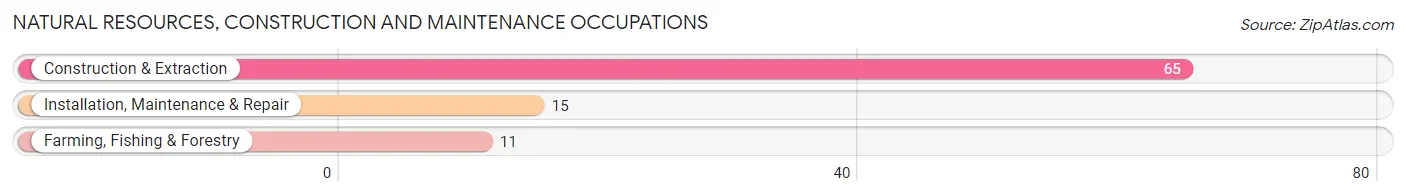
Natural Resources, Construction and Maintenance Occupations by Sex
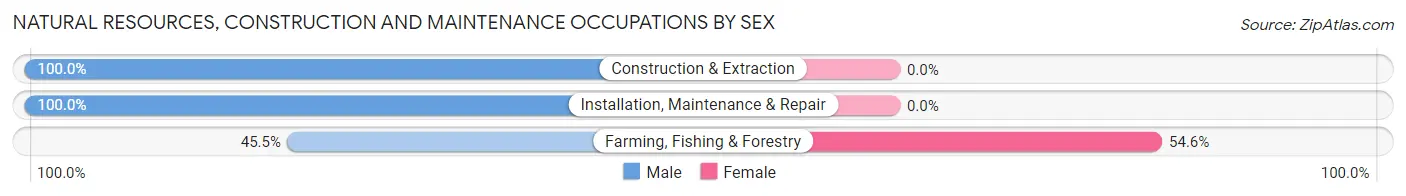
| Occupation | Male | Female |
| Farming, Fishing & Forestry | 5 (45.5%) | 6 (54.5%) |
| Construction & Extraction | 65 (100.0%) | 0 (0.0%) |
| Installation, Maintenance & Repair | 15 (100.0%) | 0 (0.0%) |
| Total (Category) | 85 (93.4%) | 6 (6.6%) |
| Total (Overall) | 358 (64.5%) | 197 (35.5%) |
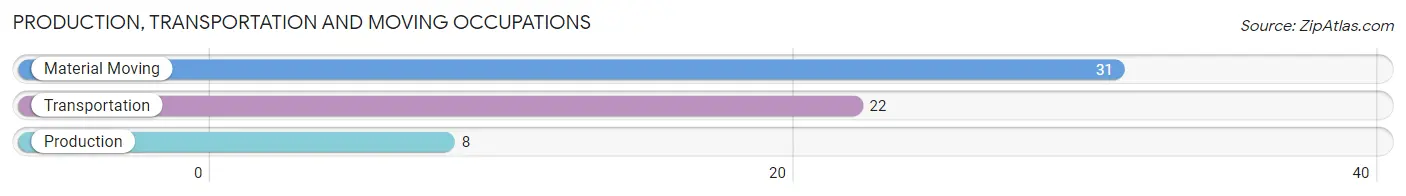
Production, Transportation and Moving Occupations
The most common Production, Transportation and Moving occupations in Leilani Estates are Material Moving (31 | 5.6%), Transportation (22 | 4.0%), and Production (8 | 1.4%).
Production, Transportation and Moving Occupations by Sex
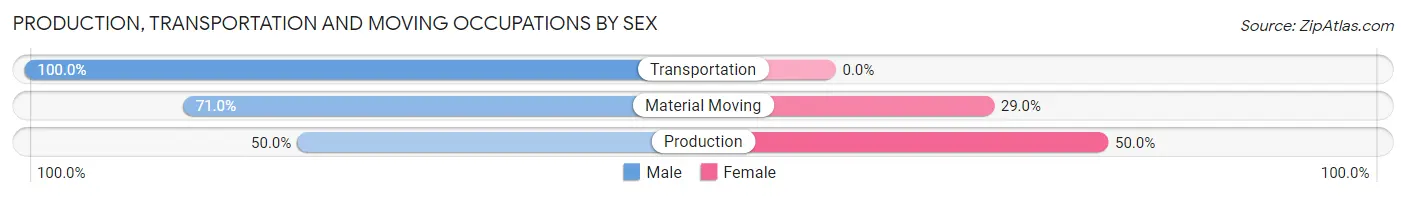
| Occupation | Male | Female |
| Production | 4 (50.0%) | 4 (50.0%) |
| Transportation | 22 (100.0%) | 0 (0.0%) |
| Material Moving | 22 (71.0%) | 9 (29.0%) |
| Total (Category) | 48 (78.7%) | 13 (21.3%) |
| Total (Overall) | 358 (64.5%) | 197 (35.5%) |
Employment Industries by Sex in Leilani Estates
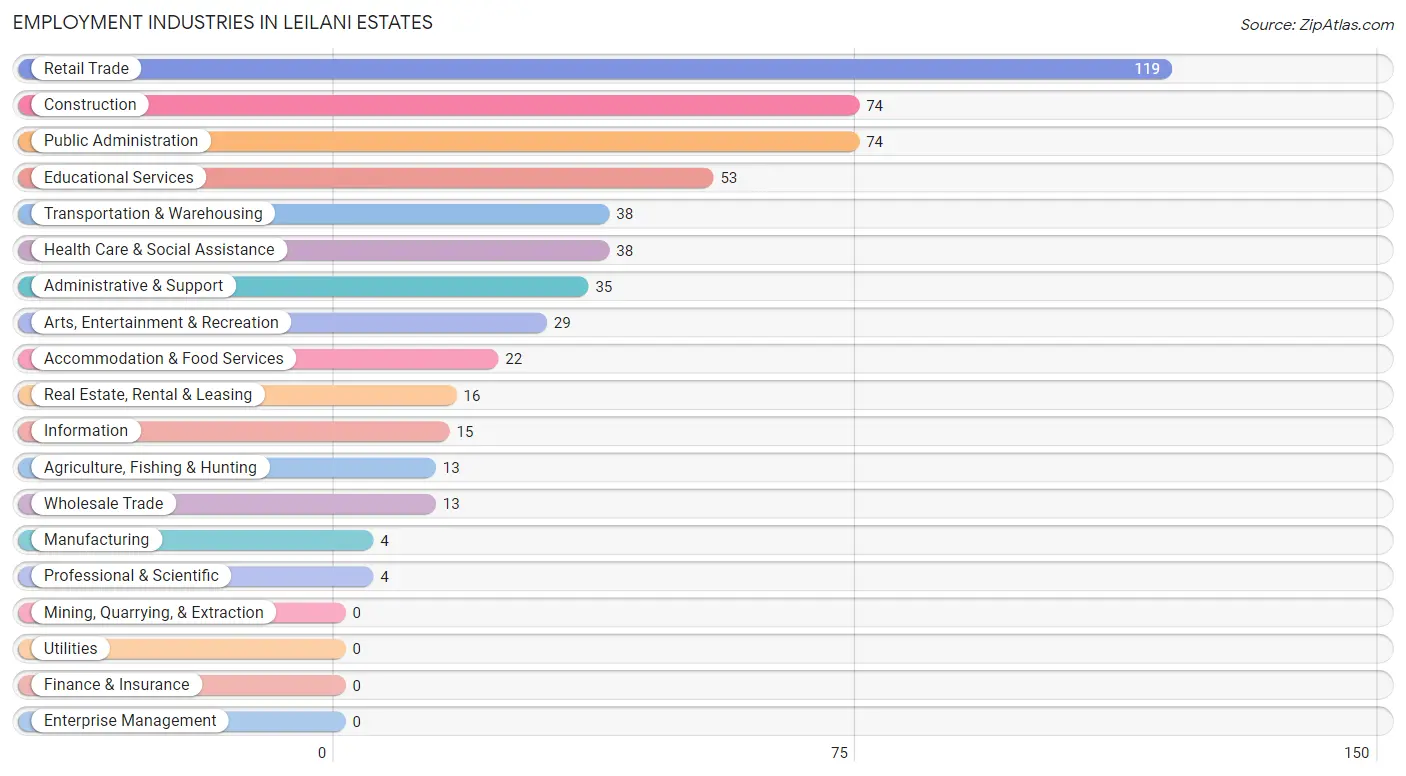
Employment Industries in Leilani Estates
The major employment industries in Leilani Estates include Retail Trade (119 | 21.4%), Construction (74 | 13.3%), Public Administration (74 | 13.3%), Educational Services (53 | 9.6%), and Transportation & Warehousing (38 | 6.9%).
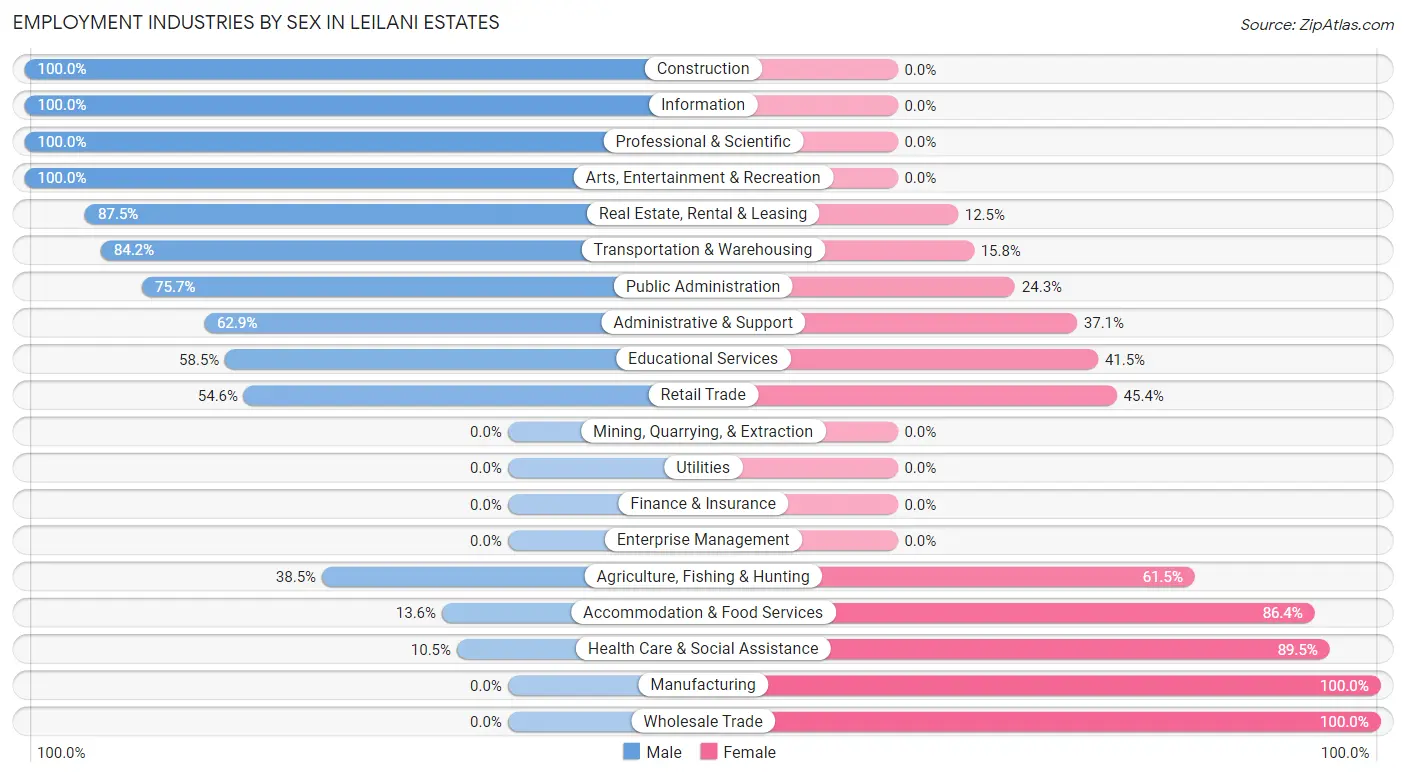
Employment Industries by Sex in Leilani Estates
The Leilani Estates industries that see more men than women are Construction (100.0%), Information (100.0%), and Professional & Scientific (100.0%), whereas the industries that tend to have a higher number of women are Manufacturing (100.0%), Wholesale Trade (100.0%), and Health Care & Social Assistance (89.5%).
| Industry | Male | Female |
| Agriculture, Fishing & Hunting | 5 (38.5%) | 8 (61.5%) |
| Mining, Quarrying, & Extraction | 0 (0.0%) | 0 (0.0%) |
| Construction | 74 (100.0%) | 0 (0.0%) |
| Manufacturing | 0 (0.0%) | 4 (100.0%) |
| Wholesale Trade | 0 (0.0%) | 13 (100.0%) |
| Retail Trade | 65 (54.6%) | 54 (45.4%) |
| Transportation & Warehousing | 32 (84.2%) | 6 (15.8%) |
| Utilities | 0 (0.0%) | 0 (0.0%) |
| Information | 15 (100.0%) | 0 (0.0%) |
| Finance & Insurance | 0 (0.0%) | 0 (0.0%) |
| Real Estate, Rental & Leasing | 14 (87.5%) | 2 (12.5%) |
| Professional & Scientific | 4 (100.0%) | 0 (0.0%) |
| Enterprise Management | 0 (0.0%) | 0 (0.0%) |
| Administrative & Support | 22 (62.9%) | 13 (37.1%) |
| Educational Services | 31 (58.5%) | 22 (41.5%) |
| Health Care & Social Assistance | 4 (10.5%) | 34 (89.5%) |
| Arts, Entertainment & Recreation | 29 (100.0%) | 0 (0.0%) |
| Accommodation & Food Services | 3 (13.6%) | 19 (86.4%) |
| Public Administration | 56 (75.7%) | 18 (24.3%) |
| Total | 358 (64.5%) | 197 (35.5%) |
Education in Leilani Estates
School Enrollment in Leilani Estates
The most common levels of schooling among the 269 students in Leilani Estates are elementary school (79 | 29.4%), middle school (58 | 21.6%), and nursery / preschool (53 | 19.7%).
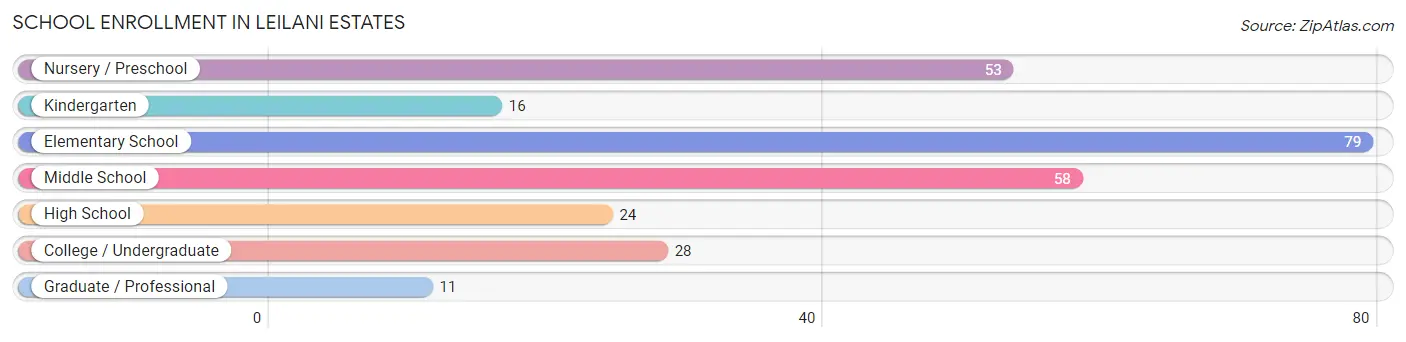
| School Level | # Students | % Students |
| Nursery / Preschool | 53 | 19.7% |
| Kindergarten | 16 | 5.9% |
| Elementary School | 79 | 29.4% |
| Middle School | 58 | 21.6% |
| High School | 24 | 8.9% |
| College / Undergraduate | 28 | 10.4% |
| Graduate / Professional | 11 | 4.1% |
| Total | 269 | 100.0% |
School Enrollment by Age by Funding Source in Leilani Estates
Out of a total of 269 students who are enrolled in schools in Leilani Estates, 59 (21.9%) attend a private institution, while the remaining 210 (78.1%) are enrolled in public schools. The age group of 3 to 4 year olds has the highest likelihood of being enrolled in private schools, with 25 (100.0% in the age bracket) enrolled. Conversely, the age group of 15 to 17 year olds has the lowest likelihood of being enrolled in a private school, with 4 (100.0% in the age bracket) attending a public institution.
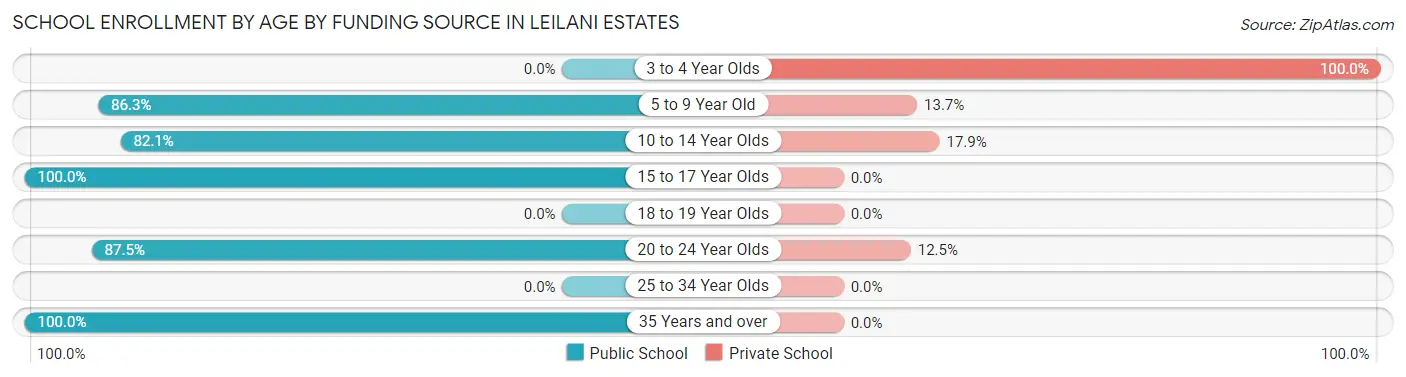
| Age Bracket | Public School | Private School |
| 3 to 4 Year Olds | 0 (0.0%) | 25 (100.0%) |
| 5 to 9 Year Old | 101 (86.3%) | 16 (13.7%) |
| 10 to 14 Year Olds | 69 (82.1%) | 15 (17.9%) |
| 15 to 17 Year Olds | 4 (100.0%) | 0 (0.0%) |
| 18 to 19 Year Olds | 0 (0.0%) | 0 (0.0%) |
| 20 to 24 Year Olds | 21 (87.5%) | 3 (12.5%) |
| 25 to 34 Year Olds | 0 (0.0%) | 0 (0.0%) |
| 35 Years and over | 15 (100.0%) | 0 (0.0%) |
| Total | 210 (78.1%) | 59 (21.9%) |
Educational Attainment by Field of Study in Leilani Estates
Education (70 | 18.2%), bio, nature & agricultural (52 | 13.5%), social sciences (42 | 10.9%), liberal arts & history (39 | 10.2%), and business (37 | 9.6%) are the most common fields of study among 384 individuals in Leilani Estates who have obtained a bachelor's degree or higher.
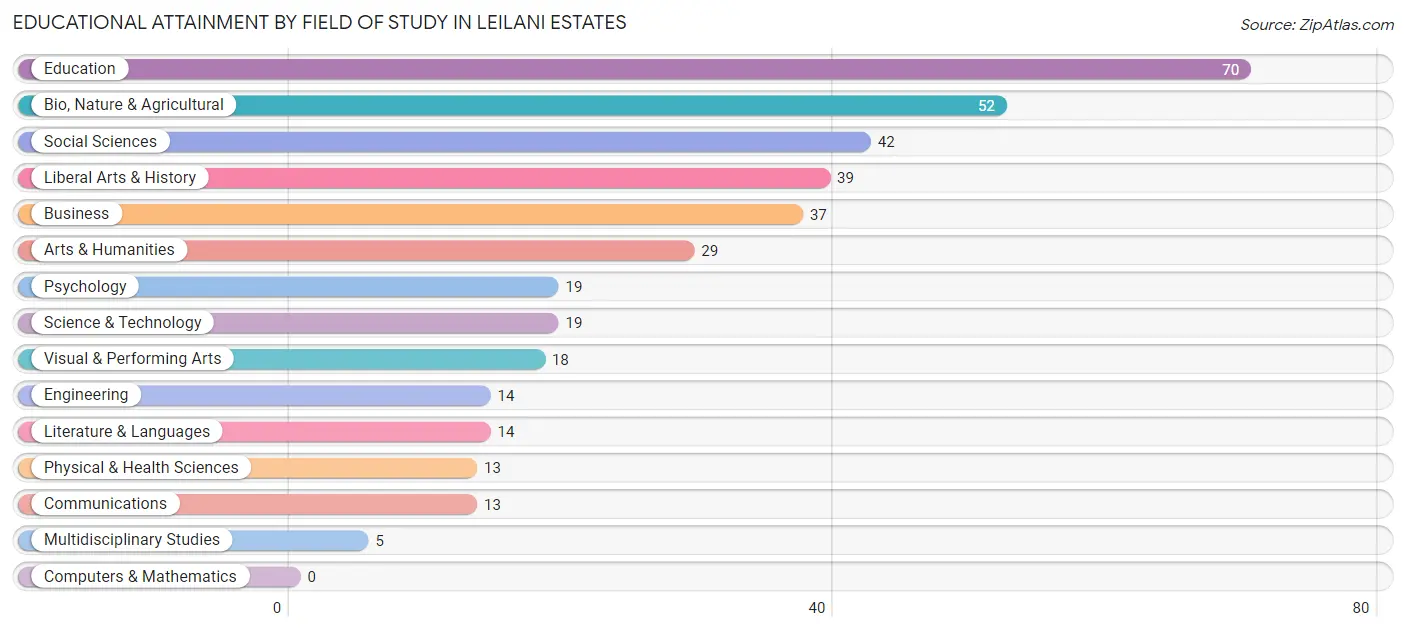
| Field of Study | # Graduates | % Graduates |
| Computers & Mathematics | 0 | 0.0% |
| Bio, Nature & Agricultural | 52 | 13.5% |
| Physical & Health Sciences | 13 | 3.4% |
| Psychology | 19 | 5.0% |
| Social Sciences | 42 | 10.9% |
| Engineering | 14 | 3.6% |
| Multidisciplinary Studies | 5 | 1.3% |
| Science & Technology | 19 | 5.0% |
| Business | 37 | 9.6% |
| Education | 70 | 18.2% |
| Literature & Languages | 14 | 3.6% |
| Liberal Arts & History | 39 | 10.2% |
| Visual & Performing Arts | 18 | 4.7% |
| Communications | 13 | 3.4% |
| Arts & Humanities | 29 | 7.5% |
| Total | 384 | 100.0% |
Transportation & Commute in Leilani Estates
Vehicle Availability by Sex in Leilani Estates
The most prevalent vehicle ownership categories in Leilani Estates are males with 2 vehicles (207, accounting for 57.8%) and females with 2 vehicles (106, making up 117.6%).
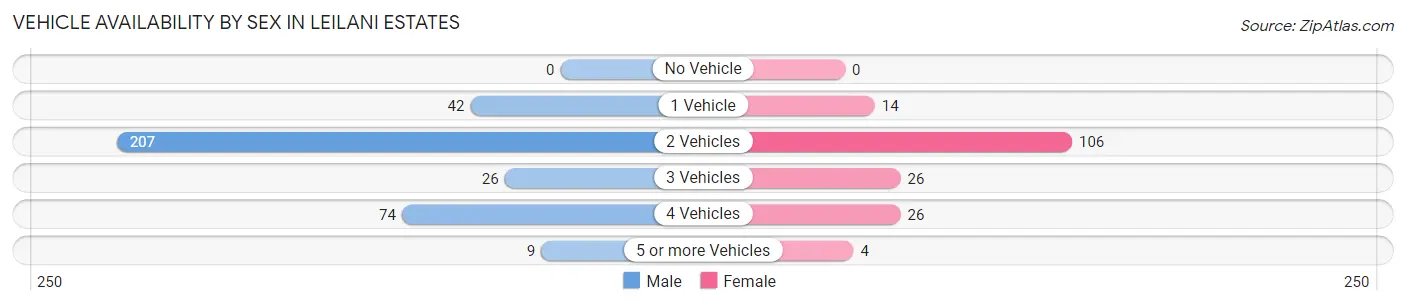
| Vehicles Available | Male | Female |
| No Vehicle | 0 (0.0%) | 0 (0.0%) |
| 1 Vehicle | 42 (11.7%) | 14 (8.0%) |
| 2 Vehicles | 207 (57.8%) | 106 (60.2%) |
| 3 Vehicles | 26 (7.3%) | 26 (14.8%) |
| 4 Vehicles | 74 (20.7%) | 26 (14.8%) |
| 5 or more Vehicles | 9 (2.5%) | 4 (2.3%) |
| Total | 358 (100.0%) | 176 (100.0%) |
Commute Time in Leilani Estates
The most frequently occuring commute durations in Leilani Estates are 30 to 34 minutes (96 commuters, 19.8%), 45 to 59 minutes (67 commuters, 13.8%), and 10 to 14 minutes (54 commuters, 11.2%).
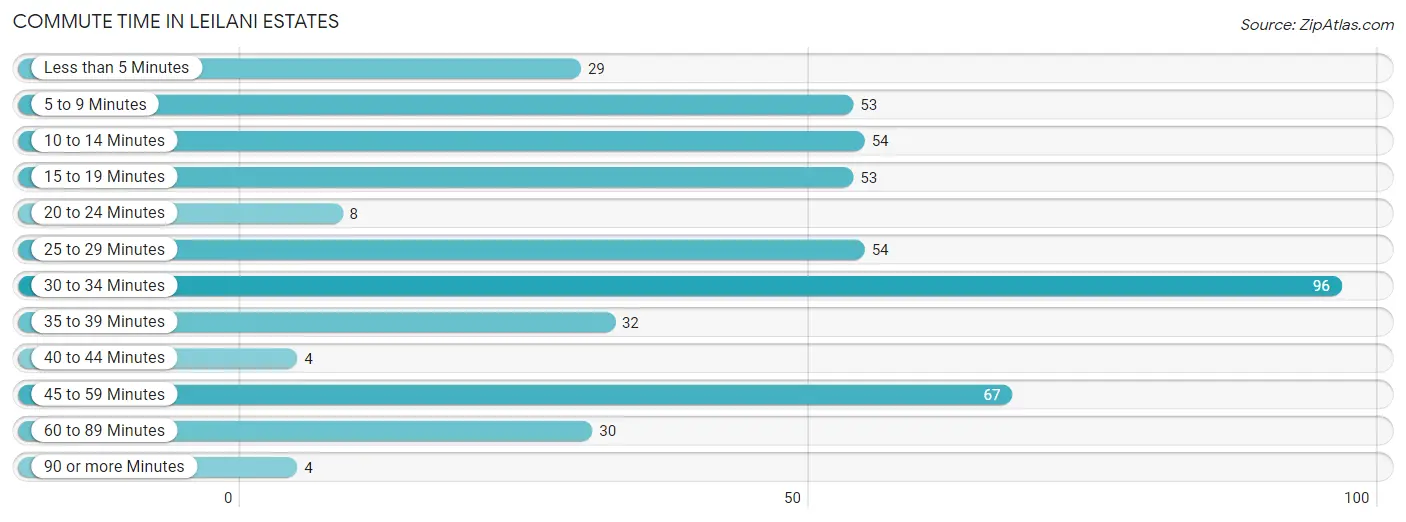
| Commute Time | # Commuters | % Commuters |
| Less than 5 Minutes | 29 | 6.0% |
| 5 to 9 Minutes | 53 | 11.0% |
| 10 to 14 Minutes | 54 | 11.2% |
| 15 to 19 Minutes | 53 | 11.0% |
| 20 to 24 Minutes | 8 | 1.7% |
| 25 to 29 Minutes | 54 | 11.2% |
| 30 to 34 Minutes | 96 | 19.8% |
| 35 to 39 Minutes | 32 | 6.6% |
| 40 to 44 Minutes | 4 | 0.8% |
| 45 to 59 Minutes | 67 | 13.8% |
| 60 to 89 Minutes | 30 | 6.2% |
| 90 or more Minutes | 4 | 0.8% |
Commute Time by Sex in Leilani Estates
The most common commute times in Leilani Estates are 30 to 34 minutes (78 commuters, 24.5%) for males and 60 to 89 minutes (30 commuters, 18.1%) for females.
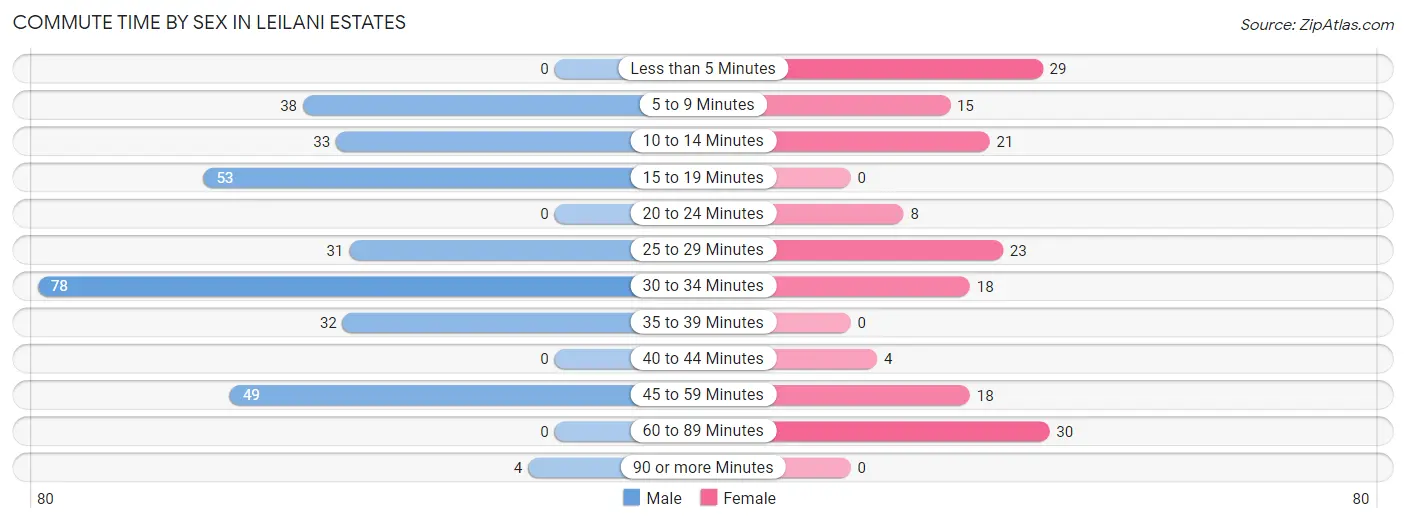
| Commute Time | Male | Female |
| Less than 5 Minutes | 0 (0.0%) | 29 (17.5%) |
| 5 to 9 Minutes | 38 (11.9%) | 15 (9.0%) |
| 10 to 14 Minutes | 33 (10.4%) | 21 (12.7%) |
| 15 to 19 Minutes | 53 (16.7%) | 0 (0.0%) |
| 20 to 24 Minutes | 0 (0.0%) | 8 (4.8%) |
| 25 to 29 Minutes | 31 (9.8%) | 23 (13.9%) |
| 30 to 34 Minutes | 78 (24.5%) | 18 (10.8%) |
| 35 to 39 Minutes | 32 (10.1%) | 0 (0.0%) |
| 40 to 44 Minutes | 0 (0.0%) | 4 (2.4%) |
| 45 to 59 Minutes | 49 (15.4%) | 18 (10.8%) |
| 60 to 89 Minutes | 0 (0.0%) | 30 (18.1%) |
| 90 or more Minutes | 4 (1.3%) | 0 (0.0%) |
Time of Departure to Work by Sex in Leilani Estates
The most frequent times of departure to work in Leilani Estates are 8:00 AM to 8:29 AM (60, 18.9%) for males and 6:30 AM to 6:59 AM (37, 22.3%) for females.
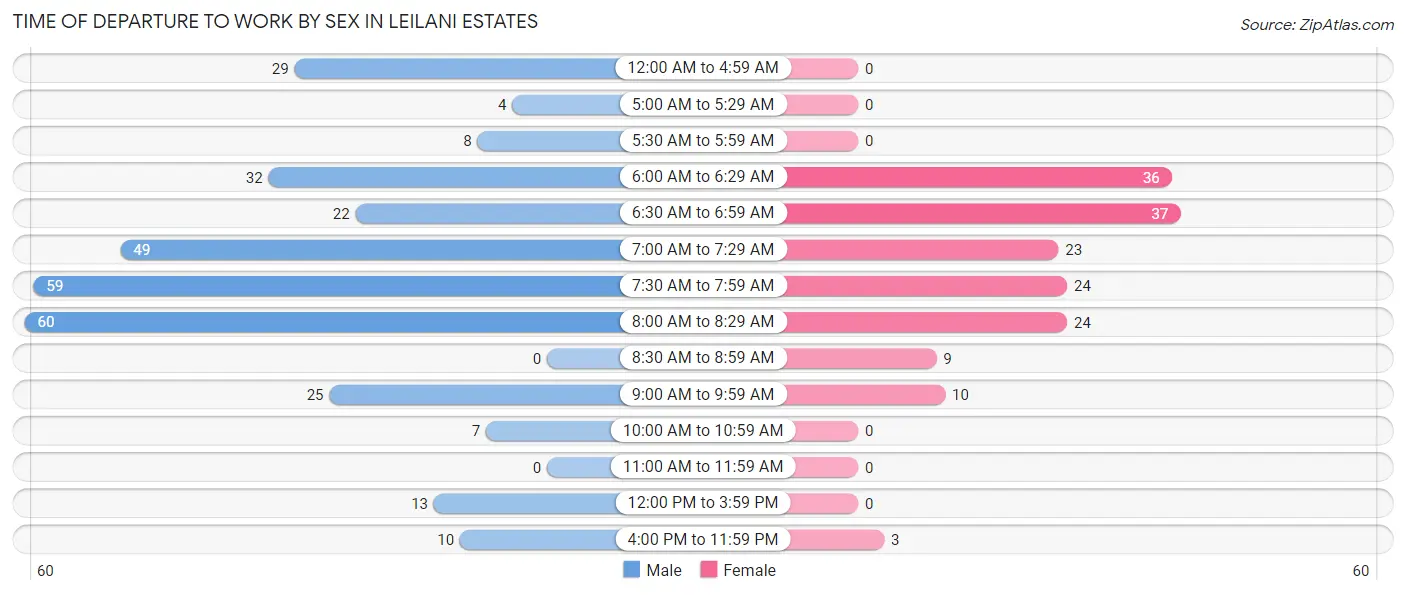
| Time of Departure | Male | Female |
| 12:00 AM to 4:59 AM | 29 (9.1%) | 0 (0.0%) |
| 5:00 AM to 5:29 AM | 4 (1.3%) | 0 (0.0%) |
| 5:30 AM to 5:59 AM | 8 (2.5%) | 0 (0.0%) |
| 6:00 AM to 6:29 AM | 32 (10.1%) | 36 (21.7%) |
| 6:30 AM to 6:59 AM | 22 (6.9%) | 37 (22.3%) |
| 7:00 AM to 7:29 AM | 49 (15.4%) | 23 (13.9%) |
| 7:30 AM to 7:59 AM | 59 (18.5%) | 24 (14.5%) |
| 8:00 AM to 8:29 AM | 60 (18.9%) | 24 (14.5%) |
| 8:30 AM to 8:59 AM | 0 (0.0%) | 9 (5.4%) |
| 9:00 AM to 9:59 AM | 25 (7.9%) | 10 (6.0%) |
| 10:00 AM to 10:59 AM | 7 (2.2%) | 0 (0.0%) |
| 11:00 AM to 11:59 AM | 0 (0.0%) | 0 (0.0%) |
| 12:00 PM to 3:59 PM | 13 (4.1%) | 0 (0.0%) |
| 4:00 PM to 11:59 PM | 10 (3.1%) | 3 (1.8%) |
| Total | 318 (100.0%) | 166 (100.0%) |
Housing Occupancy in Leilani Estates
Occupancy by Ownership in Leilani Estates
Of the total 697 dwellings in Leilani Estates, owner-occupied units account for 590 (84.7%), while renter-occupied units make up 107 (15.3%).
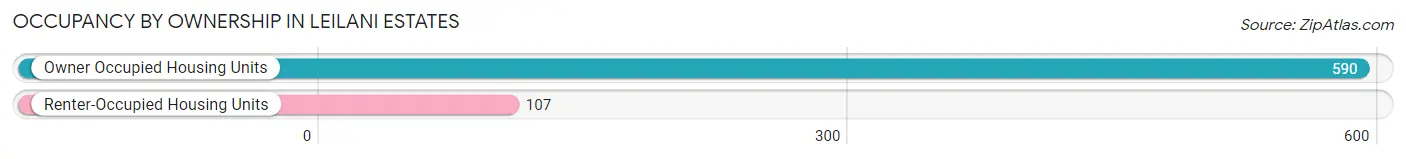
| Occupancy | # Housing Units | % Housing Units |
| Owner Occupied Housing Units | 590 | 84.7% |
| Renter-Occupied Housing Units | 107 | 15.3% |
| Total Occupied Housing Units | 697 | 100.0% |
Occupancy by Household Size in Leilani Estates
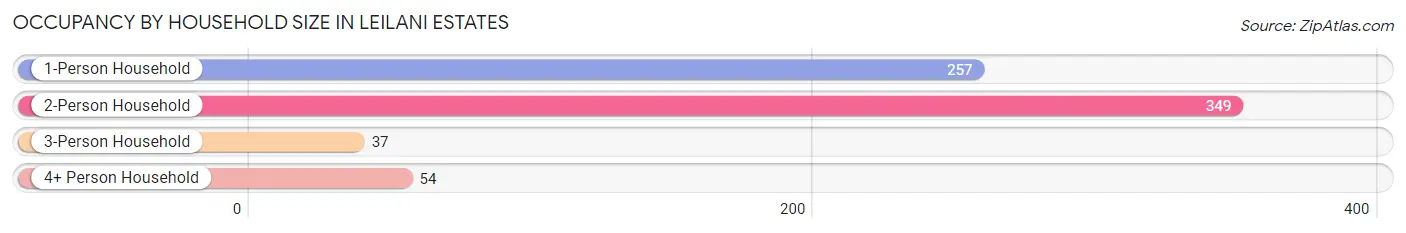
| Household Size | # Housing Units | % Housing Units |
| 1-Person Household | 257 | 36.9% |
| 2-Person Household | 349 | 50.1% |
| 3-Person Household | 37 | 5.3% |
| 4+ Person Household | 54 | 7.7% |
| Total Housing Units | 697 | 100.0% |
Occupancy by Ownership by Household Size in Leilani Estates
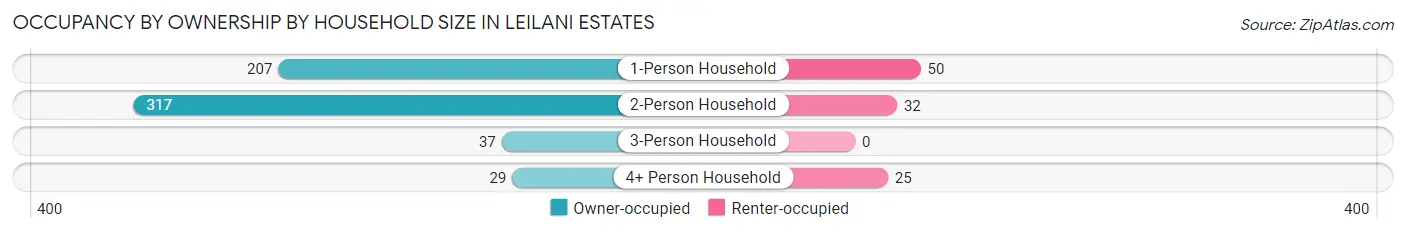
| Household Size | Owner-occupied | Renter-occupied |
| 1-Person Household | 207 (80.5%) | 50 (19.5%) |
| 2-Person Household | 317 (90.8%) | 32 (9.2%) |
| 3-Person Household | 37 (100.0%) | 0 (0.0%) |
| 4+ Person Household | 29 (53.7%) | 25 (46.3%) |
| Total Housing Units | 590 (84.7%) | 107 (15.3%) |
Occupancy by Educational Attainment in Leilani Estates
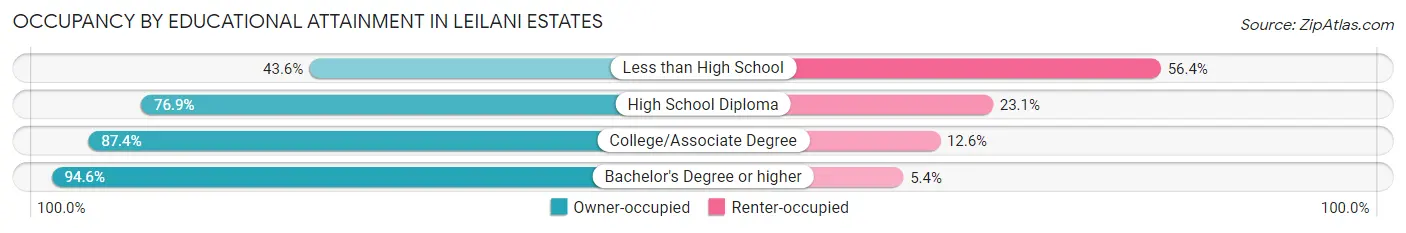
| Household Size | Owner-occupied | Renter-occupied |
| Less than High School | 17 (43.6%) | 22 (56.4%) |
| High School Diploma | 133 (76.9%) | 40 (23.1%) |
| College/Associate Degree | 228 (87.4%) | 33 (12.6%) |
| Bachelor's Degree or higher | 212 (94.6%) | 12 (5.4%) |
Occupancy by Age of Householder in Leilani Estates
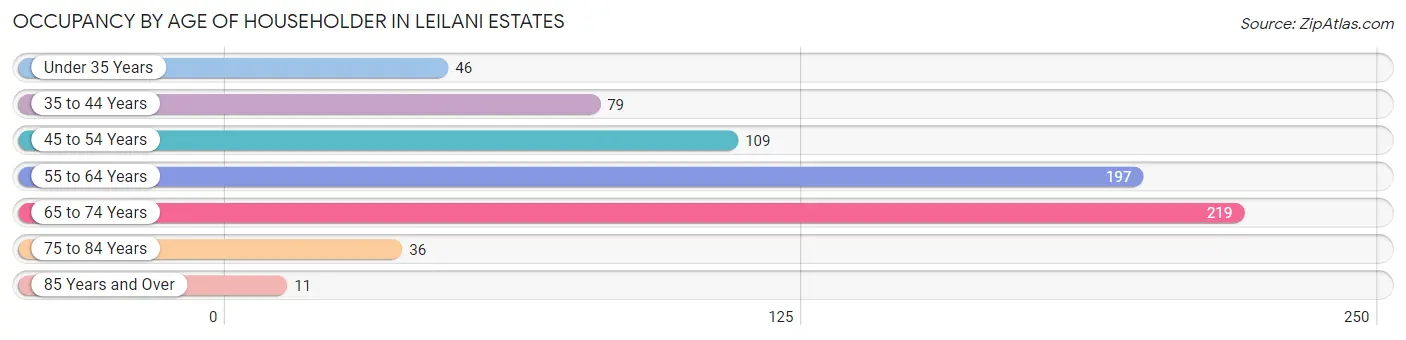
| Age Bracket | # Households | % Households |
| Under 35 Years | 46 | 6.6% |
| 35 to 44 Years | 79 | 11.3% |
| 45 to 54 Years | 109 | 15.6% |
| 55 to 64 Years | 197 | 28.3% |
| 65 to 74 Years | 219 | 31.4% |
| 75 to 84 Years | 36 | 5.2% |
| 85 Years and Over | 11 | 1.6% |
| Total | 697 | 100.0% |
Housing Finances in Leilani Estates
Median Income by Occupancy in Leilani Estates
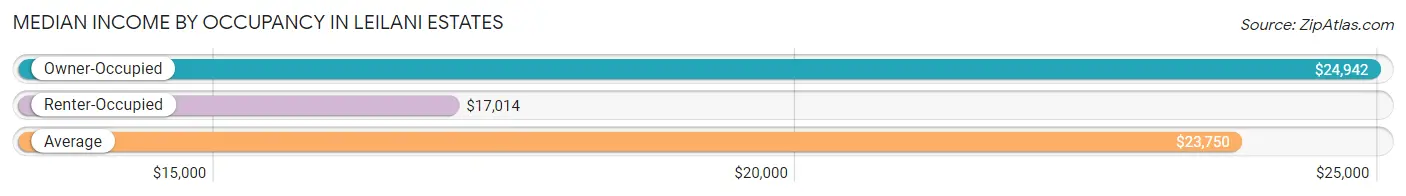
| Occupancy Type | # Households | Median Income |
| Owner-Occupied | 590 (84.7%) | $24,942 |
| Renter-Occupied | 107 (15.3%) | $17,014 |
| Average | 697 (100.0%) | $23,750 |
Occupancy by Householder Income Bracket in Leilani Estates
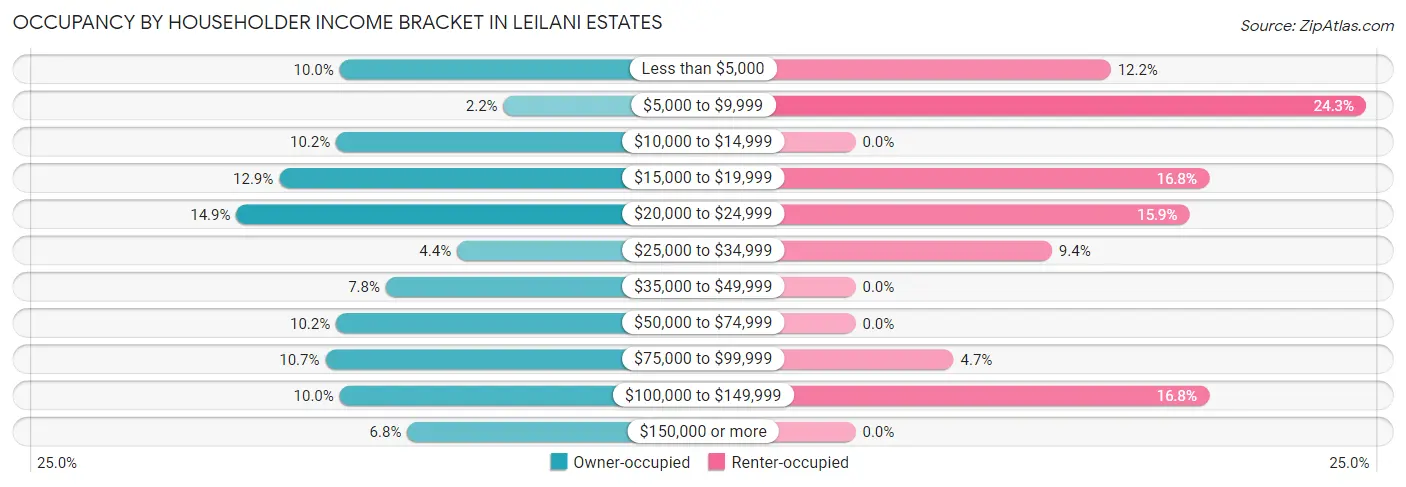
| Income Bracket | Owner-occupied | Renter-occupied |
| Less than $5,000 | 59 (10.0%) | 13 (12.1%) |
| $5,000 to $9,999 | 13 (2.2%) | 26 (24.3%) |
| $10,000 to $14,999 | 60 (10.2%) | 0 (0.0%) |
| $15,000 to $19,999 | 76 (12.9%) | 18 (16.8%) |
| $20,000 to $24,999 | 88 (14.9%) | 17 (15.9%) |
| $25,000 to $34,999 | 26 (4.4%) | 10 (9.3%) |
| $35,000 to $49,999 | 46 (7.8%) | 0 (0.0%) |
| $50,000 to $74,999 | 60 (10.2%) | 0 (0.0%) |
| $75,000 to $99,999 | 63 (10.7%) | 5 (4.7%) |
| $100,000 to $149,999 | 59 (10.0%) | 18 (16.8%) |
| $150,000 or more | 40 (6.8%) | 0 (0.0%) |
| Total | 590 (100.0%) | 107 (100.0%) |
Monthly Housing Cost Tiers in Leilani Estates
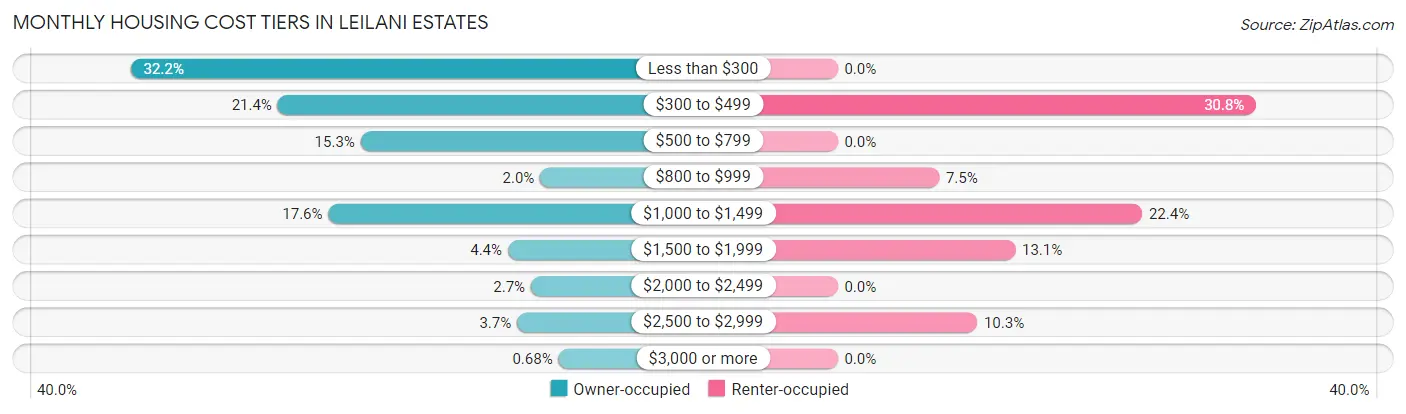
| Monthly Cost | Owner-occupied | Renter-occupied |
| Less than $300 | 190 (32.2%) | 0 (0.0%) |
| $300 to $499 | 126 (21.4%) | 33 (30.8%) |
| $500 to $799 | 90 (15.2%) | 0 (0.0%) |
| $800 to $999 | 12 (2.0%) | 8 (7.5%) |
| $1,000 to $1,499 | 104 (17.6%) | 24 (22.4%) |
| $1,500 to $1,999 | 26 (4.4%) | 14 (13.1%) |
| $2,000 to $2,499 | 16 (2.7%) | 0 (0.0%) |
| $2,500 to $2,999 | 22 (3.7%) | 11 (10.3%) |
| $3,000 or more | 4 (0.7%) | 0 (0.0%) |
| Total | 590 (100.0%) | 107 (100.0%) |
Physical Housing Characteristics in Leilani Estates
Housing Structures in Leilani Estates
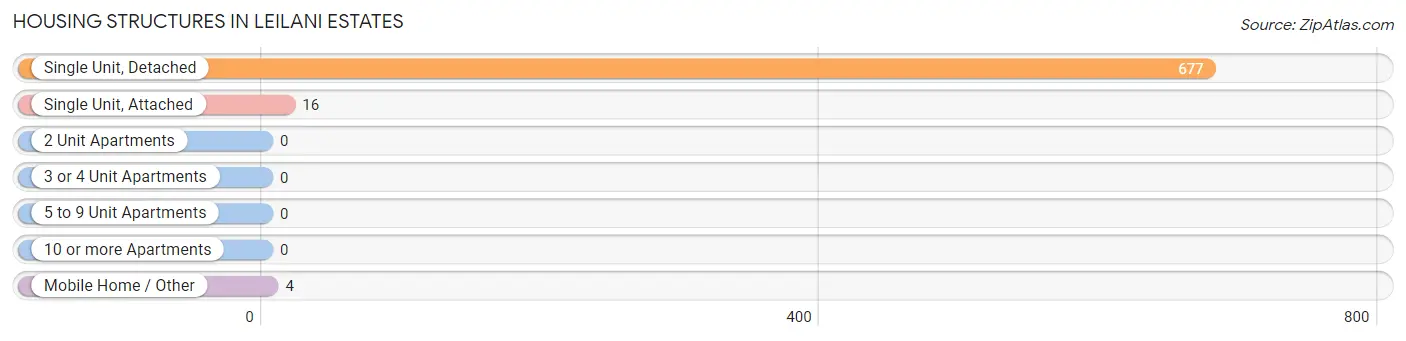
| Structure Type | # Housing Units | % Housing Units |
| Single Unit, Detached | 677 | 97.1% |
| Single Unit, Attached | 16 | 2.3% |
| 2 Unit Apartments | 0 | 0.0% |
| 3 or 4 Unit Apartments | 0 | 0.0% |
| 5 to 9 Unit Apartments | 0 | 0.0% |
| 10 or more Apartments | 0 | 0.0% |
| Mobile Home / Other | 4 | 0.6% |
| Total | 697 | 100.0% |
Housing Structures by Occupancy in Leilani Estates
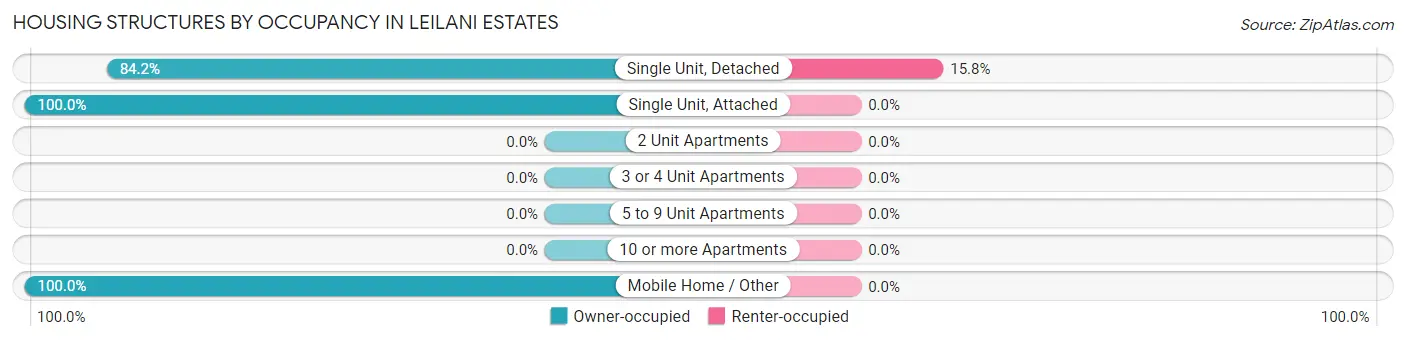
| Structure Type | Owner-occupied | Renter-occupied |
| Single Unit, Detached | 570 (84.2%) | 107 (15.8%) |
| Single Unit, Attached | 16 (100.0%) | 0 (0.0%) |
| 2 Unit Apartments | 0 (0.0%) | 0 (0.0%) |
| 3 or 4 Unit Apartments | 0 (0.0%) | 0 (0.0%) |
| 5 to 9 Unit Apartments | 0 (0.0%) | 0 (0.0%) |
| 10 or more Apartments | 0 (0.0%) | 0 (0.0%) |
| Mobile Home / Other | 4 (100.0%) | 0 (0.0%) |
| Total | 590 (84.7%) | 107 (15.3%) |
Housing Structures by Number of Rooms in Leilani Estates
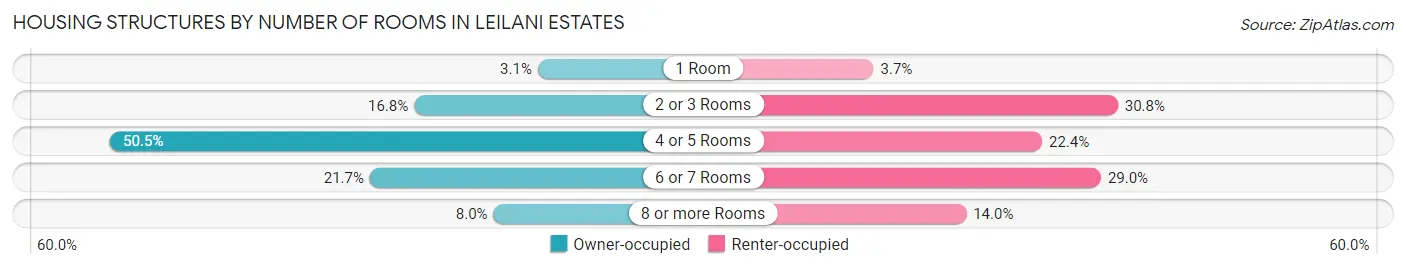
| Number of Rooms | Owner-occupied | Renter-occupied |
| 1 Room | 18 (3.0%) | 4 (3.7%) |
| 2 or 3 Rooms | 99 (16.8%) | 33 (30.8%) |
| 4 or 5 Rooms | 298 (50.5%) | 24 (22.4%) |
| 6 or 7 Rooms | 128 (21.7%) | 31 (29.0%) |
| 8 or more Rooms | 47 (8.0%) | 15 (14.0%) |
| Total | 590 (100.0%) | 107 (100.0%) |
Housing Structure by Heating Type in Leilani Estates
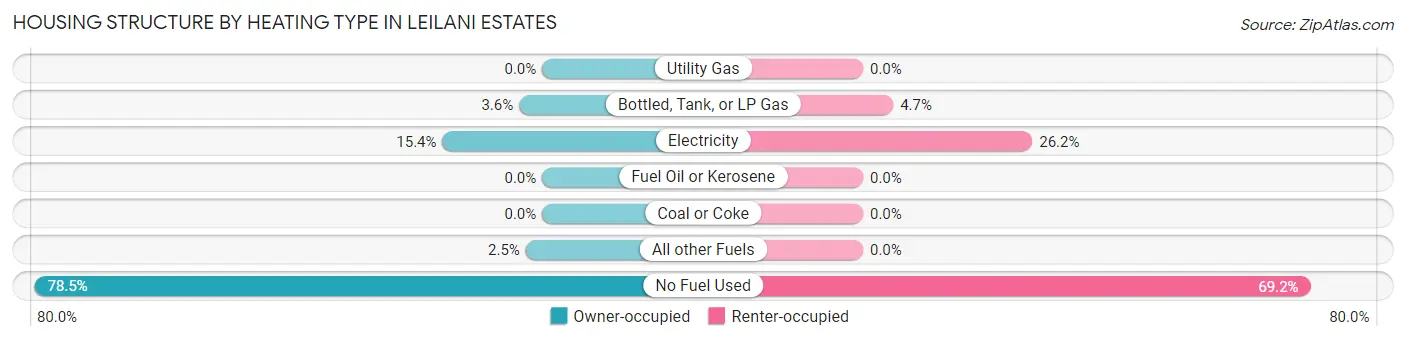
| Heating Type | Owner-occupied | Renter-occupied |
| Utility Gas | 0 (0.0%) | 0 (0.0%) |
| Bottled, Tank, or LP Gas | 21 (3.6%) | 5 (4.7%) |
| Electricity | 91 (15.4%) | 28 (26.2%) |
| Fuel Oil or Kerosene | 0 (0.0%) | 0 (0.0%) |
| Coal or Coke | 0 (0.0%) | 0 (0.0%) |
| All other Fuels | 15 (2.5%) | 0 (0.0%) |
| No Fuel Used | 463 (78.5%) | 74 (69.2%) |
| Total | 590 (100.0%) | 107 (100.0%) |
Household Vehicle Usage in Leilani Estates
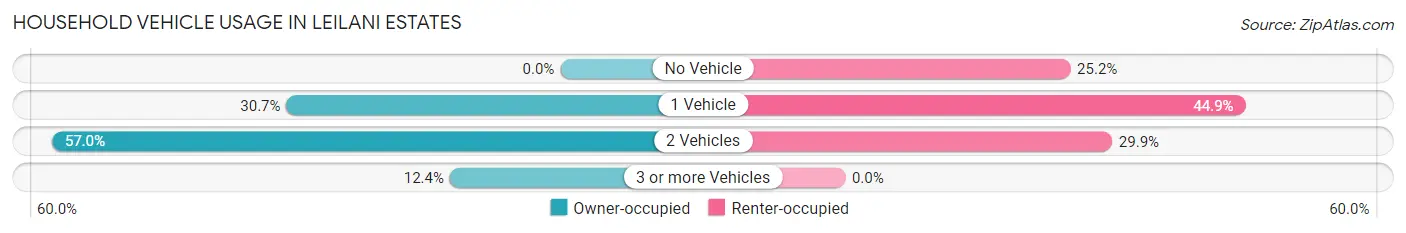
| Vehicles per Household | Owner-occupied | Renter-occupied |
| No Vehicle | 0 (0.0%) | 27 (25.2%) |
| 1 Vehicle | 181 (30.7%) | 48 (44.9%) |
| 2 Vehicles | 336 (57.0%) | 32 (29.9%) |
| 3 or more Vehicles | 73 (12.4%) | 0 (0.0%) |
| Total | 590 (100.0%) | 107 (100.0%) |
Real Estate & Mortgages in Leilani Estates
Real Estate and Mortgage Overview in Leilani Estates
| Characteristic | Without Mortgage | With Mortgage |
| Housing Units | 383 | 207 |
| Median Property Value | $221,700 | $233,500 |
| Median Household Income | $20,742 | $12 |
| Monthly Housing Costs | $302 | $4 |
| Real Estate Taxes | $519 | $27 |
Property Value by Mortgage Status in Leilani Estates
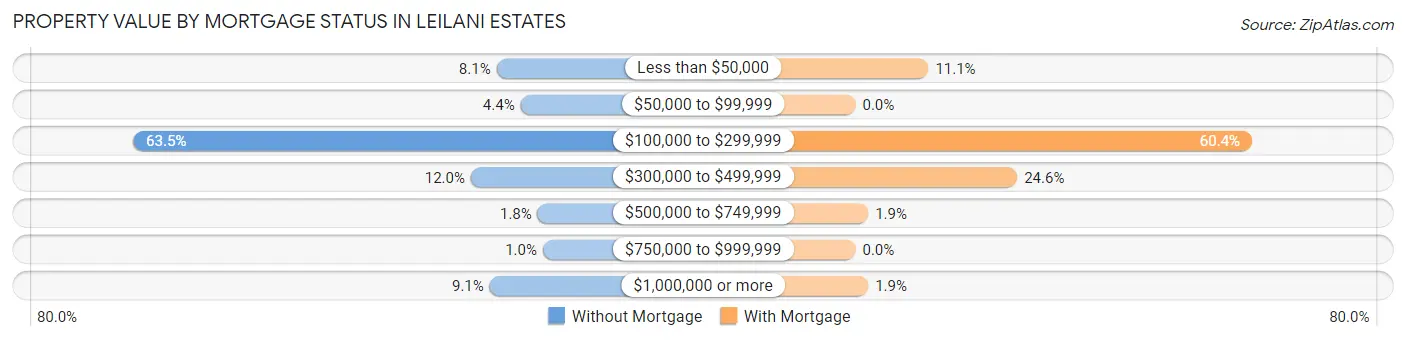
| Property Value | Without Mortgage | With Mortgage |
| Less than $50,000 | 31 (8.1%) | 23 (11.1%) |
| $50,000 to $99,999 | 17 (4.4%) | 0 (0.0%) |
| $100,000 to $299,999 | 243 (63.4%) | 125 (60.4%) |
| $300,000 to $499,999 | 46 (12.0%) | 51 (24.6%) |
| $500,000 to $749,999 | 7 (1.8%) | 4 (1.9%) |
| $750,000 to $999,999 | 4 (1.0%) | 0 (0.0%) |
| $1,000,000 or more | 35 (9.1%) | 4 (1.9%) |
| Total | 383 (100.0%) | 207 (100.0%) |
Household Income by Mortgage Status in Leilani Estates
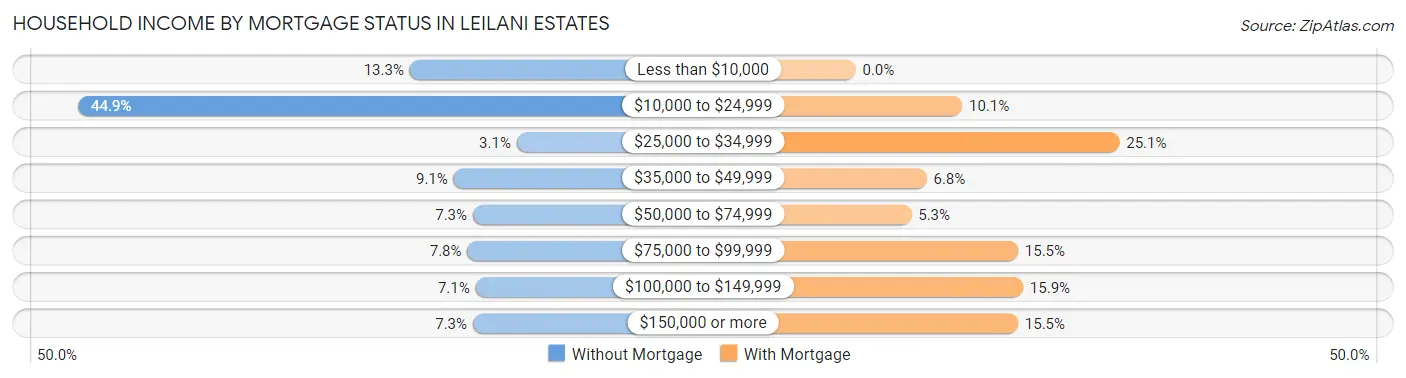
| Household Income | Without Mortgage | With Mortgage |
| Less than $10,000 | 51 (13.3%) | 0 (0.0%) |
| $10,000 to $24,999 | 172 (44.9%) | 21 (10.1%) |
| $25,000 to $34,999 | 12 (3.1%) | 52 (25.1%) |
| $35,000 to $49,999 | 35 (9.1%) | 14 (6.8%) |
| $50,000 to $74,999 | 28 (7.3%) | 11 (5.3%) |
| $75,000 to $99,999 | 30 (7.8%) | 32 (15.5%) |
| $100,000 to $149,999 | 27 (7.0%) | 33 (15.9%) |
| $150,000 or more | 28 (7.3%) | 32 (15.5%) |
| Total | 383 (100.0%) | 207 (100.0%) |
Property Value to Household Income Ratio in Leilani Estates
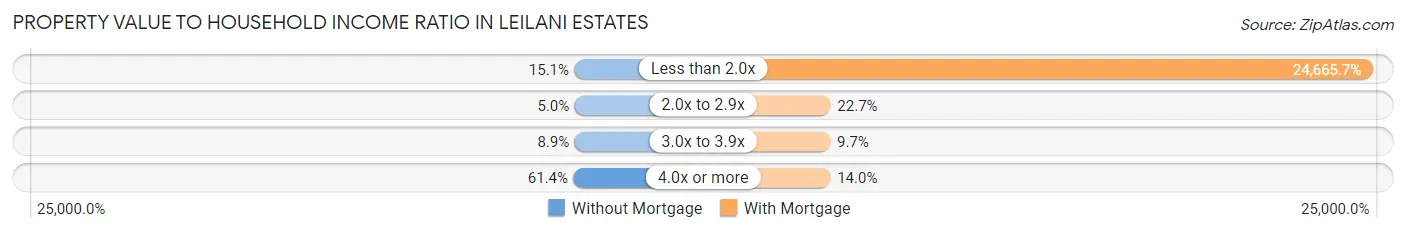
| Value-to-Income Ratio | Without Mortgage | With Mortgage |
| Less than 2.0x | 58 (15.1%) | 51,058 (24,665.7%) |
| 2.0x to 2.9x | 19 (5.0%) | 47 (22.7%) |
| 3.0x to 3.9x | 34 (8.9%) | 20 (9.7%) |
| 4.0x or more | 235 (61.4%) | 29 (14.0%) |
| Total | 383 (100.0%) | 207 (100.0%) |
Real Estate Taxes by Mortgage Status in Leilani Estates
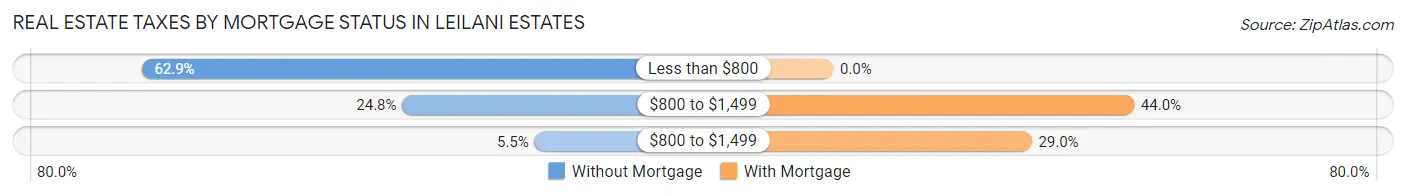
| Property Taxes | Without Mortgage | With Mortgage |
| Less than $800 | 241 (62.9%) | 0 (0.0%) |
| $800 to $1,499 | 95 (24.8%) | 91 (44.0%) |
| $800 to $1,499 | 21 (5.5%) | 60 (29.0%) |
| Total | 383 (100.0%) | 207 (100.0%) |
Health & Disability in Leilani Estates
Health Insurance Coverage by Age in Leilani Estates
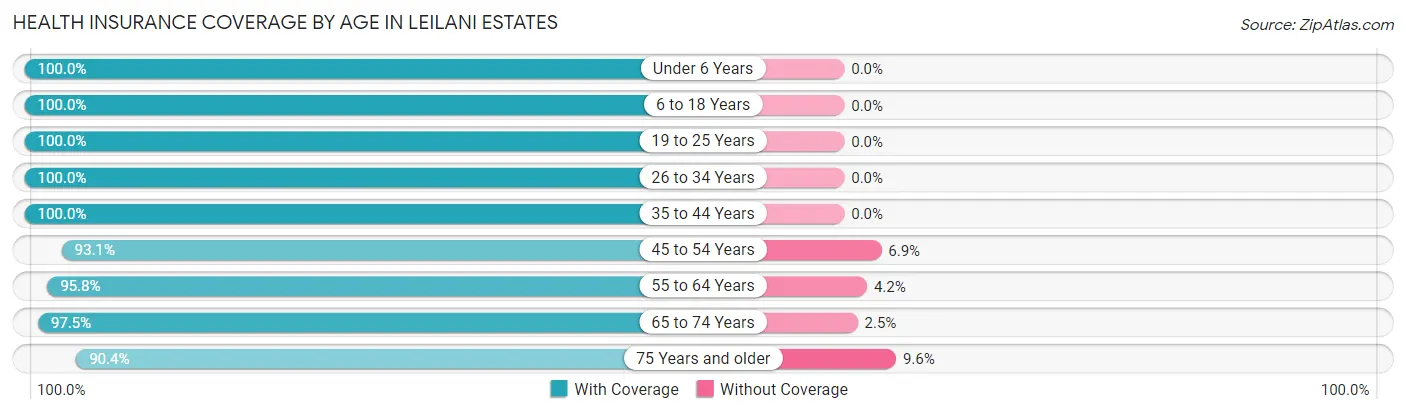
| Age Bracket | With Coverage | Without Coverage |
| Under 6 Years | 165 (100.0%) | 0 (0.0%) |
| 6 to 18 Years | 161 (100.0%) | 0 (0.0%) |
| 19 to 25 Years | 114 (100.0%) | 0 (0.0%) |
| 26 to 34 Years | 130 (100.0%) | 0 (0.0%) |
| 35 to 44 Years | 163 (100.0%) | 0 (0.0%) |
| 45 to 54 Years | 175 (93.1%) | 13 (6.9%) |
| 55 to 64 Years | 272 (95.8%) | 12 (4.2%) |
| 65 to 74 Years | 315 (97.5%) | 8 (2.5%) |
| 75 Years and older | 75 (90.4%) | 8 (9.6%) |
| Total | 1,570 (97.5%) | 41 (2.5%) |
Health Insurance Coverage by Citizenship Status in Leilani Estates
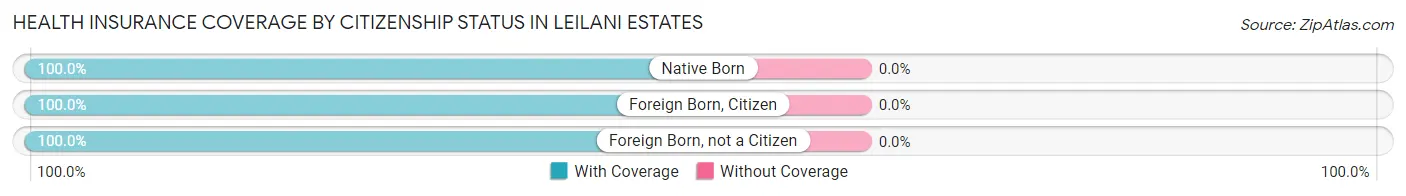
| Citizenship Status | With Coverage | Without Coverage |
| Native Born | 165 (100.0%) | 0 (0.0%) |
| Foreign Born, Citizen | 161 (100.0%) | 0 (0.0%) |
| Foreign Born, not a Citizen | 114 (100.0%) | 0 (0.0%) |
Health Insurance Coverage by Household Income in Leilani Estates
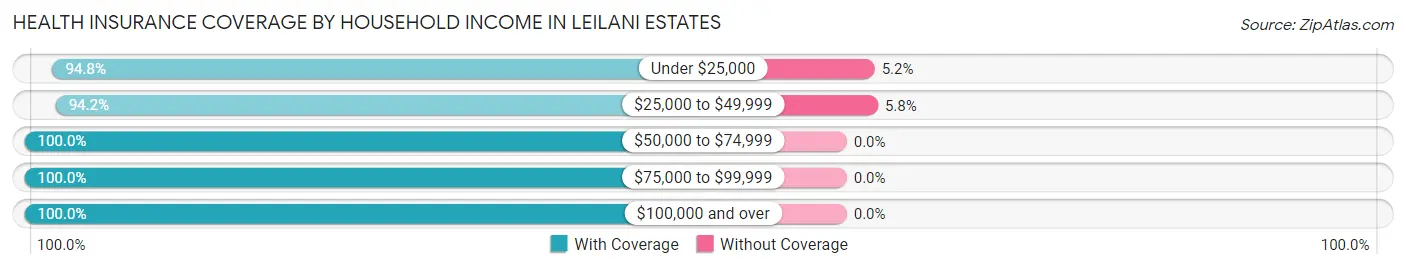
| Household Income | With Coverage | Without Coverage |
| Under $25,000 | 598 (94.8%) | 33 (5.2%) |
| $25,000 to $49,999 | 129 (94.2%) | 8 (5.8%) |
| $50,000 to $74,999 | 239 (100.0%) | 0 (0.0%) |
| $75,000 to $99,999 | 163 (100.0%) | 0 (0.0%) |
| $100,000 and over | 441 (100.0%) | 0 (0.0%) |
Public vs Private Health Insurance Coverage by Age in Leilani Estates
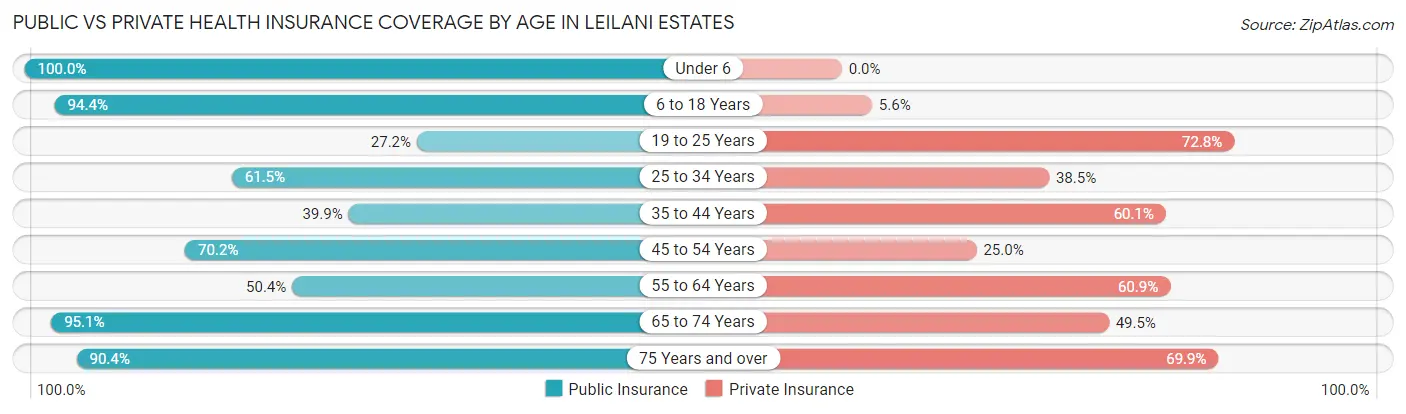
| Age Bracket | Public Insurance | Private Insurance |
| Under 6 | 165 (100.0%) | 0 (0.0%) |
| 6 to 18 Years | 152 (94.4%) | 9 (5.6%) |
| 19 to 25 Years | 31 (27.2%) | 83 (72.8%) |
| 25 to 34 Years | 80 (61.5%) | 50 (38.5%) |
| 35 to 44 Years | 65 (39.9%) | 98 (60.1%) |
| 45 to 54 Years | 132 (70.2%) | 47 (25.0%) |
| 55 to 64 Years | 143 (50.3%) | 173 (60.9%) |
| 65 to 74 Years | 307 (95.1%) | 160 (49.5%) |
| 75 Years and over | 75 (90.4%) | 58 (69.9%) |
| Total | 1,150 (71.4%) | 678 (42.1%) |
Disability Status by Sex by Age in Leilani Estates
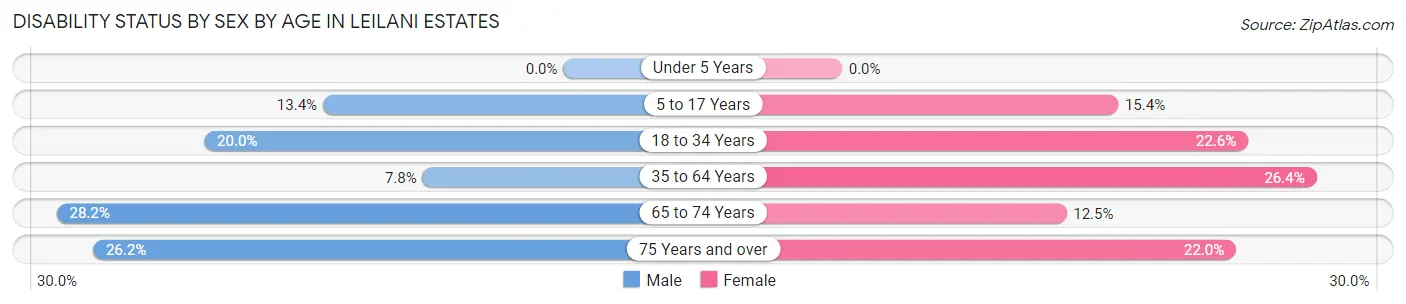
| Age Bracket | Male | Female |
| Under 5 Years | 0 (0.0%) | 0 (0.0%) |
| 5 to 17 Years | 17 (13.4%) | 12 (15.4%) |
| 18 to 34 Years | 32 (20.0%) | 19 (22.6%) |
| 35 to 64 Years | 32 (7.8%) | 60 (26.4%) |
| 65 to 74 Years | 46 (28.2%) | 20 (12.5%) |
| 75 Years and over | 11 (26.2%) | 9 (22.0%) |
Disability Class by Sex by Age in Leilani Estates
Disability Class: Hearing Difficulty
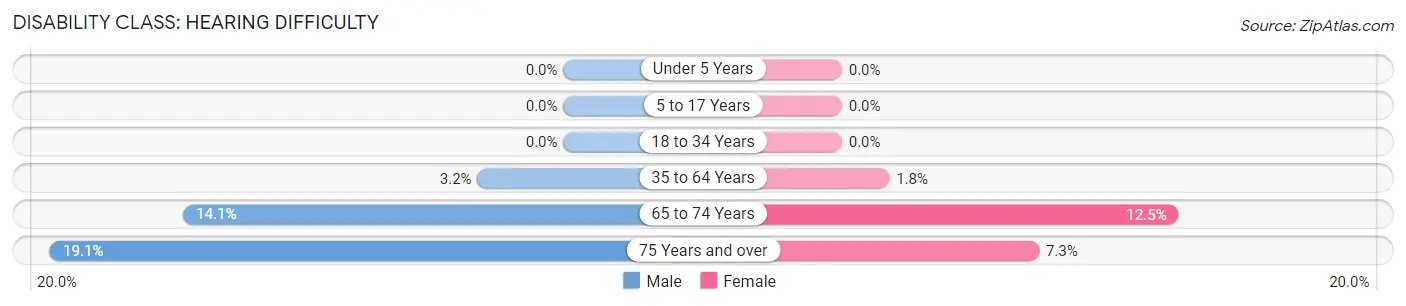
| Age Bracket | Male | Female |
| Under 5 Years | 0 (0.0%) | 0 (0.0%) |
| 5 to 17 Years | 0 (0.0%) | 0 (0.0%) |
| 18 to 34 Years | 0 (0.0%) | 0 (0.0%) |
| 35 to 64 Years | 13 (3.2%) | 4 (1.8%) |
| 65 to 74 Years | 23 (14.1%) | 20 (12.5%) |
| 75 Years and over | 8 (19.1%) | 3 (7.3%) |
Disability Class: Vision Difficulty
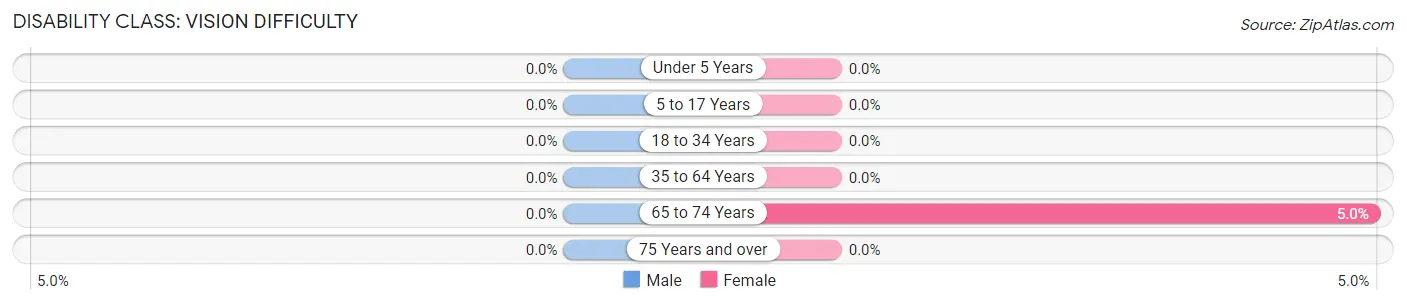
| Age Bracket | Male | Female |
| Under 5 Years | 0 (0.0%) | 0 (0.0%) |
| 5 to 17 Years | 0 (0.0%) | 0 (0.0%) |
| 18 to 34 Years | 0 (0.0%) | 0 (0.0%) |
| 35 to 64 Years | 0 (0.0%) | 0 (0.0%) |
| 65 to 74 Years | 0 (0.0%) | 8 (5.0%) |
| 75 Years and over | 0 (0.0%) | 0 (0.0%) |
Disability Class: Cognitive Difficulty
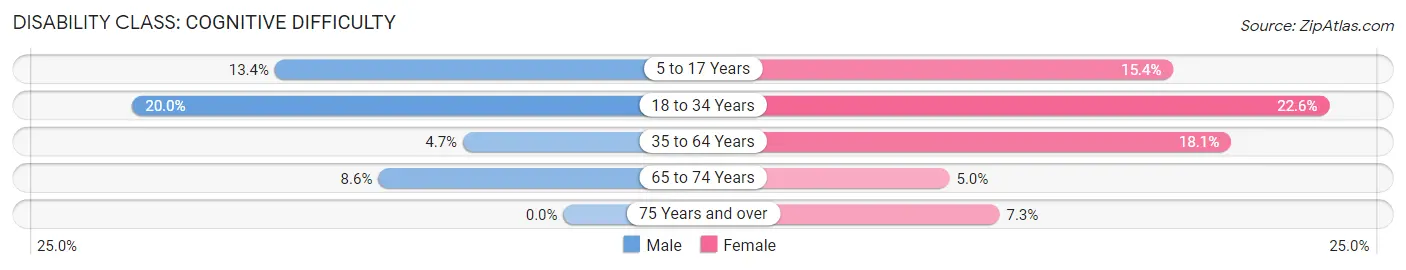
| Age Bracket | Male | Female |
| 5 to 17 Years | 17 (13.4%) | 12 (15.4%) |
| 18 to 34 Years | 32 (20.0%) | 19 (22.6%) |
| 35 to 64 Years | 19 (4.7%) | 41 (18.1%) |
| 65 to 74 Years | 14 (8.6%) | 8 (5.0%) |
| 75 Years and over | 0 (0.0%) | 3 (7.3%) |
Disability Class: Ambulatory Difficulty
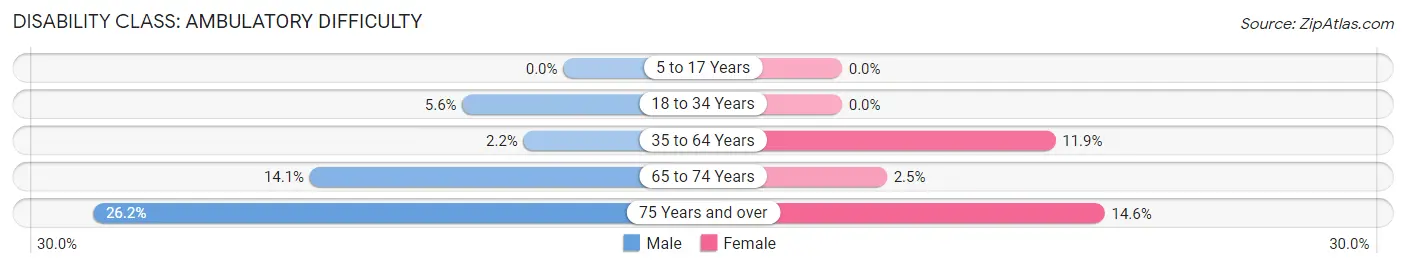
| Age Bracket | Male | Female |
| 5 to 17 Years | 0 (0.0%) | 0 (0.0%) |
| 18 to 34 Years | 9 (5.6%) | 0 (0.0%) |
| 35 to 64 Years | 9 (2.2%) | 27 (11.9%) |
| 65 to 74 Years | 23 (14.1%) | 4 (2.5%) |
| 75 Years and over | 11 (26.2%) | 6 (14.6%) |
Disability Class: Self-Care Difficulty
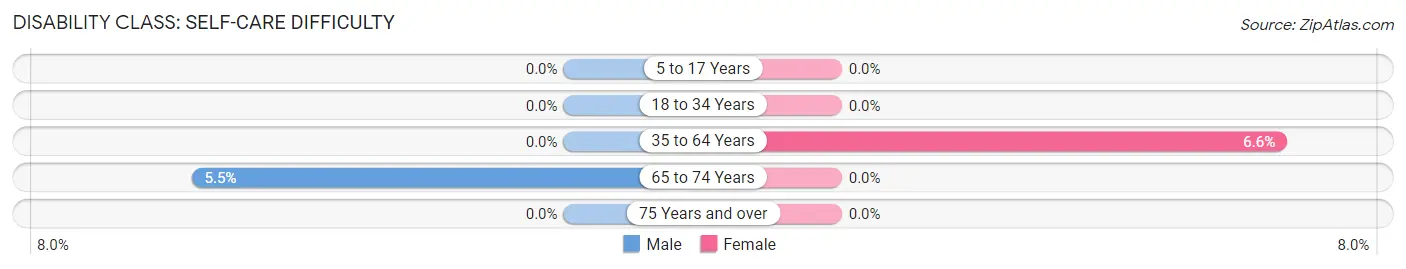
| Age Bracket | Male | Female |
| 5 to 17 Years | 0 (0.0%) | 0 (0.0%) |
| 18 to 34 Years | 0 (0.0%) | 0 (0.0%) |
| 35 to 64 Years | 0 (0.0%) | 15 (6.6%) |
| 65 to 74 Years | 9 (5.5%) | 0 (0.0%) |
| 75 Years and over | 0 (0.0%) | 0 (0.0%) |
Technology Access in Leilani Estates
Computing Device Access in Leilani Estates
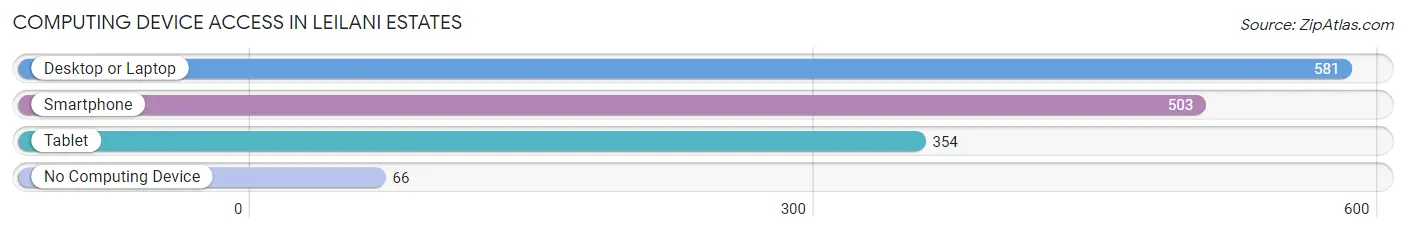
| Device Type | # Households | % Households |
| Desktop or Laptop | 581 | 83.4% |
| Smartphone | 503 | 72.2% |
| Tablet | 354 | 50.8% |
| No Computing Device | 66 | 9.5% |
| Total | 697 | 100.0% |
Internet Access in Leilani Estates
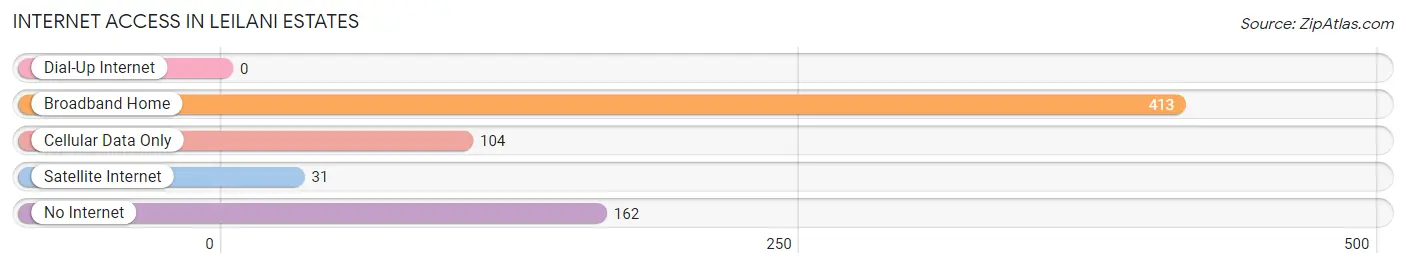
| Internet Type | # Households | % Households |
| Dial-Up Internet | 0 | 0.0% |
| Broadband Home | 413 | 59.3% |
| Cellular Data Only | 104 | 14.9% |
| Satellite Internet | 31 | 4.4% |
| No Internet | 162 | 23.2% |
| Total | 697 | 100.0% |
Leilani Estates Summary
Leilani Estates is a residential subdivision located in the Puna District of the Big Island of Hawaii. It is situated on the eastern side of the island, just south of the town of Pahoa. The area is known for its lush tropical vegetation, stunning views of the Pacific Ocean, and its unique volcanic landscape.
Geography
Leilani Estates is located in the Puna District of the Big Island of Hawaii. It is situated on the eastern side of the island, just south of the town of Pahoa. The area is known for its lush tropical vegetation, stunning views of the Pacific Ocean, and its unique volcanic landscape. The area is home to the active Kilauea volcano, which is one of the most active volcanoes in the world. The area is also home to numerous lava flows, which have created a unique and diverse landscape. The area is also known for its numerous hot springs, which are popular tourist attractions.
Economy
Leilani Estates is primarily a residential area, with most of the population living in single-family homes. The area is also home to a few small businesses, such as restaurants, convenience stores, and gas stations. The area is also home to a few small farms, which produce a variety of fruits and vegetables. The area is also home to a few small tourist attractions, such as the Kilauea Volcano and the hot springs.
Demographics
As of the 2010 census, the population of Leilani Estates was 2,831. The population is primarily of Hawaiian and other Pacific Islander descent. The median age of the population is 44.7 years, and the median household income is $50,945. The area is also home to a large number of retirees, as well as a growing number of young professionals.
History
Leilani Estates was originally developed in the late 1960s as a residential subdivision. The area was originally intended to be a retirement community, but it quickly became popular with young families and professionals. The area was also home to a number of small farms, which produced a variety of fruits and vegetables. In the 1980s, the area was hit hard by the eruption of the Kilauea volcano, which destroyed many of the homes and businesses in the area. In the 1990s, the area began to recover, and the population began to grow again. Today, Leilani Estates is a thriving residential community, with a growing population and a vibrant economy.
Common Questions
What is the Total Population of Leilani Estates?
Total Population of Leilani Estates is 1,611.
What is the Total Male Population of Leilani Estates?
Total Male Population of Leilani Estates is 1,021.
What is the Total Female Population of Leilani Estates?
Total Female Population of Leilani Estates is 590.
What is the Ratio of Males per 100 Females in Leilani Estates?
There are 173.05 Males per 100 Females in Leilani Estates.
What is the Ratio of Females per 100 Males in Leilani Estates?
There are 57.79 Females per 100 Males in Leilani Estates.
What is the Median Population Age in Leilani Estates?
Median Population Age in Leilani Estates is 49.3 Years.
What is the Average Family Size in Leilani Estates
Average Family Size in Leilani Estates is 3.1 People.
What is the Average Household Size in Leilani Estates
Average Household Size in Leilani Estates is 2.3 People.
What is Per Capita Income in Leilani Estates?
Per Capita income in Leilani Estates is $24,787.
What is the Median Family Income in Leilani Estates?
Median Family Income in Leilani Estates is $36,726.
What is the Median Household income in Leilani Estates?
Median Household Income in Leilani Estates is $23,750.
What is Income or Wage Gap in Leilani Estates?
Income or Wage Gap in Leilani Estates is 36.4%.
Women in Leilani Estates earn 63.6 cents for every dollar earned by a man.
What is Inequality or Gini Index in Leilani Estates?
Inequality or Gini Index in Leilani Estates is 0.56.
How Large is the Labor Force in Leilani Estates?
There are 687 People in the Labor Forcein in Leilani Estates.
What is the Percentage of People in the Labor Force in Leilani Estates?
53.3% of People are in the Labor Force in Leilani Estates.
What is the Unemployment Rate in Leilani Estates?
Unemployment Rate in Leilani Estates is 19.2%.