Zip Codes with the Highest Percentage of Population Employed in Food Preparation & Serving in Honolulu, HI
RELATED REPORTS & OPTIONS
Food Preparation & Serving
Honolulu
Compare Zip Codes
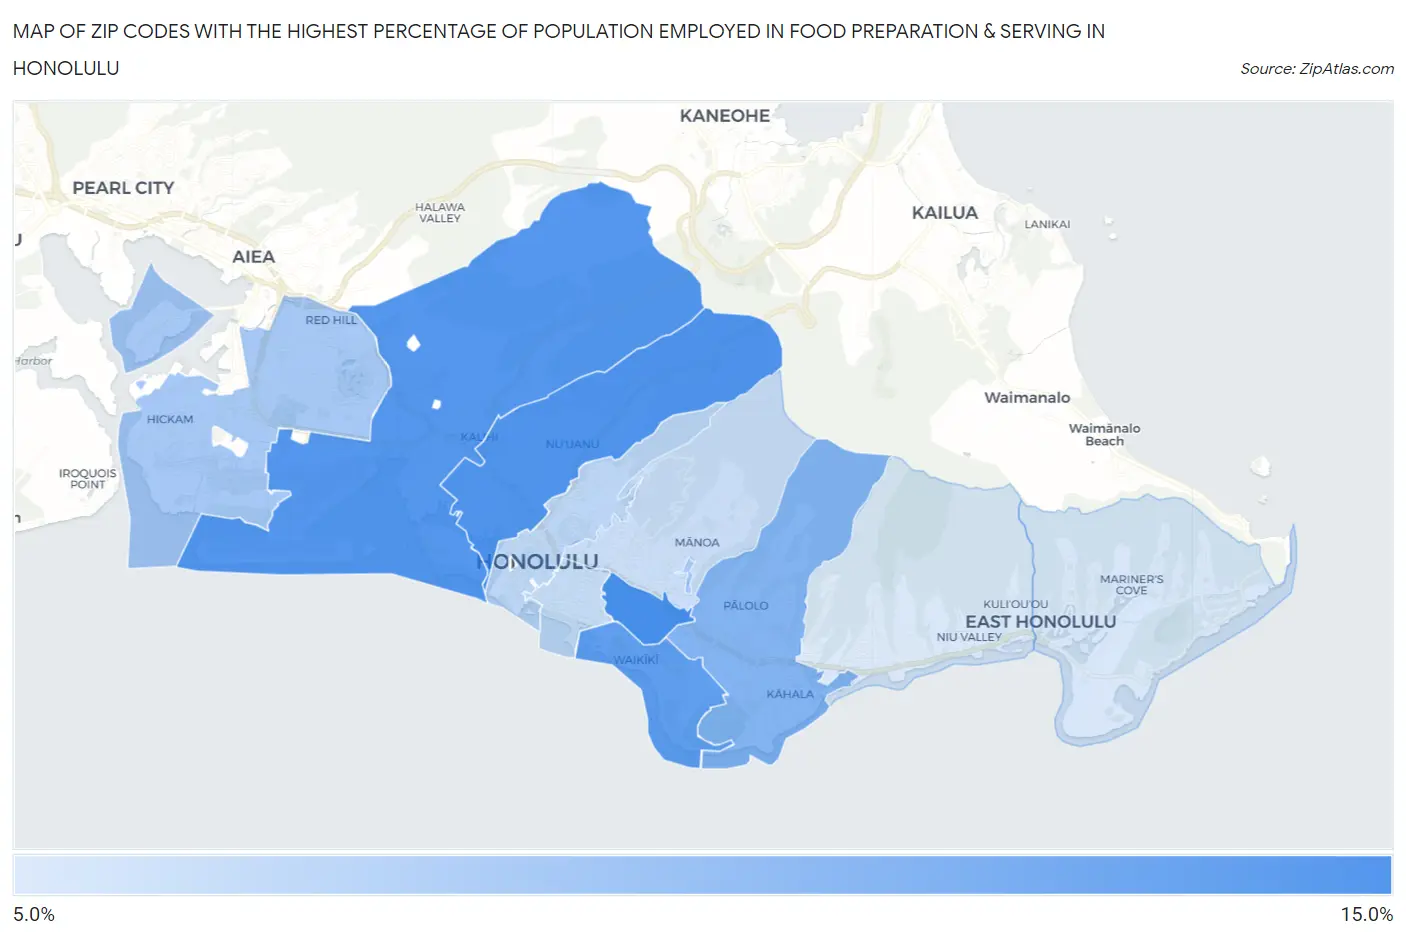
Map of Zip Codes with the Highest Percentage of Population Employed in Food Preparation & Serving in Honolulu
0.0%
15.0%
Zip Codes with the Highest Percentage of Population Employed in Food Preparation & Serving in Honolulu, HI
| Zip Code | % Employed | vs State | vs National | |
| 1. | 96826 | 11.8% | 7.7%(+4.04)#17 | 5.3%(+6.48)#1,746 |
| 2. | 96817 | 11.3% | 7.7%(+3.61)#19 | 5.3%(+6.04)#1,905 |
| 3. | 96819 | 11.1% | 7.7%(+3.41)#20 | 5.3%(+5.84)#1,991 |
| 4. | 96815 | 10.6% | 7.7%(+2.84)#21 | 5.3%(+5.27)#2,298 |
| 5. | 96816 | 9.1% | 7.7%(+1.35)#32 | 5.3%(+3.78)#3,458 |
| 6. | 96818 | 7.5% | 7.7%(-0.194)#42 | 5.3%(+2.24)#5,504 |
| 7. | 96848 | 7.5% | 7.7%(-0.210)#43 | 5.3%(+2.22)#5,545 |
| 8. | 96813 | 6.5% | 7.7%(-1.17)#51 | 5.3%(+1.26)#7,740 |
| 9. | 96814 | 6.2% | 7.7%(-1.49)#54 | 5.3%(+0.949)#8,628 |
| 10. | 96822 | 5.9% | 7.7%(-1.83)#59 | 5.3%(+0.601)#9,730 |
| 11. | 96825 | 5.3% | 7.7%(-2.40)#68 | 5.3%(+0.037)#11,679 |
| 12. | 96821 | 5.1% | 7.7%(-2.61)#72 | 5.3%(-0.175)#12,502 |
1
Common Questions
What are the Top 10 Zip Codes with the Highest Percentage of Population Employed in Food Preparation & Serving in Honolulu, HI?
Top 10 Zip Codes with the Highest Percentage of Population Employed in Food Preparation & Serving in Honolulu, HI are:
What zip code has the Highest Percentage of Population Employed in Food Preparation & Serving in Honolulu, HI?
96826 has the Highest Percentage of Population Employed in Food Preparation & Serving in Honolulu, HI with 11.8%.
What is the Percentage of Population Employed in Food Preparation & Serving in Hawaii?
Percentage of Population Employed in Food Preparation & Serving in Hawaii is 7.7%.
What is the Percentage of Population Employed in Food Preparation & Serving in the United States?
Percentage of Population Employed in Food Preparation & Serving in the United States is 5.3%.