Hawaiian Paradise Park, HI
Hawaiian Paradise Park Map
Hawaiian Paradise Park Overview
13,041
TOTAL POPULATION
6,160
MALE POPULATION
6,881
FEMALE POPULATION
89.52
MALES / 100 FEMALES
111.70
FEMALES / 100 MALES
40.0
MEDIAN AGE
3.3
AVG FAMILY SIZE
2.9
AVG HOUSEHOLD SIZE
$32,420
PER CAPITA INCOME
$85,093
AVG FAMILY INCOME
$81,236
AVG HOUSEHOLD INCOME
20.6%
WAGE / INCOME GAP [ % ]
79.4¢/ $1
WAGE / INCOME GAP [ $ ]
0.42
INEQUALITY / GINI INDEX
6,459
LABOR FORCE [ PEOPLE ]
63.5%
PERCENT IN LABOR FORCE
1.7%
UNEMPLOYMENT RATE
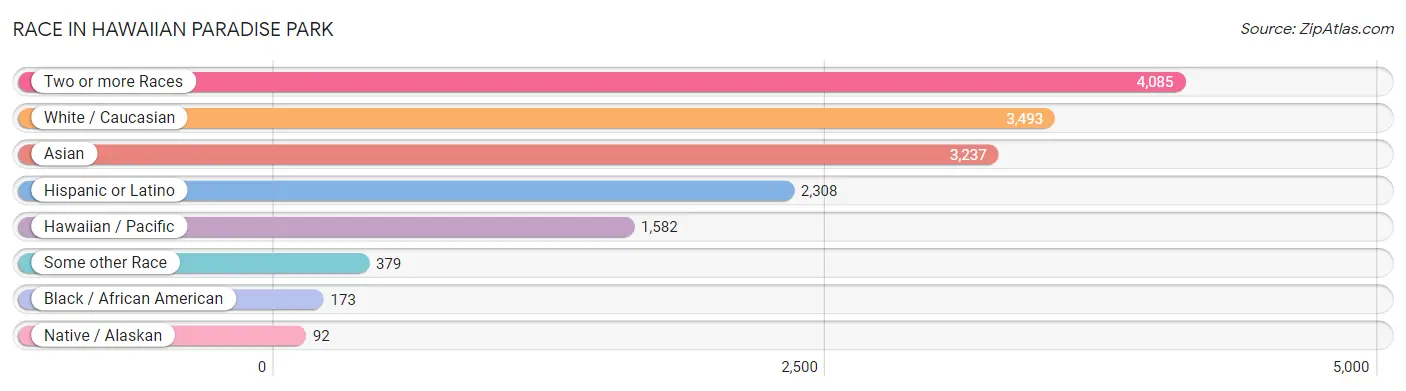
Race in Hawaiian Paradise Park
The most populous races in Hawaiian Paradise Park are Two or more Races (4,085 | 31.3%), White / Caucasian (3,493 | 26.8%), and Asian (3,237 | 24.8%).
| Race | # Population | % Population |
| Asian | 3,237 | 24.8% |
| Black / African American | 173 | 1.3% |
| Hawaiian / Pacific | 1,582 | 12.1% |
| Hispanic or Latino | 2,308 | 17.7% |
| Native / Alaskan | 92 | 0.7% |
| White / Caucasian | 3,493 | 26.8% |
| Two or more Races | 4,085 | 31.3% |
| Some other Race | 379 | 2.9% |
| Total | 13,041 | 100.0% |
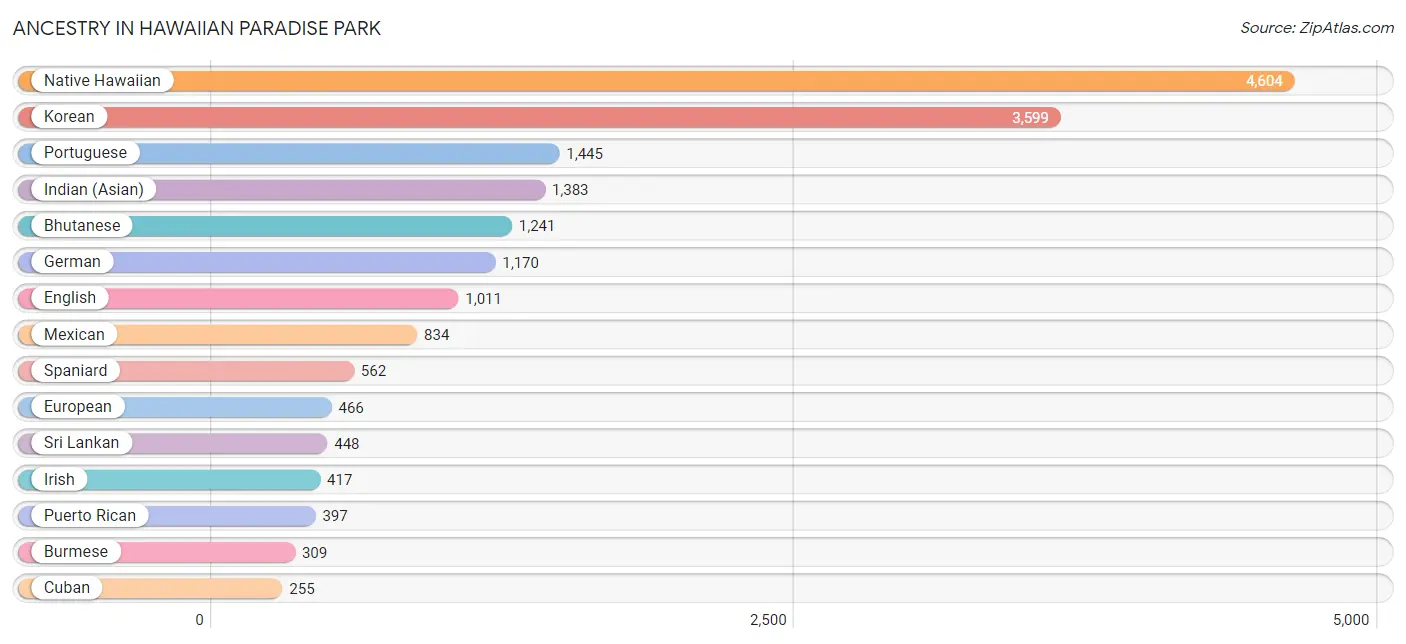
Ancestry in Hawaiian Paradise Park
The most populous ancestries reported in Hawaiian Paradise Park are Native Hawaiian (4,604 | 35.3%), Korean (3,599 | 27.6%), Portuguese (1,445 | 11.1%), Indian (Asian) (1,383 | 10.6%), and Bhutanese (1,241 | 9.5%), together accounting for 94.1% of all Hawaiian Paradise Park residents.
| Ancestry | # Population | % Population |
| Arab | 45 | 0.4% |
| Argentinean | 28 | 0.2% |
| Bhutanese | 1,241 | 9.5% |
| Burmese | 309 | 2.4% |
| Cherokee | 26 | 0.2% |
| Chinese | 94 | 0.7% |
| Cuban | 255 | 2.0% |
| Dutch | 139 | 1.1% |
| English | 1,011 | 7.7% |
| European | 466 | 3.6% |
| French | 203 | 1.6% |
| French Canadian | 23 | 0.2% |
| German | 1,170 | 9.0% |
| Hungarian | 115 | 0.9% |
| Indian (Asian) | 1,383 | 10.6% |
| Iranian | 46 | 0.4% |
| Irish | 417 | 3.2% |
| Iroquois | 26 | 0.2% |
| Italian | 179 | 1.4% |
| Korean | 3,599 | 27.6% |
| Mexican | 834 | 6.4% |
| Native Hawaiian | 4,604 | 35.3% |
| Norwegian | 155 | 1.2% |
| Pakistani | 138 | 1.1% |
| Polish | 50 | 0.4% |
| Portuguese | 1,445 | 11.1% |
| Puerto Rican | 397 | 3.0% |
| Russian | 66 | 0.5% |
| Samoan | 3 | 0.0% |
| Scandinavian | 183 | 1.4% |
| Scotch-Irish | 36 | 0.3% |
| Scottish | 239 | 1.8% |
| Seminole | 66 | 0.5% |
| South American | 28 | 0.2% |
| Spaniard | 562 | 4.3% |
| Spanish | 109 | 0.8% |
| Sri Lankan | 448 | 3.4% |
| Swedish | 195 | 1.5% |
| Thai | 74 | 0.6% |
| Tlingit-Haida | 51 | 0.4% |
| Ukrainian | 66 | 0.5% | View All 41 Rows |
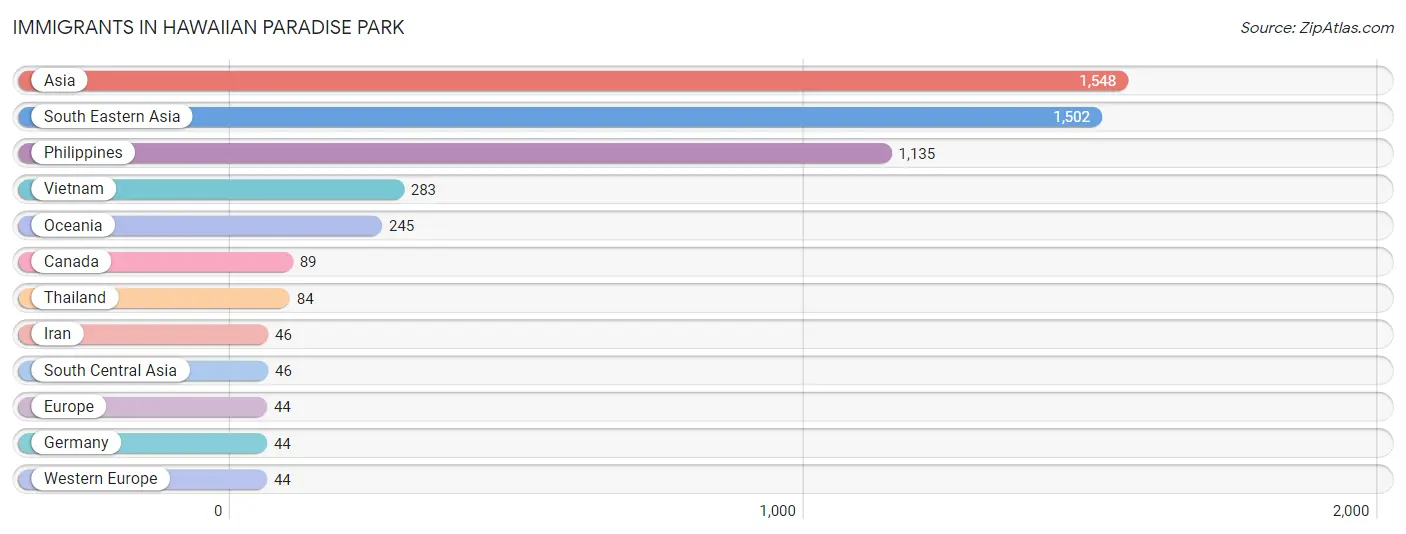
Immigrants in Hawaiian Paradise Park
The most numerous immigrant groups reported in Hawaiian Paradise Park came from Asia (1,548 | 11.9%), South Eastern Asia (1,502 | 11.5%), Philippines (1,135 | 8.7%), Vietnam (283 | 2.2%), and Oceania (245 | 1.9%), together accounting for 36.1% of all Hawaiian Paradise Park residents.
| Immigration Origin | # Population | % Population |
| Asia | 1,548 | 11.9% |
| Canada | 89 | 0.7% |
| Europe | 44 | 0.3% |
| Germany | 44 | 0.3% |
| Iran | 46 | 0.4% |
| Oceania | 245 | 1.9% |
| Philippines | 1,135 | 8.7% |
| South Central Asia | 46 | 0.4% |
| South Eastern Asia | 1,502 | 11.5% |
| Thailand | 84 | 0.6% |
| Vietnam | 283 | 2.2% |
| Western Europe | 44 | 0.3% | View All 12 Rows |
Sex and Age in Hawaiian Paradise Park
Sex and Age in Hawaiian Paradise Park
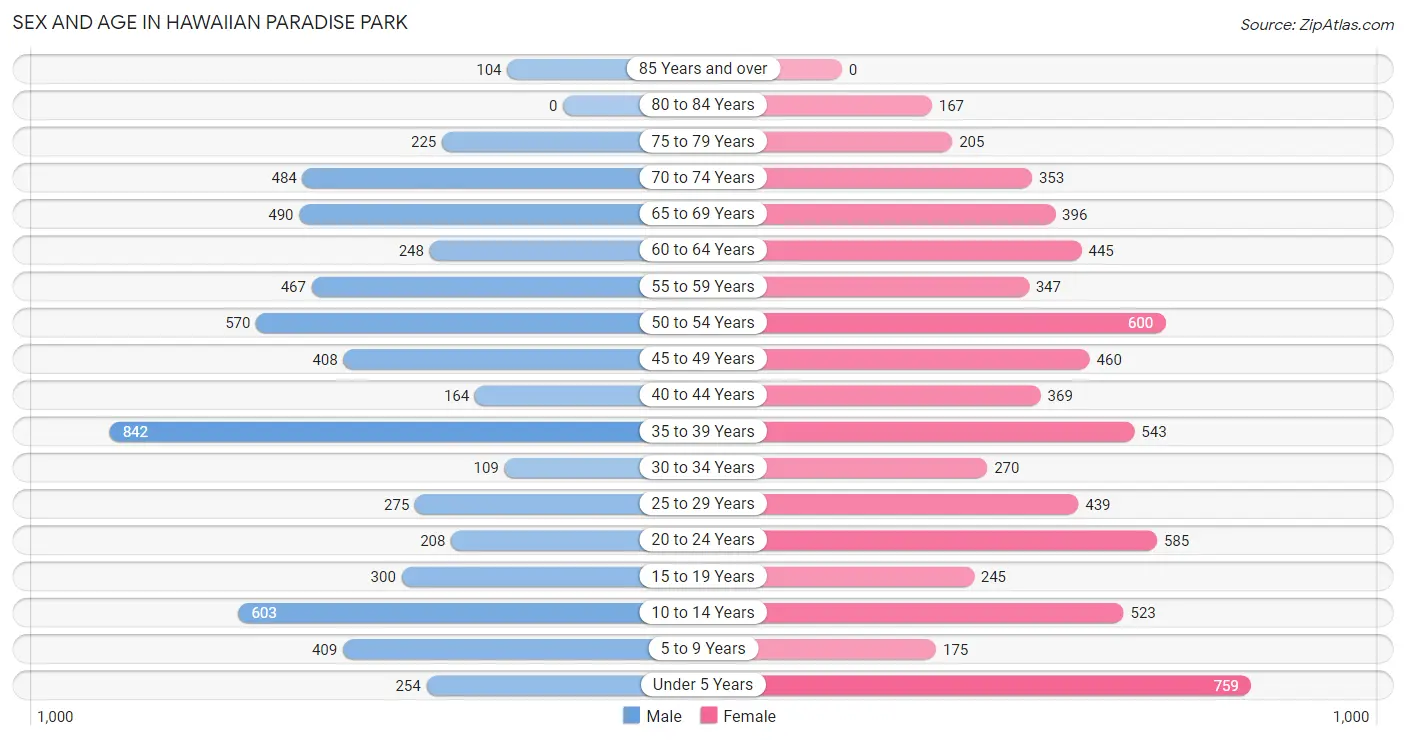
The most populous age groups in Hawaiian Paradise Park are 35 to 39 Years (842 | 13.7%) for men and Under 5 Years (759 | 11.0%) for women.
| Age Bracket | Male | Female |
| Under 5 Years | 254 (4.1%) | 759 (11.0%) |
| 5 to 9 Years | 409 (6.6%) | 175 (2.5%) |
| 10 to 14 Years | 603 (9.8%) | 523 (7.6%) |
| 15 to 19 Years | 300 (4.9%) | 245 (3.6%) |
| 20 to 24 Years | 208 (3.4%) | 585 (8.5%) |
| 25 to 29 Years | 275 (4.5%) | 439 (6.4%) |
| 30 to 34 Years | 109 (1.8%) | 270 (3.9%) |
| 35 to 39 Years | 842 (13.7%) | 543 (7.9%) |
| 40 to 44 Years | 164 (2.7%) | 369 (5.4%) |
| 45 to 49 Years | 408 (6.6%) | 460 (6.7%) |
| 50 to 54 Years | 570 (9.2%) | 600 (8.7%) |
| 55 to 59 Years | 467 (7.6%) | 347 (5.0%) |
| 60 to 64 Years | 248 (4.0%) | 445 (6.5%) |
| 65 to 69 Years | 490 (8.0%) | 396 (5.8%) |
| 70 to 74 Years | 484 (7.9%) | 353 (5.1%) |
| 75 to 79 Years | 225 (3.6%) | 205 (3.0%) |
| 80 to 84 Years | 0 (0.0%) | 167 (2.4%) |
| 85 Years and over | 104 (1.7%) | 0 (0.0%) |
| Total | 6,160 (100.0%) | 6,881 (100.0%) |
Families and Households in Hawaiian Paradise Park
Median Family Size in Hawaiian Paradise Park
The median family size in Hawaiian Paradise Park is 3.32 persons per family, with married-couple families (2,552 | 74.6%) accounting for the largest median family size of 3.38 persons per family. On the other hand, single male/father families (128 | 3.7%) represent the smallest median family size with 2.38 persons per family.

| Family Type | # Families | Family Size |
| Married-Couple | 2,552 (74.6%) | 3.38 |
| Single Male/Father | 128 (3.7%) | 2.38 |
| Single Female/Mother | 742 (21.7%) | 3.30 |
| Total Families | 3,422 (100.0%) | 3.32 |
Median Household Size in Hawaiian Paradise Park
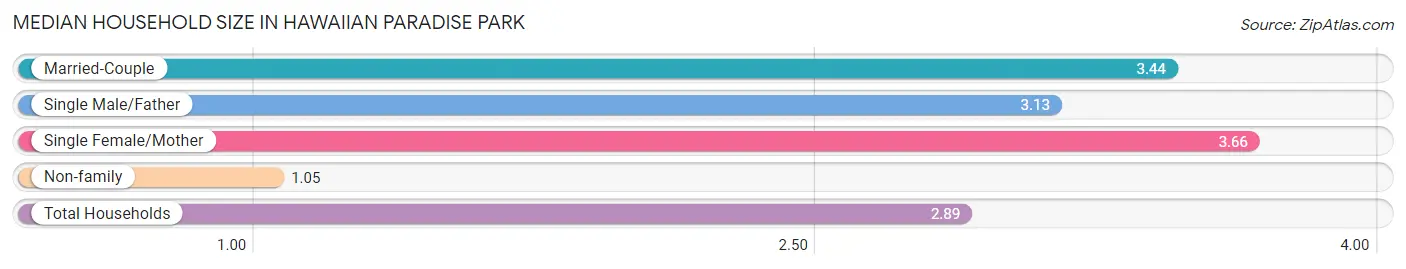
The median household size in Hawaiian Paradise Park is 2.89 persons per household, with single female/mother households (742 | 16.4%) accounting for the largest median household size of 3.66 persons per household. non-family households (1,092 | 24.2%) represent the smallest median household size with 1.05 persons per household.
| Household Type | # Households | Household Size |
| Married-Couple | 2,552 (56.5%) | 3.44 |
| Single Male/Father | 128 (2.8%) | 3.13 |
| Single Female/Mother | 742 (16.4%) | 3.66 |
| Non-family | 1,092 (24.2%) | 1.05 |
| Total Households | 4,514 (100.0%) | 2.89 |
Household Size by Marriage Status in Hawaiian Paradise Park
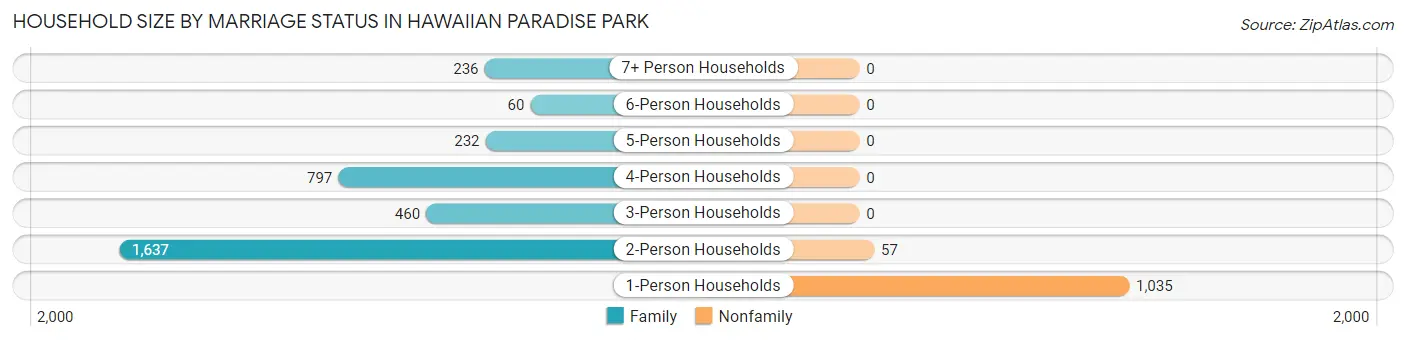
Out of a total of 4,514 households in Hawaiian Paradise Park, 3,422 (75.8%) are family households, while 1,092 (24.2%) are nonfamily households. The most numerous type of family households are 2-person households, comprising 1,637, and the most common type of nonfamily households are 1-person households, comprising 1,035.
| Household Size | Family Households | Nonfamily Households |
| 1-Person Households | - | 1,035 (22.9%) |
| 2-Person Households | 1,637 (36.3%) | 57 (1.3%) |
| 3-Person Households | 460 (10.2%) | 0 (0.0%) |
| 4-Person Households | 797 (17.7%) | 0 (0.0%) |
| 5-Person Households | 232 (5.1%) | 0 (0.0%) |
| 6-Person Households | 60 (1.3%) | 0 (0.0%) |
| 7+ Person Households | 236 (5.2%) | 0 (0.0%) |
| Total | 3,422 (75.8%) | 1,092 (24.2%) |
Female Fertility in Hawaiian Paradise Park
Fertility by Age in Hawaiian Paradise Park
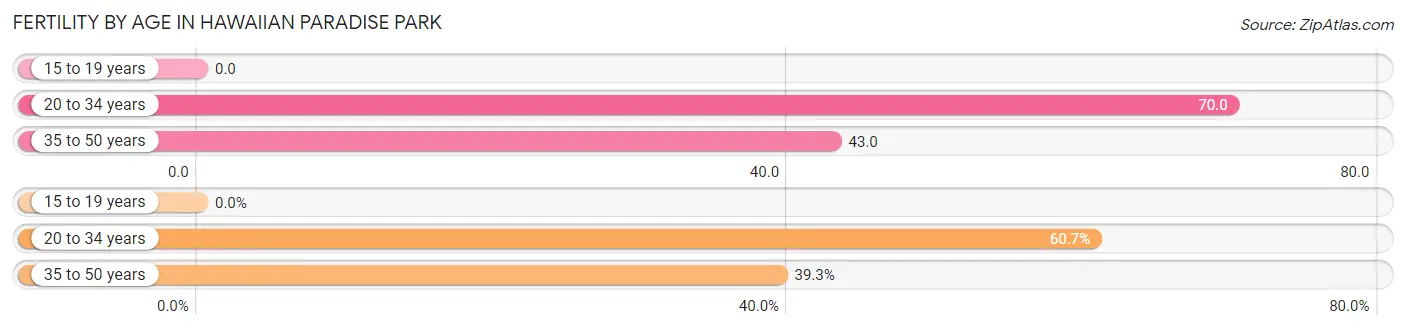
Average fertility rate in Hawaiian Paradise Park is 52.0 births per 1,000 women. Women in the age bracket of 20 to 34 years have the highest fertility rate with 70.0 births per 1,000 women. Women in the age bracket of 20 to 34 years acount for 60.7% of all women with births.
| Age Bracket | Women with Births | Births / 1,000 Women |
| 15 to 19 years | 0 (0.0%) | 0.0 |
| 20 to 34 years | 91 (60.7%) | 70.0 |
| 35 to 50 years | 59 (39.3%) | 43.0 |
| Total | 150 (100.0%) | 52.0 |
Fertility by Age by Marriage Status in Hawaiian Paradise Park
58.7% of women with births (150) in Hawaiian Paradise Park are married. The highest percentage of unmarried women with births falls into 20 to 34 years age bracket with 68.1% of them unmarried at the time of birth, while the lowest percentage of unmarried women with births belong to 35 to 50 years age bracket with 0.0% of them unmarried.
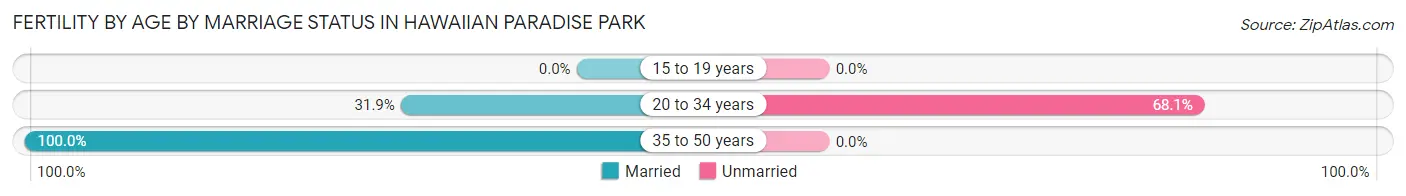
| Age Bracket | Married | Unmarried |
| 15 to 19 years | 0 (0.0%) | 0 (0.0%) |
| 20 to 34 years | 29 (31.9%) | 62 (68.1%) |
| 35 to 50 years | 59 (100.0%) | 0 (0.0%) |
| Total | 88 (58.7%) | 62 (41.3%) |
Fertility by Education in Hawaiian Paradise Park
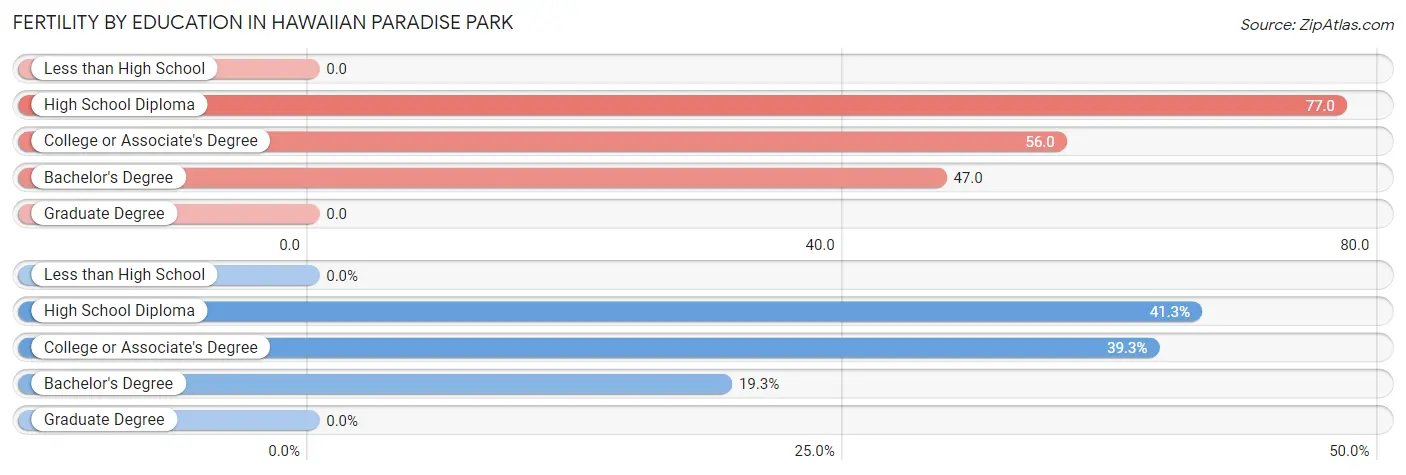
| Educational Attainment | Women with Births | Births / 1,000 Women |
| Less than High School | 0 (0.0%) | 0.0 |
| High School Diploma | 62 (41.3%) | 77.0 |
| College or Associate's Degree | 59 (39.3%) | 56.0 |
| Bachelor's Degree | 29 (19.3%) | 47.0 |
| Graduate Degree | 0 (0.0%) | 0.0 |
| Total | 150 (100.0%) | 52.0 |
Fertility by Education by Marriage Status in Hawaiian Paradise Park
41.3% of women with births in Hawaiian Paradise Park are unmarried. Women with the educational attainment of college or associate's degree are most likely to be married with 100.0% of them married at childbirth, while women with the educational attainment of high school diploma are least likely to be married with 100.0% of them unmarried at childbirth.
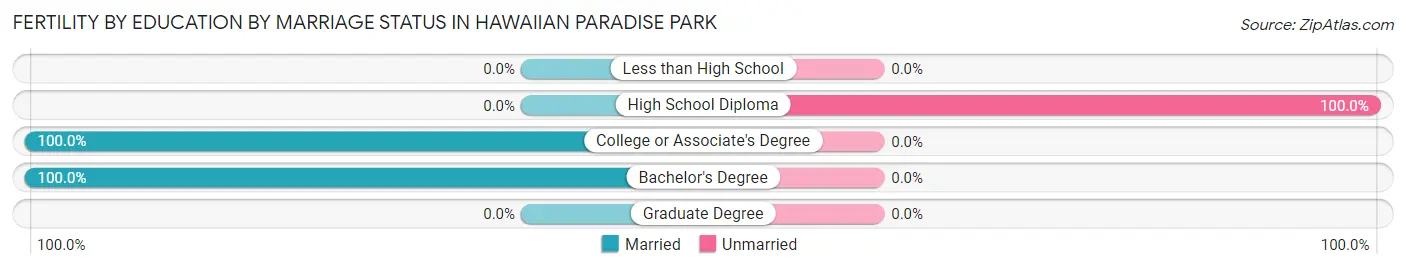
| Educational Attainment | Married | Unmarried |
| Less than High School | 0 (0.0%) | 0 (0.0%) |
| High School Diploma | 0 (0.0%) | 62 (100.0%) |
| College or Associate's Degree | 59 (100.0%) | 0 (0.0%) |
| Bachelor's Degree | 29 (100.0%) | 0 (0.0%) |
| Graduate Degree | 0 (0.0%) | 0 (0.0%) |
| Total | 88 (58.7%) | 62 (41.3%) |
Income in Hawaiian Paradise Park
Income Overview in Hawaiian Paradise Park
Per Capita Income in Hawaiian Paradise Park is $32,420, while median incomes of families and households are $85,093 and $81,236 respectively.
| Characteristic | Number | Measure |
| Per Capita Income | 13,041 | $32,420 |
| Median Family Income | 3,422 | $85,093 |
| Mean Family Income | 3,422 | $103,489 |
| Median Household Income | 4,514 | $81,236 |
| Mean Household Income | 4,514 | $93,752 |
| Income Deficit | 3,422 | $0 |
| Wage / Income Gap (%) | 13,041 | 20.61% |
| Wage / Income Gap ($) | 13,041 | 79.39¢ per $1 |
| Gini / Inequality Index | 13,041 | 0.42 |
Earnings by Sex in Hawaiian Paradise Park
Average Earnings in Hawaiian Paradise Park are $39,414, $45,530 for men and $36,146 for women, a difference of 20.6%.
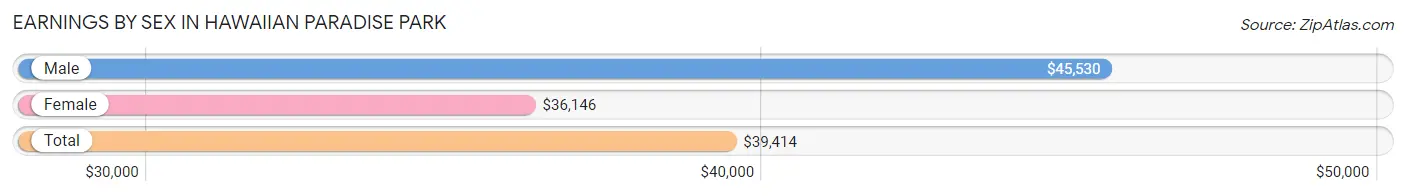
| Sex | Number | Average Earnings |
| Male | 2,920 (43.8%) | $45,530 |
| Female | 3,755 (56.2%) | $36,146 |
| Total | 6,675 (100.0%) | $39,414 |
Earnings by Sex by Income Bracket in Hawaiian Paradise Park
The most common earnings brackets in Hawaiian Paradise Park are $65,000 to $74,999 for men (364 | 12.5%) and $25,000 to $29,999 for women (495 | 13.2%).
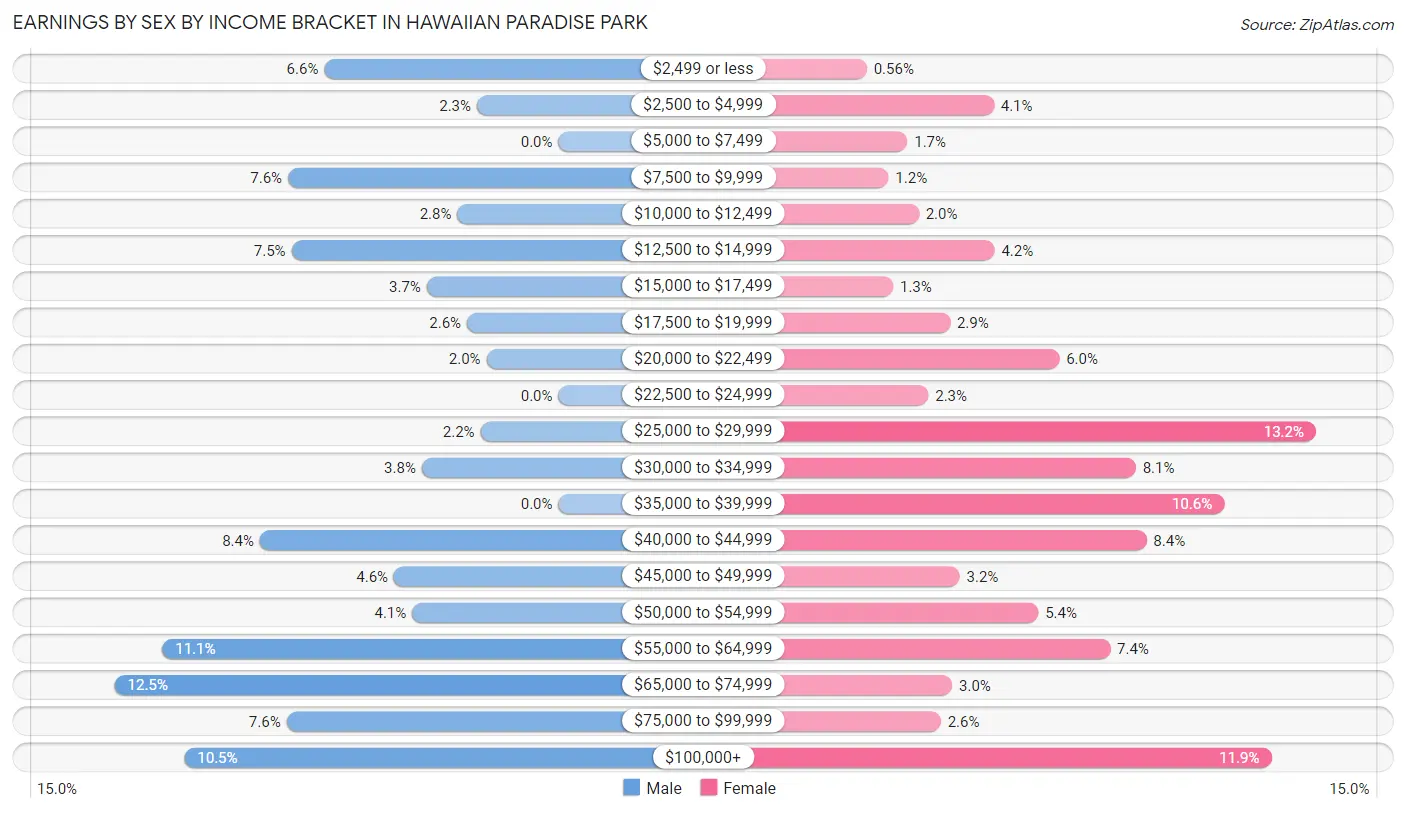
| Income | Male | Female |
| $2,499 or less | 192 (6.6%) | 21 (0.6%) |
| $2,500 to $4,999 | 67 (2.3%) | 155 (4.1%) |
| $5,000 to $7,499 | 0 (0.0%) | 64 (1.7%) |
| $7,500 to $9,999 | 222 (7.6%) | 44 (1.2%) |
| $10,000 to $12,499 | 83 (2.8%) | 76 (2.0%) |
| $12,500 to $14,999 | 219 (7.5%) | 156 (4.2%) |
| $15,000 to $17,499 | 108 (3.7%) | 49 (1.3%) |
| $17,500 to $19,999 | 75 (2.6%) | 109 (2.9%) |
| $20,000 to $22,499 | 59 (2.0%) | 224 (6.0%) |
| $22,500 to $24,999 | 0 (0.0%) | 86 (2.3%) |
| $25,000 to $29,999 | 64 (2.2%) | 495 (13.2%) |
| $30,000 to $34,999 | 112 (3.8%) | 305 (8.1%) |
| $35,000 to $39,999 | 0 (0.0%) | 398 (10.6%) |
| $40,000 to $44,999 | 245 (8.4%) | 316 (8.4%) |
| $45,000 to $49,999 | 135 (4.6%) | 119 (3.2%) |
| $50,000 to $54,999 | 120 (4.1%) | 202 (5.4%) |
| $55,000 to $64,999 | 325 (11.1%) | 278 (7.4%) |
| $65,000 to $74,999 | 364 (12.5%) | 111 (3.0%) |
| $75,000 to $99,999 | 223 (7.6%) | 99 (2.6%) |
| $100,000+ | 307 (10.5%) | 448 (11.9%) |
| Total | 2,920 (100.0%) | 3,755 (100.0%) |
Earnings by Sex by Educational Attainment in Hawaiian Paradise Park
Average earnings in Hawaiian Paradise Park are $51,427 for men and $38,976 for women, a difference of 24.2%. Men with an educational attainment of bachelor's degree enjoy the highest average annual earnings of $85,417, while those with less than high school education earn the least with $20,975. Women with an educational attainment of bachelor's degree earn the most with the average annual earnings of $42,722, while those with high school diploma education have the smallest earnings of $27,218.
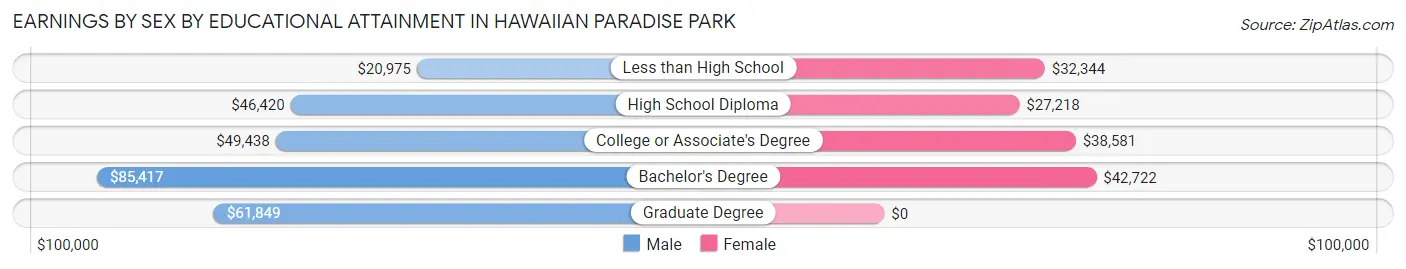
| Educational Attainment | Male Income | Female Income |
| Less than High School | $20,975 | $32,344 |
| High School Diploma | $46,420 | $27,218 |
| College or Associate's Degree | $49,438 | $38,581 |
| Bachelor's Degree | $85,417 | $42,722 |
| Graduate Degree | $61,849 | $0 |
| Total | $51,427 | $38,976 |
Family Income in Hawaiian Paradise Park
Family Income Brackets in Hawaiian Paradise Park
According to the Hawaiian Paradise Park family income data, there are 736 families falling into the $100,000 to $149,999 income range, which is the most common income bracket and makes up 21.5% of all families. Conversely, the $10,000 to $14,999 income bracket is the least frequent group with only 48 families (1.4%) belonging to this category.
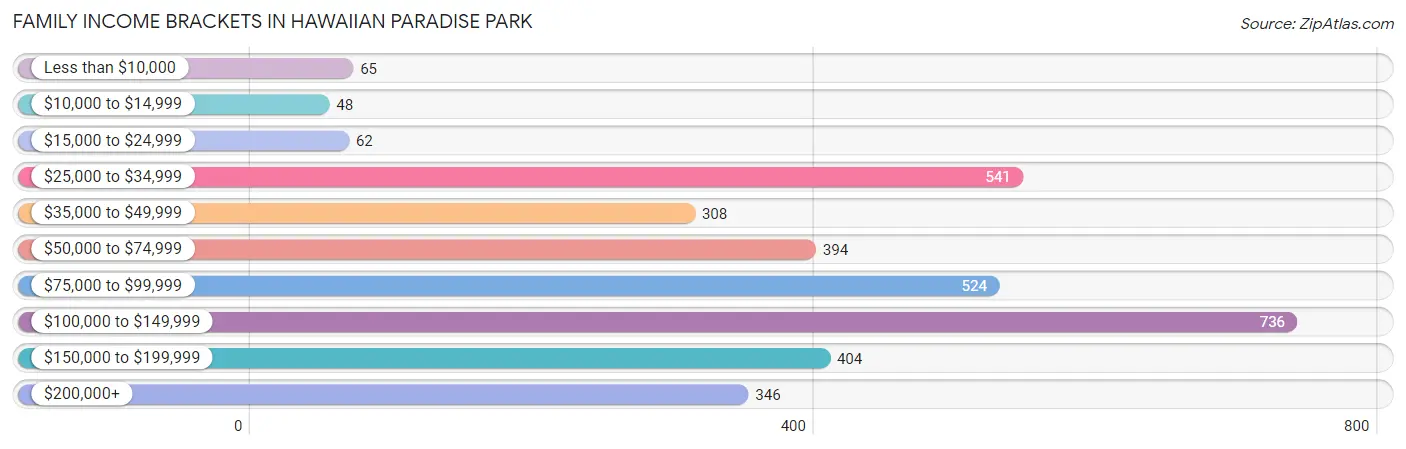
| Income Bracket | # Families | % Families |
| Less than $10,000 | 65 | 1.9% |
| $10,000 to $14,999 | 48 | 1.4% |
| $15,000 to $24,999 | 62 | 1.8% |
| $25,000 to $34,999 | 541 | 15.8% |
| $35,000 to $49,999 | 308 | 9.0% |
| $50,000 to $74,999 | 394 | 11.5% |
| $75,000 to $99,999 | 524 | 15.3% |
| $100,000 to $149,999 | 736 | 21.5% |
| $150,000 to $199,999 | 404 | 11.8% |
| $200,000+ | 346 | 10.1% |
Family Income by Famaliy Size in Hawaiian Paradise Park
7+ person families (236 | 6.9%) account for the highest median family income in Hawaiian Paradise Park with $188,491 per family, while 2-person families (1,900 | 55.5%) have the highest median income of $32,413 per family member.
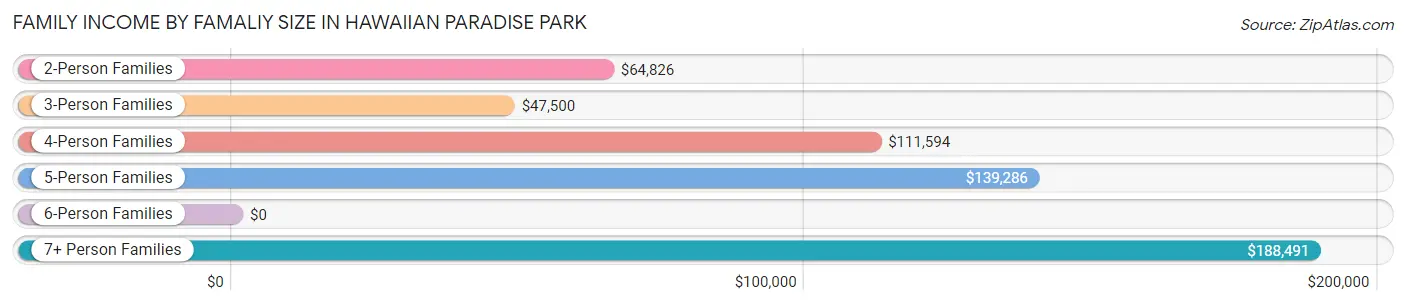
| Income Bracket | # Families | Median Income |
| 2-Person Families | 1,900 (55.5%) | $64,826 |
| 3-Person Families | 436 (12.7%) | $47,500 |
| 4-Person Families | 558 (16.3%) | $111,594 |
| 5-Person Families | 232 (6.8%) | $139,286 |
| 6-Person Families | 60 (1.8%) | $0 |
| 7+ Person Families | 236 (6.9%) | $188,491 |
| Total | 3,422 (100.0%) | $85,093 |
Family Income by Number of Earners in Hawaiian Paradise Park
The median family income in Hawaiian Paradise Park is $85,093, with families comprising 3+ earners (328) having the highest median family income of $152,386, while families with no earners (478) have the lowest median family income of $40,024, accounting for 9.6% and 14.0% of families, respectively.
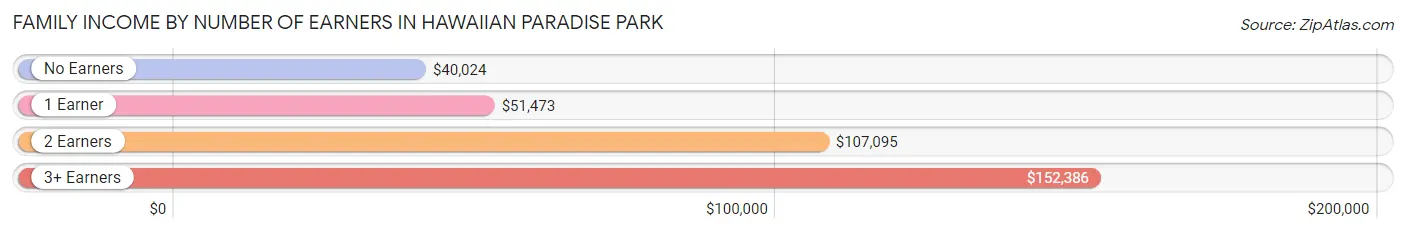
| Number of Earners | # Families | Median Income |
| No Earners | 478 (14.0%) | $40,024 |
| 1 Earner | 1,162 (34.0%) | $51,473 |
| 2 Earners | 1,454 (42.5%) | $107,095 |
| 3+ Earners | 328 (9.6%) | $152,386 |
| Total | 3,422 (100.0%) | $85,093 |
Household Income in Hawaiian Paradise Park
Household Income Brackets in Hawaiian Paradise Park
With 939 households falling in the category, the $75,000 to $99,999 income range is the most frequent in Hawaiian Paradise Park, accounting for 20.8% of all households. In contrast, only 122 households (2.7%) fall into the $10,000 to $14,999 income bracket, making it the least populous group.
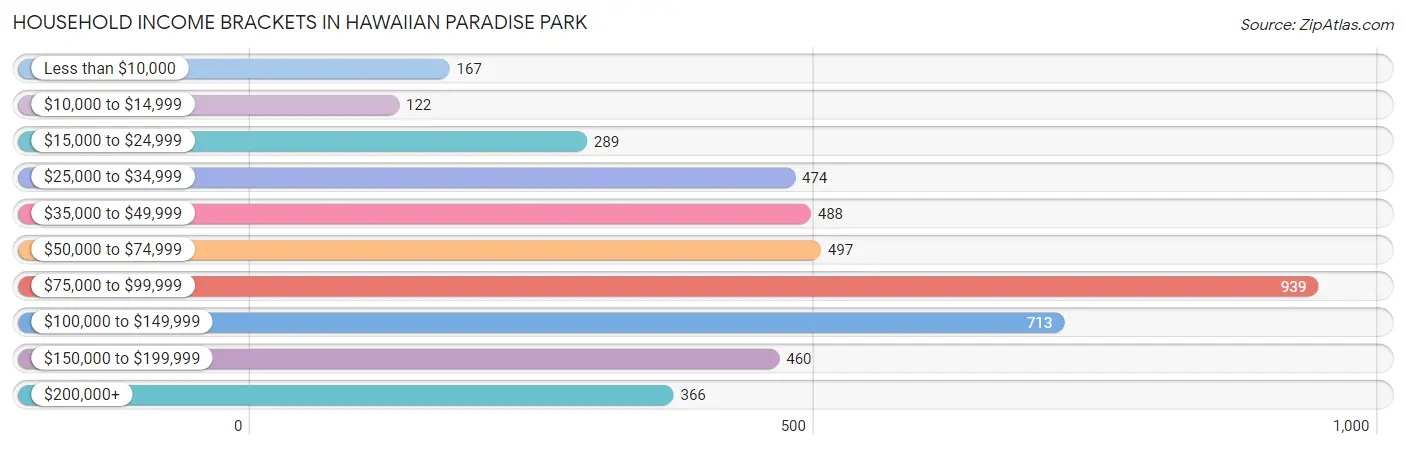
| Income Bracket | # Households | % Households |
| Less than $10,000 | 167 | 3.7% |
| $10,000 to $14,999 | 122 | 2.7% |
| $15,000 to $24,999 | 289 | 6.4% |
| $25,000 to $34,999 | 474 | 10.5% |
| $35,000 to $49,999 | 488 | 10.8% |
| $50,000 to $74,999 | 497 | 11.0% |
| $75,000 to $99,999 | 939 | 20.8% |
| $100,000 to $149,999 | 713 | 15.8% |
| $150,000 to $199,999 | 460 | 10.2% |
| $200,000+ | 366 | 8.1% |
Household Income by Householder Age in Hawaiian Paradise Park
The median household income in Hawaiian Paradise Park is $81,236, with the highest median household income of $105,883 found in the 25 to 44 years age bracket for the primary householder. A total of 1,023 households (22.7%) fall into this category. Meanwhile, the 15 to 24 years age bracket for the primary householder has the lowest median household income of $0, with 213 households (4.7%) in this group.
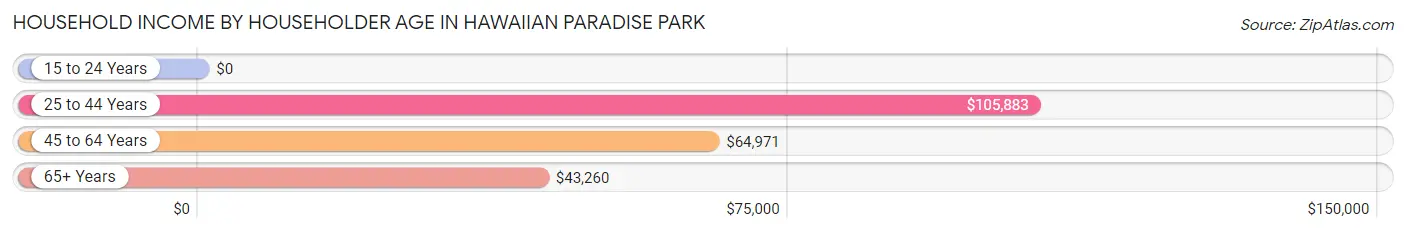
| Income Bracket | # Households | Median Income |
| 15 to 24 Years | 213 (4.7%) | $0 |
| 25 to 44 Years | 1,023 (22.7%) | $105,883 |
| 45 to 64 Years | 1,747 (38.7%) | $64,971 |
| 65+ Years | 1,531 (33.9%) | $43,260 |
| Total | 4,514 (100.0%) | $81,236 |
Poverty in Hawaiian Paradise Park
Income Below Poverty by Sex and Age in Hawaiian Paradise Park
With 6.1% poverty level for males and 3.7% for females among the residents of Hawaiian Paradise Park, 15 year old males and 45 to 54 year old females are the most vulnerable to poverty, with 24 males (100.0%) and 111 females (10.5%) in their respective age groups living below the poverty level.
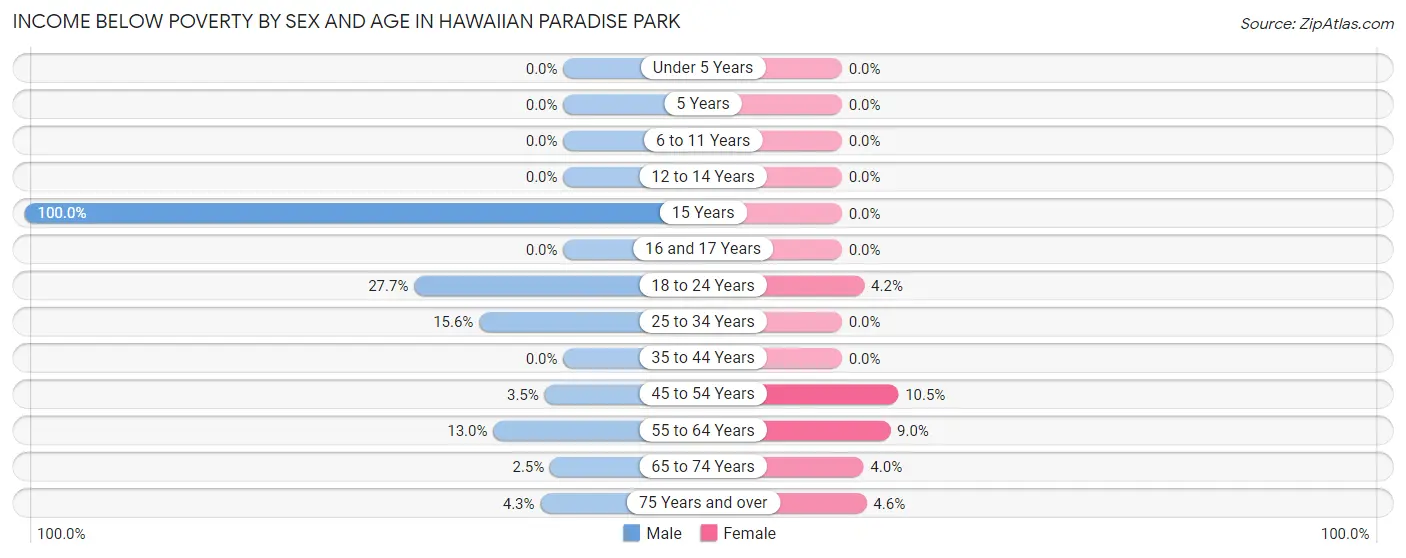
| Age Bracket | Male | Female |
| Under 5 Years | 0 (0.0%) | 0 (0.0%) |
| 5 Years | 0 (0.0%) | 0 (0.0%) |
| 6 to 11 Years | 0 (0.0%) | 0 (0.0%) |
| 12 to 14 Years | 0 (0.0%) | 0 (0.0%) |
| 15 Years | 24 (100.0%) | 0 (0.0%) |
| 16 and 17 Years | 0 (0.0%) | 0 (0.0%) |
| 18 to 24 Years | 124 (27.7%) | 27 (4.2%) |
| 25 to 34 Years | 60 (15.6%) | 0 (0.0%) |
| 35 to 44 Years | 0 (0.0%) | 0 (0.0%) |
| 45 to 54 Years | 34 (3.5%) | 111 (10.5%) |
| 55 to 64 Years | 93 (13.0%) | 71 (9.0%) |
| 65 to 74 Years | 24 (2.5%) | 30 (4.0%) |
| 75 Years and over | 14 (4.3%) | 17 (4.6%) |
| Total | 373 (6.1%) | 256 (3.7%) |
Income Above Poverty by Sex and Age in Hawaiian Paradise Park
According to the poverty statistics in Hawaiian Paradise Park, males aged under 5 years and females aged under 5 years are the age groups that are most secure financially, with 100.0% of males and 100.0% of females in these age groups living above the poverty line.
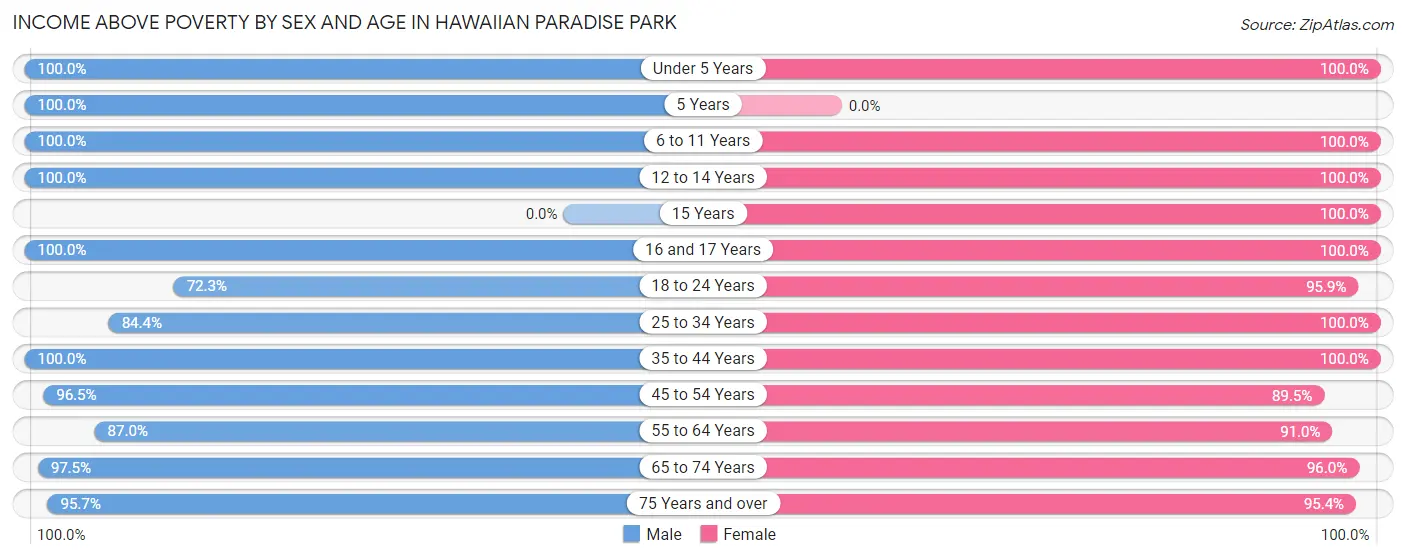
| Age Bracket | Male | Female |
| Under 5 Years | 254 (100.0%) | 756 (100.0%) |
| 5 Years | 87 (100.0%) | 0 (0.0%) |
| 6 to 11 Years | 615 (100.0%) | 432 (100.0%) |
| 12 to 14 Years | 310 (100.0%) | 266 (100.0%) |
| 15 Years | 0 (0.0%) | 123 (100.0%) |
| 16 and 17 Years | 36 (100.0%) | 57 (100.0%) |
| 18 to 24 Years | 324 (72.3%) | 623 (95.9%) |
| 25 to 34 Years | 324 (84.4%) | 709 (100.0%) |
| 35 to 44 Years | 1,006 (100.0%) | 912 (100.0%) |
| 45 to 54 Years | 944 (96.5%) | 949 (89.5%) |
| 55 to 64 Years | 622 (87.0%) | 721 (91.0%) |
| 65 to 74 Years | 950 (97.5%) | 719 (96.0%) |
| 75 Years and over | 315 (95.7%) | 355 (95.4%) |
| Total | 5,787 (93.9%) | 6,622 (96.3%) |
Income Below Poverty Among Married-Couple Families in Hawaiian Paradise Park
The poverty statistics for married-couple families in Hawaiian Paradise Park show that 1.8% or 47 of the total 2,552 families live below the poverty line. Families with no children have the highest poverty rate of 2.9%, comprising of 47 families. On the other hand, families with 1 or 2 children have the lowest poverty rate of 0.0%, which includes 0 families.
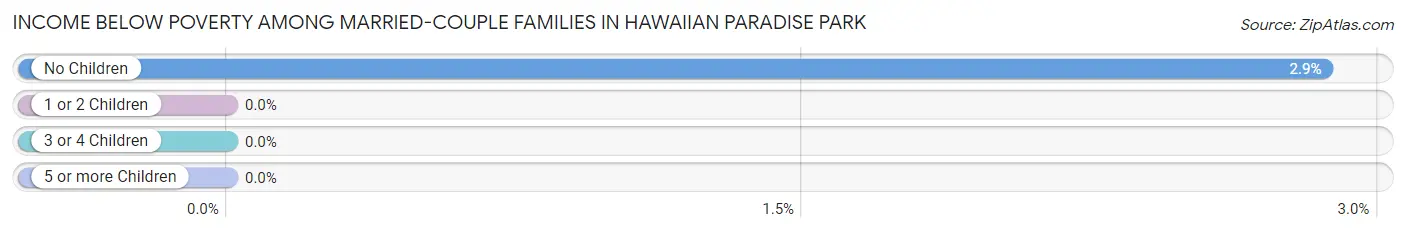
| Children | Above Poverty | Below Poverty |
| No Children | 1,598 (97.1%) | 47 (2.9%) |
| 1 or 2 Children | 628 (100.0%) | 0 (0.0%) |
| 3 or 4 Children | 230 (100.0%) | 0 (0.0%) |
| 5 or more Children | 49 (100.0%) | 0 (0.0%) |
| Total | 2,505 (98.2%) | 47 (1.8%) |
Income Below Poverty Among Single-Parent Households in Hawaiian Paradise Park
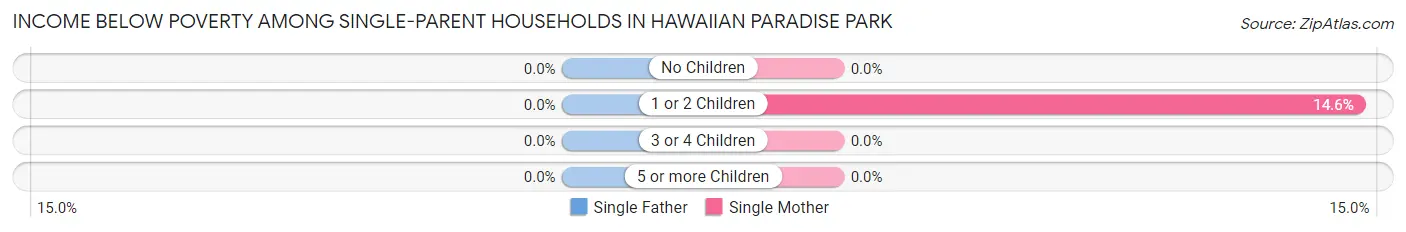
| Children | Single Father | Single Mother |
| No Children | 0 (0.0%) | 0 (0.0%) |
| 1 or 2 Children | 0 (0.0%) | 64 (14.6%) |
| 3 or 4 Children | 0 (0.0%) | 0 (0.0%) |
| 5 or more Children | 0 (0.0%) | 0 (0.0%) |
| Total | 0 (0.0%) | 64 (8.6%) |
Income Below Poverty Among Married-Couple vs Single-Parent Households in Hawaiian Paradise Park
The poverty data for Hawaiian Paradise Park shows that 47 of the married-couple family households (1.8%) and 64 of the single-parent households (7.4%) are living below the poverty level. Within the married-couple family households, those with no children have the highest poverty rate, with 47 households (2.9%) falling below the poverty line. Among the single-parent households, those with 1 or 2 children have the highest poverty rate, with 64 household (13.1%) living below poverty.
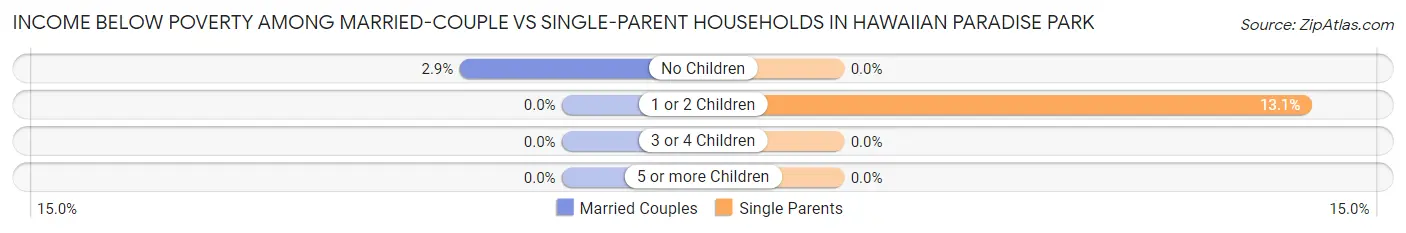
| Children | Married-Couple Families | Single-Parent Households |
| No Children | 47 (2.9%) | 0 (0.0%) |
| 1 or 2 Children | 0 (0.0%) | 64 (13.1%) |
| 3 or 4 Children | 0 (0.0%) | 0 (0.0%) |
| 5 or more Children | 0 (0.0%) | 0 (0.0%) |
| Total | 47 (1.8%) | 64 (7.4%) |
Employment Characteristics in Hawaiian Paradise Park
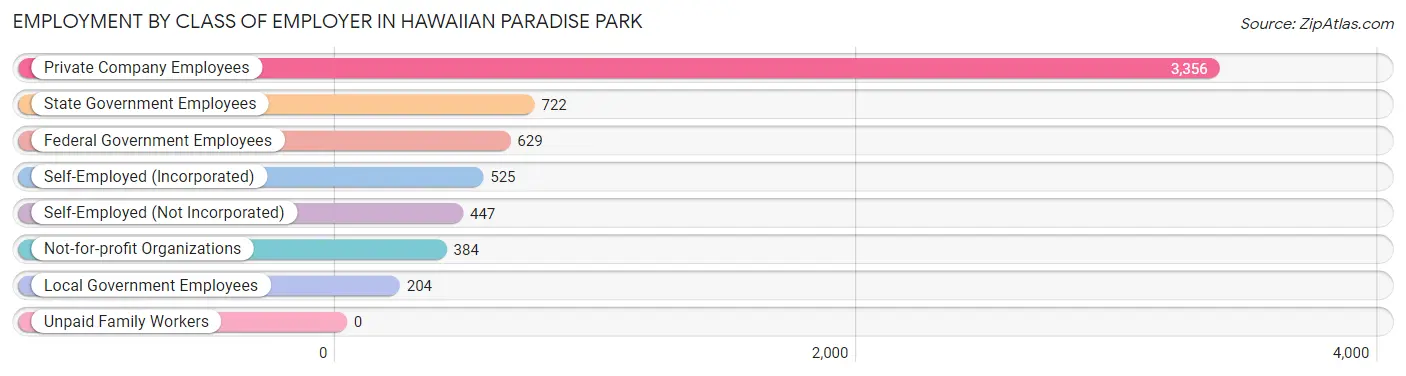
Employment by Class of Employer in Hawaiian Paradise Park
Among the 6,267 employed individuals in Hawaiian Paradise Park, private company employees (3,356 | 53.5%), state government employees (722 | 11.5%), and federal government employees (629 | 10.0%) make up the most common classes of employment.
| Employer Class | # Employees | % Employees |
| Private Company Employees | 3,356 | 53.5% |
| Self-Employed (Incorporated) | 525 | 8.4% |
| Self-Employed (Not Incorporated) | 447 | 7.1% |
| Not-for-profit Organizations | 384 | 6.1% |
| Local Government Employees | 204 | 3.3% |
| State Government Employees | 722 | 11.5% |
| Federal Government Employees | 629 | 10.0% |
| Unpaid Family Workers | 0 | 0.0% |
| Total | 6,267 | 100.0% |
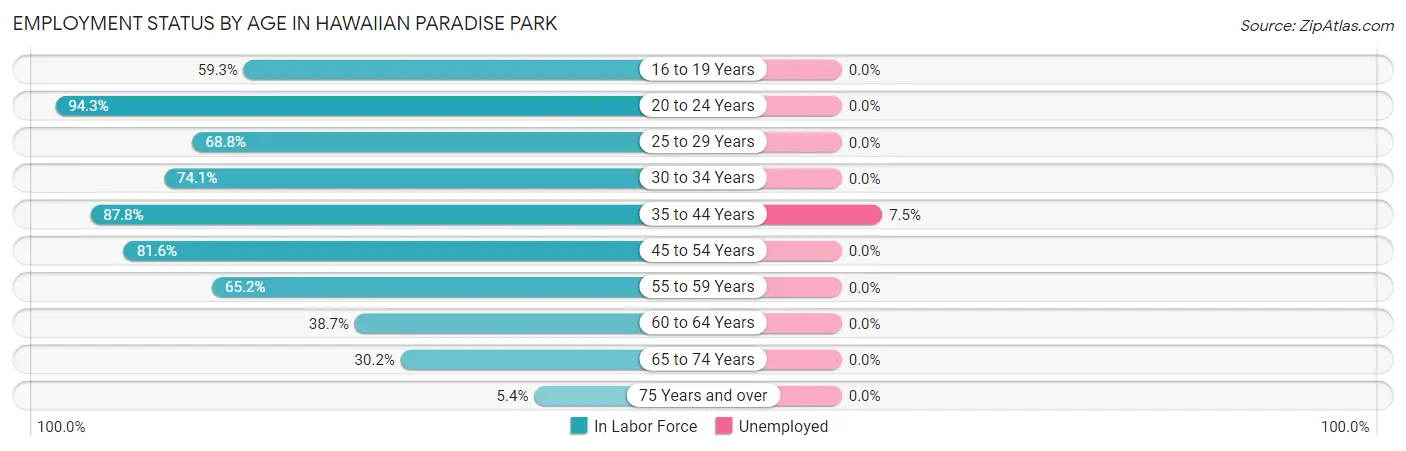
Employment Status by Age in Hawaiian Paradise Park
According to the labor force statistics for Hawaiian Paradise Park, out of the total population over 16 years of age (10,171), 63.5% or 6,459 individuals are in the labor force, with 1.7% or 110 of them unemployed. The age group with the highest labor force participation rate is 20 to 24 years, with 94.3% or 748 individuals in the labor force. Within the labor force, the 35 to 44 years age range has the highest percentage of unemployed individuals, with 7.5% or 126 of them being unemployed.
| Age Bracket | In Labor Force | Unemployed |
| 16 to 19 Years | 236 (59.3%) | 0 (0.0%) |
| 20 to 24 Years | 748 (94.3%) | 0 (0.0%) |
| 25 to 29 Years | 491 (68.8%) | 0 (0.0%) |
| 30 to 34 Years | 281 (74.1%) | 0 (0.0%) |
| 35 to 44 Years | 1,684 (87.8%) | 126 (7.5%) |
| 45 to 54 Years | 1,663 (81.6%) | 0 (0.0%) |
| 55 to 59 Years | 531 (65.2%) | 0 (0.0%) |
| 60 to 64 Years | 268 (38.7%) | 0 (0.0%) |
| 65 to 74 Years | 520 (30.2%) | 0 (0.0%) |
| 75 Years and over | 38 (5.4%) | 0 (0.0%) |
| Total | 6,459 (63.5%) | 110 (1.7%) |
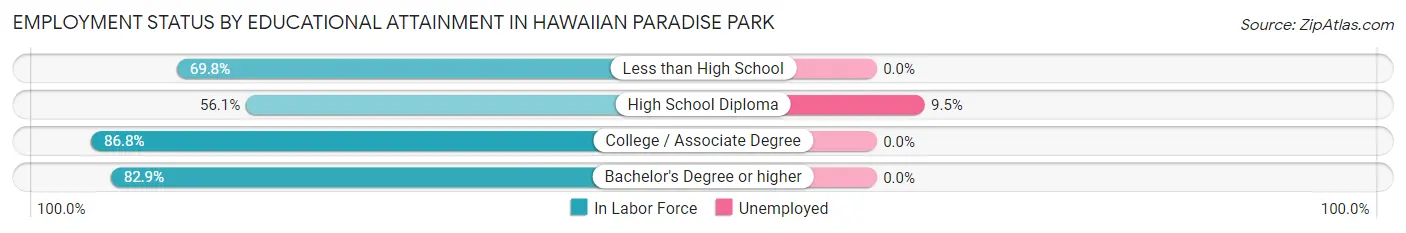
Employment Status by Educational Attainment in Hawaiian Paradise Park
According to labor force statistics for Hawaiian Paradise Park, 75.0% of individuals (4,917) out of the total population between 25 and 64 years of age (6,556) are in the labor force, with 2.3% or 113 of them being unemployed. The group with the highest labor force participation rate are those with the educational attainment of college / associate degree, with 86.8% or 1,941 individuals in the labor force. Within the labor force, individuals with high school diploma education have the highest percentage of unemployment, with 9.5% or 107 of them being unemployed.
| Educational Attainment | In Labor Force | Unemployed |
| Less than High School | 351 (69.8%) | 0 (0.0%) |
| High School Diploma | 1,129 (56.1%) | 191 (9.5%) |
| College / Associate Degree | 1,941 (86.8%) | 0 (0.0%) |
| Bachelor's Degree or higher | 1,496 (82.9%) | 0 (0.0%) |
| Total | 4,917 (75.0%) | 151 (2.3%) |
Employment Occupations by Sex in Hawaiian Paradise Park
Management, Business, Science and Arts Occupations
The most common Management, Business, Science and Arts occupations in Hawaiian Paradise Park are Community & Social Service (853 | 14.0%), Management (598 | 9.8%), Education Instruction & Library (579 | 9.5%), Health Diagnosing & Treating (267 | 4.4%), and Health Technologists (267 | 4.4%).
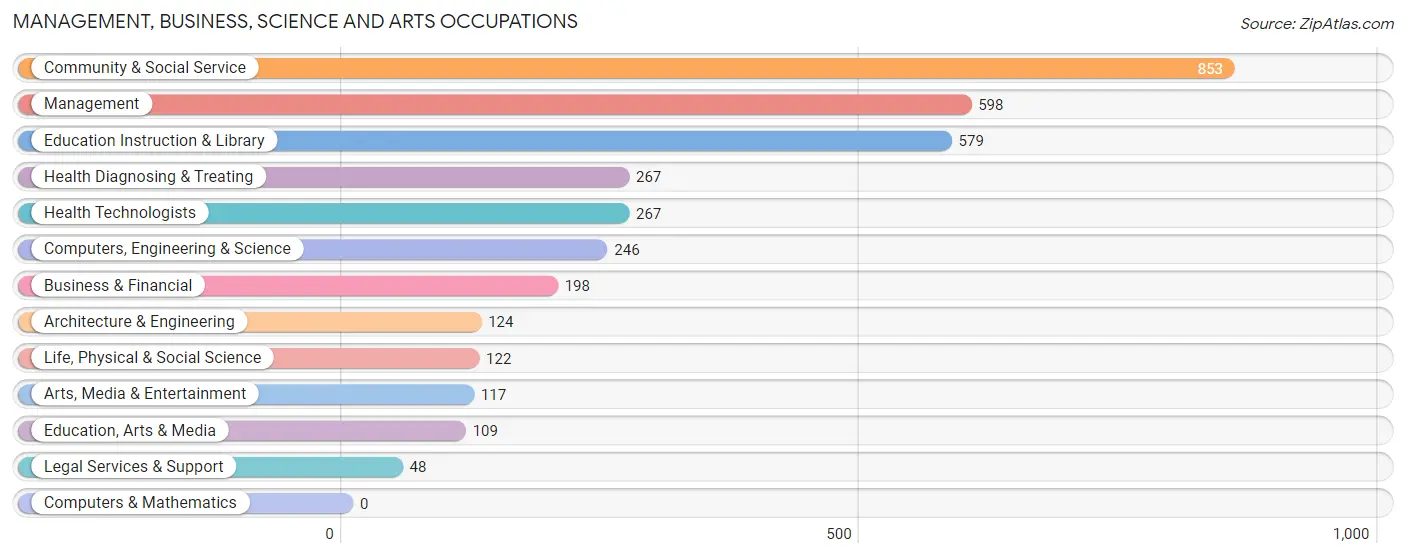
Management, Business, Science and Arts Occupations by Sex
Within the Management, Business, Science and Arts occupations in Hawaiian Paradise Park, the most male-oriented occupations are Architecture & Engineering (100.0%), Legal Services & Support (100.0%), and Business & Financial (74.2%), while the most female-oriented occupations are Life, Physical & Social Science (100.0%), Education, Arts & Media (100.0%), and Health Diagnosing & Treating (73.4%).
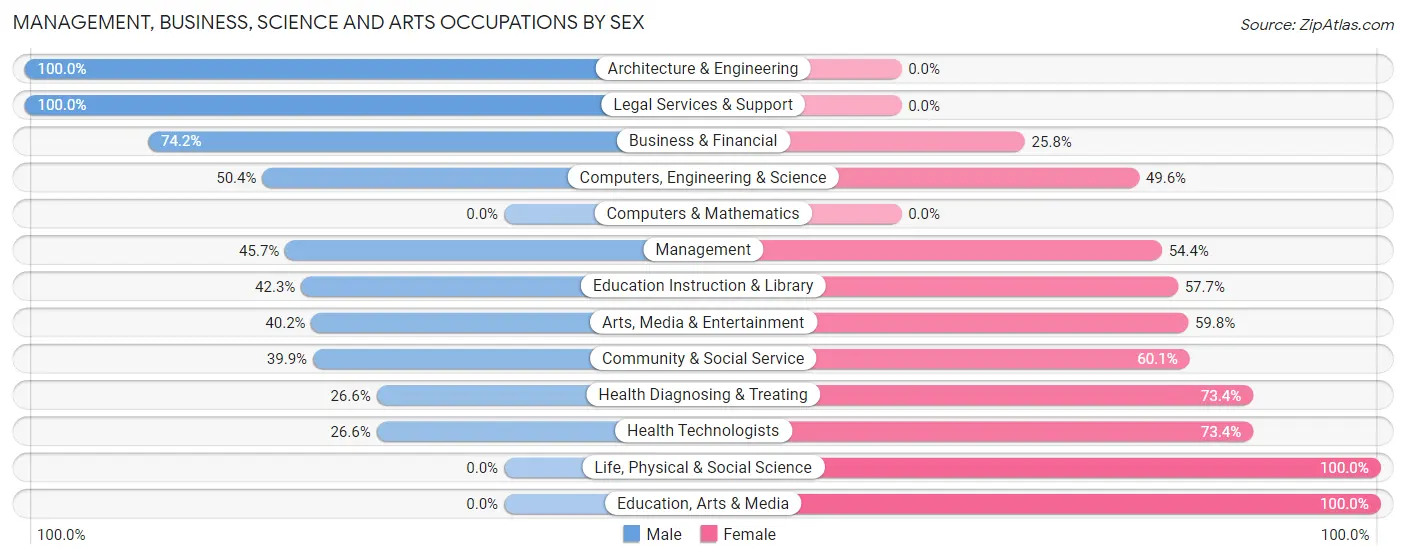
| Occupation | Male | Female |
| Management | 273 (45.7%) | 325 (54.3%) |
| Business & Financial | 147 (74.2%) | 51 (25.8%) |
| Computers, Engineering & Science | 124 (50.4%) | 122 (49.6%) |
| Computers & Mathematics | 0 (0.0%) | 0 (0.0%) |
| Architecture & Engineering | 124 (100.0%) | 0 (0.0%) |
| Life, Physical & Social Science | 0 (0.0%) | 122 (100.0%) |
| Community & Social Service | 340 (39.9%) | 513 (60.1%) |
| Education, Arts & Media | 0 (0.0%) | 109 (100.0%) |
| Legal Services & Support | 48 (100.0%) | 0 (0.0%) |
| Education Instruction & Library | 245 (42.3%) | 334 (57.7%) |
| Arts, Media & Entertainment | 47 (40.2%) | 70 (59.8%) |
| Health Diagnosing & Treating | 71 (26.6%) | 196 (73.4%) |
| Health Technologists | 71 (26.6%) | 196 (73.4%) |
| Total (Category) | 955 (44.2%) | 1,207 (55.8%) |
| Total (Overall) | 2,518 (41.3%) | 3,575 (58.7%) |
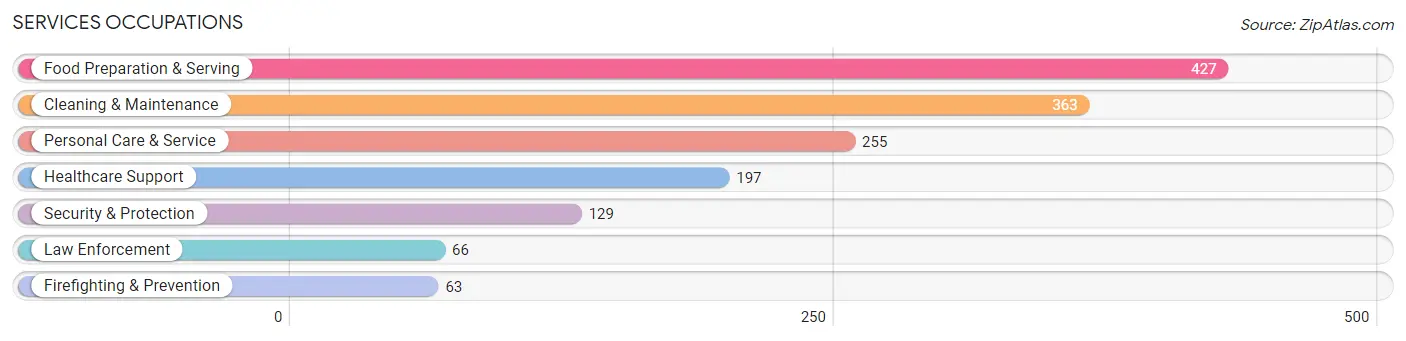
Services Occupations
The most common Services occupations in Hawaiian Paradise Park are Food Preparation & Serving (427 | 7.0%), Cleaning & Maintenance (363 | 6.0%), Personal Care & Service (255 | 4.2%), Healthcare Support (197 | 3.2%), and Security & Protection (129 | 2.1%).
Services Occupations by Sex
Within the Services occupations in Hawaiian Paradise Park, the most male-oriented occupations are Law Enforcement (100.0%), Cleaning & Maintenance (79.6%), and Security & Protection (73.6%), while the most female-oriented occupations are Healthcare Support (100.0%), Personal Care & Service (64.7%), and Food Preparation & Serving (62.1%).
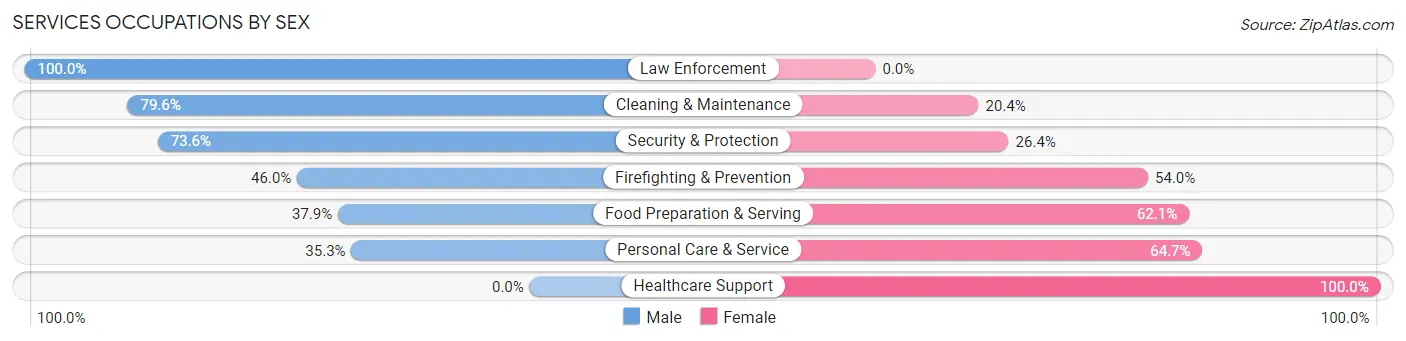
| Occupation | Male | Female |
| Healthcare Support | 0 (0.0%) | 197 (100.0%) |
| Security & Protection | 95 (73.6%) | 34 (26.4%) |
| Firefighting & Prevention | 29 (46.0%) | 34 (54.0%) |
| Law Enforcement | 66 (100.0%) | 0 (0.0%) |
| Food Preparation & Serving | 162 (37.9%) | 265 (62.1%) |
| Cleaning & Maintenance | 289 (79.6%) | 74 (20.4%) |
| Personal Care & Service | 90 (35.3%) | 165 (64.7%) |
| Total (Category) | 636 (46.4%) | 735 (53.6%) |
| Total (Overall) | 2,518 (41.3%) | 3,575 (58.7%) |
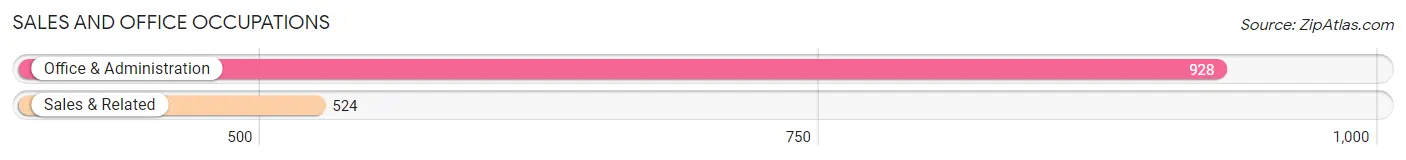
Sales and Office Occupations
The most common Sales and Office occupations in Hawaiian Paradise Park are Office & Administration (928 | 15.2%), and Sales & Related (524 | 8.6%).
Sales and Office Occupations by Sex
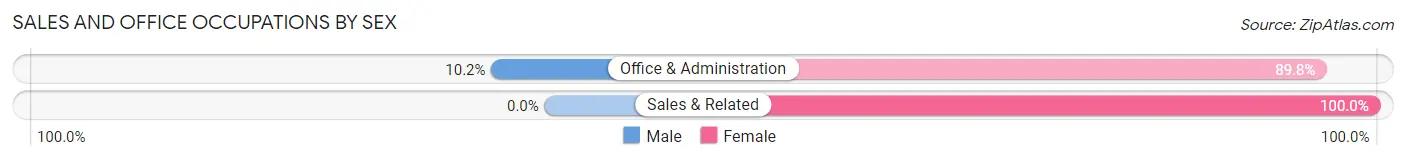
| Occupation | Male | Female |
| Sales & Related | 0 (0.0%) | 524 (100.0%) |
| Office & Administration | 95 (10.2%) | 833 (89.8%) |
| Total (Category) | 95 (6.5%) | 1,357 (93.5%) |
| Total (Overall) | 2,518 (41.3%) | 3,575 (58.7%) |
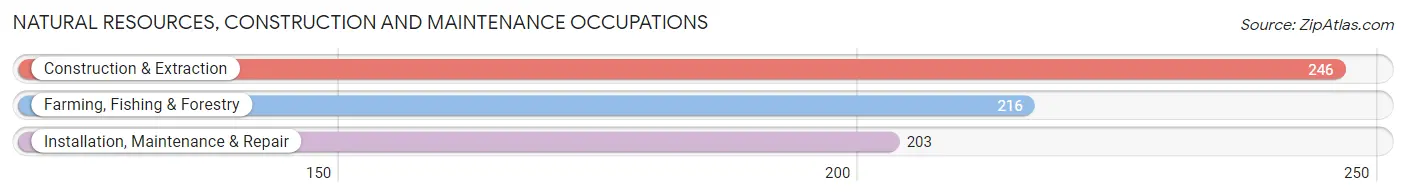
Natural Resources, Construction and Maintenance Occupations
The most common Natural Resources, Construction and Maintenance occupations in Hawaiian Paradise Park are Construction & Extraction (246 | 4.0%), Farming, Fishing & Forestry (216 | 3.5%), and Installation, Maintenance & Repair (203 | 3.3%).
Natural Resources, Construction and Maintenance Occupations by Sex
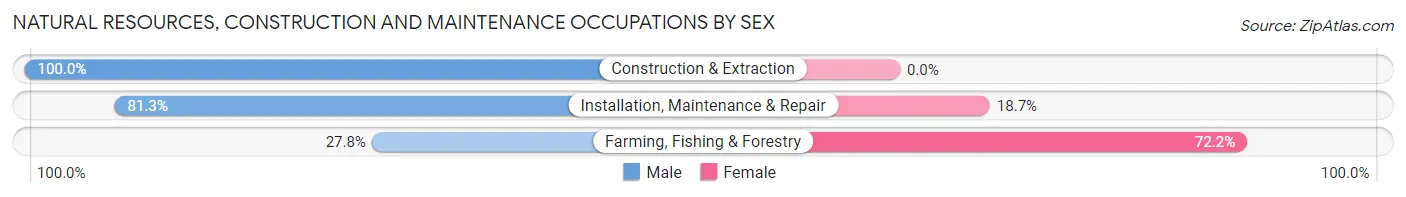
| Occupation | Male | Female |
| Farming, Fishing & Forestry | 60 (27.8%) | 156 (72.2%) |
| Construction & Extraction | 246 (100.0%) | 0 (0.0%) |
| Installation, Maintenance & Repair | 165 (81.3%) | 38 (18.7%) |
| Total (Category) | 471 (70.8%) | 194 (29.2%) |
| Total (Overall) | 2,518 (41.3%) | 3,575 (58.7%) |
Production, Transportation and Moving Occupations
The most common Production, Transportation and Moving occupations in Hawaiian Paradise Park are Production (330 | 5.4%), and Transportation (113 | 1.8%).
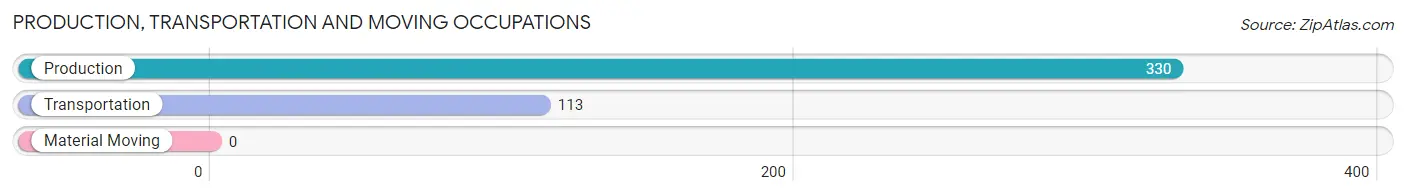
Production, Transportation and Moving Occupations by Sex
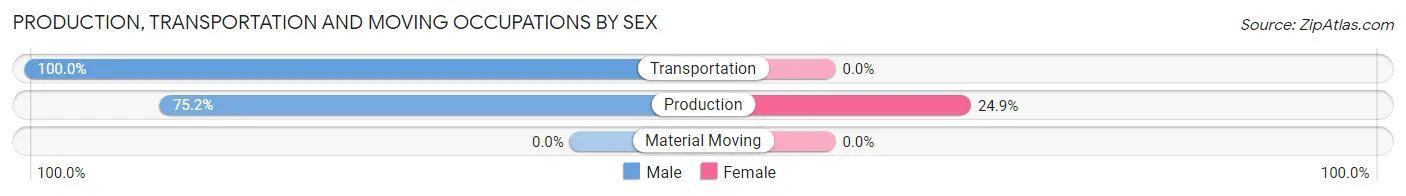
| Occupation | Male | Female |
| Production | 248 (75.1%) | 82 (24.8%) |
| Transportation | 113 (100.0%) | 0 (0.0%) |
| Material Moving | 0 (0.0%) | 0 (0.0%) |
| Total (Category) | 361 (81.5%) | 82 (18.5%) |
| Total (Overall) | 2,518 (41.3%) | 3,575 (58.7%) |
Employment Industries by Sex in Hawaiian Paradise Park
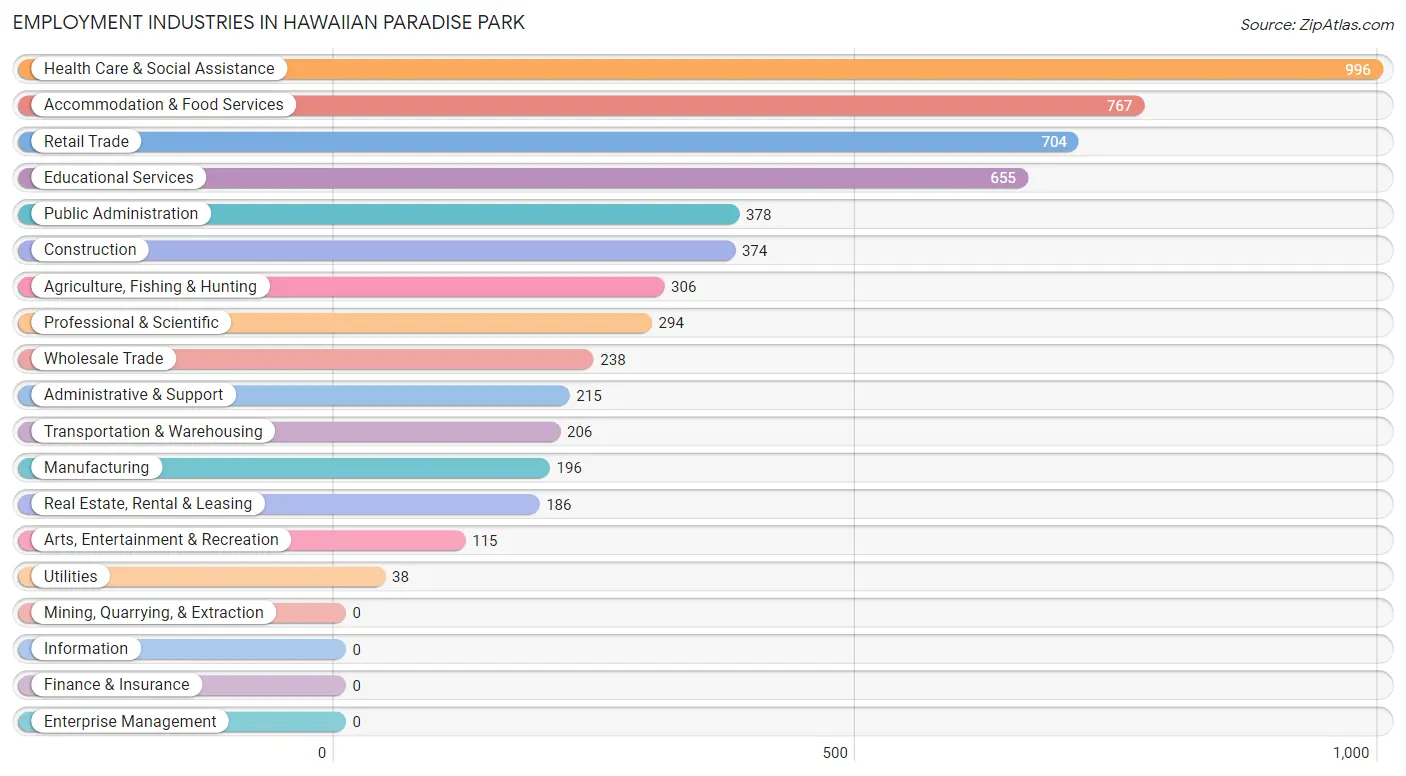
Employment Industries in Hawaiian Paradise Park
The major employment industries in Hawaiian Paradise Park include Health Care & Social Assistance (996 | 16.4%), Accommodation & Food Services (767 | 12.6%), Retail Trade (704 | 11.6%), Educational Services (655 | 10.7%), and Public Administration (378 | 6.2%).
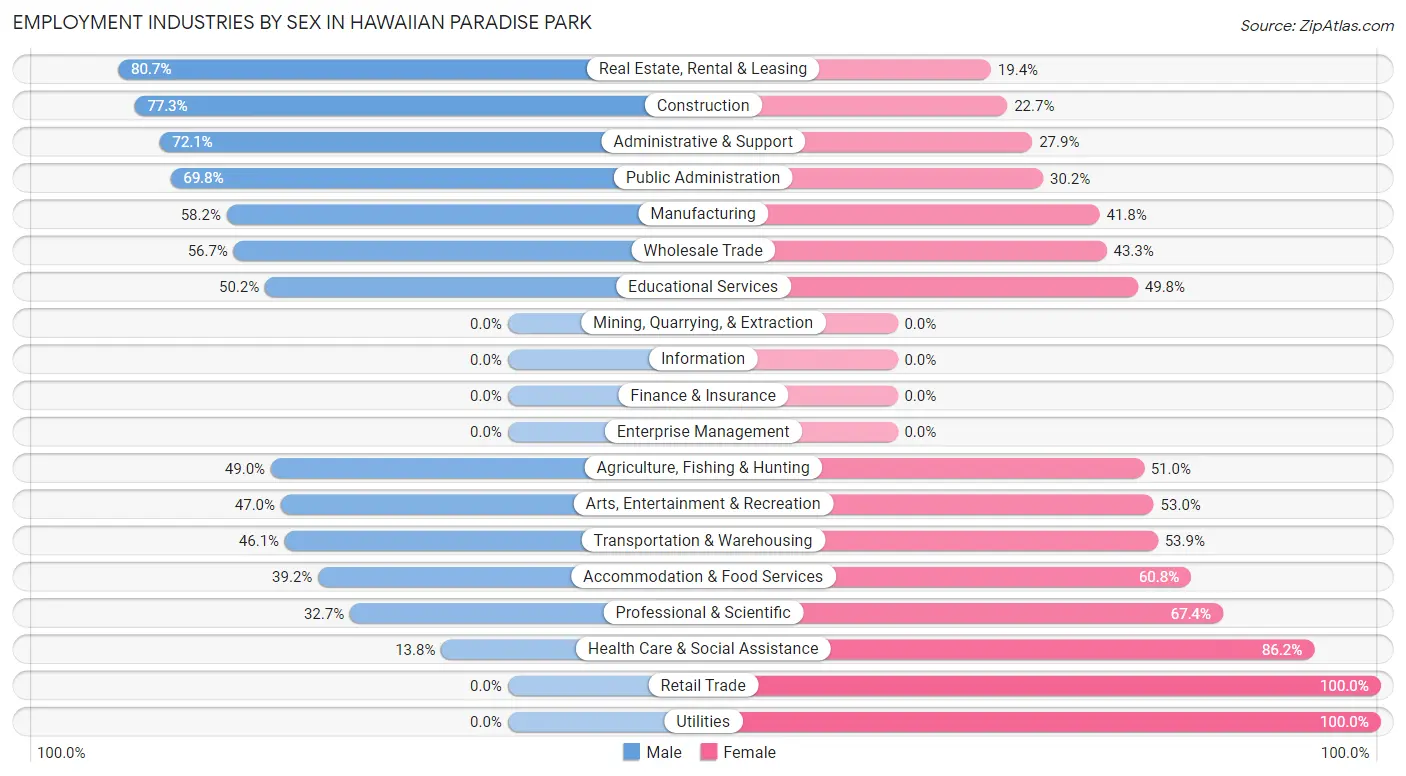
Employment Industries by Sex in Hawaiian Paradise Park
The Hawaiian Paradise Park industries that see more men than women are Real Estate, Rental & Leasing (80.6%), Construction (77.3%), and Administrative & Support (72.1%), whereas the industries that tend to have a higher number of women are Retail Trade (100.0%), Utilities (100.0%), and Health Care & Social Assistance (86.2%).
| Industry | Male | Female |
| Agriculture, Fishing & Hunting | 150 (49.0%) | 156 (51.0%) |
| Mining, Quarrying, & Extraction | 0 (0.0%) | 0 (0.0%) |
| Construction | 289 (77.3%) | 85 (22.7%) |
| Manufacturing | 114 (58.2%) | 82 (41.8%) |
| Wholesale Trade | 135 (56.7%) | 103 (43.3%) |
| Retail Trade | 0 (0.0%) | 704 (100.0%) |
| Transportation & Warehousing | 95 (46.1%) | 111 (53.9%) |
| Utilities | 0 (0.0%) | 38 (100.0%) |
| Information | 0 (0.0%) | 0 (0.0%) |
| Finance & Insurance | 0 (0.0%) | 0 (0.0%) |
| Real Estate, Rental & Leasing | 150 (80.6%) | 36 (19.4%) |
| Professional & Scientific | 96 (32.7%) | 198 (67.3%) |
| Enterprise Management | 0 (0.0%) | 0 (0.0%) |
| Administrative & Support | 155 (72.1%) | 60 (27.9%) |
| Educational Services | 329 (50.2%) | 326 (49.8%) |
| Health Care & Social Assistance | 137 (13.8%) | 859 (86.2%) |
| Arts, Entertainment & Recreation | 54 (47.0%) | 61 (53.0%) |
| Accommodation & Food Services | 301 (39.2%) | 466 (60.8%) |
| Public Administration | 264 (69.8%) | 114 (30.2%) |
| Total | 2,518 (41.3%) | 3,575 (58.7%) |
Education in Hawaiian Paradise Park
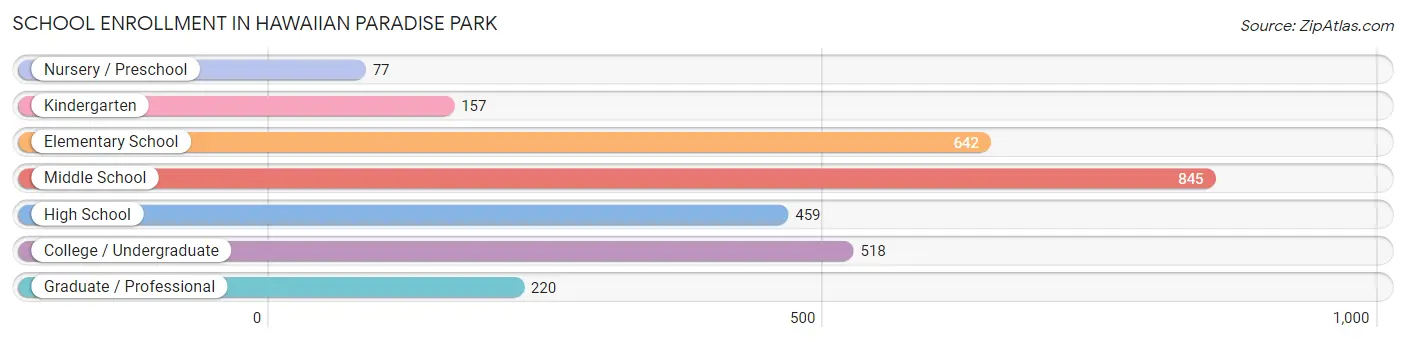
School Enrollment in Hawaiian Paradise Park
The most common levels of schooling among the 2,918 students in Hawaiian Paradise Park are middle school (845 | 29.0%), elementary school (642 | 22.0%), and college / undergraduate (518 | 17.7%).
| School Level | # Students | % Students |
| Nursery / Preschool | 77 | 2.6% |
| Kindergarten | 157 | 5.4% |
| Elementary School | 642 | 22.0% |
| Middle School | 845 | 29.0% |
| High School | 459 | 15.7% |
| College / Undergraduate | 518 | 17.7% |
| Graduate / Professional | 220 | 7.5% |
| Total | 2,918 | 100.0% |
School Enrollment by Age by Funding Source in Hawaiian Paradise Park
Out of a total of 2,918 students who are enrolled in schools in Hawaiian Paradise Park, 537 (18.4%) attend a private institution, while the remaining 2,381 (81.6%) are enrolled in public schools. The age group of 3 to 4 year olds has the highest likelihood of being enrolled in private schools, with 36 (46.8% in the age bracket) enrolled. Conversely, the age group of 18 to 19 year olds has the lowest likelihood of being enrolled in a private school, with 242 (100.0% in the age bracket) attending a public institution.
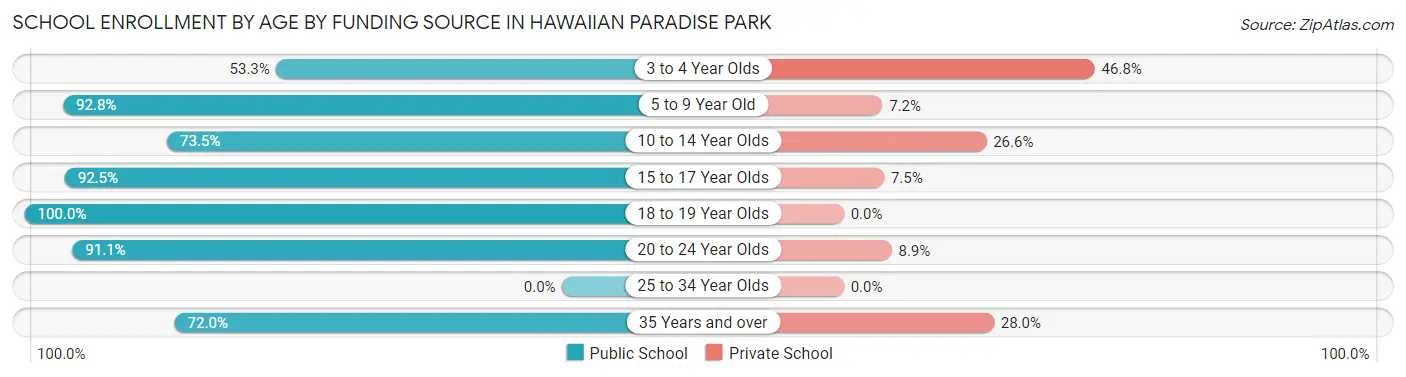
| Age Bracket | Public School | Private School |
| 3 to 4 Year Olds | 41 (53.2%) | 36 (46.8%) |
| 5 to 9 Year Old | 542 (92.8%) | 42 (7.2%) |
| 10 to 14 Year Olds | 827 (73.5%) | 299 (26.6%) |
| 15 to 17 Year Olds | 222 (92.5%) | 18 (7.5%) |
| 18 to 19 Year Olds | 242 (100.0%) | 0 (0.0%) |
| 20 to 24 Year Olds | 184 (91.1%) | 18 (8.9%) |
| 25 to 34 Year Olds | 0 (0.0%) | 0 (0.0%) |
| 35 Years and over | 322 (72.0%) | 125 (28.0%) |
| Total | 2,381 (81.6%) | 537 (18.4%) |
Educational Attainment by Field of Study in Hawaiian Paradise Park
Science & technology (379 | 17.8%), social sciences (293 | 13.8%), arts & humanities (188 | 8.8%), education (182 | 8.6%), and visual & performing arts (143 | 6.7%) are the most common fields of study among 2,125 individuals in Hawaiian Paradise Park who have obtained a bachelor's degree or higher.
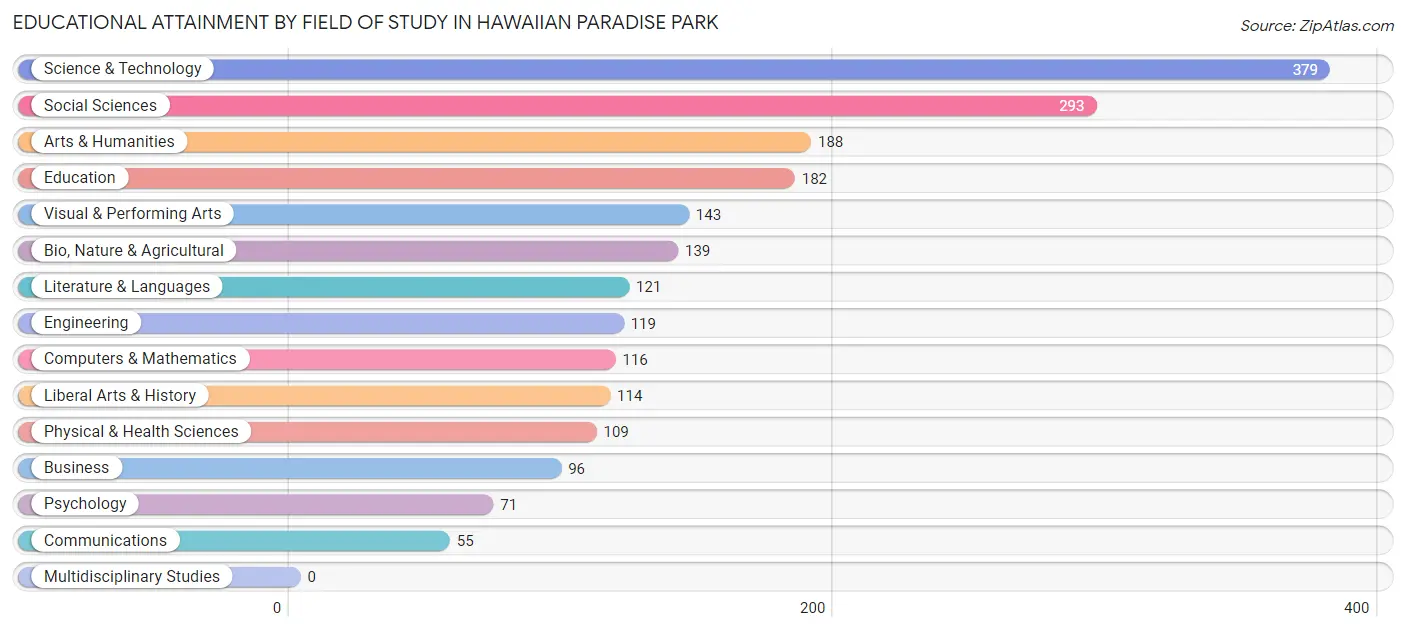
| Field of Study | # Graduates | % Graduates |
| Computers & Mathematics | 116 | 5.5% |
| Bio, Nature & Agricultural | 139 | 6.5% |
| Physical & Health Sciences | 109 | 5.1% |
| Psychology | 71 | 3.3% |
| Social Sciences | 293 | 13.8% |
| Engineering | 119 | 5.6% |
| Multidisciplinary Studies | 0 | 0.0% |
| Science & Technology | 379 | 17.8% |
| Business | 96 | 4.5% |
| Education | 182 | 8.6% |
| Literature & Languages | 121 | 5.7% |
| Liberal Arts & History | 114 | 5.4% |
| Visual & Performing Arts | 143 | 6.7% |
| Communications | 55 | 2.6% |
| Arts & Humanities | 188 | 8.8% |
| Total | 2,125 | 100.0% |
Transportation & Commute in Hawaiian Paradise Park
Vehicle Availability by Sex in Hawaiian Paradise Park
The most prevalent vehicle ownership categories in Hawaiian Paradise Park are males with 2 vehicles (746, accounting for 28.5%) and females with 2 vehicles (1,162, making up 20.4%).
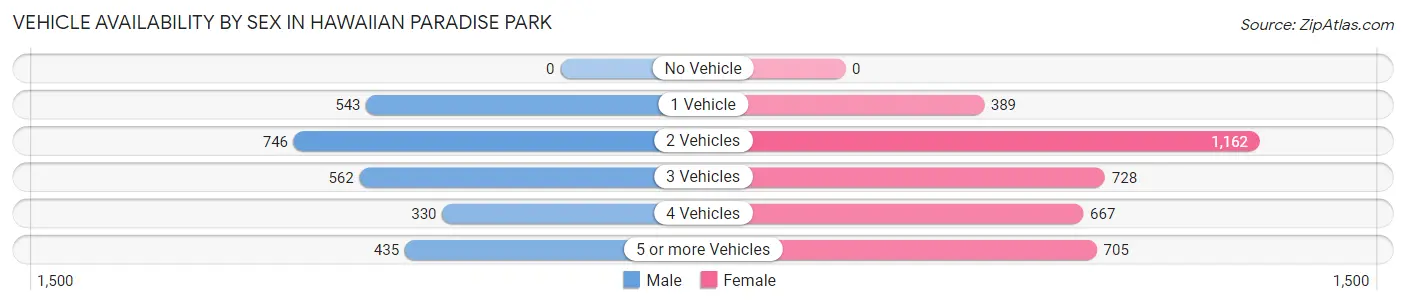
| Vehicles Available | Male | Female |
| No Vehicle | 0 (0.0%) | 0 (0.0%) |
| 1 Vehicle | 543 (20.8%) | 389 (10.6%) |
| 2 Vehicles | 746 (28.5%) | 1,162 (31.8%) |
| 3 Vehicles | 562 (21.5%) | 728 (19.9%) |
| 4 Vehicles | 330 (12.6%) | 667 (18.3%) |
| 5 or more Vehicles | 435 (16.6%) | 705 (19.3%) |
| Total | 2,616 (100.0%) | 3,651 (100.0%) |
Commute Time in Hawaiian Paradise Park
The most frequently occuring commute durations in Hawaiian Paradise Park are 30 to 34 minutes (1,308 commuters, 23.0%), 20 to 24 minutes (753 commuters, 13.2%), and 25 to 29 minutes (718 commuters, 12.6%).
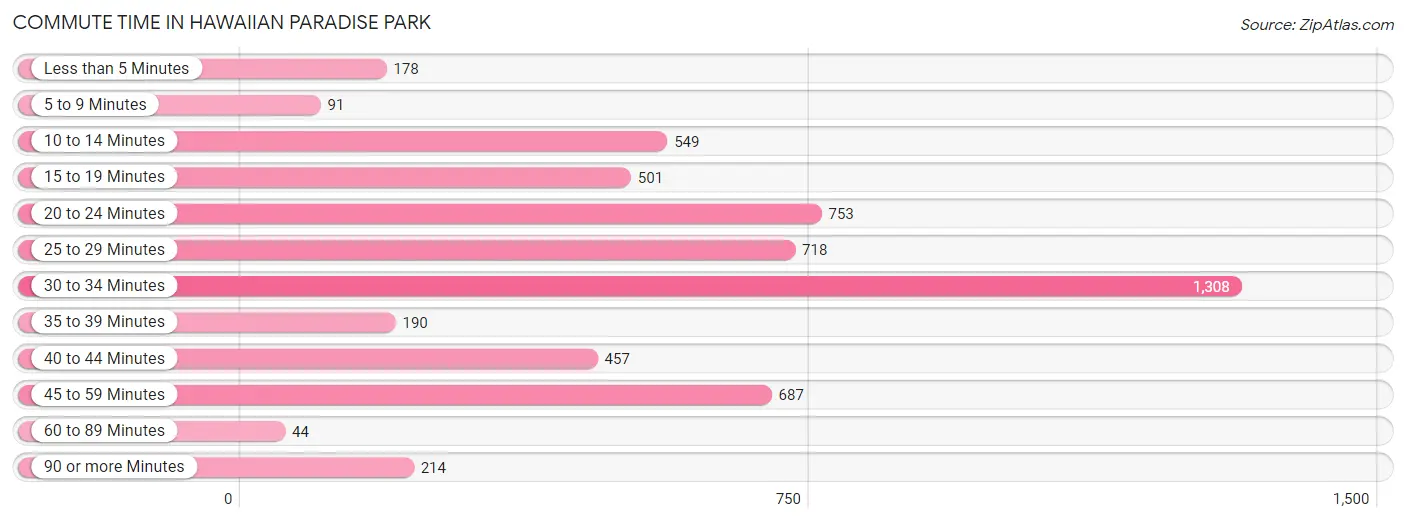
| Commute Time | # Commuters | % Commuters |
| Less than 5 Minutes | 178 | 3.1% |
| 5 to 9 Minutes | 91 | 1.6% |
| 10 to 14 Minutes | 549 | 9.7% |
| 15 to 19 Minutes | 501 | 8.8% |
| 20 to 24 Minutes | 753 | 13.2% |
| 25 to 29 Minutes | 718 | 12.6% |
| 30 to 34 Minutes | 1,308 | 23.0% |
| 35 to 39 Minutes | 190 | 3.3% |
| 40 to 44 Minutes | 457 | 8.0% |
| 45 to 59 Minutes | 687 | 12.1% |
| 60 to 89 Minutes | 44 | 0.8% |
| 90 or more Minutes | 214 | 3.8% |
Commute Time by Sex in Hawaiian Paradise Park
The most common commute times in Hawaiian Paradise Park are 30 to 34 minutes (632 commuters, 26.7%) for males and 30 to 34 minutes (676 commuters, 20.4%) for females.
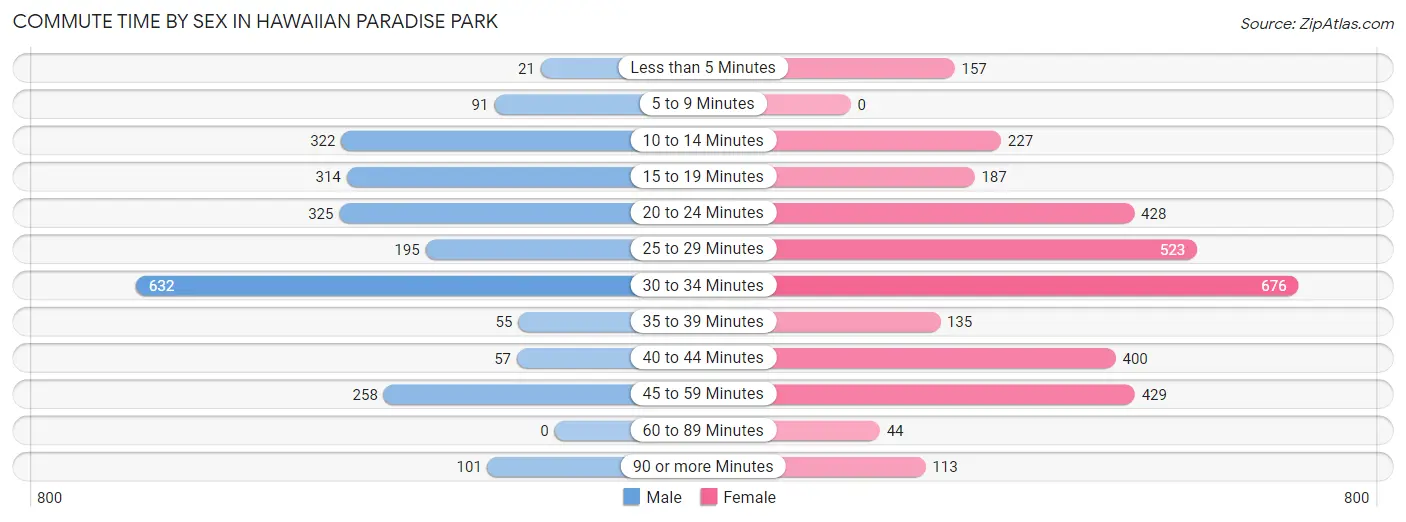
| Commute Time | Male | Female |
| Less than 5 Minutes | 21 (0.9%) | 157 (4.7%) |
| 5 to 9 Minutes | 91 (3.8%) | 0 (0.0%) |
| 10 to 14 Minutes | 322 (13.6%) | 227 (6.8%) |
| 15 to 19 Minutes | 314 (13.2%) | 187 (5.6%) |
| 20 to 24 Minutes | 325 (13.7%) | 428 (12.9%) |
| 25 to 29 Minutes | 195 (8.2%) | 523 (15.8%) |
| 30 to 34 Minutes | 632 (26.7%) | 676 (20.4%) |
| 35 to 39 Minutes | 55 (2.3%) | 135 (4.1%) |
| 40 to 44 Minutes | 57 (2.4%) | 400 (12.0%) |
| 45 to 59 Minutes | 258 (10.9%) | 429 (12.9%) |
| 60 to 89 Minutes | 0 (0.0%) | 44 (1.3%) |
| 90 or more Minutes | 101 (4.3%) | 113 (3.4%) |
Time of Departure to Work by Sex in Hawaiian Paradise Park
The most frequent times of departure to work in Hawaiian Paradise Park are 6:30 AM to 6:59 AM (448, 18.9%) for males and 6:30 AM to 6:59 AM (845, 25.5%) for females.
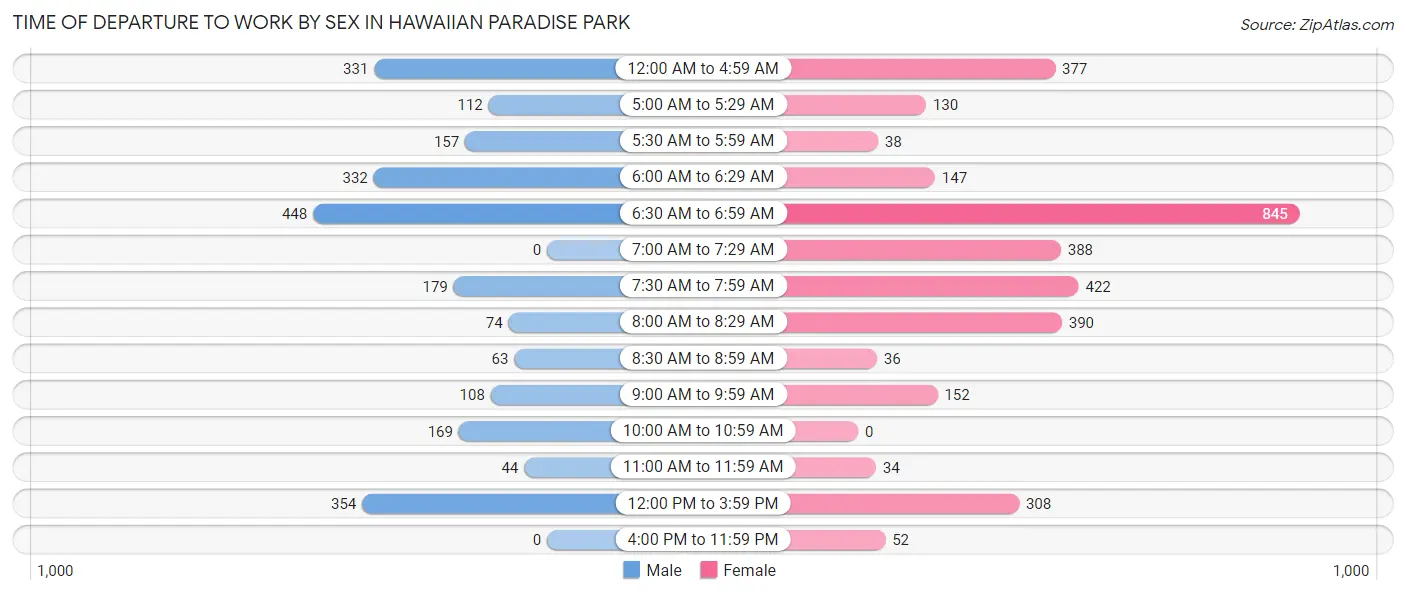
| Time of Departure | Male | Female |
| 12:00 AM to 4:59 AM | 331 (14.0%) | 377 (11.4%) |
| 5:00 AM to 5:29 AM | 112 (4.7%) | 130 (3.9%) |
| 5:30 AM to 5:59 AM | 157 (6.6%) | 38 (1.1%) |
| 6:00 AM to 6:29 AM | 332 (14.0%) | 147 (4.4%) |
| 6:30 AM to 6:59 AM | 448 (18.9%) | 845 (25.5%) |
| 7:00 AM to 7:29 AM | 0 (0.0%) | 388 (11.7%) |
| 7:30 AM to 7:59 AM | 179 (7.5%) | 422 (12.7%) |
| 8:00 AM to 8:29 AM | 74 (3.1%) | 390 (11.7%) |
| 8:30 AM to 8:59 AM | 63 (2.7%) | 36 (1.1%) |
| 9:00 AM to 9:59 AM | 108 (4.6%) | 152 (4.6%) |
| 10:00 AM to 10:59 AM | 169 (7.1%) | 0 (0.0%) |
| 11:00 AM to 11:59 AM | 44 (1.9%) | 34 (1.0%) |
| 12:00 PM to 3:59 PM | 354 (14.9%) | 308 (9.3%) |
| 4:00 PM to 11:59 PM | 0 (0.0%) | 52 (1.6%) |
| Total | 2,371 (100.0%) | 3,319 (100.0%) |
Housing Occupancy in Hawaiian Paradise Park
Occupancy by Ownership in Hawaiian Paradise Park
Of the total 4,514 dwellings in Hawaiian Paradise Park, owner-occupied units account for 3,449 (76.4%), while renter-occupied units make up 1,065 (23.6%).
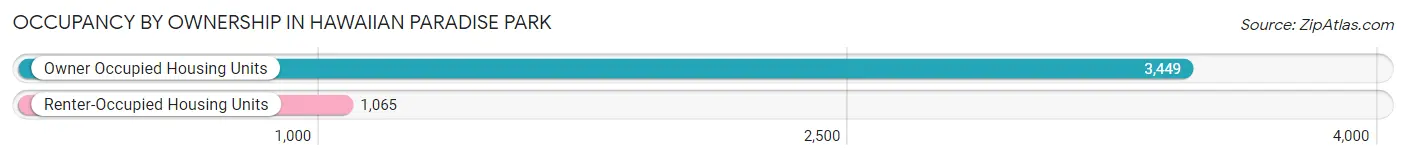
| Occupancy | # Housing Units | % Housing Units |
| Owner Occupied Housing Units | 3,449 | 76.4% |
| Renter-Occupied Housing Units | 1,065 | 23.6% |
| Total Occupied Housing Units | 4,514 | 100.0% |
Occupancy by Household Size in Hawaiian Paradise Park
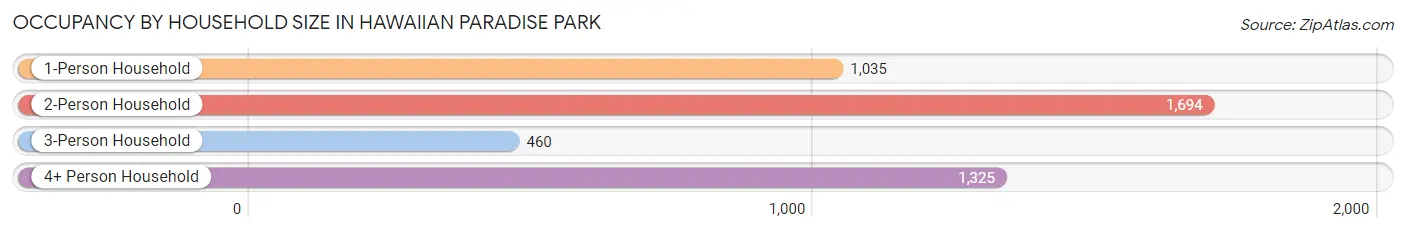
| Household Size | # Housing Units | % Housing Units |
| 1-Person Household | 1,035 | 22.9% |
| 2-Person Household | 1,694 | 37.5% |
| 3-Person Household | 460 | 10.2% |
| 4+ Person Household | 1,325 | 29.3% |
| Total Housing Units | 4,514 | 100.0% |
Occupancy by Ownership by Household Size in Hawaiian Paradise Park
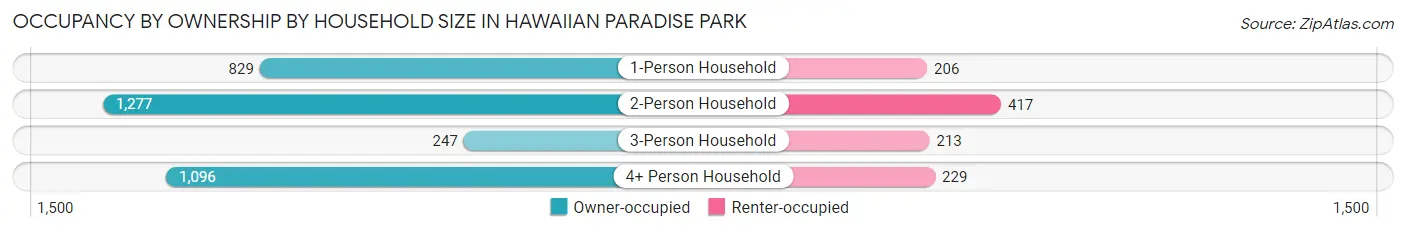
| Household Size | Owner-occupied | Renter-occupied |
| 1-Person Household | 829 (80.1%) | 206 (19.9%) |
| 2-Person Household | 1,277 (75.4%) | 417 (24.6%) |
| 3-Person Household | 247 (53.7%) | 213 (46.3%) |
| 4+ Person Household | 1,096 (82.7%) | 229 (17.3%) |
| Total Housing Units | 3,449 (76.4%) | 1,065 (23.6%) |
Occupancy by Educational Attainment in Hawaiian Paradise Park
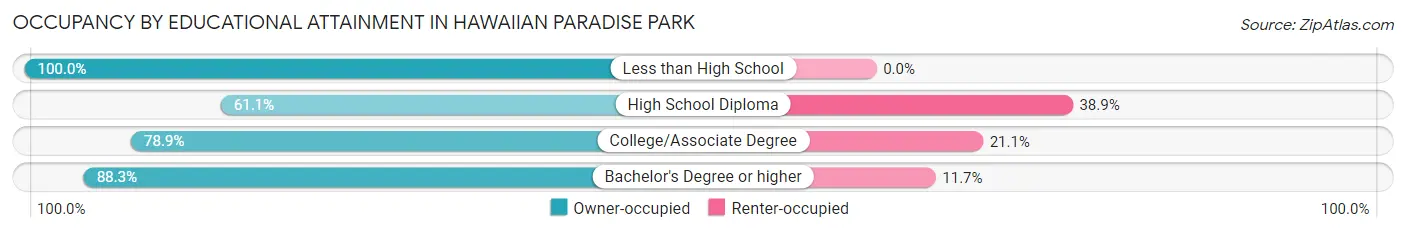
| Household Size | Owner-occupied | Renter-occupied |
| Less than High School | 314 (100.0%) | 0 (0.0%) |
| High School Diploma | 954 (61.1%) | 608 (38.9%) |
| College/Associate Degree | 1,240 (78.9%) | 332 (21.1%) |
| Bachelor's Degree or higher | 941 (88.3%) | 125 (11.7%) |
Occupancy by Age of Householder in Hawaiian Paradise Park
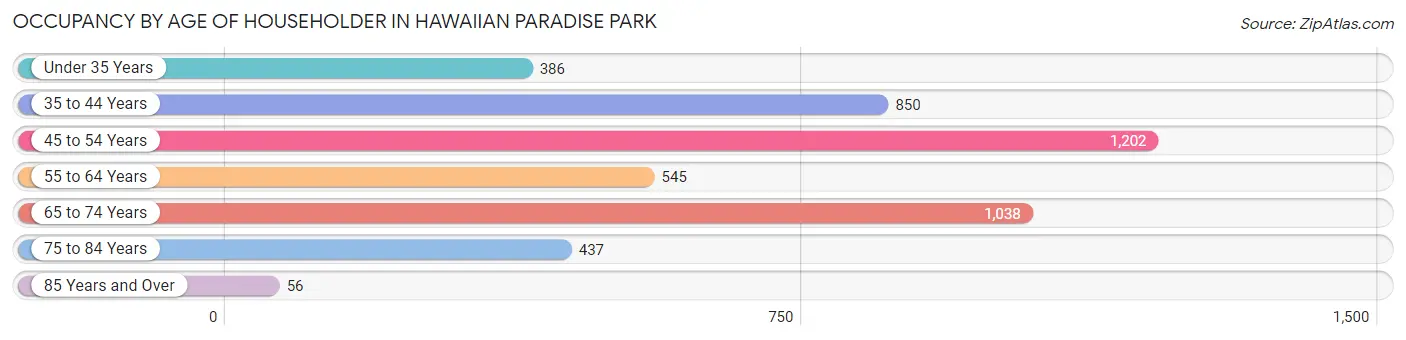
| Age Bracket | # Households | % Households |
| Under 35 Years | 386 | 8.6% |
| 35 to 44 Years | 850 | 18.8% |
| 45 to 54 Years | 1,202 | 26.6% |
| 55 to 64 Years | 545 | 12.1% |
| 65 to 74 Years | 1,038 | 23.0% |
| 75 to 84 Years | 437 | 9.7% |
| 85 Years and Over | 56 | 1.2% |
| Total | 4,514 | 100.0% |
Housing Finances in Hawaiian Paradise Park
Median Income by Occupancy in Hawaiian Paradise Park
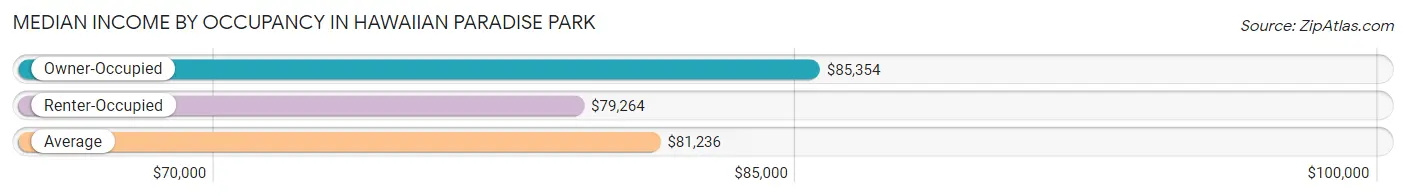
| Occupancy Type | # Households | Median Income |
| Owner-Occupied | 3,449 (76.4%) | $85,354 |
| Renter-Occupied | 1,065 (23.6%) | $79,264 |
| Average | 4,514 (100.0%) | $81,236 |
Occupancy by Householder Income Bracket in Hawaiian Paradise Park
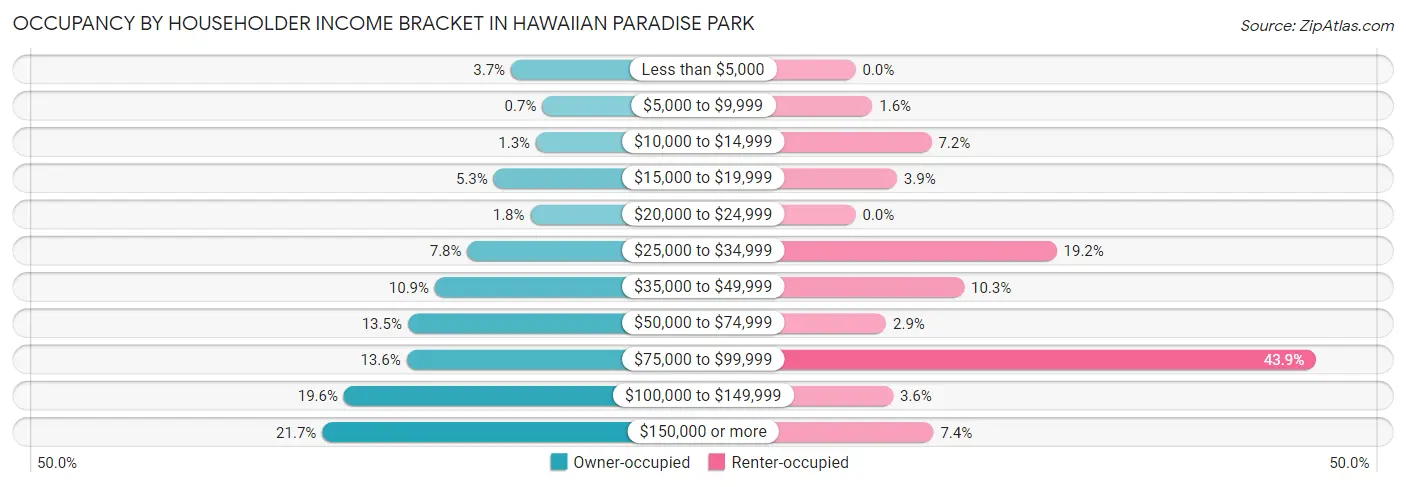
| Income Bracket | Owner-occupied | Renter-occupied |
| Less than $5,000 | 127 (3.7%) | 0 (0.0%) |
| $5,000 to $9,999 | 24 (0.7%) | 17 (1.6%) |
| $10,000 to $14,999 | 45 (1.3%) | 77 (7.2%) |
| $15,000 to $19,999 | 184 (5.3%) | 42 (3.9%) |
| $20,000 to $24,999 | 63 (1.8%) | 0 (0.0%) |
| $25,000 to $34,999 | 270 (7.8%) | 204 (19.2%) |
| $35,000 to $49,999 | 377 (10.9%) | 110 (10.3%) |
| $50,000 to $74,999 | 466 (13.5%) | 31 (2.9%) |
| $75,000 to $99,999 | 470 (13.6%) | 467 (43.9%) |
| $100,000 to $149,999 | 676 (19.6%) | 38 (3.6%) |
| $150,000 or more | 747 (21.7%) | 79 (7.4%) |
| Total | 3,449 (100.0%) | 1,065 (100.0%) |
Monthly Housing Cost Tiers in Hawaiian Paradise Park
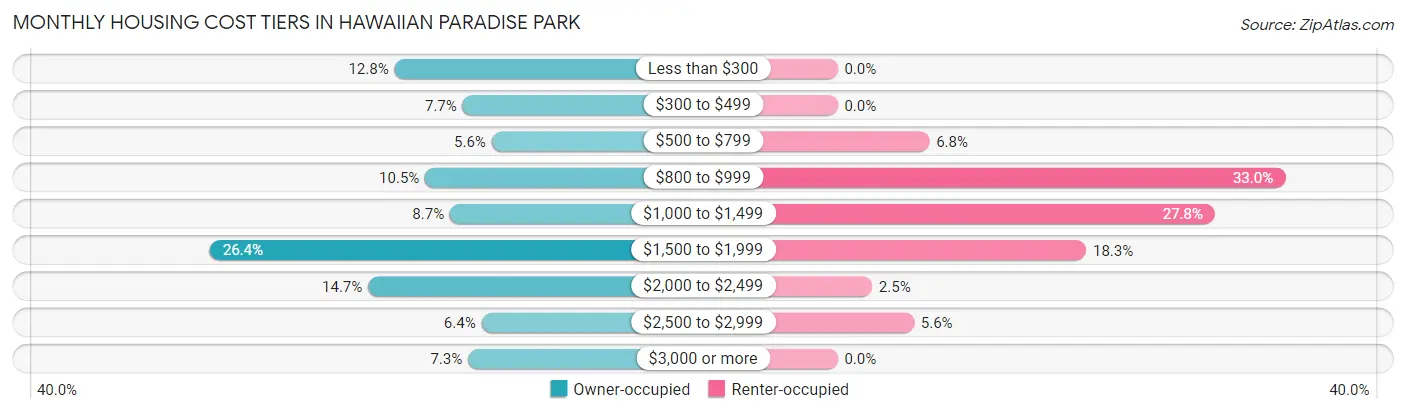
| Monthly Cost | Owner-occupied | Renter-occupied |
| Less than $300 | 440 (12.8%) | 0 (0.0%) |
| $300 to $499 | 267 (7.7%) | 0 (0.0%) |
| $500 to $799 | 193 (5.6%) | 72 (6.8%) |
| $800 to $999 | 362 (10.5%) | 351 (33.0%) |
| $1,000 to $1,499 | 299 (8.7%) | 296 (27.8%) |
| $1,500 to $1,999 | 909 (26.4%) | 195 (18.3%) |
| $2,000 to $2,499 | 507 (14.7%) | 27 (2.5%) |
| $2,500 to $2,999 | 219 (6.4%) | 60 (5.6%) |
| $3,000 or more | 253 (7.3%) | 0 (0.0%) |
| Total | 3,449 (100.0%) | 1,065 (100.0%) |
Physical Housing Characteristics in Hawaiian Paradise Park
Housing Structures in Hawaiian Paradise Park
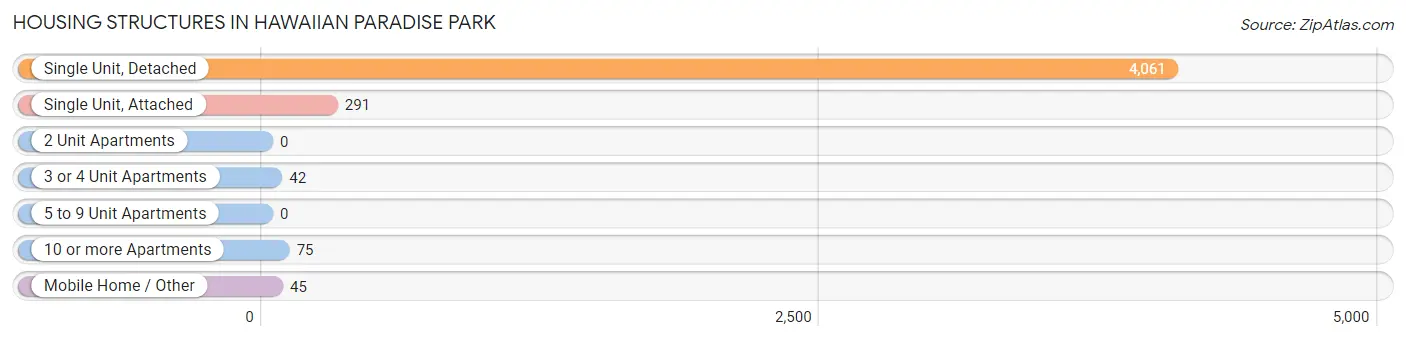
| Structure Type | # Housing Units | % Housing Units |
| Single Unit, Detached | 4,061 | 90.0% |
| Single Unit, Attached | 291 | 6.5% |
| 2 Unit Apartments | 0 | 0.0% |
| 3 or 4 Unit Apartments | 42 | 0.9% |
| 5 to 9 Unit Apartments | 0 | 0.0% |
| 10 or more Apartments | 75 | 1.7% |
| Mobile Home / Other | 45 | 1.0% |
| Total | 4,514 | 100.0% |
Housing Structures by Occupancy in Hawaiian Paradise Park
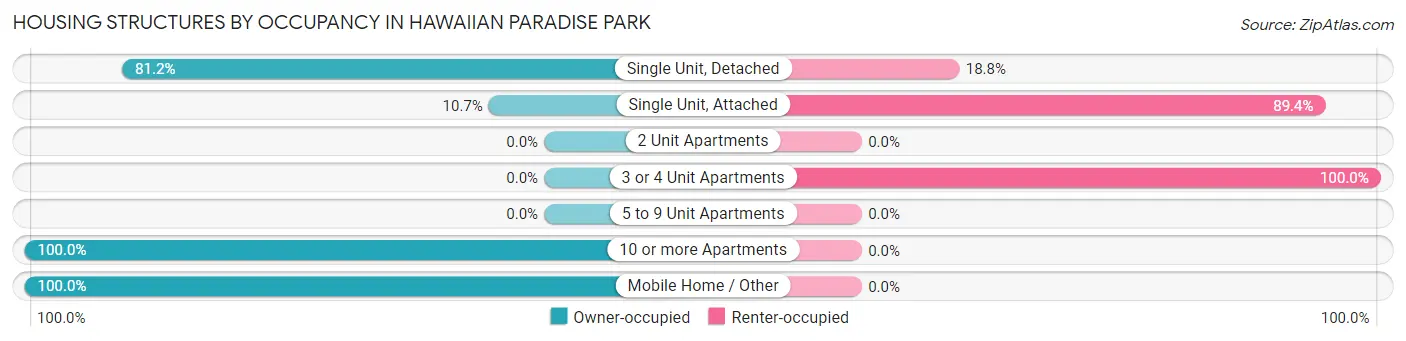
| Structure Type | Owner-occupied | Renter-occupied |
| Single Unit, Detached | 3,298 (81.2%) | 763 (18.8%) |
| Single Unit, Attached | 31 (10.6%) | 260 (89.3%) |
| 2 Unit Apartments | 0 (0.0%) | 0 (0.0%) |
| 3 or 4 Unit Apartments | 0 (0.0%) | 42 (100.0%) |
| 5 to 9 Unit Apartments | 0 (0.0%) | 0 (0.0%) |
| 10 or more Apartments | 75 (100.0%) | 0 (0.0%) |
| Mobile Home / Other | 45 (100.0%) | 0 (0.0%) |
| Total | 3,449 (76.4%) | 1,065 (23.6%) |
Housing Structures by Number of Rooms in Hawaiian Paradise Park
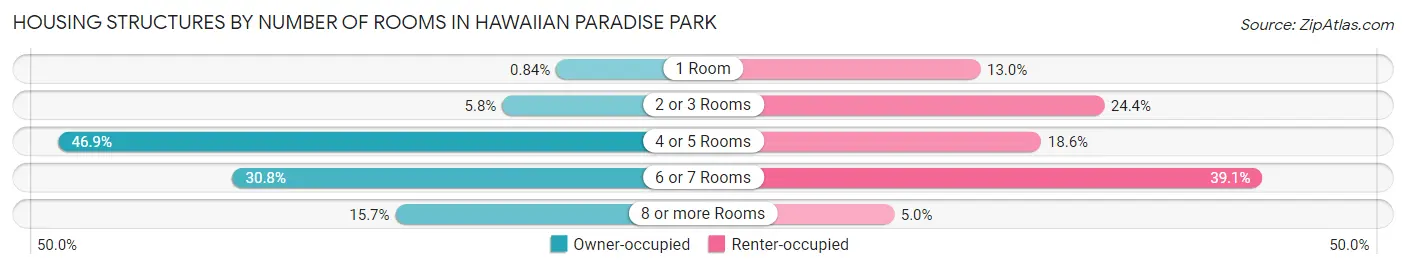
| Number of Rooms | Owner-occupied | Renter-occupied |
| 1 Room | 29 (0.8%) | 138 (13.0%) |
| 2 or 3 Rooms | 201 (5.8%) | 260 (24.4%) |
| 4 or 5 Rooms | 1,616 (46.9%) | 198 (18.6%) |
| 6 or 7 Rooms | 1,061 (30.8%) | 416 (39.1%) |
| 8 or more Rooms | 542 (15.7%) | 53 (5.0%) |
| Total | 3,449 (100.0%) | 1,065 (100.0%) |
Housing Structure by Heating Type in Hawaiian Paradise Park
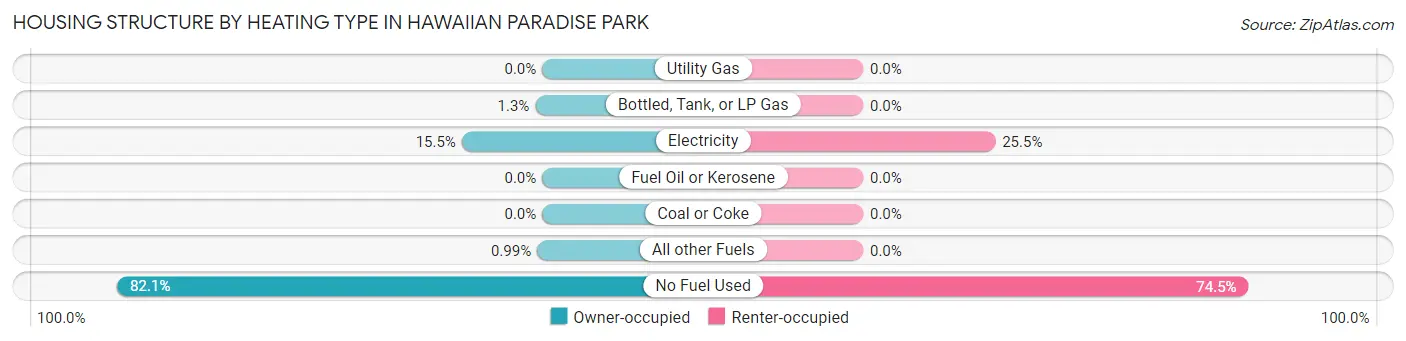
| Heating Type | Owner-occupied | Renter-occupied |
| Utility Gas | 0 (0.0%) | 0 (0.0%) |
| Bottled, Tank, or LP Gas | 46 (1.3%) | 0 (0.0%) |
| Electricity | 536 (15.5%) | 272 (25.5%) |
| Fuel Oil or Kerosene | 0 (0.0%) | 0 (0.0%) |
| Coal or Coke | 0 (0.0%) | 0 (0.0%) |
| All other Fuels | 34 (1.0%) | 0 (0.0%) |
| No Fuel Used | 2,833 (82.1%) | 793 (74.5%) |
| Total | 3,449 (100.0%) | 1,065 (100.0%) |
Household Vehicle Usage in Hawaiian Paradise Park
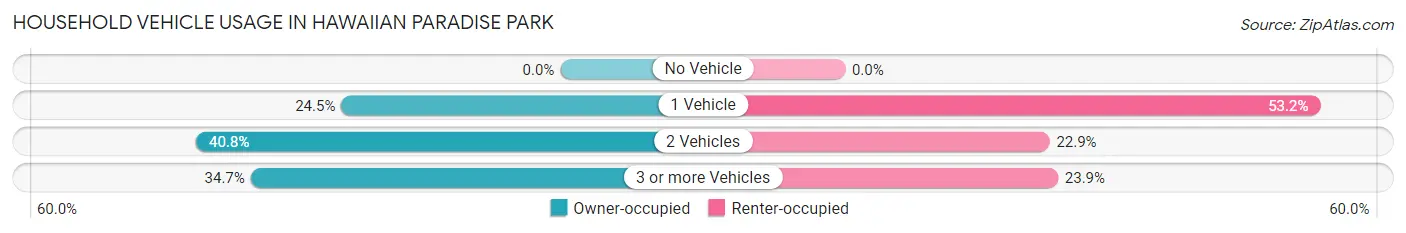
| Vehicles per Household | Owner-occupied | Renter-occupied |
| No Vehicle | 0 (0.0%) | 0 (0.0%) |
| 1 Vehicle | 846 (24.5%) | 567 (53.2%) |
| 2 Vehicles | 1,407 (40.8%) | 244 (22.9%) |
| 3 or more Vehicles | 1,196 (34.7%) | 254 (23.8%) |
| Total | 3,449 (100.0%) | 1,065 (100.0%) |
Real Estate & Mortgages in Hawaiian Paradise Park
Real Estate and Mortgage Overview in Hawaiian Paradise Park
| Characteristic | Without Mortgage | With Mortgage |
| Housing Units | 900 | 2,549 |
| Median Property Value | $364,300 | $440,900 |
| Median Household Income | $54,912 | $530 |
| Monthly Housing Costs | $306 | $253 |
| Real Estate Taxes | $901 | $50 |
Property Value by Mortgage Status in Hawaiian Paradise Park
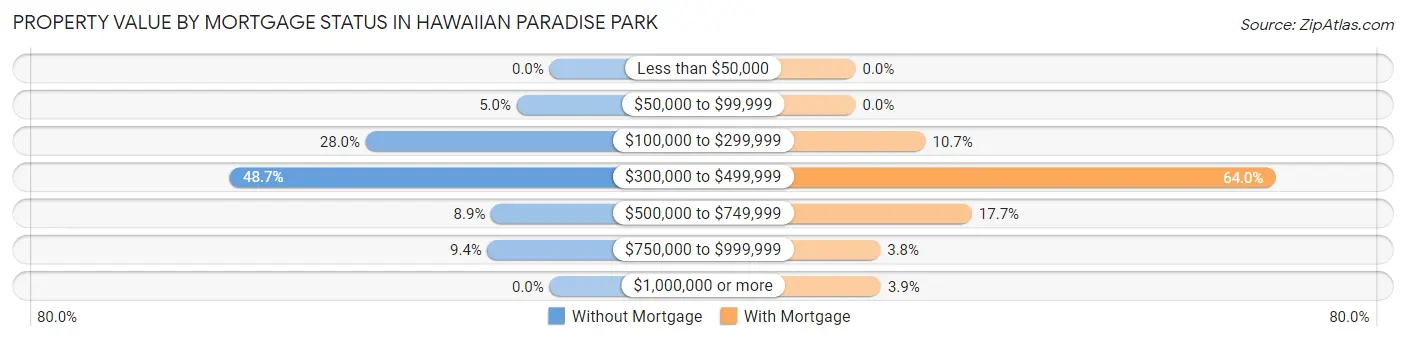
| Property Value | Without Mortgage | With Mortgage |
| Less than $50,000 | 0 (0.0%) | 0 (0.0%) |
| $50,000 to $99,999 | 45 (5.0%) | 0 (0.0%) |
| $100,000 to $299,999 | 252 (28.0%) | 272 (10.7%) |
| $300,000 to $499,999 | 438 (48.7%) | 1,630 (63.9%) |
| $500,000 to $749,999 | 80 (8.9%) | 452 (17.7%) |
| $750,000 to $999,999 | 85 (9.4%) | 96 (3.8%) |
| $1,000,000 or more | 0 (0.0%) | 99 (3.9%) |
| Total | 900 (100.0%) | 2,549 (100.0%) |
Household Income by Mortgage Status in Hawaiian Paradise Park
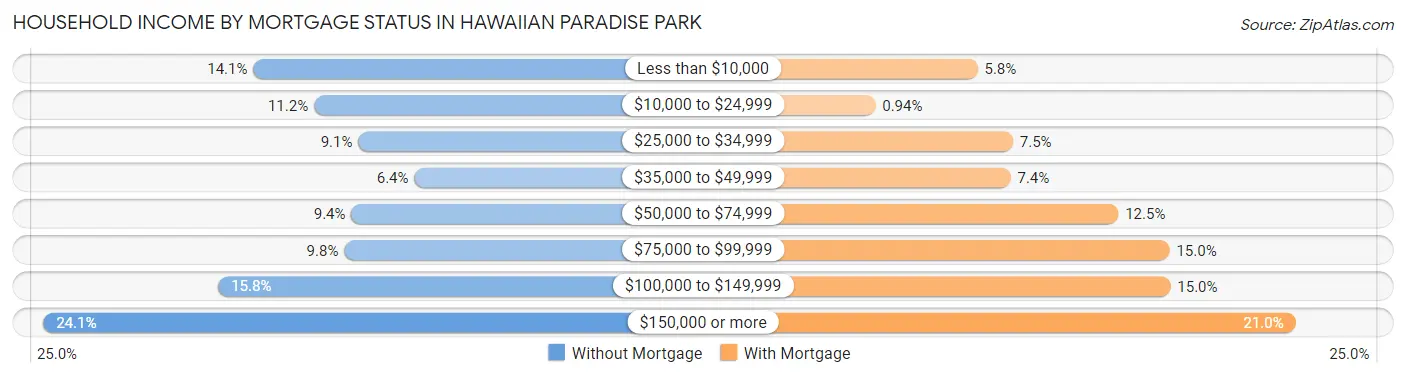
| Household Income | Without Mortgage | With Mortgage |
| Less than $10,000 | 127 (14.1%) | 148 (5.8%) |
| $10,000 to $24,999 | 101 (11.2%) | 24 (0.9%) |
| $25,000 to $34,999 | 82 (9.1%) | 191 (7.5%) |
| $35,000 to $49,999 | 58 (6.4%) | 188 (7.4%) |
| $50,000 to $74,999 | 85 (9.4%) | 319 (12.5%) |
| $75,000 to $99,999 | 88 (9.8%) | 381 (14.9%) |
| $100,000 to $149,999 | 142 (15.8%) | 382 (15.0%) |
| $150,000 or more | 217 (24.1%) | 534 (20.9%) |
| Total | 900 (100.0%) | 2,549 (100.0%) |
Property Value to Household Income Ratio in Hawaiian Paradise Park
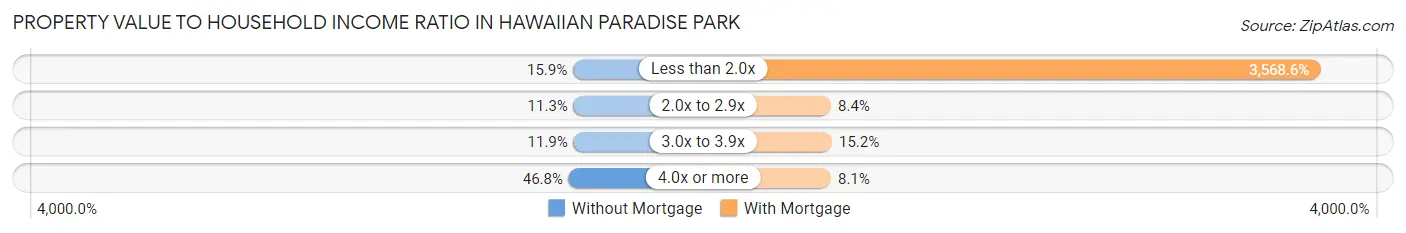
| Value-to-Income Ratio | Without Mortgage | With Mortgage |
| Less than 2.0x | 143 (15.9%) | 90,964 (3,568.6%) |
| 2.0x to 2.9x | 102 (11.3%) | 215 (8.4%) |
| 3.0x to 3.9x | 107 (11.9%) | 388 (15.2%) |
| 4.0x or more | 421 (46.8%) | 206 (8.1%) |
| Total | 900 (100.0%) | 2,549 (100.0%) |
Real Estate Taxes by Mortgage Status in Hawaiian Paradise Park
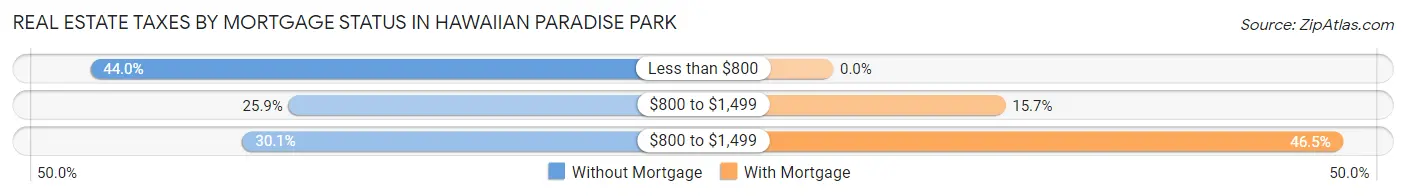
| Property Taxes | Without Mortgage | With Mortgage |
| Less than $800 | 396 (44.0%) | 0 (0.0%) |
| $800 to $1,499 | 233 (25.9%) | 401 (15.7%) |
| $800 to $1,499 | 271 (30.1%) | 1,186 (46.5%) |
| Total | 900 (100.0%) | 2,549 (100.0%) |
Health & Disability in Hawaiian Paradise Park
Health Insurance Coverage by Age in Hawaiian Paradise Park
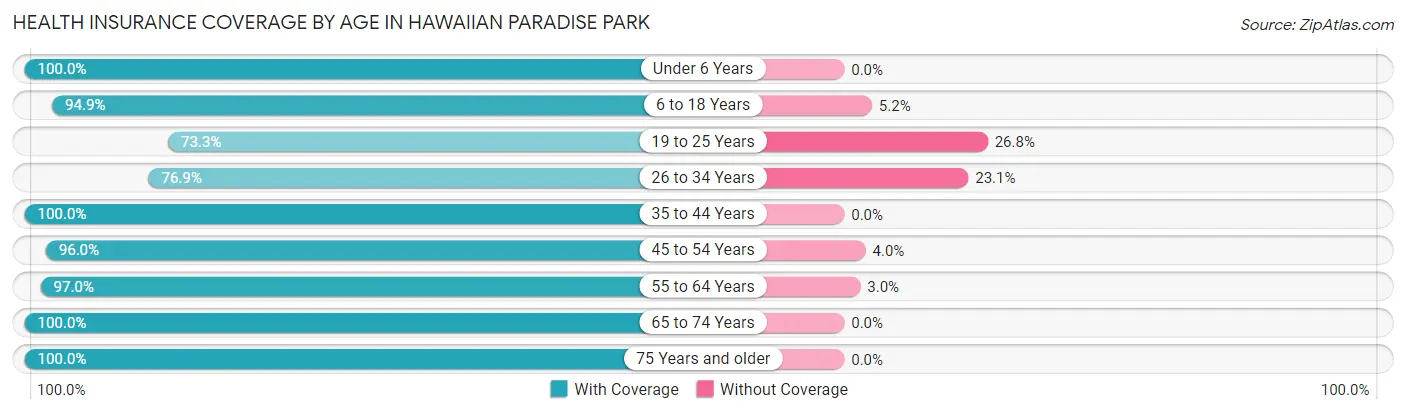
| Age Bracket | With Coverage | Without Coverage |
| Under 6 Years | 1,100 (100.0%) | 0 (0.0%) |
| 6 to 18 Years | 1,935 (94.9%) | 105 (5.1%) |
| 19 to 25 Years | 775 (73.3%) | 283 (26.8%) |
| 26 to 34 Years | 735 (76.9%) | 221 (23.1%) |
| 35 to 44 Years | 1,659 (100.0%) | 0 (0.0%) |
| 45 to 54 Years | 1,957 (96.0%) | 81 (4.0%) |
| 55 to 64 Years | 1,462 (97.0%) | 45 (3.0%) |
| 65 to 74 Years | 1,723 (100.0%) | 0 (0.0%) |
| 75 Years and older | 701 (100.0%) | 0 (0.0%) |
| Total | 12,047 (94.3%) | 735 (5.8%) |
Health Insurance Coverage by Citizenship Status in Hawaiian Paradise Park
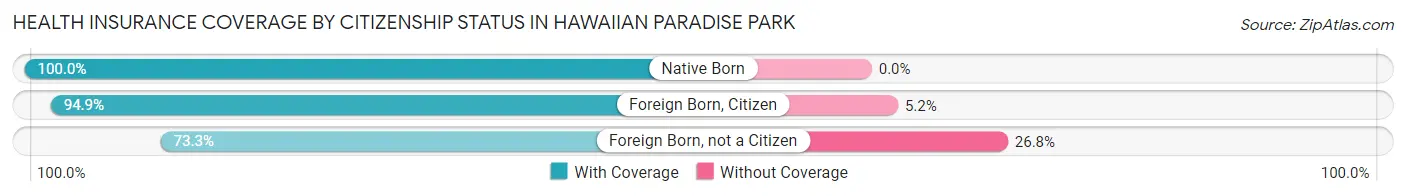
| Citizenship Status | With Coverage | Without Coverage |
| Native Born | 1,100 (100.0%) | 0 (0.0%) |
| Foreign Born, Citizen | 1,935 (94.9%) | 105 (5.1%) |
| Foreign Born, not a Citizen | 775 (73.3%) | 283 (26.8%) |
Health Insurance Coverage by Household Income in Hawaiian Paradise Park
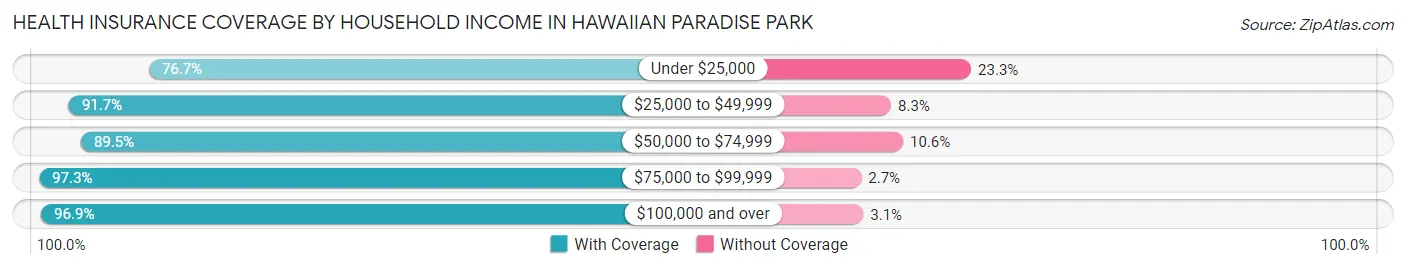
| Household Income | With Coverage | Without Coverage |
| Under $25,000 | 675 (76.7%) | 205 (23.3%) |
| $25,000 to $49,999 | 1,734 (91.7%) | 157 (8.3%) |
| $50,000 to $74,999 | 890 (89.4%) | 105 (10.5%) |
| $75,000 to $99,999 | 2,988 (97.3%) | 84 (2.7%) |
| $100,000 and over | 5,752 (96.9%) | 184 (3.1%) |
Public vs Private Health Insurance Coverage by Age in Hawaiian Paradise Park
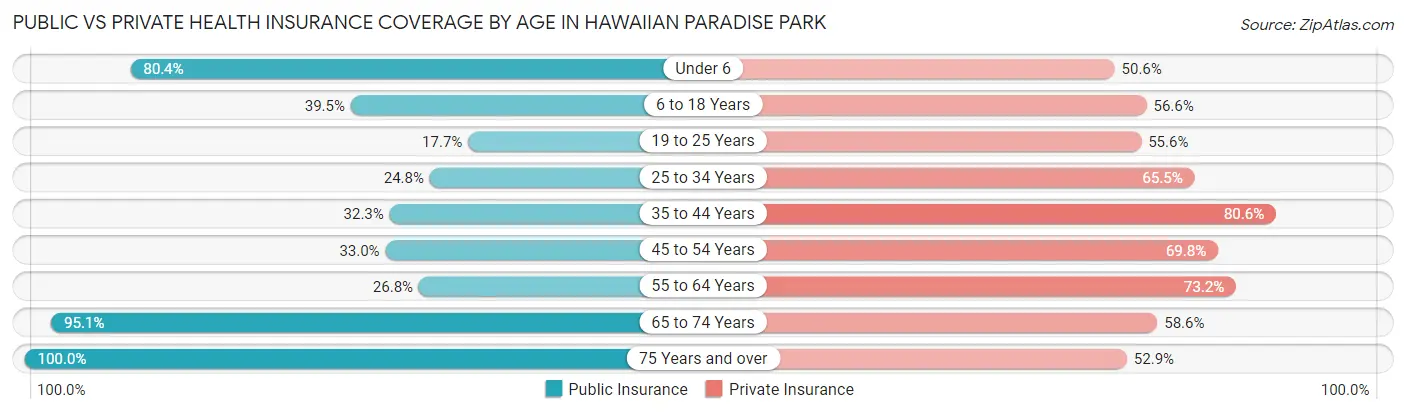
| Age Bracket | Public Insurance | Private Insurance |
| Under 6 | 884 (80.4%) | 557 (50.6%) |
| 6 to 18 Years | 805 (39.5%) | 1,154 (56.6%) |
| 19 to 25 Years | 187 (17.7%) | 588 (55.6%) |
| 25 to 34 Years | 237 (24.8%) | 626 (65.5%) |
| 35 to 44 Years | 535 (32.3%) | 1,337 (80.6%) |
| 45 to 54 Years | 673 (33.0%) | 1,423 (69.8%) |
| 55 to 64 Years | 404 (26.8%) | 1,103 (73.2%) |
| 65 to 74 Years | 1,638 (95.1%) | 1,009 (58.6%) |
| 75 Years and over | 701 (100.0%) | 371 (52.9%) |
| Total | 6,064 (47.4%) | 8,168 (63.9%) |
Disability Status by Sex by Age in Hawaiian Paradise Park
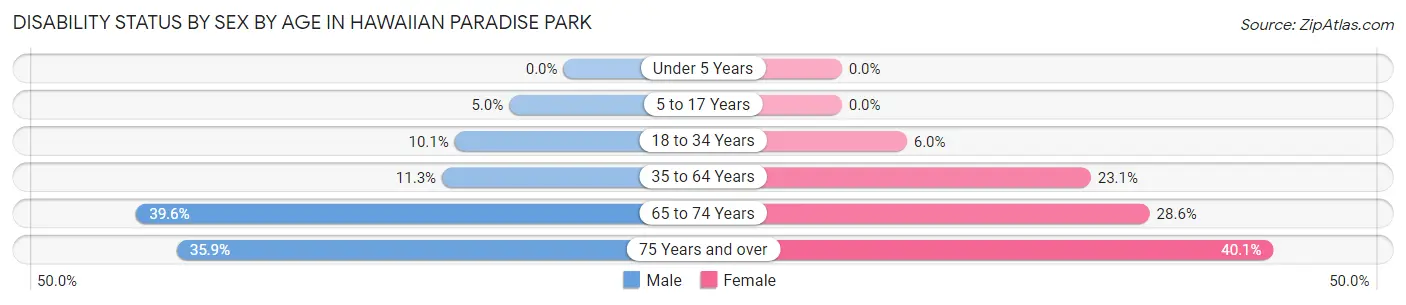
| Age Bracket | Male | Female |
| Under 5 Years | 0 (0.0%) | 0 (0.0%) |
| 5 to 17 Years | 54 (5.0%) | 0 (0.0%) |
| 18 to 34 Years | 84 (10.1%) | 82 (6.0%) |
| 35 to 64 Years | 290 (11.3%) | 608 (23.1%) |
| 65 to 74 Years | 386 (39.6%) | 214 (28.6%) |
| 75 Years and over | 118 (35.9%) | 149 (40.1%) |
Disability Class by Sex by Age in Hawaiian Paradise Park
Disability Class: Hearing Difficulty
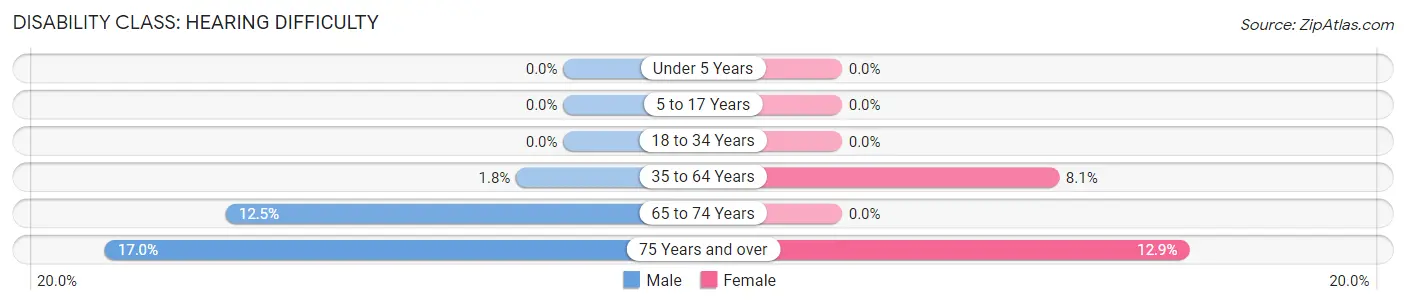
| Age Bracket | Male | Female |
| Under 5 Years | 0 (0.0%) | 0 (0.0%) |
| 5 to 17 Years | 0 (0.0%) | 0 (0.0%) |
| 18 to 34 Years | 0 (0.0%) | 0 (0.0%) |
| 35 to 64 Years | 45 (1.8%) | 212 (8.1%) |
| 65 to 74 Years | 122 (12.5%) | 0 (0.0%) |
| 75 Years and over | 56 (17.0%) | 48 (12.9%) |
Disability Class: Vision Difficulty
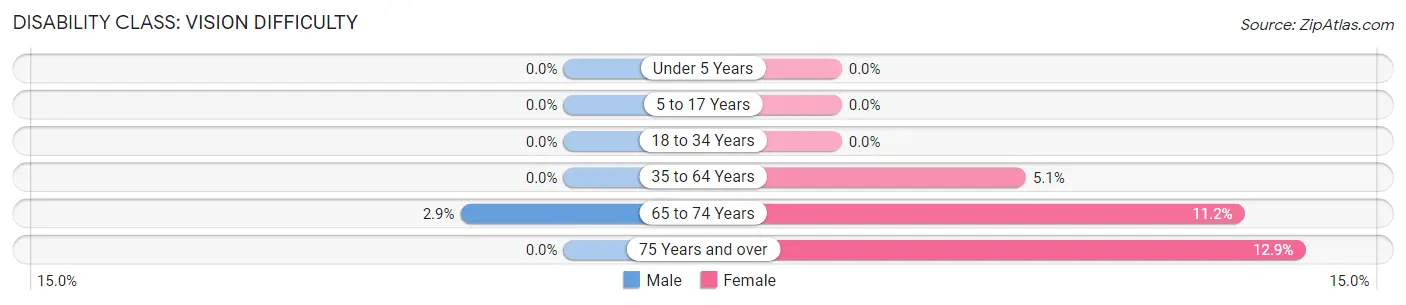
| Age Bracket | Male | Female |
| Under 5 Years | 0 (0.0%) | 0 (0.0%) |
| 5 to 17 Years | 0 (0.0%) | 0 (0.0%) |
| 18 to 34 Years | 0 (0.0%) | 0 (0.0%) |
| 35 to 64 Years | 0 (0.0%) | 135 (5.1%) |
| 65 to 74 Years | 28 (2.9%) | 84 (11.2%) |
| 75 Years and over | 0 (0.0%) | 48 (12.9%) |
Disability Class: Cognitive Difficulty
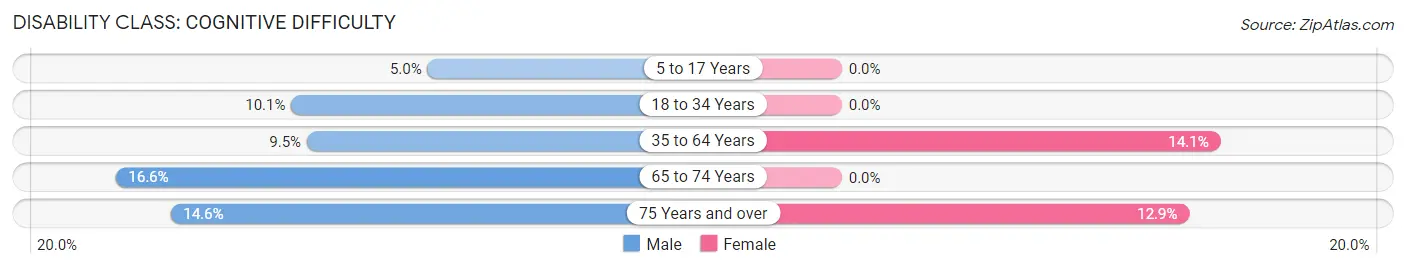
| Age Bracket | Male | Female |
| 5 to 17 Years | 54 (5.0%) | 0 (0.0%) |
| 18 to 34 Years | 84 (10.1%) | 0 (0.0%) |
| 35 to 64 Years | 245 (9.5%) | 370 (14.1%) |
| 65 to 74 Years | 162 (16.6%) | 0 (0.0%) |
| 75 Years and over | 48 (14.6%) | 48 (12.9%) |
Disability Class: Ambulatory Difficulty
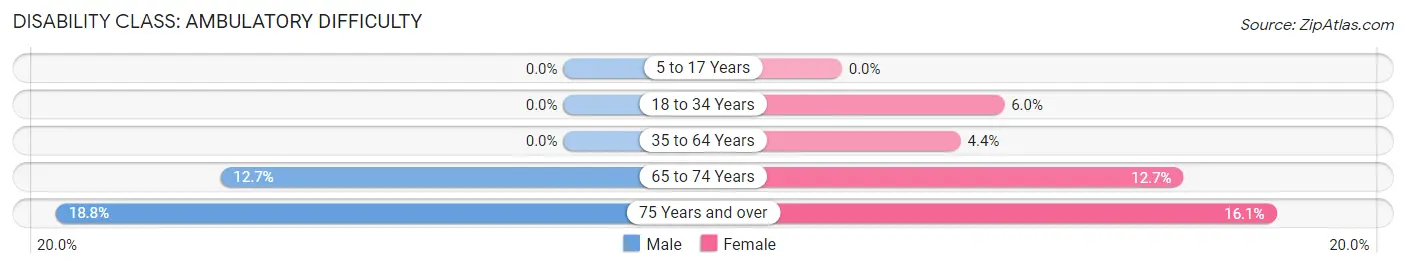
| Age Bracket | Male | Female |
| 5 to 17 Years | 0 (0.0%) | 0 (0.0%) |
| 18 to 34 Years | 0 (0.0%) | 82 (6.0%) |
| 35 to 64 Years | 0 (0.0%) | 116 (4.4%) |
| 65 to 74 Years | 124 (12.7%) | 95 (12.7%) |
| 75 Years and over | 62 (18.8%) | 60 (16.1%) |
Disability Class: Self-Care Difficulty
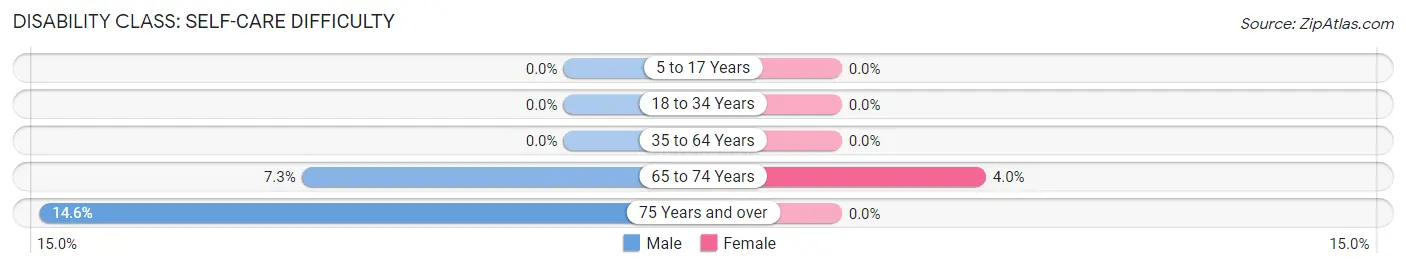
| Age Bracket | Male | Female |
| 5 to 17 Years | 0 (0.0%) | 0 (0.0%) |
| 18 to 34 Years | 0 (0.0%) | 0 (0.0%) |
| 35 to 64 Years | 0 (0.0%) | 0 (0.0%) |
| 65 to 74 Years | 71 (7.3%) | 30 (4.0%) |
| 75 Years and over | 48 (14.6%) | 0 (0.0%) |
Technology Access in Hawaiian Paradise Park
Computing Device Access in Hawaiian Paradise Park
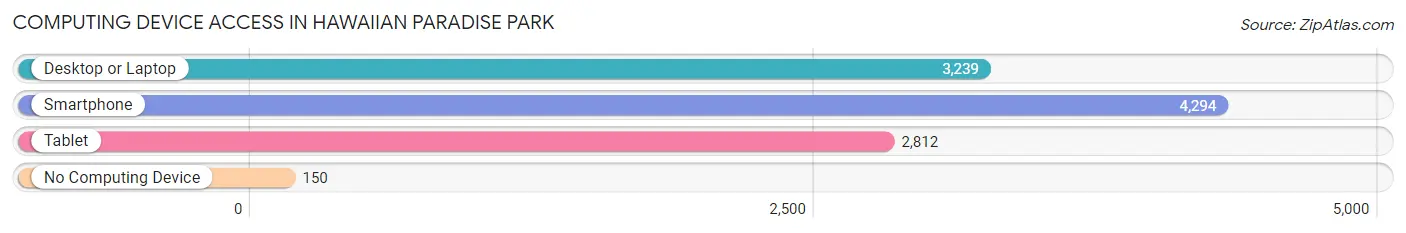
| Device Type | # Households | % Households |
| Desktop or Laptop | 3,239 | 71.8% |
| Smartphone | 4,294 | 95.1% |
| Tablet | 2,812 | 62.3% |
| No Computing Device | 150 | 3.3% |
| Total | 4,514 | 100.0% |
Internet Access in Hawaiian Paradise Park
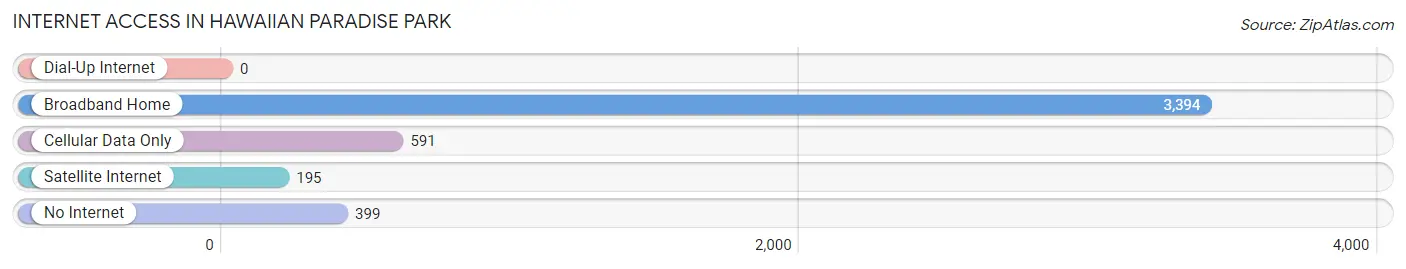
| Internet Type | # Households | % Households |
| Dial-Up Internet | 0 | 0.0% |
| Broadband Home | 3,394 | 75.2% |
| Cellular Data Only | 591 | 13.1% |
| Satellite Internet | 195 | 4.3% |
| No Internet | 399 | 8.8% |
| Total | 4,514 | 100.0% |
Hawaiian Paradise Park Summary
Hawaiian Paradise Park is an unincorporated community located in the Puna District of Hawaii County, Hawaii. It is located on the eastern side of the Big Island, about 10 miles south of Hilo. The community is situated on the slopes of Mauna Loa and is surrounded by lush tropical rainforest.
History
Hawaiian Paradise Park was established in the late 1950s by the Hawaiian Paradise Park Corporation. The corporation was formed by a group of investors who wanted to create a residential community in the area. The first homes were built in 1959 and the community has grown steadily since then.
The community was originally intended to be a retirement community, but it has since become a popular destination for families and vacationers. The area is known for its beautiful beaches, lush rainforest, and abundant wildlife.
Geography
Hawaiian Paradise Park is located on the eastern side of the Big Island, about 10 miles south of Hilo. The community is situated on the slopes of Mauna Loa and is surrounded by lush tropical rainforest. The area is known for its beautiful beaches, lush rainforest, and abundant wildlife.
The climate in Hawaiian Paradise Park is tropical and humid. The average temperature is around 80 degrees Fahrenheit (27 degrees Celsius). The average rainfall is around 80 inches (203 cm) per year.
Economy
The economy of Hawaiian Paradise Park is largely based on tourism. The area is known for its beautiful beaches, lush rainforest, and abundant wildlife. The community is also home to several small businesses, including restaurants, shops, and art galleries.
The community is also home to several small farms, which produce a variety of fruits and vegetables. These farms are popular with tourists, who come to purchase fresh produce.
Demographics
As of the 2010 census, the population of Hawaiian Paradise Park was 8,845. The racial makeup of the community was 79.3% White, 0.7% African American, 0.3% Native American, 0.7% Asian, 0.1% Pacific Islander, and 18.8% from other races.
The median household income in Hawaiian Paradise Park was $50,945 in 2010. The per capita income was $25,945. The median age was 44.7 years.
Conclusion
Hawaiian Paradise Park is a beautiful and vibrant community located on the eastern side of the Big Island. The area is known for its beautiful beaches, lush rainforest, and abundant wildlife. The economy of the community is largely based on tourism, and the area is home to several small businesses and farms. The population of Hawaiian Paradise Park is diverse, with a median age of 44.7 years and a median household income of $50,945.
Common Questions
What is the Total Population of Hawaiian Paradise Park?
Total Population of Hawaiian Paradise Park is 13,041.
What is the Total Male Population of Hawaiian Paradise Park?
Total Male Population of Hawaiian Paradise Park is 6,160.
What is the Total Female Population of Hawaiian Paradise Park?
Total Female Population of Hawaiian Paradise Park is 6,881.
What is the Ratio of Males per 100 Females in Hawaiian Paradise Park?
There are 89.52 Males per 100 Females in Hawaiian Paradise Park.
What is the Ratio of Females per 100 Males in Hawaiian Paradise Park?
There are 111.70 Females per 100 Males in Hawaiian Paradise Park.
What is the Median Population Age in Hawaiian Paradise Park?
Median Population Age in Hawaiian Paradise Park is 40.0 Years.
What is the Average Family Size in Hawaiian Paradise Park
Average Family Size in Hawaiian Paradise Park is 3.3 People.
What is the Average Household Size in Hawaiian Paradise Park
Average Household Size in Hawaiian Paradise Park is 2.9 People.
What is Per Capita Income in Hawaiian Paradise Park?
Per Capita income in Hawaiian Paradise Park is $32,420.
What is the Median Family Income in Hawaiian Paradise Park?
Median Family Income in Hawaiian Paradise Park is $85,093.
What is the Median Household income in Hawaiian Paradise Park?
Median Household Income in Hawaiian Paradise Park is $81,236.
What is Income or Wage Gap in Hawaiian Paradise Park?
Income or Wage Gap in Hawaiian Paradise Park is 20.6%.
Women in Hawaiian Paradise Park earn 79.4 cents for every dollar earned by a man.
What is Inequality or Gini Index in Hawaiian Paradise Park?
Inequality or Gini Index in Hawaiian Paradise Park is 0.42.
How Large is the Labor Force in Hawaiian Paradise Park?
There are 6,459 People in the Labor Forcein in Hawaiian Paradise Park.
What is the Percentage of People in the Labor Force in Hawaiian Paradise Park?
63.5% of People are in the Labor Force in Hawaiian Paradise Park.
What is the Unemployment Rate in Hawaiian Paradise Park?
Unemployment Rate in Hawaiian Paradise Park is 1.7%.