Haleiwa, HI
Haleiwa Map
Haleiwa Overview
4,708
TOTAL POPULATION
2,278
MALE POPULATION
2,430
FEMALE POPULATION
93.74
MALES / 100 FEMALES
106.67
FEMALES / 100 MALES
43.8
MEDIAN AGE
3.8
AVG FAMILY SIZE
3.1
AVG HOUSEHOLD SIZE
$41,206
PER CAPITA INCOME
$115,134
AVG FAMILY INCOME
$92,173
AVG HOUSEHOLD INCOME
0.5%
WAGE / INCOME GAP [ % ]
99.5¢/ $1
WAGE / INCOME GAP [ $ ]
0.42
INEQUALITY / GINI INDEX
2,523
LABOR FORCE [ PEOPLE ]
64.7%
PERCENT IN LABOR FORCE
4.3%
UNEMPLOYMENT RATE
Haleiwa Zip Codes
Haleiwa Area Codes
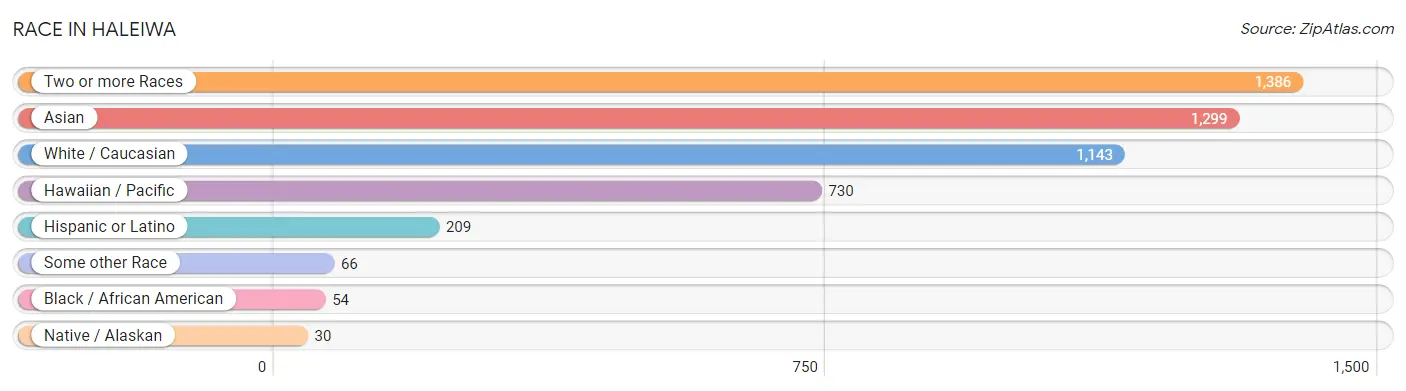
Race in Haleiwa
The most populous races in Haleiwa are Two or more Races (1,386 | 29.4%), Asian (1,299 | 27.6%), and White / Caucasian (1,143 | 24.3%).
| Race | # Population | % Population |
| Asian | 1,299 | 27.6% |
| Black / African American | 54 | 1.1% |
| Hawaiian / Pacific | 730 | 15.5% |
| Hispanic or Latino | 209 | 4.4% |
| Native / Alaskan | 30 | 0.6% |
| White / Caucasian | 1,143 | 24.3% |
| Two or more Races | 1,386 | 29.4% |
| Some other Race | 66 | 1.4% |
| Total | 4,708 | 100.0% |
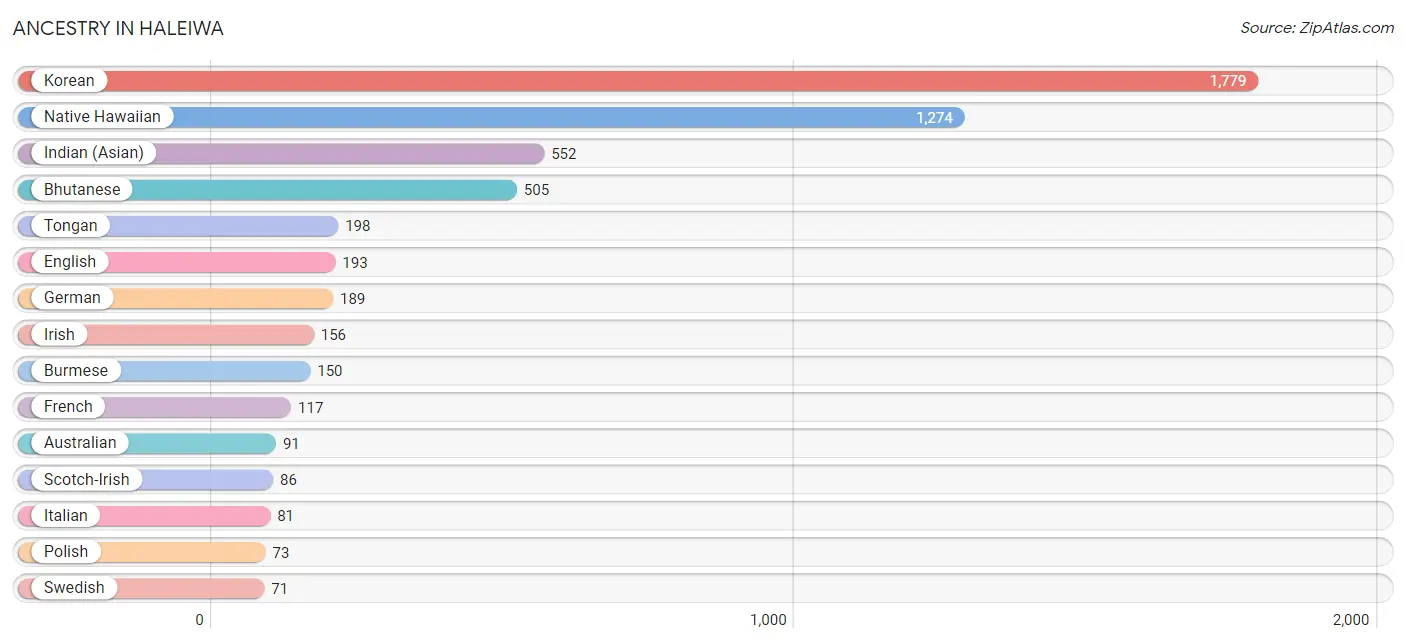
Ancestry in Haleiwa
The most populous ancestries reported in Haleiwa are Korean (1,779 | 37.8%), Native Hawaiian (1,274 | 27.1%), Indian (Asian) (552 | 11.7%), Bhutanese (505 | 10.7%), and Tongan (198 | 4.2%), together accounting for 91.5% of all Haleiwa residents.
| Ancestry | # Population | % Population |
| American | 26 | 0.5% |
| Arab | 15 | 0.3% |
| Australian | 91 | 1.9% |
| Bhutanese | 505 | 10.7% |
| Brazilian | 31 | 0.7% |
| British | 45 | 1.0% |
| Burmese | 150 | 3.2% |
| Canadian | 19 | 0.4% |
| Central American | 49 | 1.0% |
| Central American Indian | 30 | 0.6% |
| Chilean | 37 | 0.8% |
| Costa Rican | 19 | 0.4% |
| Czechoslovakian | 14 | 0.3% |
| Danish | 40 | 0.9% |
| Dutch | 25 | 0.5% |
| Eastern European | 47 | 1.0% |
| English | 193 | 4.1% |
| European | 20 | 0.4% |
| Finnish | 31 | 0.7% |
| French | 117 | 2.5% |
| German | 189 | 4.0% |
| Greek | 8 | 0.2% |
| Guamanian / Chamorro | 49 | 1.0% |
| Indian (Asian) | 552 | 11.7% |
| Irish | 156 | 3.3% |
| Italian | 81 | 1.7% |
| Jamaican | 30 | 0.6% |
| Korean | 1,779 | 37.8% |
| Malaysian | 41 | 0.9% |
| Mexican | 45 | 1.0% |
| Native Hawaiian | 1,274 | 27.1% |
| Northern European | 34 | 0.7% |
| Norwegian | 46 | 1.0% |
| Pakistani | 24 | 0.5% |
| Polish | 73 | 1.5% |
| Portuguese | 48 | 1.0% |
| Puerto Rican | 16 | 0.3% |
| Romanian | 24 | 0.5% |
| Salvadoran | 30 | 0.6% |
| Samoan | 49 | 1.0% |
| Scotch-Irish | 86 | 1.8% |
| Scottish | 49 | 1.0% |
| South American | 37 | 0.8% |
| Spaniard | 15 | 0.3% |
| Spanish | 47 | 1.0% |
| Sri Lankan | 6 | 0.1% |
| Swedish | 71 | 1.5% |
| Swiss | 9 | 0.2% |
| Tongan | 198 | 4.2% |
| Ukrainian | 44 | 0.9% |
| Welsh | 58 | 1.2% | View All 51 Rows |
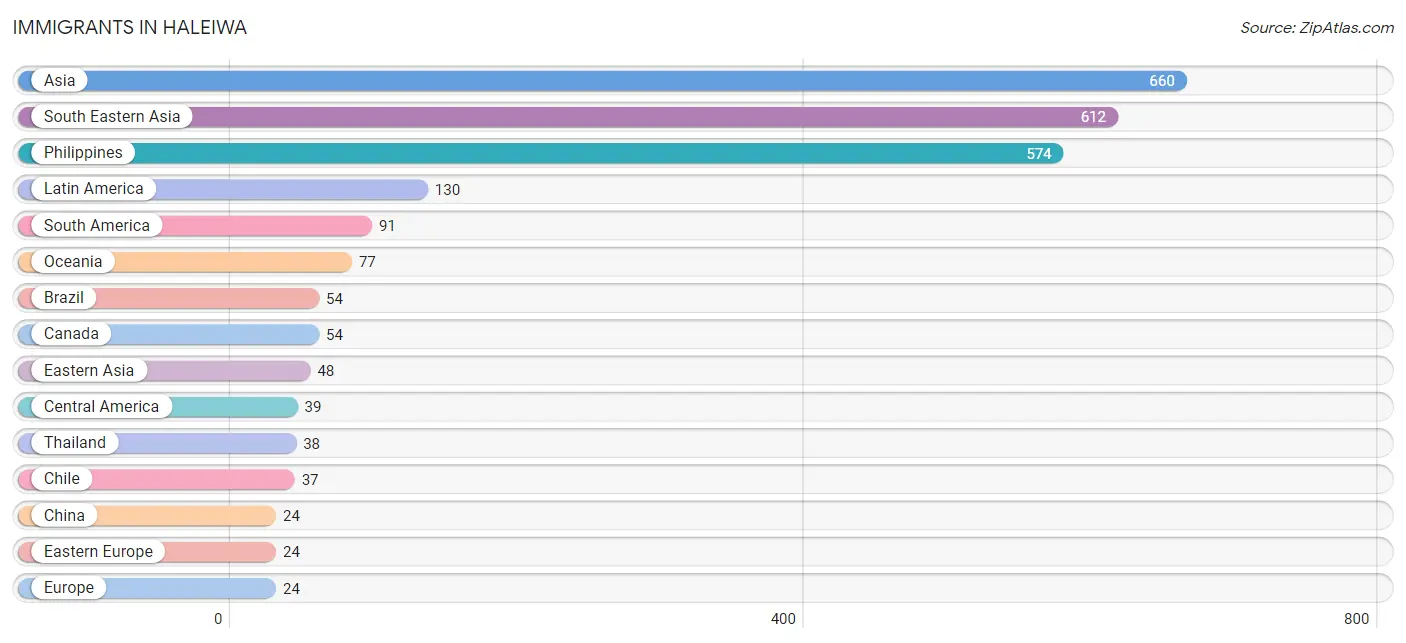
Immigrants in Haleiwa
The most numerous immigrant groups reported in Haleiwa came from Asia (660 | 14.0%), South Eastern Asia (612 | 13.0%), Philippines (574 | 12.2%), Latin America (130 | 2.8%), and South America (91 | 1.9%), together accounting for 43.9% of all Haleiwa residents.
| Immigration Origin | # Population | % Population |
| Africa | 18 | 0.4% |
| Asia | 660 | 14.0% |
| Australia | 15 | 0.3% |
| Brazil | 54 | 1.1% |
| Canada | 54 | 1.1% |
| Central America | 39 | 0.8% |
| Chile | 37 | 0.8% |
| China | 24 | 0.5% |
| Costa Rica | 19 | 0.4% |
| Eastern Asia | 48 | 1.0% |
| Eastern Europe | 24 | 0.5% |
| El Salvador | 20 | 0.4% |
| Europe | 24 | 0.5% |
| Hong Kong | 24 | 0.5% |
| Japan | 18 | 0.4% |
| Korea | 6 | 0.1% |
| Latin America | 130 | 2.8% |
| Oceania | 77 | 1.6% |
| Philippines | 574 | 12.2% |
| Romania | 24 | 0.5% |
| South Africa | 18 | 0.4% |
| South America | 91 | 1.9% |
| South Eastern Asia | 612 | 13.0% |
| Thailand | 38 | 0.8% | View All 24 Rows |
Sex and Age in Haleiwa
Sex and Age in Haleiwa
The most populous age groups in Haleiwa are 35 to 39 Years (285 | 12.5%) for men and 65 to 69 Years (224 | 9.2%) for women.
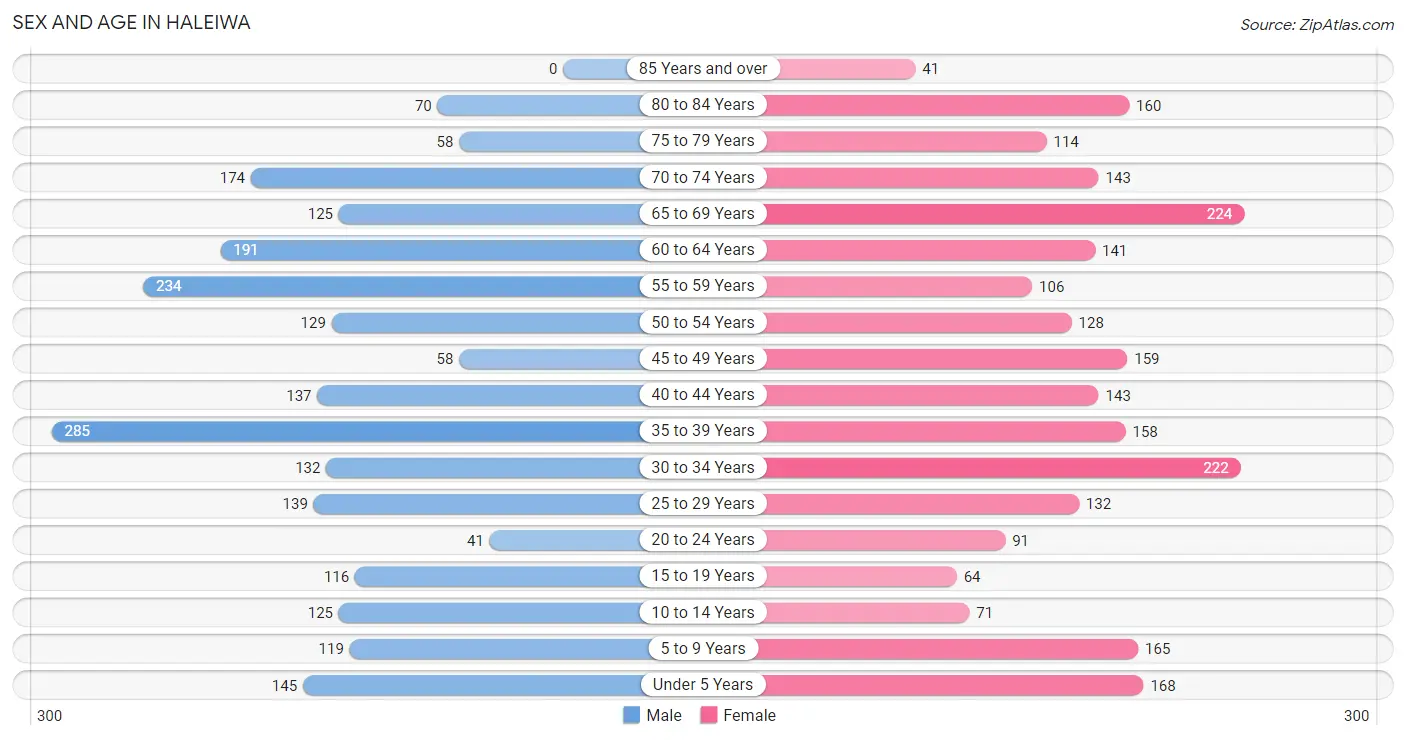
| Age Bracket | Male | Female |
| Under 5 Years | 145 (6.4%) | 168 (6.9%) |
| 5 to 9 Years | 119 (5.2%) | 165 (6.8%) |
| 10 to 14 Years | 125 (5.5%) | 71 (2.9%) |
| 15 to 19 Years | 116 (5.1%) | 64 (2.6%) |
| 20 to 24 Years | 41 (1.8%) | 91 (3.7%) |
| 25 to 29 Years | 139 (6.1%) | 132 (5.4%) |
| 30 to 34 Years | 132 (5.8%) | 222 (9.1%) |
| 35 to 39 Years | 285 (12.5%) | 158 (6.5%) |
| 40 to 44 Years | 137 (6.0%) | 143 (5.9%) |
| 45 to 49 Years | 58 (2.5%) | 159 (6.5%) |
| 50 to 54 Years | 129 (5.7%) | 128 (5.3%) |
| 55 to 59 Years | 234 (10.3%) | 106 (4.4%) |
| 60 to 64 Years | 191 (8.4%) | 141 (5.8%) |
| 65 to 69 Years | 125 (5.5%) | 224 (9.2%) |
| 70 to 74 Years | 174 (7.6%) | 143 (5.9%) |
| 75 to 79 Years | 58 (2.5%) | 114 (4.7%) |
| 80 to 84 Years | 70 (3.1%) | 160 (6.6%) |
| 85 Years and over | 0 (0.0%) | 41 (1.7%) |
| Total | 2,278 (100.0%) | 2,430 (100.0%) |
Families and Households in Haleiwa
Median Family Size in Haleiwa
The median family size in Haleiwa is 3.80 persons per family, with married-couple families (642 | 66.7%) accounting for the largest median family size of 4.18 persons per family. On the other hand, single female/mother families (232 | 24.1%) represent the smallest median family size with 2.89 persons per family.
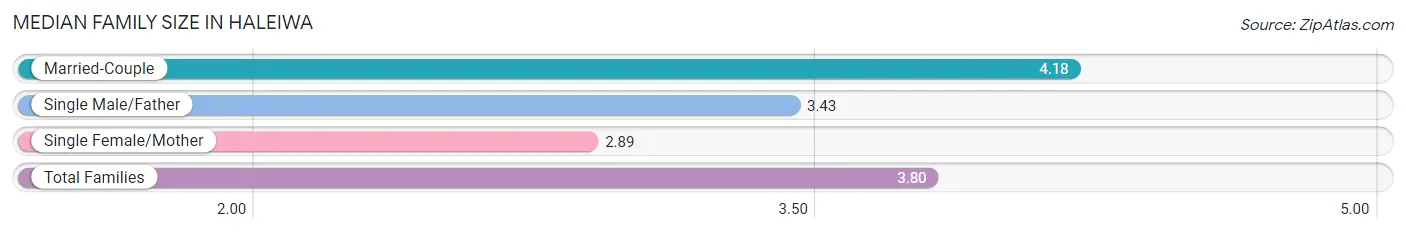
| Family Type | # Families | Family Size |
| Married-Couple | 642 (66.7%) | 4.18 |
| Single Male/Father | 89 (9.2%) | 3.43 |
| Single Female/Mother | 232 (24.1%) | 2.89 |
| Total Families | 963 (100.0%) | 3.80 |
Median Household Size in Haleiwa
The median household size in Haleiwa is 3.14 persons per household, with married-couple households (642 | 42.9%) accounting for the largest median household size of 4.31 persons per household. non-family households (534 | 35.7%) represent the smallest median household size with 1.59 persons per household.
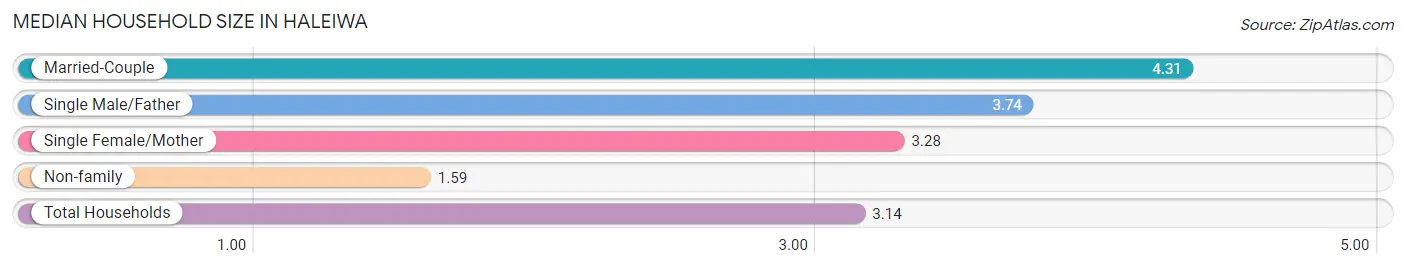
| Household Type | # Households | Household Size |
| Married-Couple | 642 (42.9%) | 4.31 |
| Single Male/Father | 89 (5.9%) | 3.74 |
| Single Female/Mother | 232 (15.5%) | 3.28 |
| Non-family | 534 (35.7%) | 1.59 |
| Total Households | 1,497 (100.0%) | 3.14 |
Household Size by Marriage Status in Haleiwa
Out of a total of 1,497 households in Haleiwa, 963 (64.3%) are family households, while 534 (35.7%) are nonfamily households. The most numerous type of family households are 2-person households, comprising 324, and the most common type of nonfamily households are 1-person households, comprising 375.
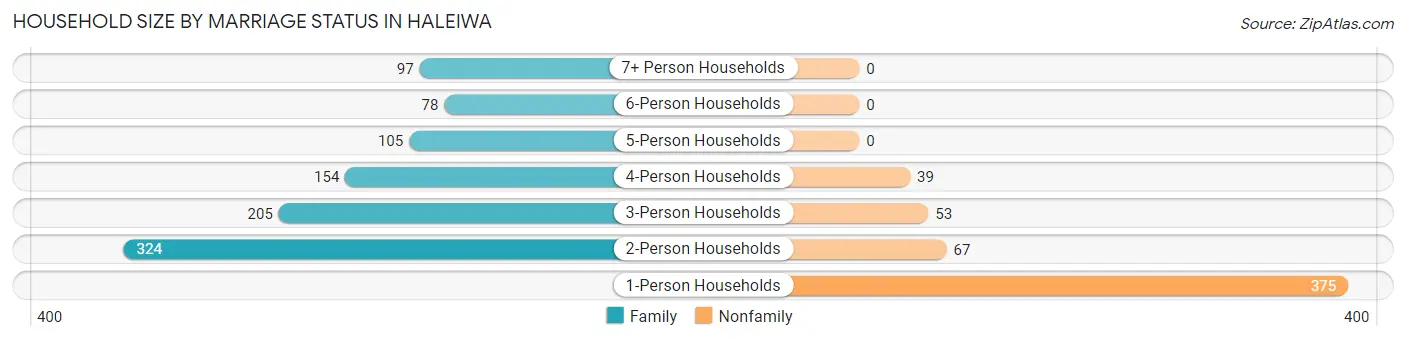
| Household Size | Family Households | Nonfamily Households |
| 1-Person Households | - | 375 (25.1%) |
| 2-Person Households | 324 (21.6%) | 67 (4.5%) |
| 3-Person Households | 205 (13.7%) | 53 (3.5%) |
| 4-Person Households | 154 (10.3%) | 39 (2.6%) |
| 5-Person Households | 105 (7.0%) | 0 (0.0%) |
| 6-Person Households | 78 (5.2%) | 0 (0.0%) |
| 7+ Person Households | 97 (6.5%) | 0 (0.0%) |
| Total | 963 (64.3%) | 534 (35.7%) |
Female Fertility in Haleiwa
Fertility by Age in Haleiwa
Average fertility rate in Haleiwa is 60.0 births per 1,000 women. Women in the age bracket of 35 to 50 years have the highest fertility rate with 76.0 births per 1,000 women. Women in the age bracket of 35 to 50 years acount for 60.3% of all women with births.
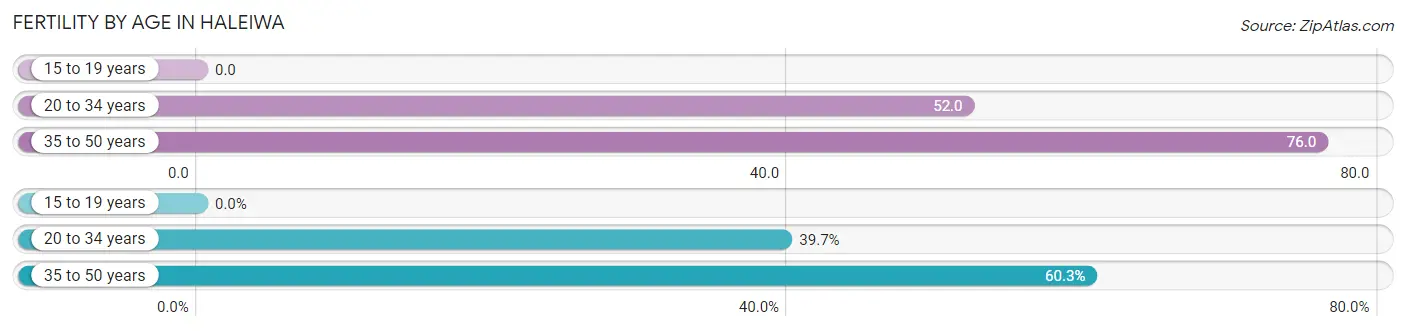
| Age Bracket | Women with Births | Births / 1,000 Women |
| 15 to 19 years | 0 (0.0%) | 0.0 |
| 20 to 34 years | 23 (39.7%) | 52.0 |
| 35 to 50 years | 35 (60.3%) | 76.0 |
| Total | 58 (100.0%) | 60.0 |
Fertility by Age by Marriage Status in Haleiwa
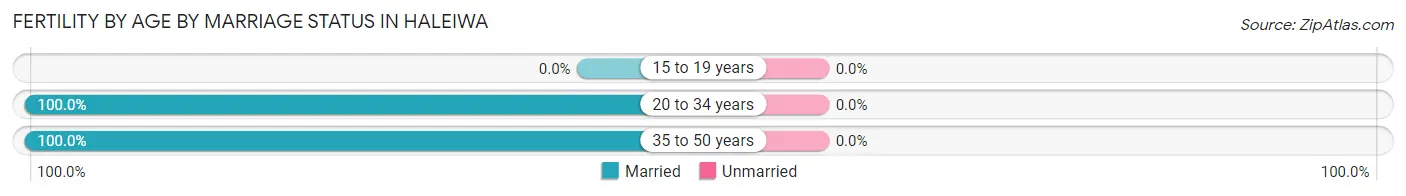
| Age Bracket | Married | Unmarried |
| 15 to 19 years | 0 (0.0%) | 0 (0.0%) |
| 20 to 34 years | 23 (100.0%) | 0 (0.0%) |
| 35 to 50 years | 35 (100.0%) | 0 (0.0%) |
| Total | 58 (100.0%) | 0 (0.0%) |
Fertility by Education in Haleiwa
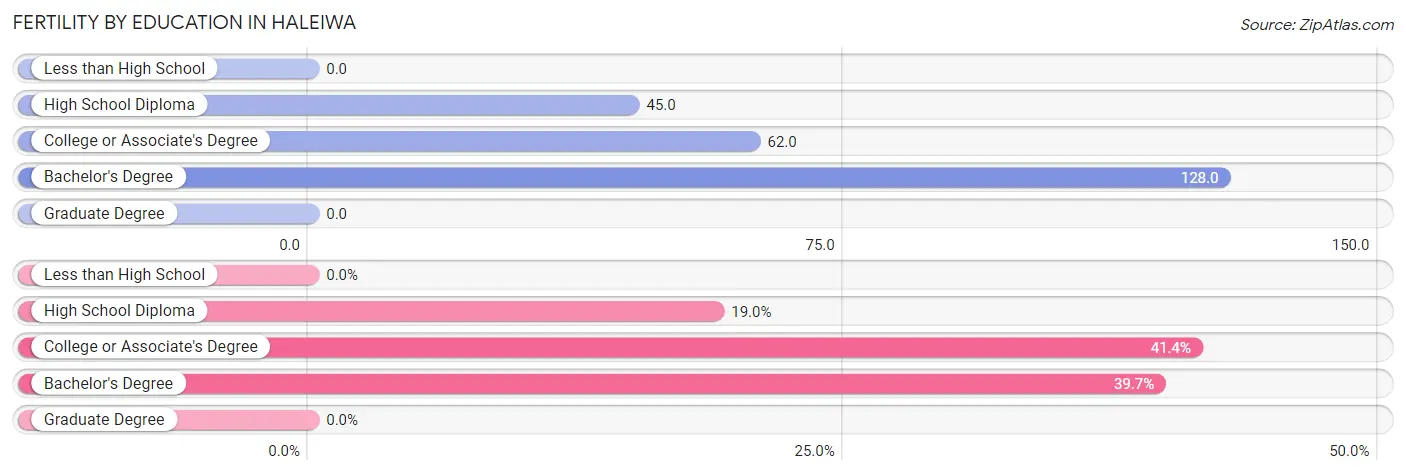
| Educational Attainment | Women with Births | Births / 1,000 Women |
| Less than High School | 0 (0.0%) | 0.0 |
| High School Diploma | 11 (19.0%) | 45.0 |
| College or Associate's Degree | 24 (41.4%) | 62.0 |
| Bachelor's Degree | 23 (39.7%) | 128.0 |
| Graduate Degree | 0 (0.0%) | 0.0 |
| Total | 58 (100.0%) | 60.0 |
Fertility by Education by Marriage Status in Haleiwa
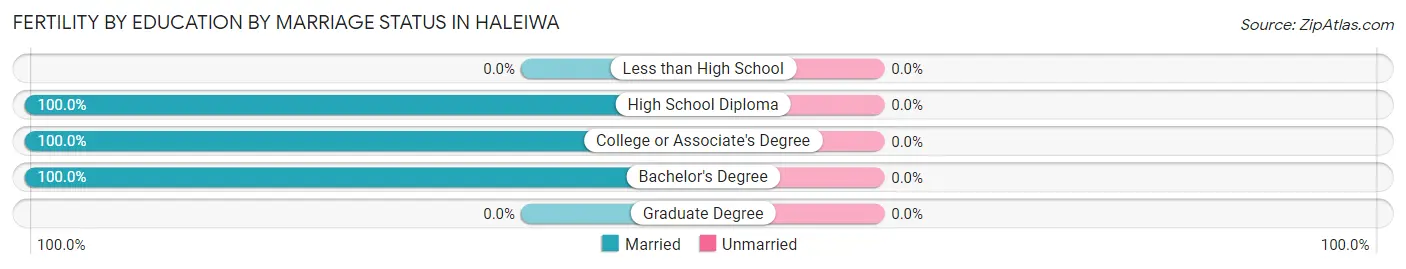
| Educational Attainment | Married | Unmarried |
| Less than High School | 0 (0.0%) | 0 (0.0%) |
| High School Diploma | 11 (100.0%) | 0 (0.0%) |
| College or Associate's Degree | 24 (100.0%) | 0 (0.0%) |
| Bachelor's Degree | 23 (100.0%) | 0 (0.0%) |
| Graduate Degree | 0 (0.0%) | 0 (0.0%) |
| Total | 58 (100.0%) | 0 (0.0%) |
Income in Haleiwa
Income Overview in Haleiwa
Per Capita Income in Haleiwa is $41,206, while median incomes of families and households are $115,134 and $92,173 respectively.
| Characteristic | Number | Measure |
| Per Capita Income | 4,708 | $41,206 |
| Median Family Income | 963 | $115,134 |
| Mean Family Income | 963 | $137,179 |
| Median Household Income | 1,497 | $92,173 |
| Mean Household Income | 1,497 | $123,903 |
| Income Deficit | 963 | $0 |
| Wage / Income Gap (%) | 4,708 | 0.48% |
| Wage / Income Gap ($) | 4,708 | 99.52¢ per $1 |
| Gini / Inequality Index | 4,708 | 0.42 |
Earnings by Sex in Haleiwa
Average Earnings in Haleiwa are $43,497, $43,652 for men and $43,444 for women, a difference of 0.5%.
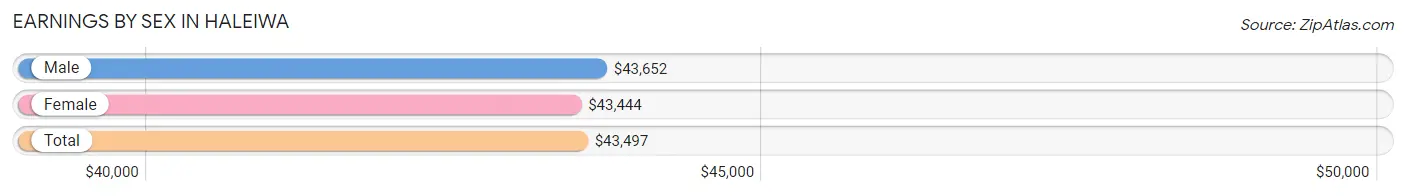
| Sex | Number | Average Earnings |
| Male | 1,397 (54.3%) | $43,652 |
| Female | 1,177 (45.7%) | $43,444 |
| Total | 2,574 (100.0%) | $43,497 |
Earnings by Sex by Income Bracket in Haleiwa
The most common earnings brackets in Haleiwa are $100,000+ for men (249 | 17.8%) and $40,000 to $44,999 for women (164 | 13.9%).
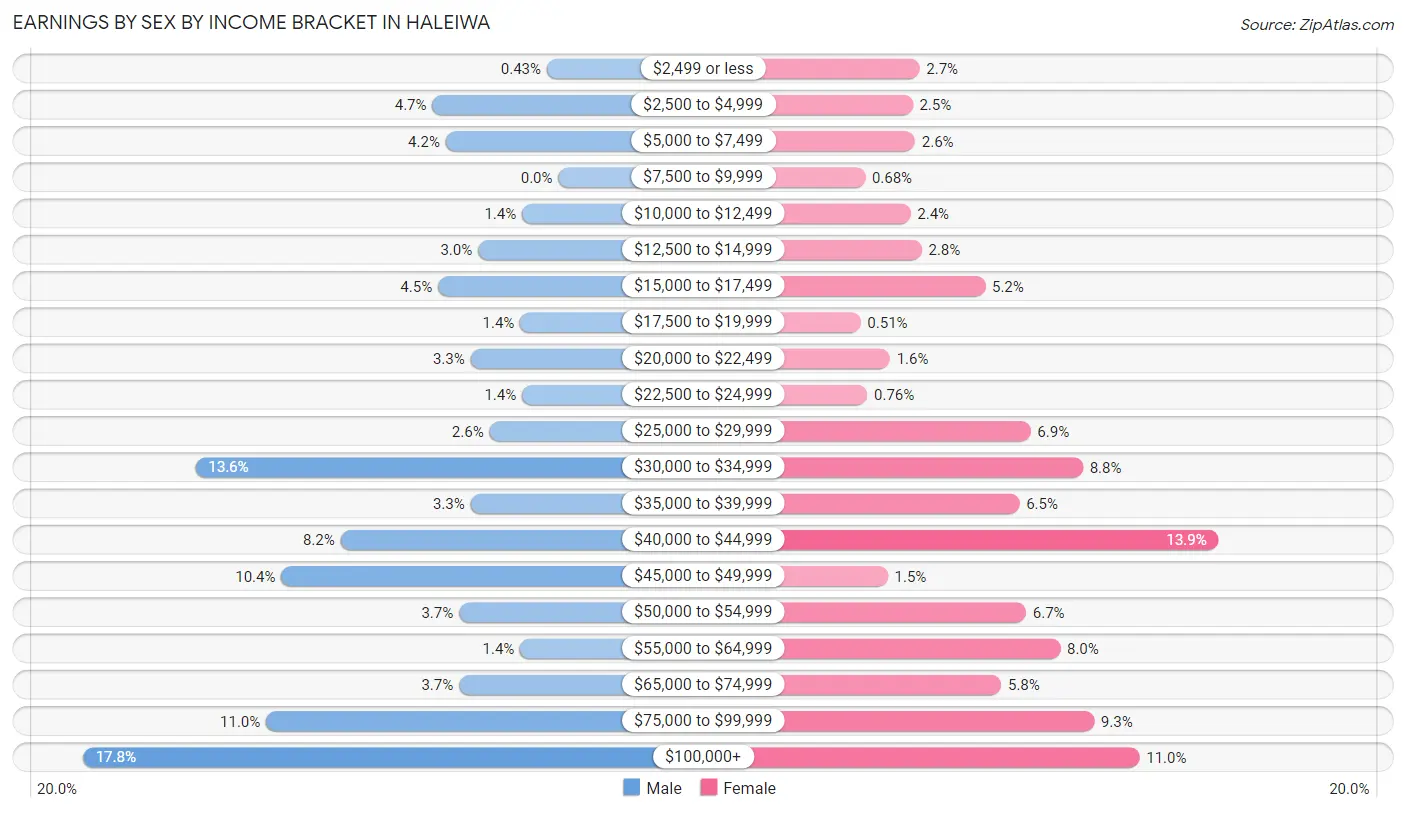
| Income | Male | Female |
| $2,499 or less | 6 (0.4%) | 32 (2.7%) |
| $2,500 to $4,999 | 66 (4.7%) | 29 (2.5%) |
| $5,000 to $7,499 | 59 (4.2%) | 30 (2.5%) |
| $7,500 to $9,999 | 0 (0.0%) | 8 (0.7%) |
| $10,000 to $12,499 | 19 (1.4%) | 28 (2.4%) |
| $12,500 to $14,999 | 42 (3.0%) | 33 (2.8%) |
| $15,000 to $17,499 | 63 (4.5%) | 61 (5.2%) |
| $17,500 to $19,999 | 20 (1.4%) | 6 (0.5%) |
| $20,000 to $22,499 | 46 (3.3%) | 19 (1.6%) |
| $22,500 to $24,999 | 19 (1.4%) | 9 (0.8%) |
| $25,000 to $29,999 | 36 (2.6%) | 81 (6.9%) |
| $30,000 to $34,999 | 190 (13.6%) | 104 (8.8%) |
| $35,000 to $39,999 | 46 (3.3%) | 76 (6.5%) |
| $40,000 to $44,999 | 114 (8.2%) | 164 (13.9%) |
| $45,000 to $49,999 | 145 (10.4%) | 18 (1.5%) |
| $50,000 to $54,999 | 52 (3.7%) | 79 (6.7%) |
| $55,000 to $64,999 | 20 (1.4%) | 94 (8.0%) |
| $65,000 to $74,999 | 52 (3.7%) | 68 (5.8%) |
| $75,000 to $99,999 | 153 (11.0%) | 109 (9.3%) |
| $100,000+ | 249 (17.8%) | 129 (11.0%) |
| Total | 1,397 (100.0%) | 1,177 (100.0%) |
Earnings by Sex by Educational Attainment in Haleiwa
Average earnings in Haleiwa are $45,191 for men and $43,844 for women, a difference of 3.0%. Men with an educational attainment of graduate degree enjoy the highest average annual earnings of $112,672, while those with high school diploma education earn the least with $31,725. Women with an educational attainment of graduate degree earn the most with the average annual earnings of $85,208, while those with college or associate's degree education have the smallest earnings of $42,528.
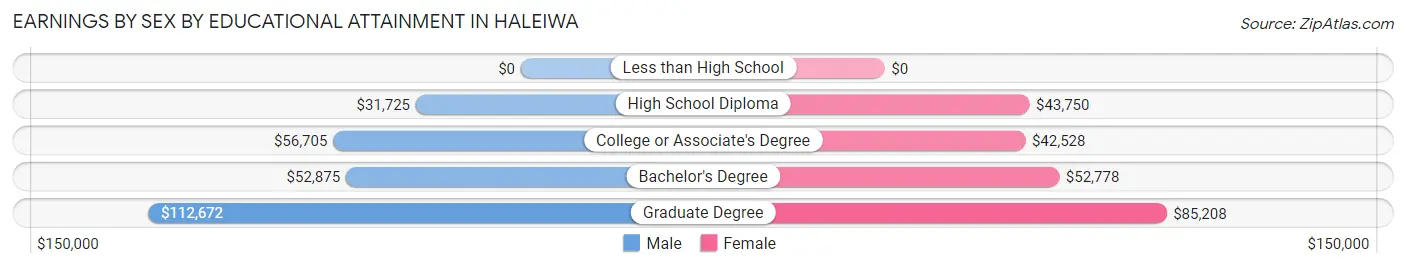
| Educational Attainment | Male Income | Female Income |
| Less than High School | - | - |
| High School Diploma | $31,725 | $43,750 |
| College or Associate's Degree | $56,705 | $42,528 |
| Bachelor's Degree | $52,875 | $52,778 |
| Graduate Degree | $112,672 | $85,208 |
| Total | $45,191 | $43,844 |
Family Income in Haleiwa
Family Income Brackets in Haleiwa
According to the Haleiwa family income data, there are 244 families falling into the $100,000 to $149,999 income range, which is the most common income bracket and makes up 25.3% of all families. Conversely, the $10,000 to $14,999 income bracket is the least frequent group with only 8 families (0.8%) belonging to this category.
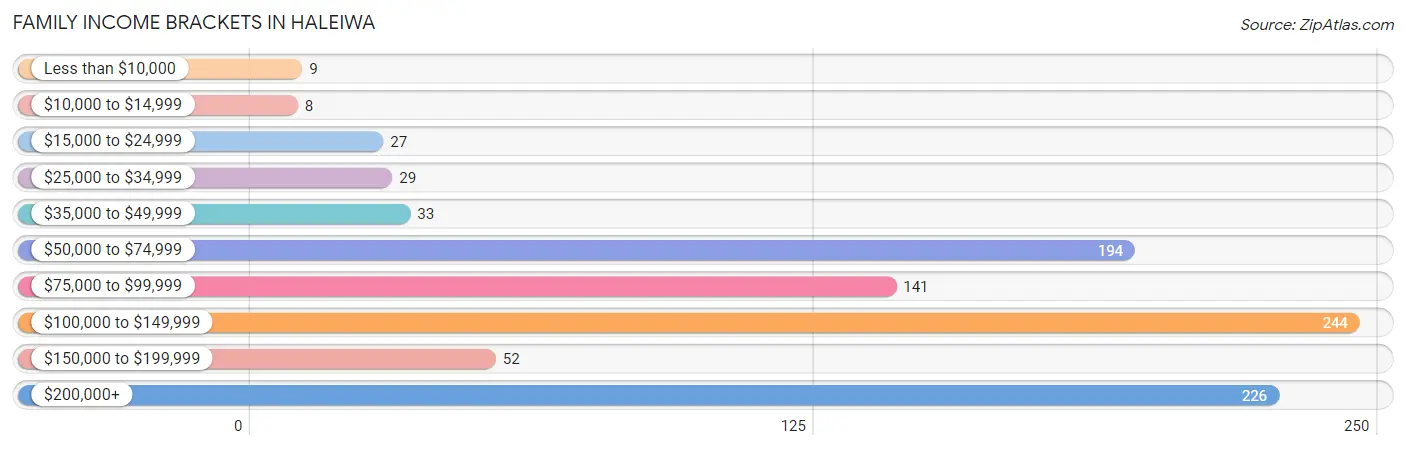
| Income Bracket | # Families | % Families |
| Less than $10,000 | 9 | 0.9% |
| $10,000 to $14,999 | 8 | 0.8% |
| $15,000 to $24,999 | 27 | 2.8% |
| $25,000 to $34,999 | 29 | 3.0% |
| $35,000 to $49,999 | 33 | 3.4% |
| $50,000 to $74,999 | 194 | 20.1% |
| $75,000 to $99,999 | 141 | 14.6% |
| $100,000 to $149,999 | 244 | 25.3% |
| $150,000 to $199,999 | 52 | 5.4% |
| $200,000+ | 226 | 23.5% |
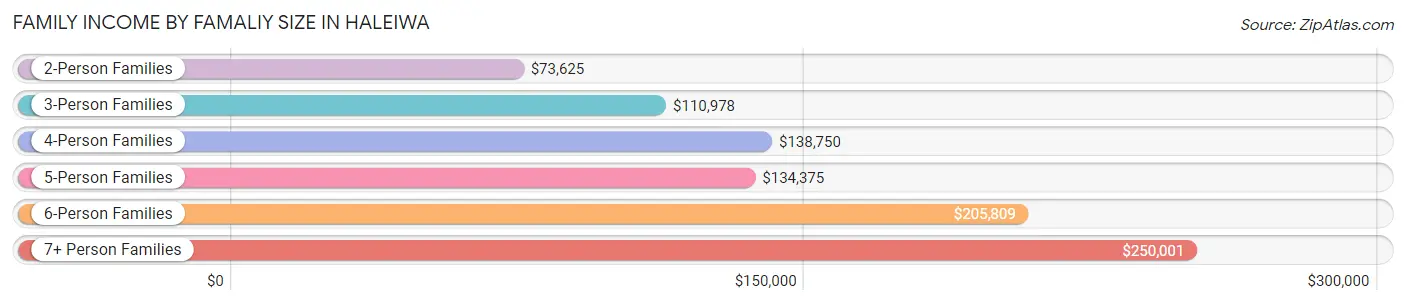
Family Income by Famaliy Size in Haleiwa
7+ person families (75 | 7.8%) account for the highest median family income in Haleiwa with $250,001 per family, while 3-person families (202 | 21.0%) have the highest median income of $36,993 per family member.
| Income Bracket | # Families | Median Income |
| 2-Person Families | 360 (37.4%) | $73,625 |
| 3-Person Families | 202 (21.0%) | $110,978 |
| 4-Person Families | 168 (17.4%) | $138,750 |
| 5-Person Families | 82 (8.5%) | $134,375 |
| 6-Person Families | 76 (7.9%) | $205,809 |
| 7+ Person Families | 75 (7.8%) | $250,001 |
| Total | 963 (100.0%) | $115,134 |
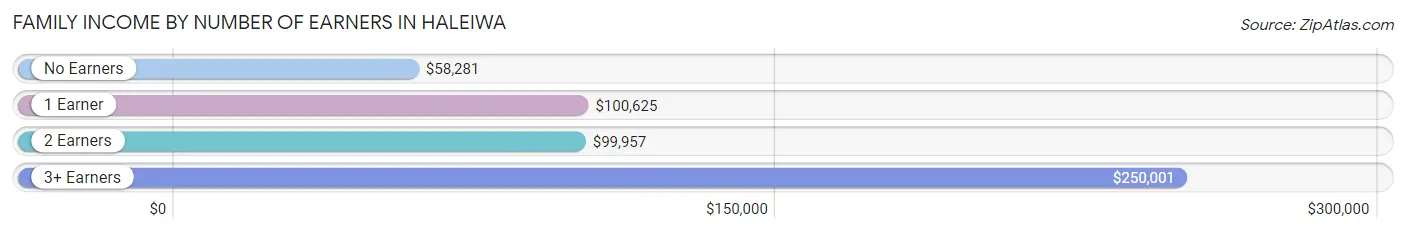
Family Income by Number of Earners in Haleiwa
The median family income in Haleiwa is $115,134, with families comprising 3+ earners (176) having the highest median family income of $250,001, while families with no earners (147) have the lowest median family income of $58,281, accounting for 18.3% and 15.3% of families, respectively.
| Number of Earners | # Families | Median Income |
| No Earners | 147 (15.3%) | $58,281 |
| 1 Earner | 187 (19.4%) | $100,625 |
| 2 Earners | 453 (47.0%) | $99,957 |
| 3+ Earners | 176 (18.3%) | $250,001 |
| Total | 963 (100.0%) | $115,134 |
Household Income in Haleiwa
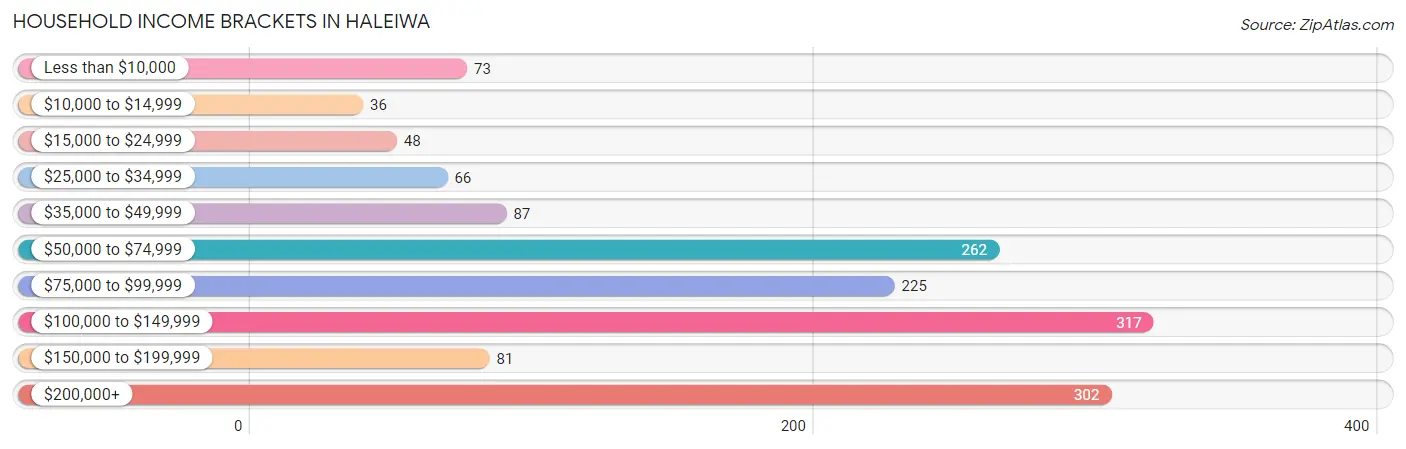
Household Income Brackets in Haleiwa
With 317 households falling in the category, the $100,000 to $149,999 income range is the most frequent in Haleiwa, accounting for 21.2% of all households. In contrast, only 36 households (2.4%) fall into the $10,000 to $14,999 income bracket, making it the least populous group.
| Income Bracket | # Households | % Households |
| Less than $10,000 | 73 | 4.9% |
| $10,000 to $14,999 | 36 | 2.4% |
| $15,000 to $24,999 | 48 | 3.2% |
| $25,000 to $34,999 | 66 | 4.4% |
| $35,000 to $49,999 | 87 | 5.8% |
| $50,000 to $74,999 | 262 | 17.5% |
| $75,000 to $99,999 | 225 | 15.0% |
| $100,000 to $149,999 | 317 | 21.2% |
| $150,000 to $199,999 | 81 | 5.4% |
| $200,000+ | 302 | 20.2% |
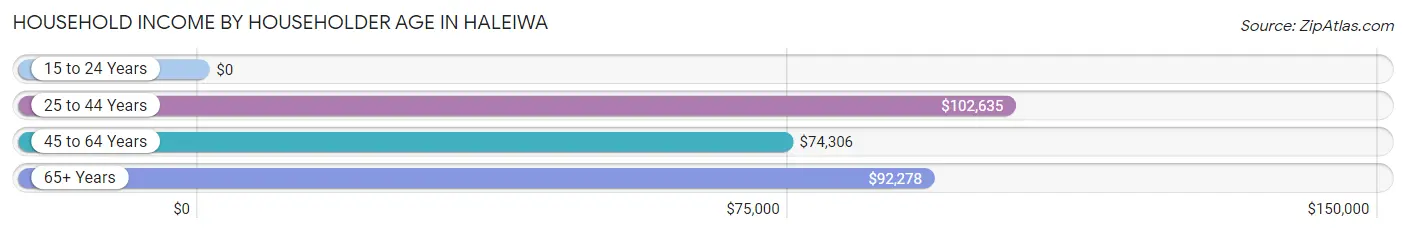
Household Income by Householder Age in Haleiwa
The median household income in Haleiwa is $92,173, with the highest median household income of $102,635 found in the 25 to 44 years age bracket for the primary householder. A total of 372 households (24.8%) fall into this category.
| Income Bracket | # Households | Median Income |
| 15 to 24 Years | 0 (0.0%) | $0 |
| 25 to 44 Years | 372 (24.8%) | $102,635 |
| 45 to 64 Years | 523 (34.9%) | $74,306 |
| 65+ Years | 602 (40.2%) | $92,278 |
| Total | 1,497 (100.0%) | $92,173 |
Poverty in Haleiwa
Income Below Poverty by Sex and Age in Haleiwa
With 4.0% poverty level for males and 7.6% for females among the residents of Haleiwa, under 5 year old males and 45 to 54 year old females are the most vulnerable to poverty, with 11 males (11.5%) and 62 females (21.6%) in their respective age groups living below the poverty level.
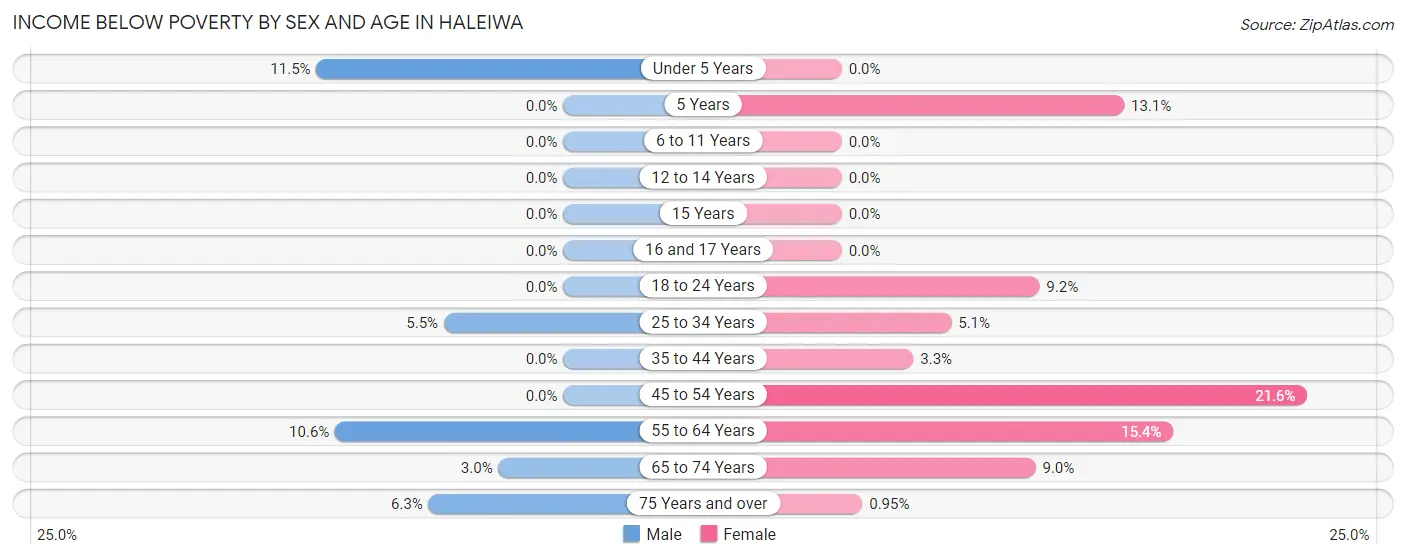
| Age Bracket | Male | Female |
| Under 5 Years | 11 (11.5%) | 0 (0.0%) |
| 5 Years | 0 (0.0%) | 11 (13.1%) |
| 6 to 11 Years | 0 (0.0%) | 0 (0.0%) |
| 12 to 14 Years | 0 (0.0%) | 0 (0.0%) |
| 15 Years | 0 (0.0%) | 0 (0.0%) |
| 16 and 17 Years | 0 (0.0%) | 0 (0.0%) |
| 18 to 24 Years | 0 (0.0%) | 10 (9.2%) |
| 25 to 34 Years | 15 (5.5%) | 18 (5.1%) |
| 35 to 44 Years | 0 (0.0%) | 10 (3.3%) |
| 45 to 54 Years | 0 (0.0%) | 62 (21.6%) |
| 55 to 64 Years | 45 (10.6%) | 38 (15.4%) |
| 65 to 74 Years | 9 (3.0%) | 33 (9.0%) |
| 75 Years and over | 8 (6.2%) | 3 (0.9%) |
| Total | 88 (4.0%) | 185 (7.6%) |
Income Above Poverty by Sex and Age in Haleiwa
According to the poverty statistics in Haleiwa, males aged 5 years and females aged under 5 years are the age groups that are most secure financially, with 100.0% of males and 100.0% of females in these age groups living above the poverty line.
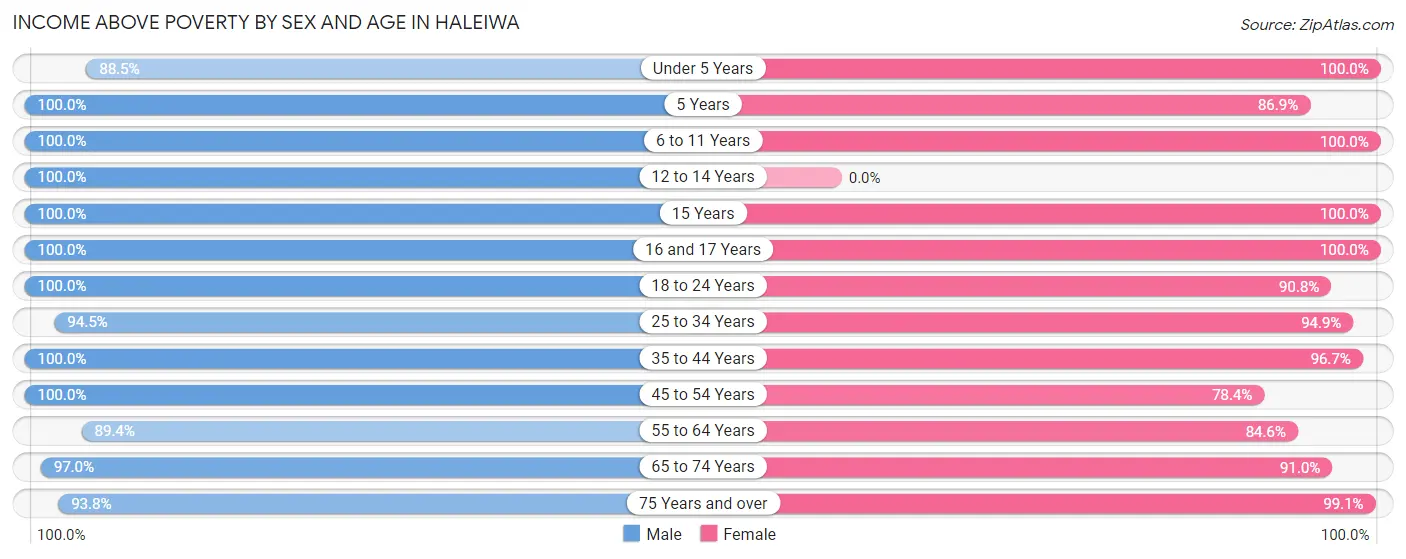
| Age Bracket | Male | Female |
| Under 5 Years | 85 (88.5%) | 168 (100.0%) |
| 5 Years | 10 (100.0%) | 73 (86.9%) |
| 6 to 11 Years | 137 (100.0%) | 152 (100.0%) |
| 12 to 14 Years | 97 (100.0%) | 0 (0.0%) |
| 15 Years | 8 (100.0%) | 7 (100.0%) |
| 16 and 17 Years | 54 (100.0%) | 39 (100.0%) |
| 18 to 24 Years | 95 (100.0%) | 99 (90.8%) |
| 25 to 34 Years | 256 (94.5%) | 336 (94.9%) |
| 35 to 44 Years | 422 (100.0%) | 291 (96.7%) |
| 45 to 54 Years | 187 (100.0%) | 225 (78.4%) |
| 55 to 64 Years | 380 (89.4%) | 209 (84.6%) |
| 65 to 74 Years | 290 (97.0%) | 334 (91.0%) |
| 75 Years and over | 120 (93.8%) | 312 (99.1%) |
| Total | 2,141 (96.1%) | 2,245 (92.4%) |
Income Below Poverty Among Married-Couple Families in Haleiwa
The poverty statistics for married-couple families in Haleiwa show that 2.6% or 17 of the total 642 families live below the poverty line. Families with no children have the highest poverty rate of 3.2%, comprising of 9 families. On the other hand, families with 3 or 4 children have the lowest poverty rate of 0.0%, which includes 0 families.
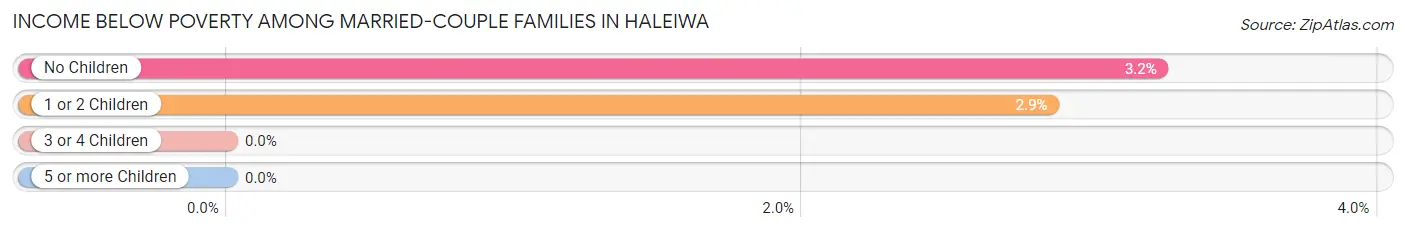
| Children | Above Poverty | Below Poverty |
| No Children | 269 (96.8%) | 9 (3.2%) |
| 1 or 2 Children | 272 (97.1%) | 8 (2.9%) |
| 3 or 4 Children | 84 (100.0%) | 0 (0.0%) |
| 5 or more Children | 0 (0.0%) | 0 (0.0%) |
| Total | 625 (97.4%) | 17 (2.6%) |
Income Below Poverty Among Single-Parent Households in Haleiwa
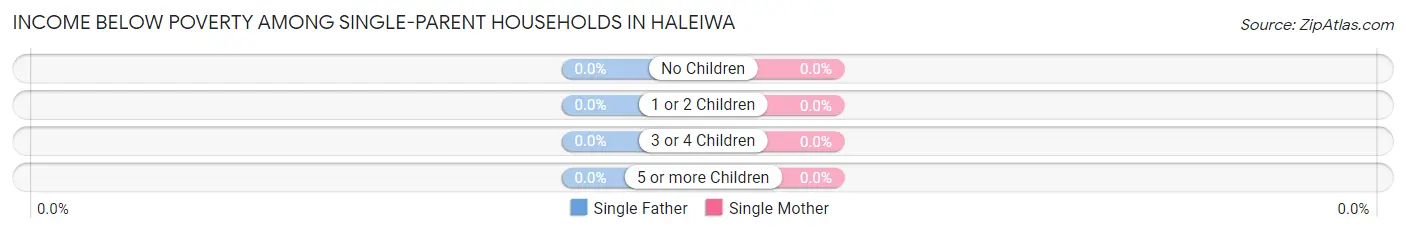
| Children | Single Father | Single Mother |
| No Children | 0 (0.0%) | 0 (0.0%) |
| 1 or 2 Children | 0 (0.0%) | 0 (0.0%) |
| 3 or 4 Children | 0 (0.0%) | 0 (0.0%) |
| 5 or more Children | 0 (0.0%) | 0 (0.0%) |
| Total | 0 (0.0%) | 0 (0.0%) |
Income Below Poverty Among Married-Couple vs Single-Parent Households in Haleiwa
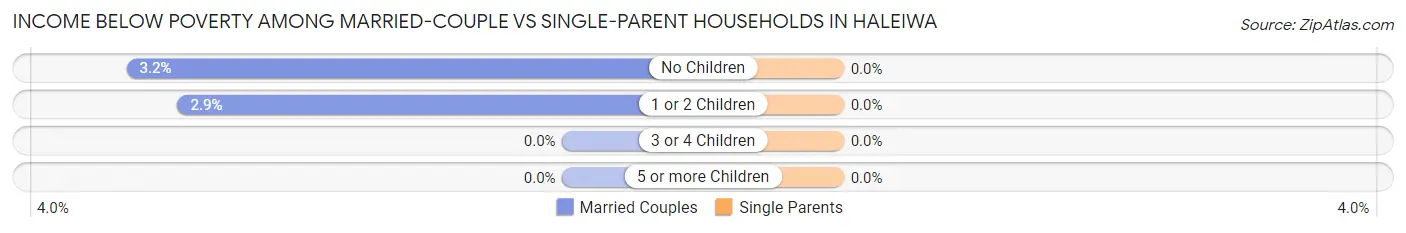
| Children | Married-Couple Families | Single-Parent Households |
| No Children | 9 (3.2%) | 0 (0.0%) |
| 1 or 2 Children | 8 (2.9%) | 0 (0.0%) |
| 3 or 4 Children | 0 (0.0%) | 0 (0.0%) |
| 5 or more Children | 0 (0.0%) | 0 (0.0%) |
| Total | 17 (2.6%) | 0 (0.0%) |
Employment Characteristics in Haleiwa
Employment by Class of Employer in Haleiwa
Among the 2,393 employed individuals in Haleiwa, private company employees (1,430 | 59.8%), self-employed (not incorporated) (266 | 11.1%), and not-for-profit organizations (205 | 8.6%) make up the most common classes of employment.
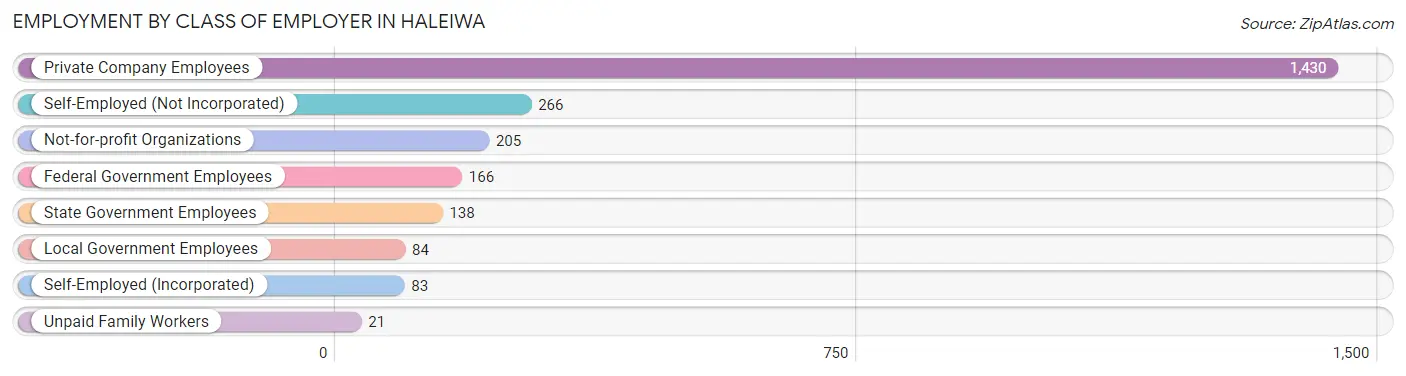
| Employer Class | # Employees | % Employees |
| Private Company Employees | 1,430 | 59.8% |
| Self-Employed (Incorporated) | 83 | 3.5% |
| Self-Employed (Not Incorporated) | 266 | 11.1% |
| Not-for-profit Organizations | 205 | 8.6% |
| Local Government Employees | 84 | 3.5% |
| State Government Employees | 138 | 5.8% |
| Federal Government Employees | 166 | 6.9% |
| Unpaid Family Workers | 21 | 0.9% |
| Total | 2,393 | 100.0% |
Employment Status by Age in Haleiwa
According to the labor force statistics for Haleiwa, out of the total population over 16 years of age (3,900), 64.7% or 2,523 individuals are in the labor force, with 4.3% or 108 of them unemployed. The age group with the highest labor force participation rate is 25 to 29 years, with 97.8% or 265 individuals in the labor force. Within the labor force, the 16 to 19 years age range has the highest percentage of unemployed individuals, with 47.9% or 23 of them being unemployed.
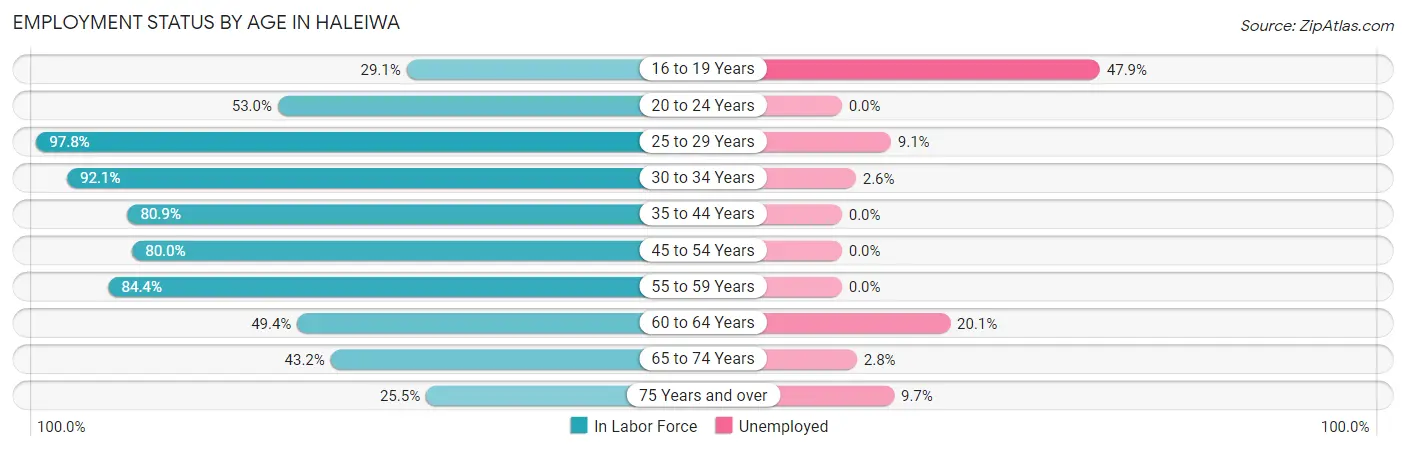
| Age Bracket | In Labor Force | Unemployed |
| 16 to 19 Years | 48 (29.1%) | 23 (47.9%) |
| 20 to 24 Years | 70 (53.0%) | 0 (0.0%) |
| 25 to 29 Years | 265 (97.8%) | 24 (9.1%) |
| 30 to 34 Years | 326 (92.1%) | 8 (2.6%) |
| 35 to 44 Years | 585 (80.9%) | 0 (0.0%) |
| 45 to 54 Years | 379 (80.0%) | 0 (0.0%) |
| 55 to 59 Years | 287 (84.4%) | 0 (0.0%) |
| 60 to 64 Years | 164 (49.4%) | 33 (20.1%) |
| 65 to 74 Years | 288 (43.2%) | 8 (2.8%) |
| 75 Years and over | 113 (25.5%) | 11 (9.7%) |
| Total | 2,523 (64.7%) | 108 (4.3%) |
Employment Status by Educational Attainment in Haleiwa
According to labor force statistics for Haleiwa, 80.4% of individuals (2,005) out of the total population between 25 and 64 years of age (2,494) are in the labor force, with 3.3% or 66 of them being unemployed. The group with the highest labor force participation rate are those with the educational attainment of bachelor's degree or higher, with 89.6% or 448 individuals in the labor force. Within the labor force, individuals with high school diploma education have the highest percentage of unemployment, with 7.7% or 56 of them being unemployed.
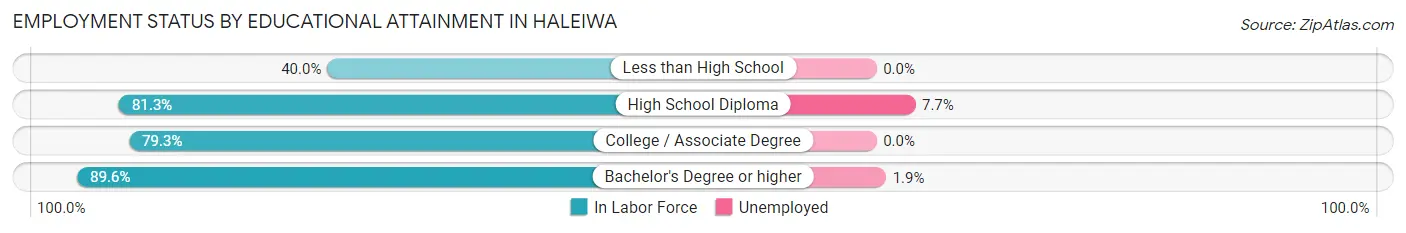
| Educational Attainment | In Labor Force | Unemployed |
| Less than High School | 42 (40.0%) | 0 (0.0%) |
| High School Diploma | 727 (81.3%) | 69 (7.7%) |
| College / Associate Degree | 789 (79.3%) | 0 (0.0%) |
| Bachelor's Degree or higher | 448 (89.6%) | 10 (1.9%) |
| Total | 2,005 (80.4%) | 82 (3.3%) |
Employment Occupations by Sex in Haleiwa
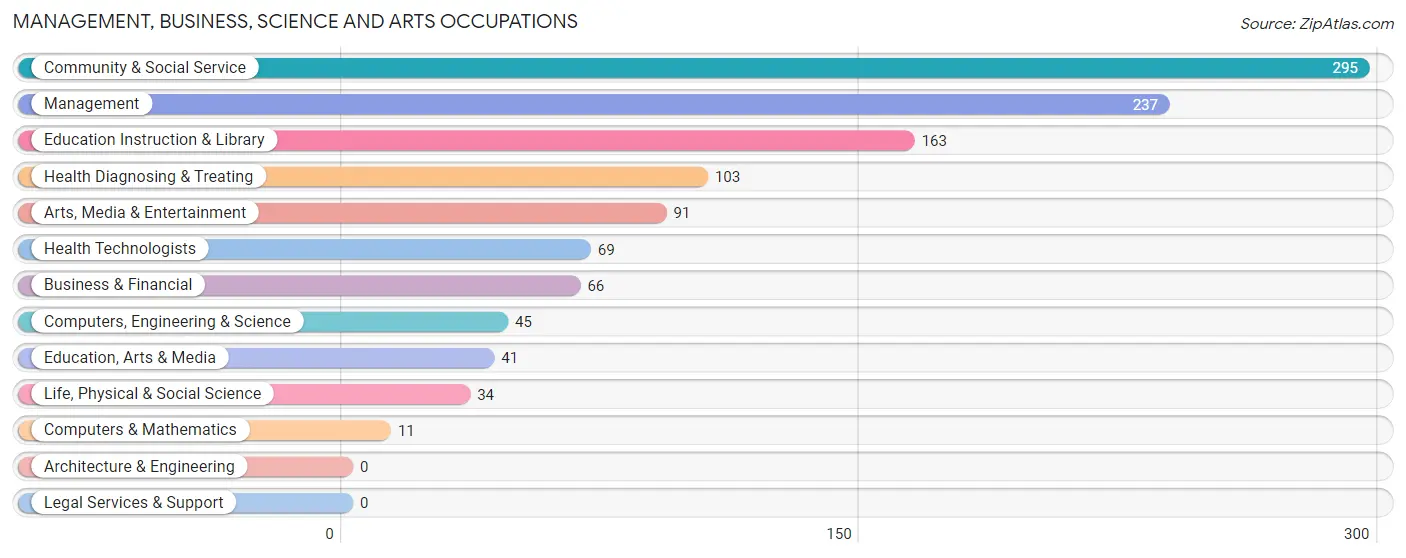
Management, Business, Science and Arts Occupations
The most common Management, Business, Science and Arts occupations in Haleiwa are Community & Social Service (295 | 12.4%), Management (237 | 10.0%), Education Instruction & Library (163 | 6.9%), Health Diagnosing & Treating (103 | 4.3%), and Arts, Media & Entertainment (91 | 3.8%).
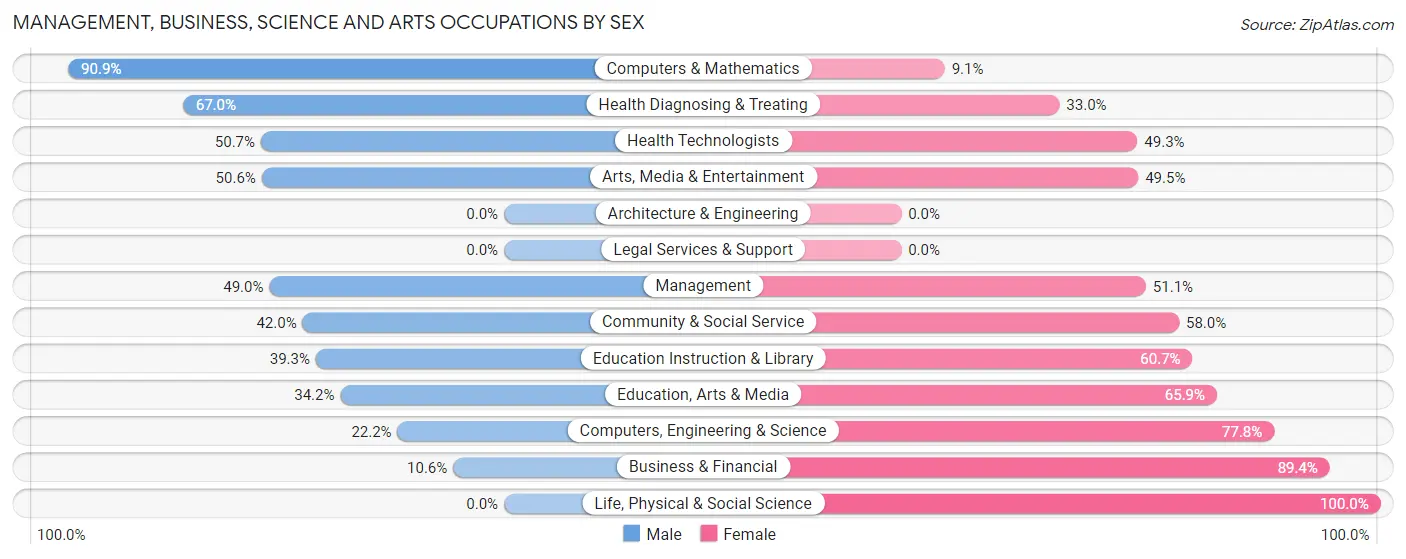
Management, Business, Science and Arts Occupations by Sex
Within the Management, Business, Science and Arts occupations in Haleiwa, the most male-oriented occupations are Computers & Mathematics (90.9%), Health Diagnosing & Treating (67.0%), and Health Technologists (50.7%), while the most female-oriented occupations are Life, Physical & Social Science (100.0%), Business & Financial (89.4%), and Computers, Engineering & Science (77.8%).
| Occupation | Male | Female |
| Management | 116 (48.9%) | 121 (51.0%) |
| Business & Financial | 7 (10.6%) | 59 (89.4%) |
| Computers, Engineering & Science | 10 (22.2%) | 35 (77.8%) |
| Computers & Mathematics | 10 (90.9%) | 1 (9.1%) |
| Architecture & Engineering | 0 (0.0%) | 0 (0.0%) |
| Life, Physical & Social Science | 0 (0.0%) | 34 (100.0%) |
| Community & Social Service | 124 (42.0%) | 171 (58.0%) |
| Education, Arts & Media | 14 (34.2%) | 27 (65.8%) |
| Legal Services & Support | 0 (0.0%) | 0 (0.0%) |
| Education Instruction & Library | 64 (39.3%) | 99 (60.7%) |
| Arts, Media & Entertainment | 46 (50.5%) | 45 (49.4%) |
| Health Diagnosing & Treating | 69 (67.0%) | 34 (33.0%) |
| Health Technologists | 35 (50.7%) | 34 (49.3%) |
| Total (Category) | 326 (43.7%) | 420 (56.3%) |
| Total (Overall) | 1,306 (54.9%) | 1,072 (45.1%) |
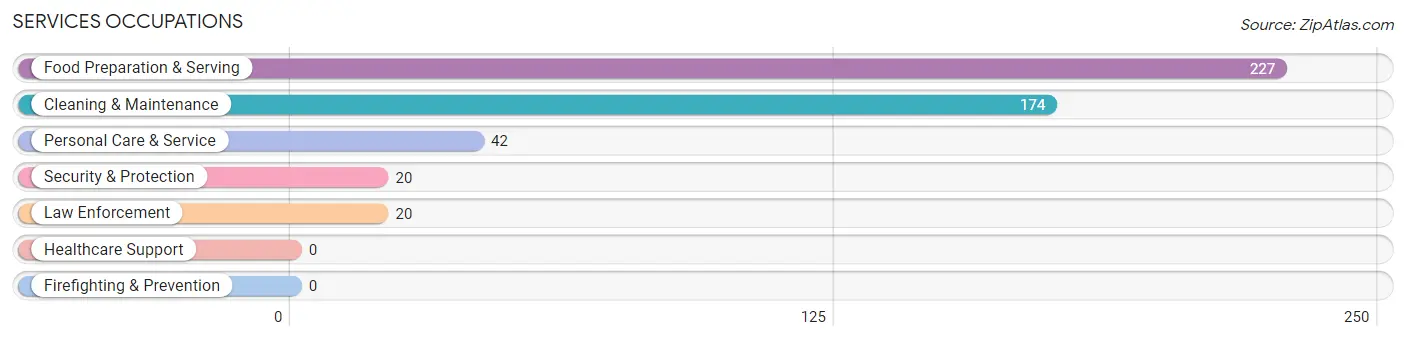
Services Occupations
The most common Services occupations in Haleiwa are Food Preparation & Serving (227 | 9.6%), Cleaning & Maintenance (174 | 7.3%), Personal Care & Service (42 | 1.8%), Security & Protection (20 | 0.8%), and Law Enforcement (20 | 0.8%).
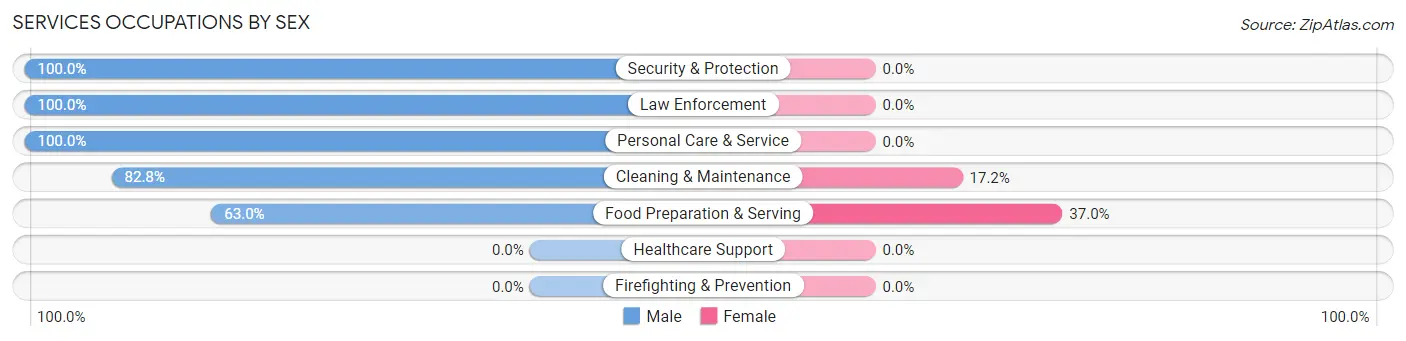
Services Occupations by Sex
Within the Services occupations in Haleiwa, the most male-oriented occupations are Security & Protection (100.0%), Law Enforcement (100.0%), and Personal Care & Service (100.0%), while the most female-oriented occupations are Food Preparation & Serving (37.0%), and Cleaning & Maintenance (17.2%).
| Occupation | Male | Female |
| Healthcare Support | 0 (0.0%) | 0 (0.0%) |
| Security & Protection | 20 (100.0%) | 0 (0.0%) |
| Firefighting & Prevention | 0 (0.0%) | 0 (0.0%) |
| Law Enforcement | 20 (100.0%) | 0 (0.0%) |
| Food Preparation & Serving | 143 (63.0%) | 84 (37.0%) |
| Cleaning & Maintenance | 144 (82.8%) | 30 (17.2%) |
| Personal Care & Service | 42 (100.0%) | 0 (0.0%) |
| Total (Category) | 349 (75.4%) | 114 (24.6%) |
| Total (Overall) | 1,306 (54.9%) | 1,072 (45.1%) |
Sales and Office Occupations
The most common Sales and Office occupations in Haleiwa are Sales & Related (349 | 14.7%), and Office & Administration (346 | 14.5%).
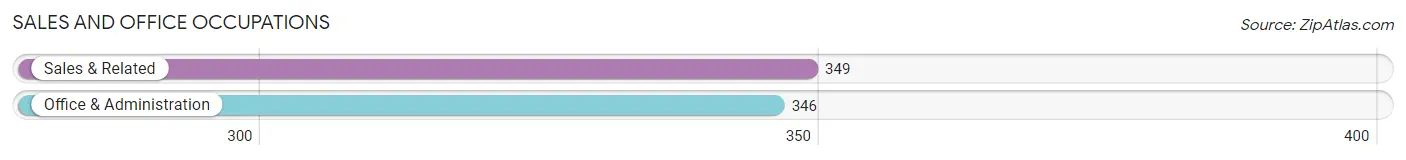
Sales and Office Occupations by Sex
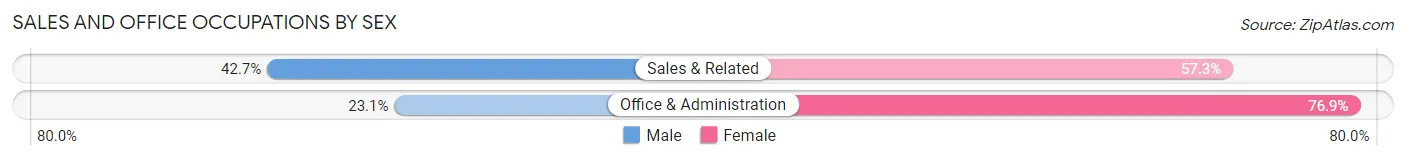
| Occupation | Male | Female |
| Sales & Related | 149 (42.7%) | 200 (57.3%) |
| Office & Administration | 80 (23.1%) | 266 (76.9%) |
| Total (Category) | 229 (33.0%) | 466 (67.0%) |
| Total (Overall) | 1,306 (54.9%) | 1,072 (45.1%) |
Natural Resources, Construction and Maintenance Occupations
The most common Natural Resources, Construction and Maintenance occupations in Haleiwa are Construction & Extraction (205 | 8.6%), Installation, Maintenance & Repair (105 | 4.4%), and Farming, Fishing & Forestry (33 | 1.4%).
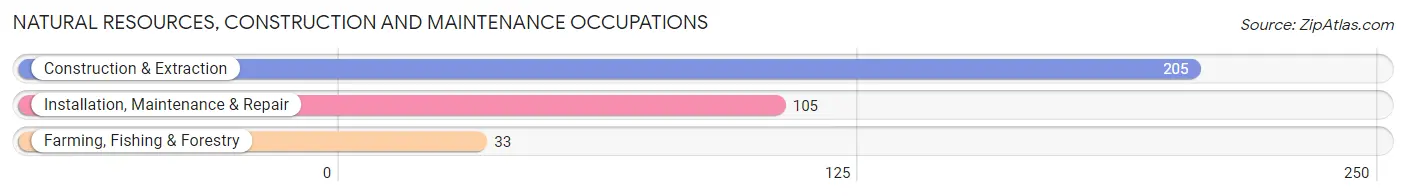
Natural Resources, Construction and Maintenance Occupations by Sex
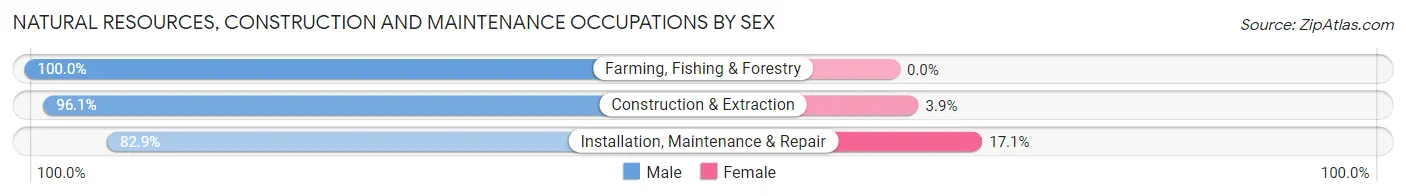
| Occupation | Male | Female |
| Farming, Fishing & Forestry | 33 (100.0%) | 0 (0.0%) |
| Construction & Extraction | 197 (96.1%) | 8 (3.9%) |
| Installation, Maintenance & Repair | 87 (82.9%) | 18 (17.1%) |
| Total (Category) | 317 (92.4%) | 26 (7.6%) |
| Total (Overall) | 1,306 (54.9%) | 1,072 (45.1%) |
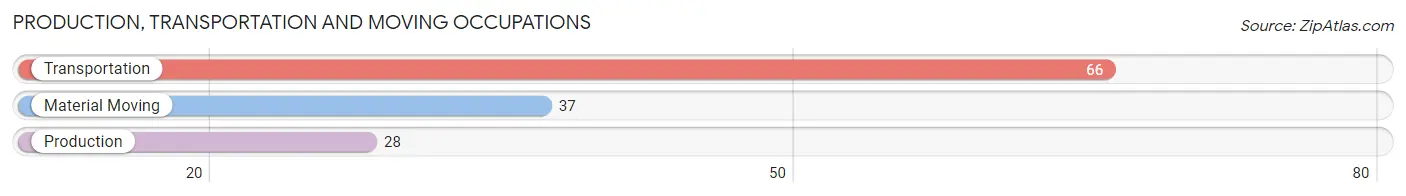
Production, Transportation and Moving Occupations
The most common Production, Transportation and Moving occupations in Haleiwa are Transportation (66 | 2.8%), Material Moving (37 | 1.6%), and Production (28 | 1.2%).
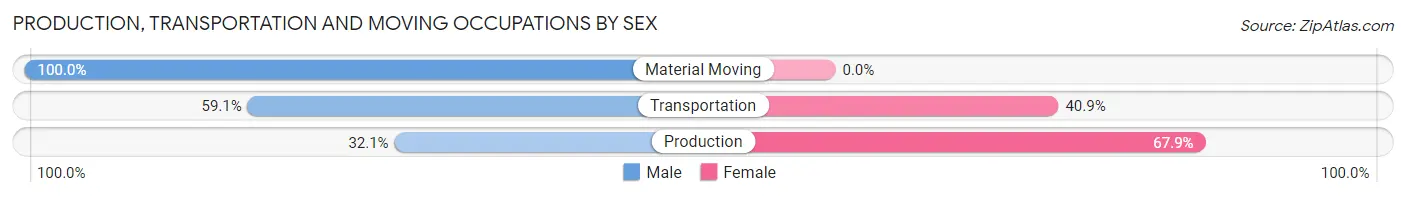
Production, Transportation and Moving Occupations by Sex
| Occupation | Male | Female |
| Production | 9 (32.1%) | 19 (67.9%) |
| Transportation | 39 (59.1%) | 27 (40.9%) |
| Material Moving | 37 (100.0%) | 0 (0.0%) |
| Total (Category) | 85 (64.9%) | 46 (35.1%) |
| Total (Overall) | 1,306 (54.9%) | 1,072 (45.1%) |
Employment Industries by Sex in Haleiwa
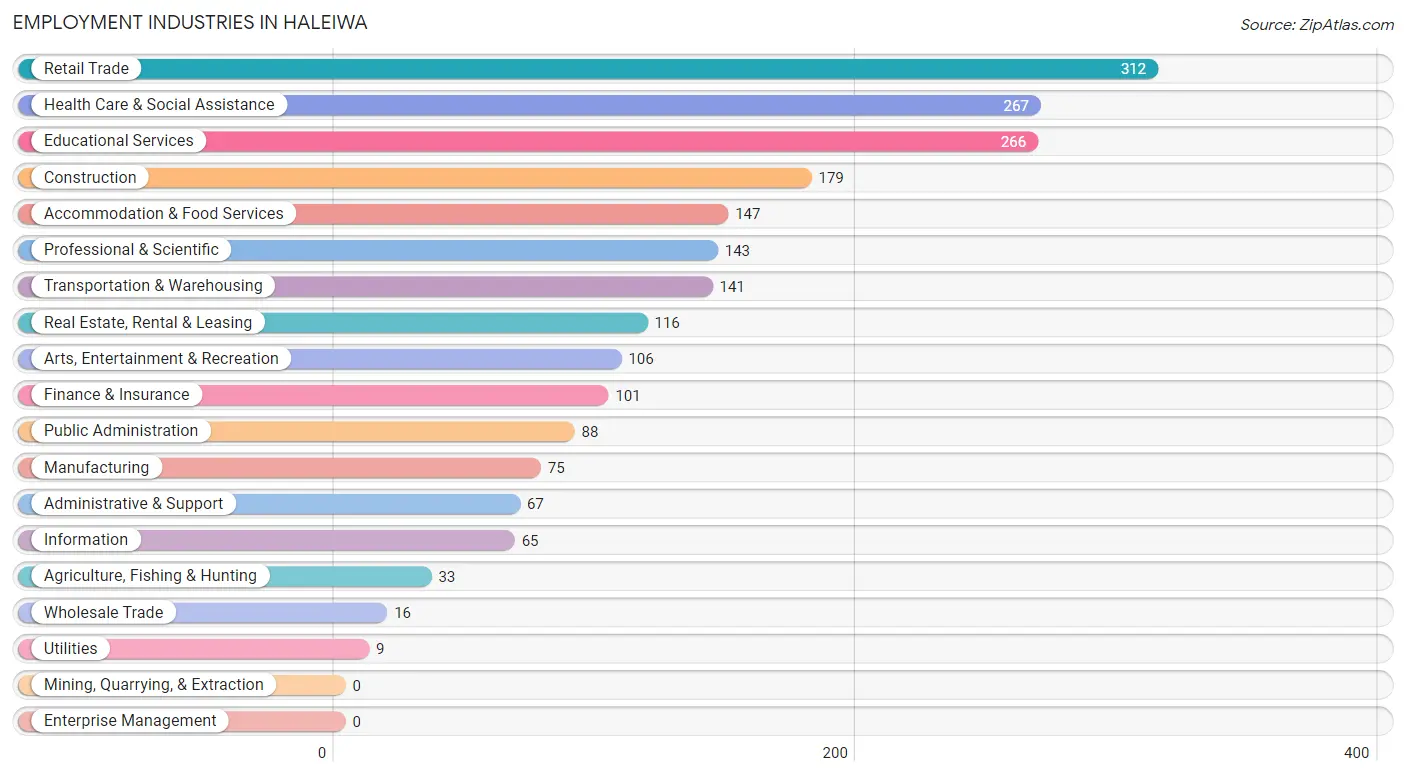
Employment Industries in Haleiwa
The major employment industries in Haleiwa include Retail Trade (312 | 13.1%), Health Care & Social Assistance (267 | 11.2%), Educational Services (266 | 11.2%), Construction (179 | 7.5%), and Accommodation & Food Services (147 | 6.2%).
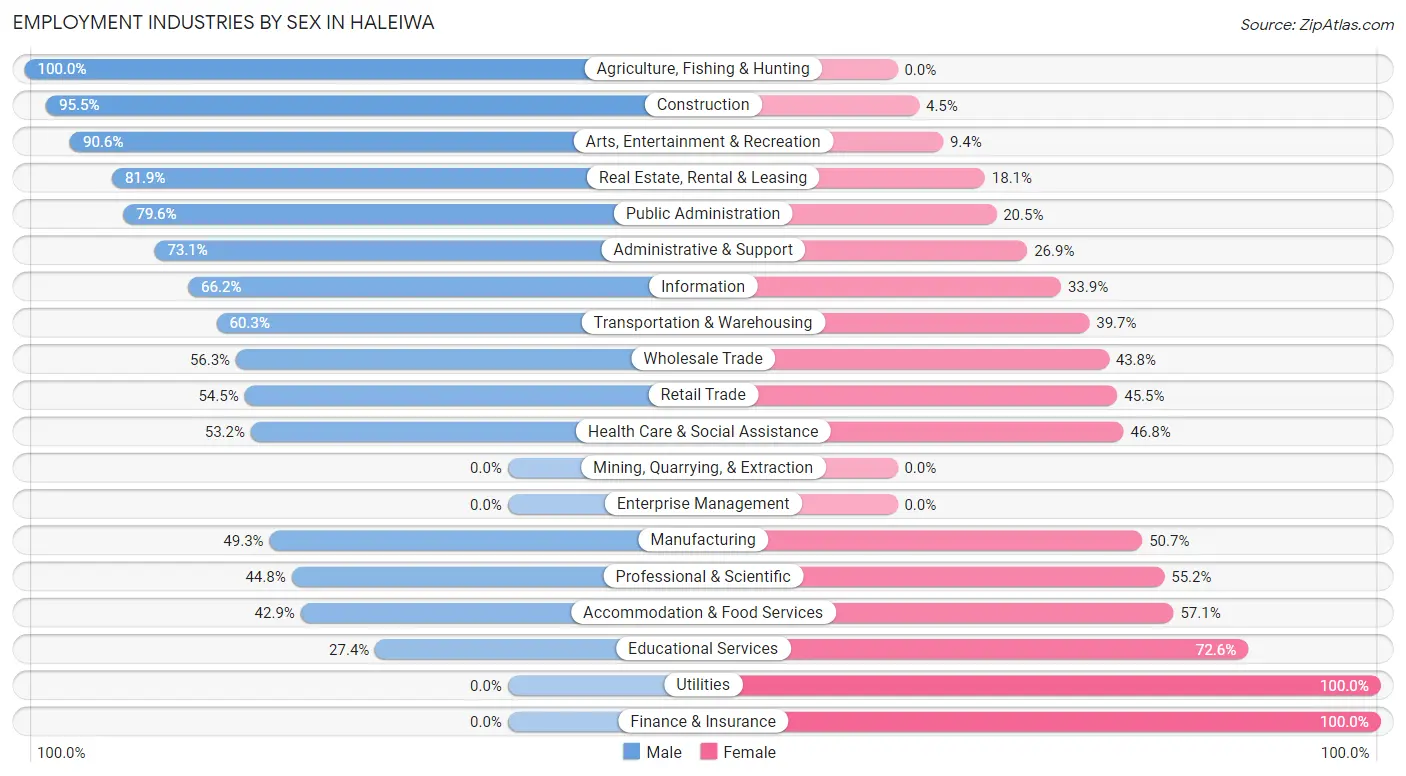
Employment Industries by Sex in Haleiwa
The Haleiwa industries that see more men than women are Agriculture, Fishing & Hunting (100.0%), Construction (95.5%), and Arts, Entertainment & Recreation (90.6%), whereas the industries that tend to have a higher number of women are Utilities (100.0%), Finance & Insurance (100.0%), and Educational Services (72.6%).
| Industry | Male | Female |
| Agriculture, Fishing & Hunting | 33 (100.0%) | 0 (0.0%) |
| Mining, Quarrying, & Extraction | 0 (0.0%) | 0 (0.0%) |
| Construction | 171 (95.5%) | 8 (4.5%) |
| Manufacturing | 37 (49.3%) | 38 (50.7%) |
| Wholesale Trade | 9 (56.2%) | 7 (43.8%) |
| Retail Trade | 170 (54.5%) | 142 (45.5%) |
| Transportation & Warehousing | 85 (60.3%) | 56 (39.7%) |
| Utilities | 0 (0.0%) | 9 (100.0%) |
| Information | 43 (66.1%) | 22 (33.9%) |
| Finance & Insurance | 0 (0.0%) | 101 (100.0%) |
| Real Estate, Rental & Leasing | 95 (81.9%) | 21 (18.1%) |
| Professional & Scientific | 64 (44.8%) | 79 (55.2%) |
| Enterprise Management | 0 (0.0%) | 0 (0.0%) |
| Administrative & Support | 49 (73.1%) | 18 (26.9%) |
| Educational Services | 73 (27.4%) | 193 (72.6%) |
| Health Care & Social Assistance | 142 (53.2%) | 125 (46.8%) |
| Arts, Entertainment & Recreation | 96 (90.6%) | 10 (9.4%) |
| Accommodation & Food Services | 63 (42.9%) | 84 (57.1%) |
| Public Administration | 70 (79.5%) | 18 (20.4%) |
| Total | 1,306 (54.9%) | 1,072 (45.1%) |
Education in Haleiwa
School Enrollment in Haleiwa
The most common levels of schooling among the 926 students in Haleiwa are elementary school (228 | 24.6%), middle school (189 | 20.4%), and nursery / preschool (147 | 15.9%).
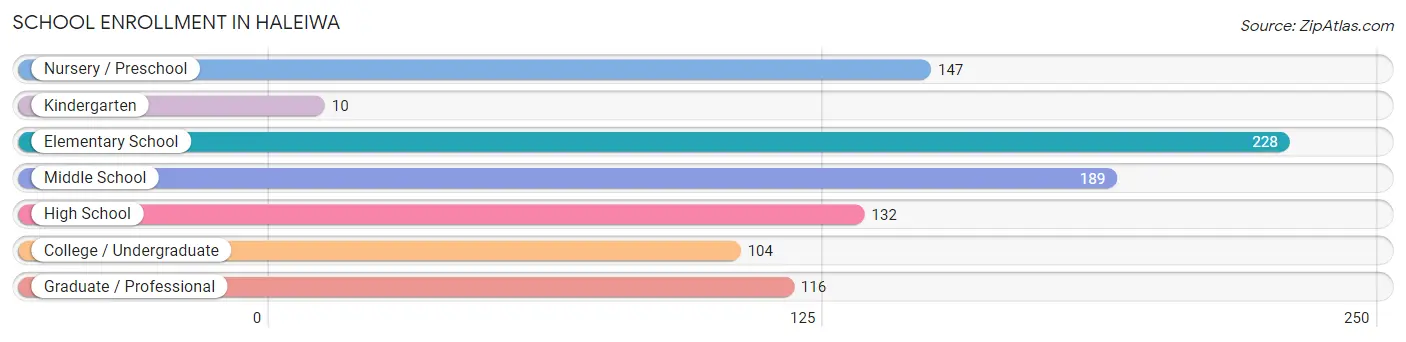
| School Level | # Students | % Students |
| Nursery / Preschool | 147 | 15.9% |
| Kindergarten | 10 | 1.1% |
| Elementary School | 228 | 24.6% |
| Middle School | 189 | 20.4% |
| High School | 132 | 14.2% |
| College / Undergraduate | 104 | 11.2% |
| Graduate / Professional | 116 | 12.5% |
| Total | 926 | 100.0% |
School Enrollment by Age by Funding Source in Haleiwa
Out of a total of 926 students who are enrolled in schools in Haleiwa, 216 (23.3%) attend a private institution, while the remaining 710 (76.7%) are enrolled in public schools. The age group of 3 to 4 year olds has the highest likelihood of being enrolled in private schools, with 55 (47.8% in the age bracket) enrolled. Conversely, the age group of 18 to 19 year olds has the lowest likelihood of being enrolled in a private school, with 32 (100.0% in the age bracket) attending a public institution.
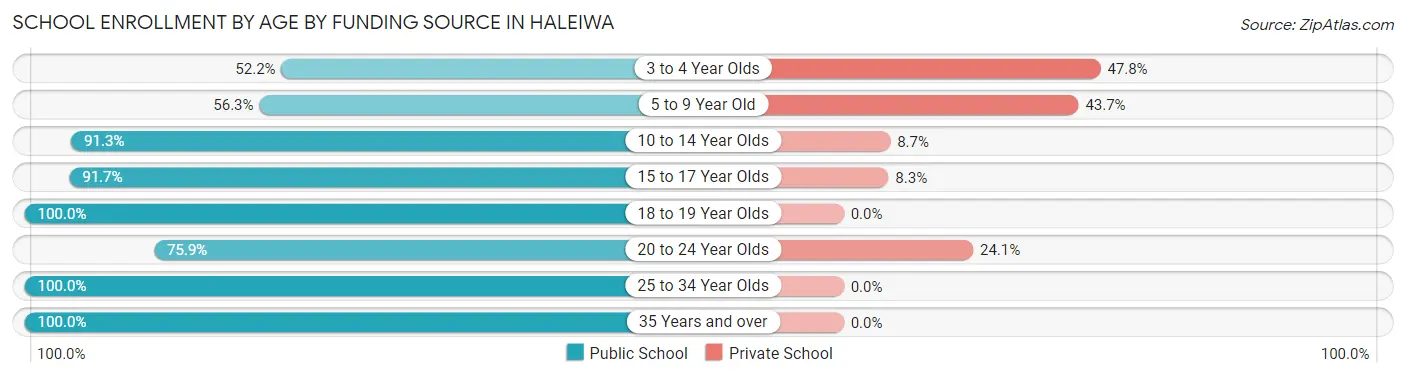
| Age Bracket | Public School | Private School |
| 3 to 4 Year Olds | 60 (52.2%) | 55 (47.8%) |
| 5 to 9 Year Old | 148 (56.3%) | 115 (43.7%) |
| 10 to 14 Year Olds | 179 (91.3%) | 17 (8.7%) |
| 15 to 17 Year Olds | 99 (91.7%) | 9 (8.3%) |
| 18 to 19 Year Olds | 32 (100.0%) | 0 (0.0%) |
| 20 to 24 Year Olds | 63 (75.9%) | 20 (24.1%) |
| 25 to 34 Year Olds | 94 (100.0%) | 0 (0.0%) |
| 35 Years and over | 35 (100.0%) | 0 (0.0%) |
| Total | 710 (76.7%) | 216 (23.3%) |
Educational Attainment by Field of Study in Haleiwa
Science & technology (119 | 16.8%), education (99 | 13.9%), visual & performing arts (76 | 10.7%), business (67 | 9.4%), and arts & humanities (61 | 8.6%) are the most common fields of study among 710 individuals in Haleiwa who have obtained a bachelor's degree or higher.
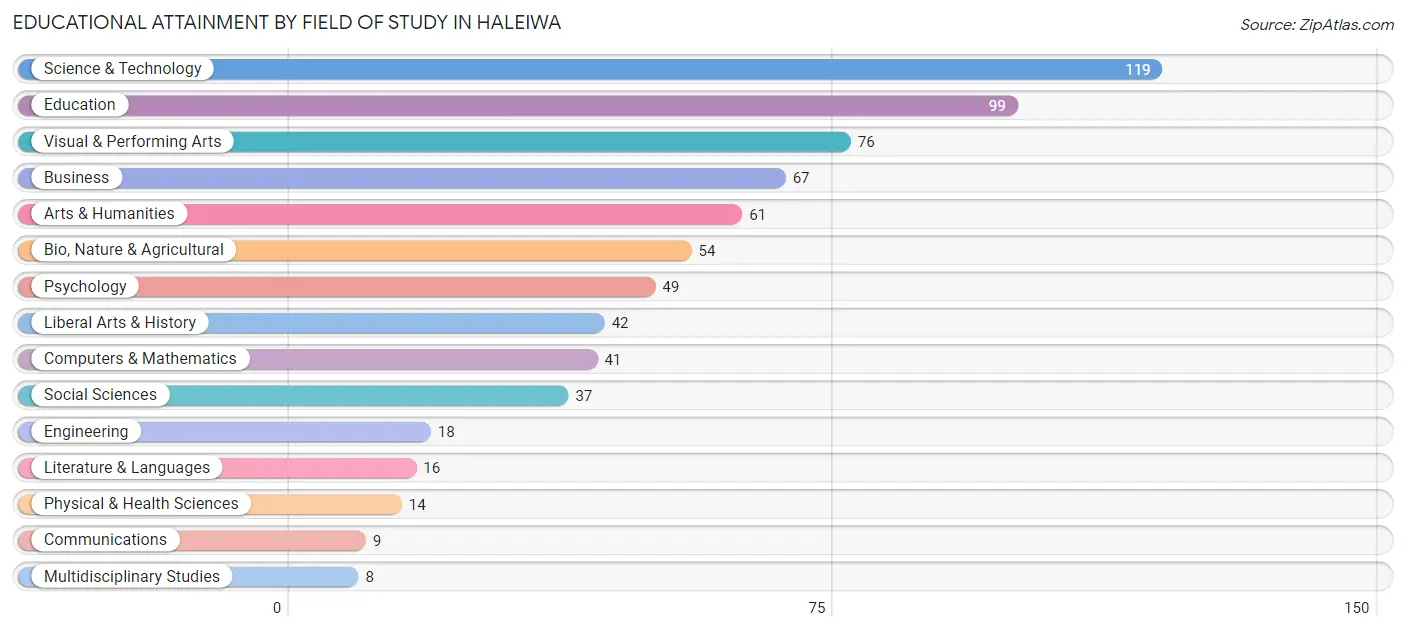
| Field of Study | # Graduates | % Graduates |
| Computers & Mathematics | 41 | 5.8% |
| Bio, Nature & Agricultural | 54 | 7.6% |
| Physical & Health Sciences | 14 | 2.0% |
| Psychology | 49 | 6.9% |
| Social Sciences | 37 | 5.2% |
| Engineering | 18 | 2.5% |
| Multidisciplinary Studies | 8 | 1.1% |
| Science & Technology | 119 | 16.8% |
| Business | 67 | 9.4% |
| Education | 99 | 13.9% |
| Literature & Languages | 16 | 2.2% |
| Liberal Arts & History | 42 | 5.9% |
| Visual & Performing Arts | 76 | 10.7% |
| Communications | 9 | 1.3% |
| Arts & Humanities | 61 | 8.6% |
| Total | 710 | 100.0% |
Transportation & Commute in Haleiwa
Vehicle Availability by Sex in Haleiwa
The most prevalent vehicle ownership categories in Haleiwa are males with 2 vehicles (433, accounting for 32.4%) and females with 2 vehicles (283, making up 40.9%).
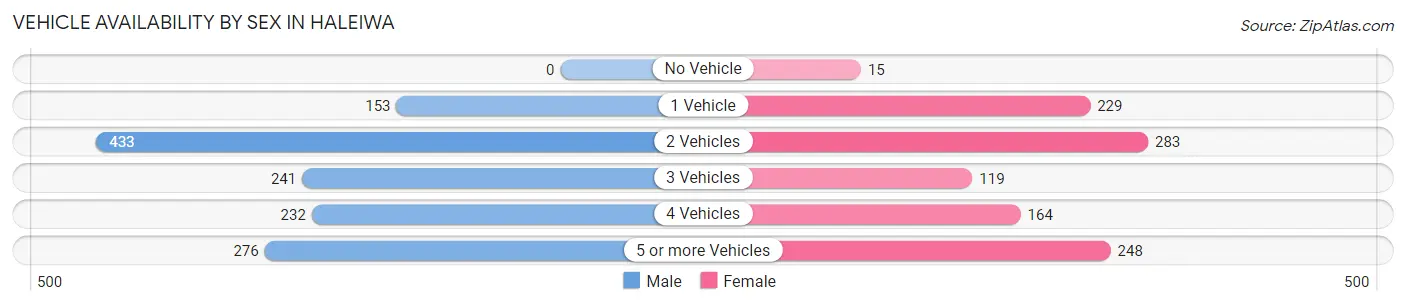
| Vehicles Available | Male | Female |
| No Vehicle | 0 (0.0%) | 15 (1.4%) |
| 1 Vehicle | 153 (11.5%) | 229 (21.6%) |
| 2 Vehicles | 433 (32.4%) | 283 (26.8%) |
| 3 Vehicles | 241 (18.0%) | 119 (11.3%) |
| 4 Vehicles | 232 (17.4%) | 164 (15.5%) |
| 5 or more Vehicles | 276 (20.7%) | 248 (23.4%) |
| Total | 1,335 (100.0%) | 1,058 (100.0%) |
Commute Time in Haleiwa
The most frequently occuring commute durations in Haleiwa are 45 to 59 minutes (379 commuters, 16.8%), 60 to 89 minutes (296 commuters, 13.1%), and 20 to 24 minutes (258 commuters, 11.5%).
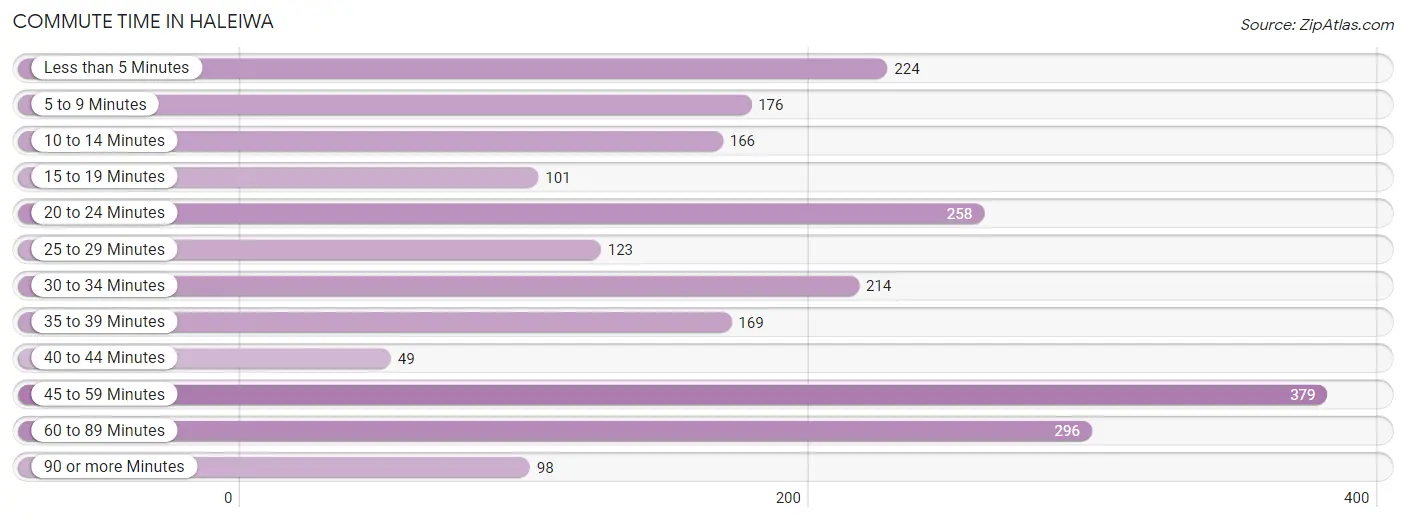
| Commute Time | # Commuters | % Commuters |
| Less than 5 Minutes | 224 | 9.9% |
| 5 to 9 Minutes | 176 | 7.8% |
| 10 to 14 Minutes | 166 | 7.4% |
| 15 to 19 Minutes | 101 | 4.5% |
| 20 to 24 Minutes | 258 | 11.5% |
| 25 to 29 Minutes | 123 | 5.5% |
| 30 to 34 Minutes | 214 | 9.5% |
| 35 to 39 Minutes | 169 | 7.5% |
| 40 to 44 Minutes | 49 | 2.2% |
| 45 to 59 Minutes | 379 | 16.8% |
| 60 to 89 Minutes | 296 | 13.1% |
| 90 or more Minutes | 98 | 4.3% |
Commute Time by Sex in Haleiwa
The most common commute times in Haleiwa are 45 to 59 minutes (262 commuters, 20.8%) for males and 20 to 24 minutes (178 commuters, 17.9%) for females.
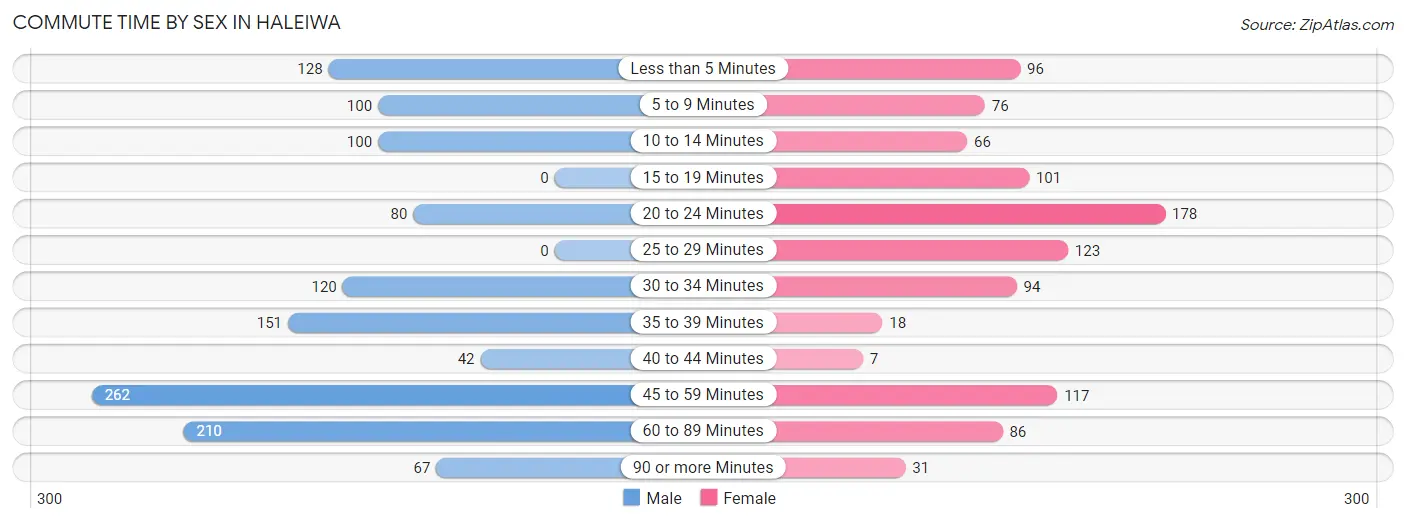
| Commute Time | Male | Female |
| Less than 5 Minutes | 128 (10.2%) | 96 (9.7%) |
| 5 to 9 Minutes | 100 (7.9%) | 76 (7.6%) |
| 10 to 14 Minutes | 100 (7.9%) | 66 (6.7%) |
| 15 to 19 Minutes | 0 (0.0%) | 101 (10.2%) |
| 20 to 24 Minutes | 80 (6.4%) | 178 (17.9%) |
| 25 to 29 Minutes | 0 (0.0%) | 123 (12.4%) |
| 30 to 34 Minutes | 120 (9.5%) | 94 (9.5%) |
| 35 to 39 Minutes | 151 (12.0%) | 18 (1.8%) |
| 40 to 44 Minutes | 42 (3.3%) | 7 (0.7%) |
| 45 to 59 Minutes | 262 (20.8%) | 117 (11.8%) |
| 60 to 89 Minutes | 210 (16.7%) | 86 (8.7%) |
| 90 or more Minutes | 67 (5.3%) | 31 (3.1%) |
Time of Departure to Work by Sex in Haleiwa
The most frequent times of departure to work in Haleiwa are 8:00 AM to 8:29 AM (236, 18.7%) for males and 8:00 AM to 8:29 AM (230, 23.2%) for females.
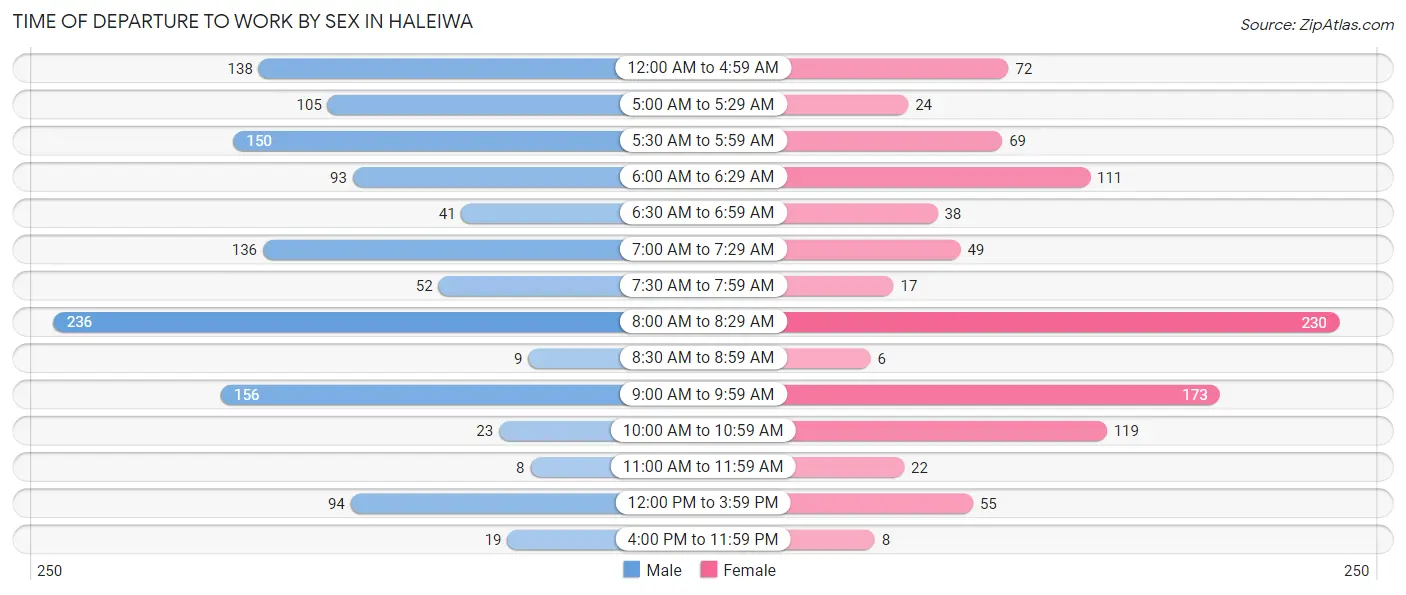
| Time of Departure | Male | Female |
| 12:00 AM to 4:59 AM | 138 (11.0%) | 72 (7.2%) |
| 5:00 AM to 5:29 AM | 105 (8.3%) | 24 (2.4%) |
| 5:30 AM to 5:59 AM | 150 (11.9%) | 69 (7.0%) |
| 6:00 AM to 6:29 AM | 93 (7.4%) | 111 (11.2%) |
| 6:30 AM to 6:59 AM | 41 (3.3%) | 38 (3.8%) |
| 7:00 AM to 7:29 AM | 136 (10.8%) | 49 (4.9%) |
| 7:30 AM to 7:59 AM | 52 (4.1%) | 17 (1.7%) |
| 8:00 AM to 8:29 AM | 236 (18.7%) | 230 (23.2%) |
| 8:30 AM to 8:59 AM | 9 (0.7%) | 6 (0.6%) |
| 9:00 AM to 9:59 AM | 156 (12.4%) | 173 (17.4%) |
| 10:00 AM to 10:59 AM | 23 (1.8%) | 119 (12.0%) |
| 11:00 AM to 11:59 AM | 8 (0.6%) | 22 (2.2%) |
| 12:00 PM to 3:59 PM | 94 (7.5%) | 55 (5.5%) |
| 4:00 PM to 11:59 PM | 19 (1.5%) | 8 (0.8%) |
| Total | 1,260 (100.0%) | 993 (100.0%) |
Housing Occupancy in Haleiwa
Occupancy by Ownership in Haleiwa
Of the total 1,497 dwellings in Haleiwa, owner-occupied units account for 909 (60.7%), while renter-occupied units make up 588 (39.3%).
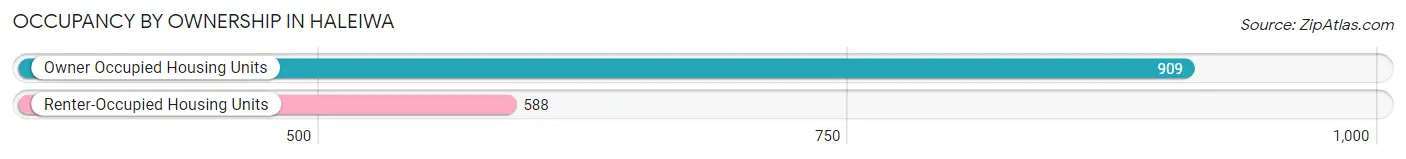
| Occupancy | # Housing Units | % Housing Units |
| Owner Occupied Housing Units | 909 | 60.7% |
| Renter-Occupied Housing Units | 588 | 39.3% |
| Total Occupied Housing Units | 1,497 | 100.0% |
Occupancy by Household Size in Haleiwa
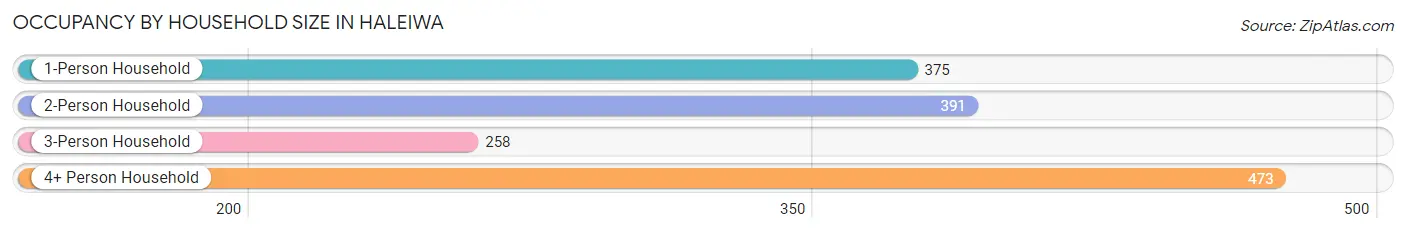
| Household Size | # Housing Units | % Housing Units |
| 1-Person Household | 375 | 25.1% |
| 2-Person Household | 391 | 26.1% |
| 3-Person Household | 258 | 17.2% |
| 4+ Person Household | 473 | 31.6% |
| Total Housing Units | 1,497 | 100.0% |
Occupancy by Ownership by Household Size in Haleiwa
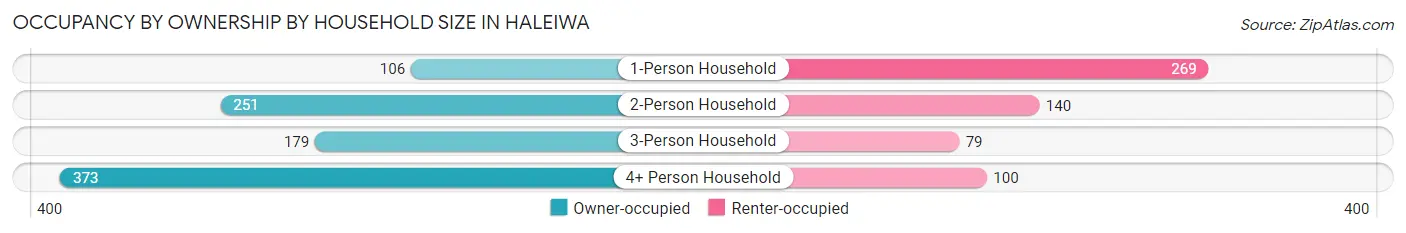
| Household Size | Owner-occupied | Renter-occupied |
| 1-Person Household | 106 (28.3%) | 269 (71.7%) |
| 2-Person Household | 251 (64.2%) | 140 (35.8%) |
| 3-Person Household | 179 (69.4%) | 79 (30.6%) |
| 4+ Person Household | 373 (78.9%) | 100 (21.1%) |
| Total Housing Units | 909 (60.7%) | 588 (39.3%) |
Occupancy by Educational Attainment in Haleiwa
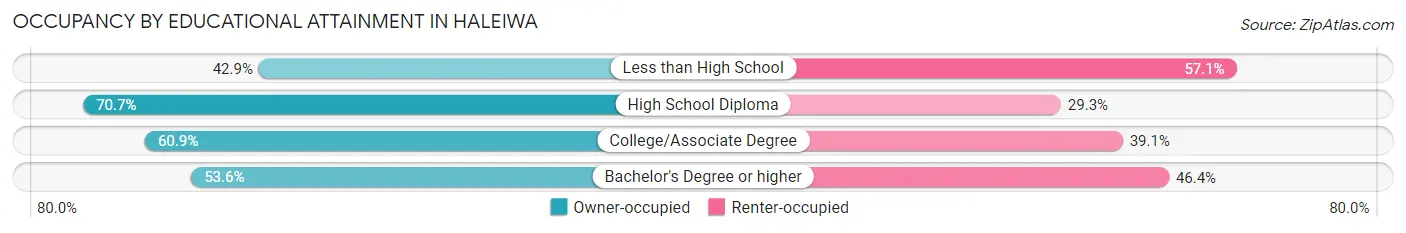
| Household Size | Owner-occupied | Renter-occupied |
| Less than High School | 24 (42.9%) | 32 (57.1%) |
| High School Diploma | 292 (70.7%) | 121 (29.3%) |
| College/Associate Degree | 352 (60.9%) | 226 (39.1%) |
| Bachelor's Degree or higher | 241 (53.6%) | 209 (46.4%) |
Occupancy by Age of Householder in Haleiwa
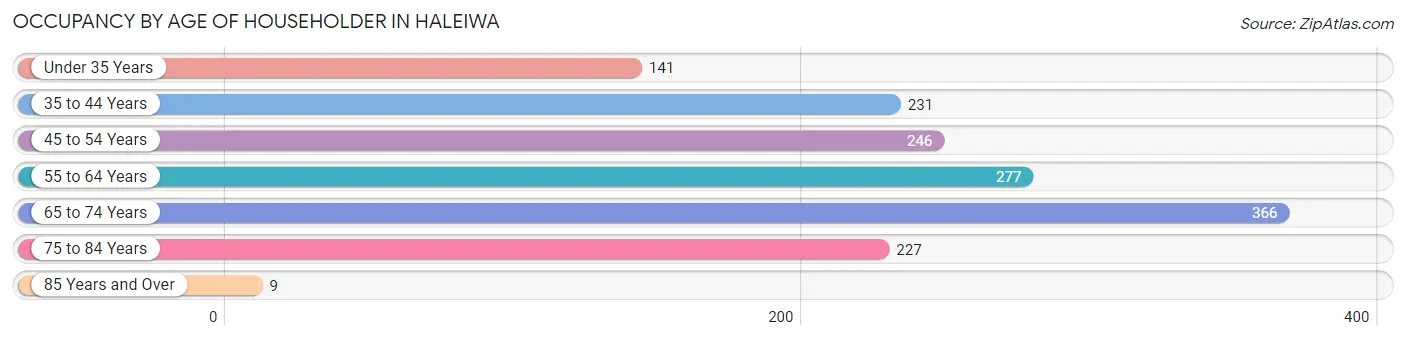
| Age Bracket | # Households | % Households |
| Under 35 Years | 141 | 9.4% |
| 35 to 44 Years | 231 | 15.4% |
| 45 to 54 Years | 246 | 16.4% |
| 55 to 64 Years | 277 | 18.5% |
| 65 to 74 Years | 366 | 24.4% |
| 75 to 84 Years | 227 | 15.2% |
| 85 Years and Over | 9 | 0.6% |
| Total | 1,497 | 100.0% |
Housing Finances in Haleiwa
Median Income by Occupancy in Haleiwa
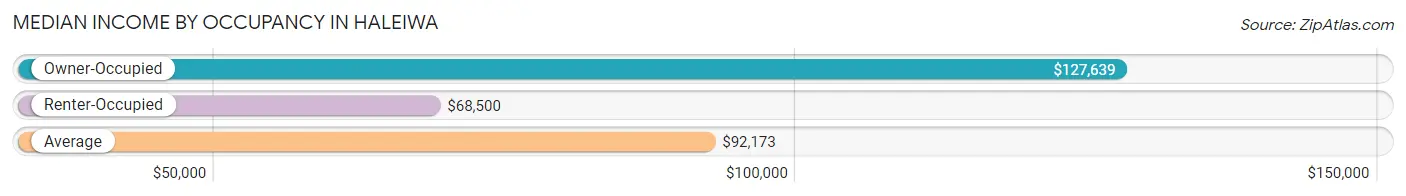
| Occupancy Type | # Households | Median Income |
| Owner-Occupied | 909 (60.7%) | $127,639 |
| Renter-Occupied | 588 (39.3%) | $68,500 |
| Average | 1,497 (100.0%) | $92,173 |
Occupancy by Householder Income Bracket in Haleiwa
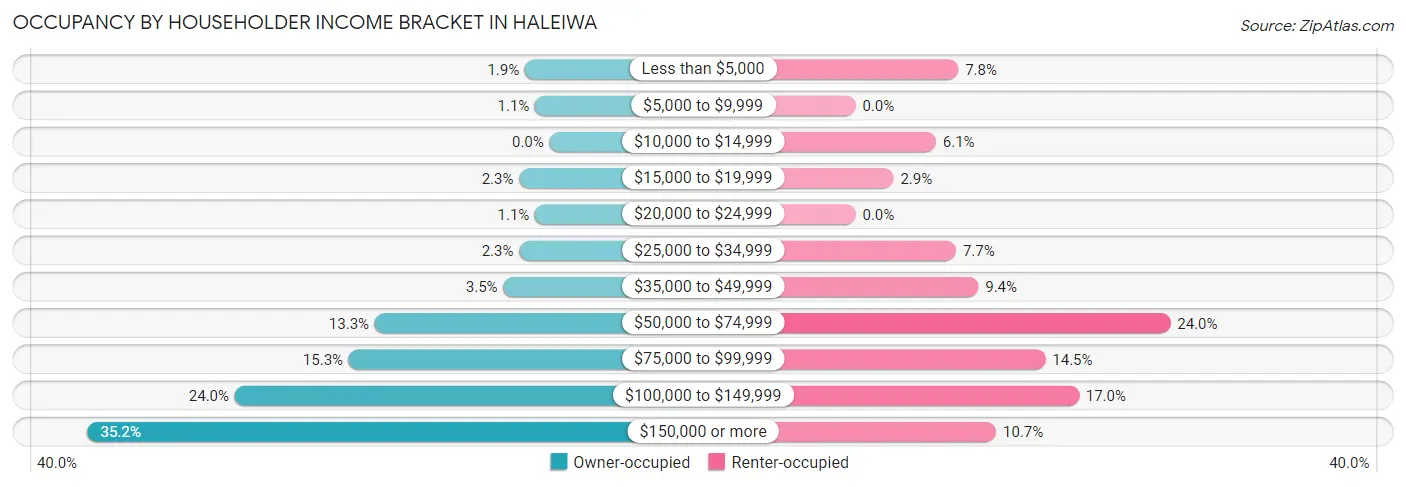
| Income Bracket | Owner-occupied | Renter-occupied |
| Less than $5,000 | 17 (1.9%) | 46 (7.8%) |
| $5,000 to $9,999 | 10 (1.1%) | 0 (0.0%) |
| $10,000 to $14,999 | 0 (0.0%) | 36 (6.1%) |
| $15,000 to $19,999 | 21 (2.3%) | 17 (2.9%) |
| $20,000 to $24,999 | 10 (1.1%) | 0 (0.0%) |
| $25,000 to $34,999 | 21 (2.3%) | 45 (7.6%) |
| $35,000 to $49,999 | 32 (3.5%) | 55 (9.3%) |
| $50,000 to $74,999 | 121 (13.3%) | 141 (24.0%) |
| $75,000 to $99,999 | 139 (15.3%) | 85 (14.5%) |
| $100,000 to $149,999 | 218 (24.0%) | 100 (17.0%) |
| $150,000 or more | 320 (35.2%) | 63 (10.7%) |
| Total | 909 (100.0%) | 588 (100.0%) |
Monthly Housing Cost Tiers in Haleiwa
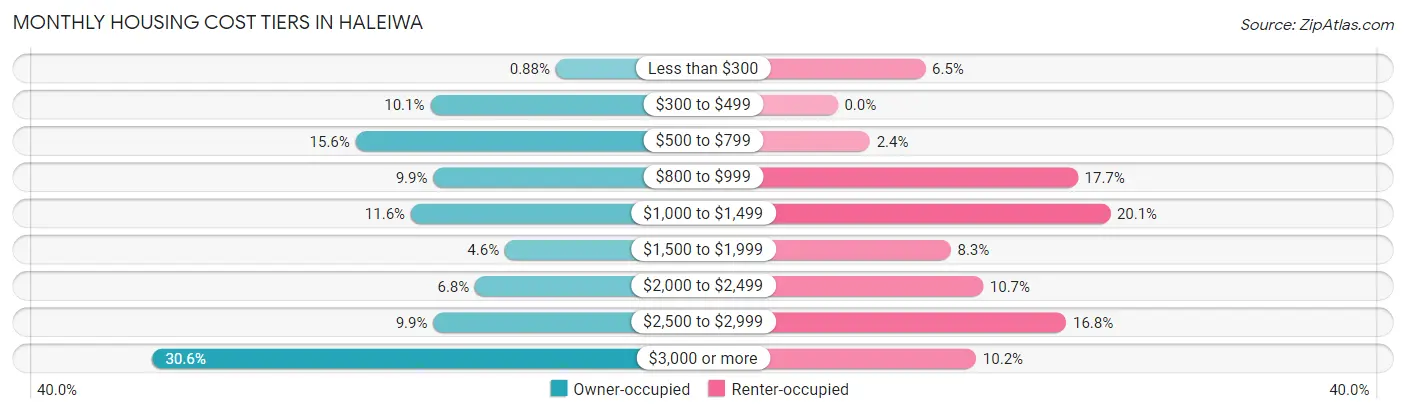
| Monthly Cost | Owner-occupied | Renter-occupied |
| Less than $300 | 8 (0.9%) | 38 (6.5%) |
| $300 to $499 | 92 (10.1%) | 0 (0.0%) |
| $500 to $799 | 142 (15.6%) | 14 (2.4%) |
| $800 to $999 | 90 (9.9%) | 104 (17.7%) |
| $1,000 to $1,499 | 105 (11.6%) | 118 (20.1%) |
| $1,500 to $1,999 | 42 (4.6%) | 49 (8.3%) |
| $2,000 to $2,499 | 62 (6.8%) | 63 (10.7%) |
| $2,500 to $2,999 | 90 (9.9%) | 99 (16.8%) |
| $3,000 or more | 278 (30.6%) | 60 (10.2%) |
| Total | 909 (100.0%) | 588 (100.0%) |
Physical Housing Characteristics in Haleiwa
Housing Structures in Haleiwa
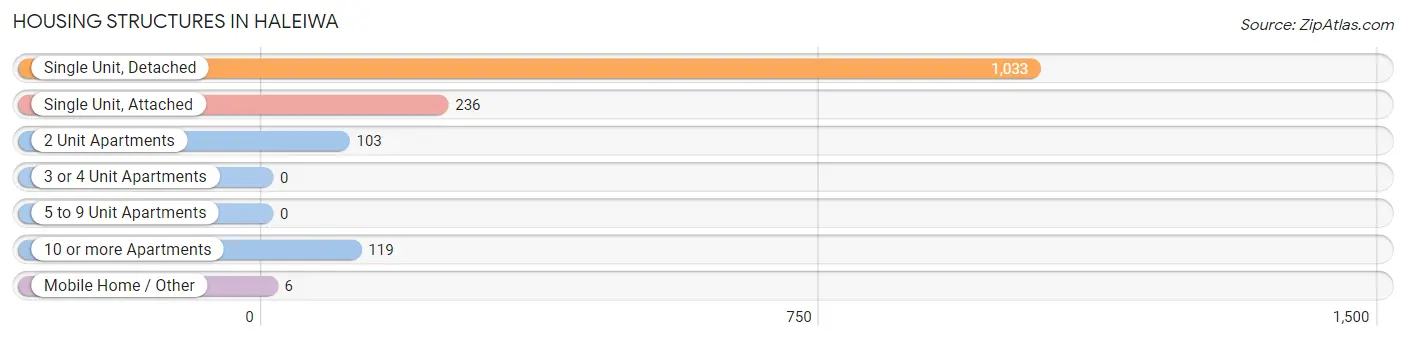
| Structure Type | # Housing Units | % Housing Units |
| Single Unit, Detached | 1,033 | 69.0% |
| Single Unit, Attached | 236 | 15.8% |
| 2 Unit Apartments | 103 | 6.9% |
| 3 or 4 Unit Apartments | 0 | 0.0% |
| 5 to 9 Unit Apartments | 0 | 0.0% |
| 10 or more Apartments | 119 | 8.0% |
| Mobile Home / Other | 6 | 0.4% |
| Total | 1,497 | 100.0% |
Housing Structures by Occupancy in Haleiwa
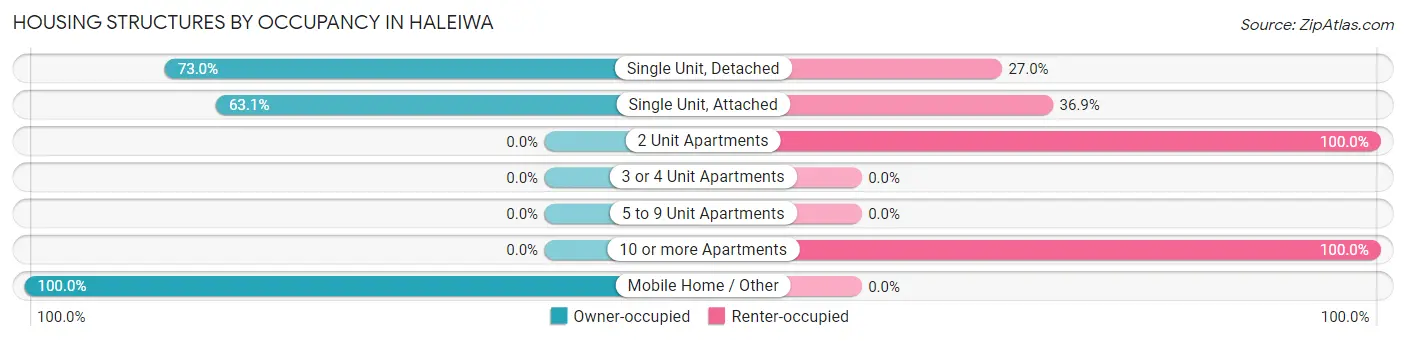
| Structure Type | Owner-occupied | Renter-occupied |
| Single Unit, Detached | 754 (73.0%) | 279 (27.0%) |
| Single Unit, Attached | 149 (63.1%) | 87 (36.9%) |
| 2 Unit Apartments | 0 (0.0%) | 103 (100.0%) |
| 3 or 4 Unit Apartments | 0 (0.0%) | 0 (0.0%) |
| 5 to 9 Unit Apartments | 0 (0.0%) | 0 (0.0%) |
| 10 or more Apartments | 0 (0.0%) | 119 (100.0%) |
| Mobile Home / Other | 6 (100.0%) | 0 (0.0%) |
| Total | 909 (60.7%) | 588 (39.3%) |
Housing Structures by Number of Rooms in Haleiwa
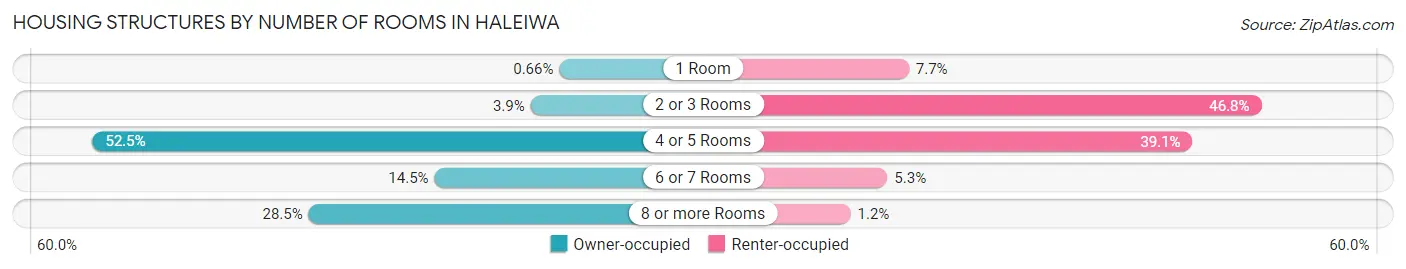
| Number of Rooms | Owner-occupied | Renter-occupied |
| 1 Room | 6 (0.7%) | 45 (7.6%) |
| 2 or 3 Rooms | 35 (3.8%) | 275 (46.8%) |
| 4 or 5 Rooms | 477 (52.5%) | 230 (39.1%) |
| 6 or 7 Rooms | 132 (14.5%) | 31 (5.3%) |
| 8 or more Rooms | 259 (28.5%) | 7 (1.2%) |
| Total | 909 (100.0%) | 588 (100.0%) |
Housing Structure by Heating Type in Haleiwa
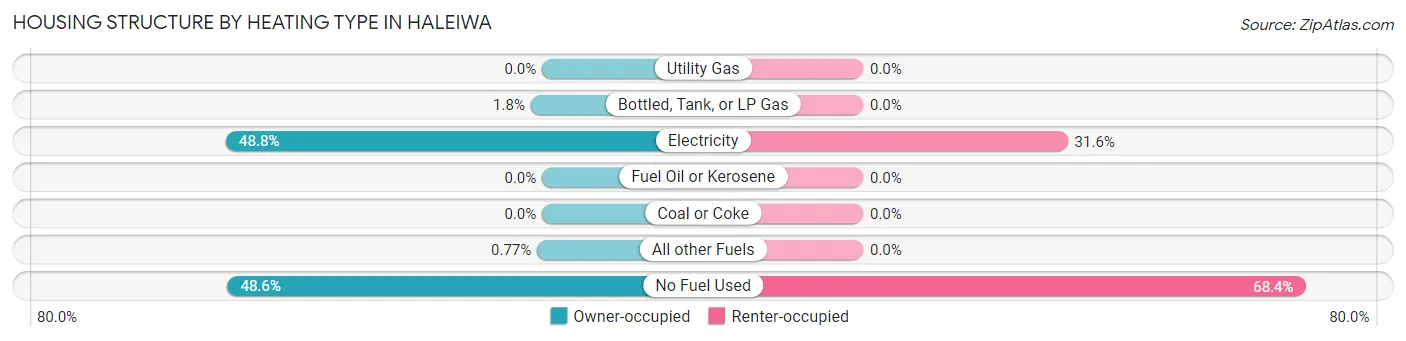
| Heating Type | Owner-occupied | Renter-occupied |
| Utility Gas | 0 (0.0%) | 0 (0.0%) |
| Bottled, Tank, or LP Gas | 16 (1.8%) | 0 (0.0%) |
| Electricity | 444 (48.8%) | 186 (31.6%) |
| Fuel Oil or Kerosene | 0 (0.0%) | 0 (0.0%) |
| Coal or Coke | 0 (0.0%) | 0 (0.0%) |
| All other Fuels | 7 (0.8%) | 0 (0.0%) |
| No Fuel Used | 442 (48.6%) | 402 (68.4%) |
| Total | 909 (100.0%) | 588 (100.0%) |
Household Vehicle Usage in Haleiwa
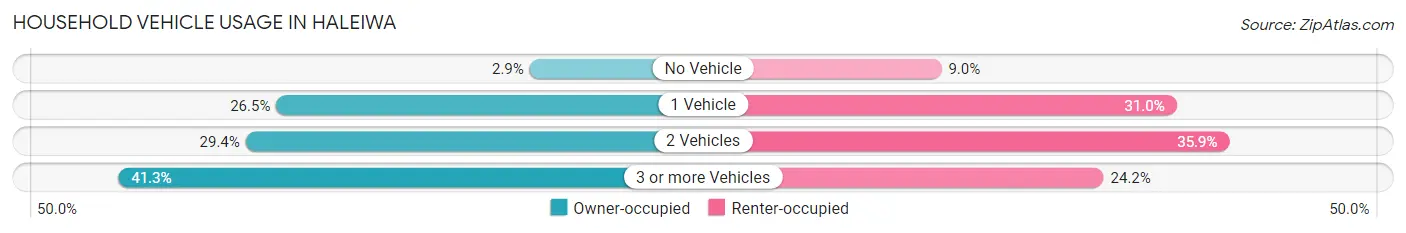
| Vehicles per Household | Owner-occupied | Renter-occupied |
| No Vehicle | 26 (2.9%) | 53 (9.0%) |
| 1 Vehicle | 241 (26.5%) | 182 (30.9%) |
| 2 Vehicles | 267 (29.4%) | 211 (35.9%) |
| 3 or more Vehicles | 375 (41.2%) | 142 (24.1%) |
| Total | 909 (100.0%) | 588 (100.0%) |
Real Estate & Mortgages in Haleiwa
Real Estate and Mortgage Overview in Haleiwa
| Characteristic | Without Mortgage | With Mortgage |
| Housing Units | 391 | 518 |
| Median Property Value | $954,600 | $1,028,500 |
| Median Household Income | $92,484 | $193 |
| Monthly Housing Costs | $699 | $278 |
| Real Estate Taxes | $2,635 | $42 |
Property Value by Mortgage Status in Haleiwa
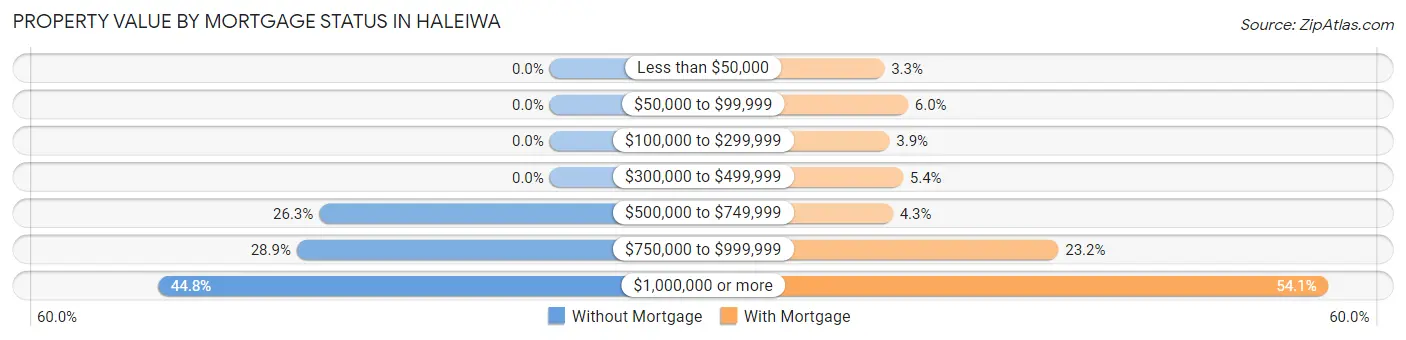
| Property Value | Without Mortgage | With Mortgage |
| Less than $50,000 | 0 (0.0%) | 17 (3.3%) |
| $50,000 to $99,999 | 0 (0.0%) | 31 (6.0%) |
| $100,000 to $299,999 | 0 (0.0%) | 20 (3.9%) |
| $300,000 to $499,999 | 0 (0.0%) | 28 (5.4%) |
| $500,000 to $749,999 | 103 (26.3%) | 22 (4.3%) |
| $750,000 to $999,999 | 113 (28.9%) | 120 (23.2%) |
| $1,000,000 or more | 175 (44.8%) | 280 (54.0%) |
| Total | 391 (100.0%) | 518 (100.0%) |
Household Income by Mortgage Status in Haleiwa
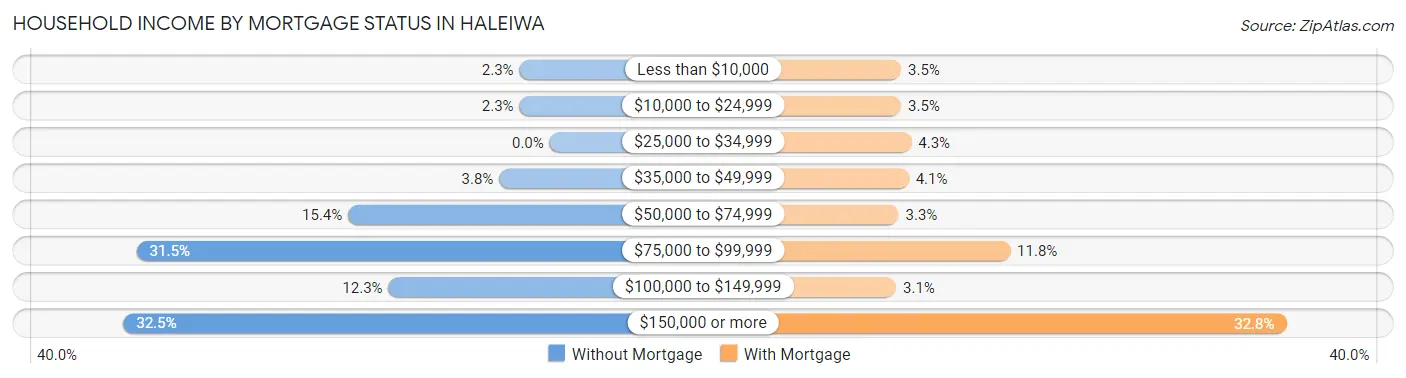
| Household Income | Without Mortgage | With Mortgage |
| Less than $10,000 | 9 (2.3%) | 18 (3.5%) |
| $10,000 to $24,999 | 9 (2.3%) | 18 (3.5%) |
| $25,000 to $34,999 | 0 (0.0%) | 22 (4.3%) |
| $35,000 to $49,999 | 15 (3.8%) | 21 (4.1%) |
| $50,000 to $74,999 | 60 (15.3%) | 17 (3.3%) |
| $75,000 to $99,999 | 123 (31.5%) | 61 (11.8%) |
| $100,000 to $149,999 | 48 (12.3%) | 16 (3.1%) |
| $150,000 or more | 127 (32.5%) | 170 (32.8%) |
| Total | 391 (100.0%) | 518 (100.0%) |
Property Value to Household Income Ratio in Haleiwa
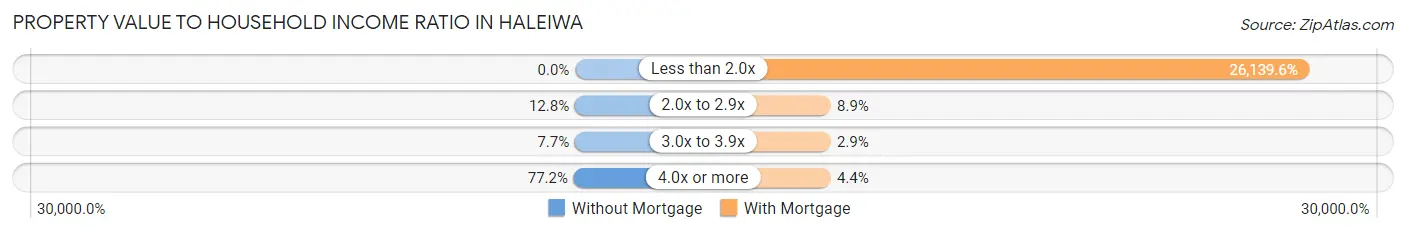
| Value-to-Income Ratio | Without Mortgage | With Mortgage |
| Less than 2.0x | 0 (0.0%) | 135,403 (26,139.6%) |
| 2.0x to 2.9x | 50 (12.8%) | 46 (8.9%) |
| 3.0x to 3.9x | 30 (7.7%) | 15 (2.9%) |
| 4.0x or more | 302 (77.2%) | 23 (4.4%) |
| Total | 391 (100.0%) | 518 (100.0%) |
Real Estate Taxes by Mortgage Status in Haleiwa
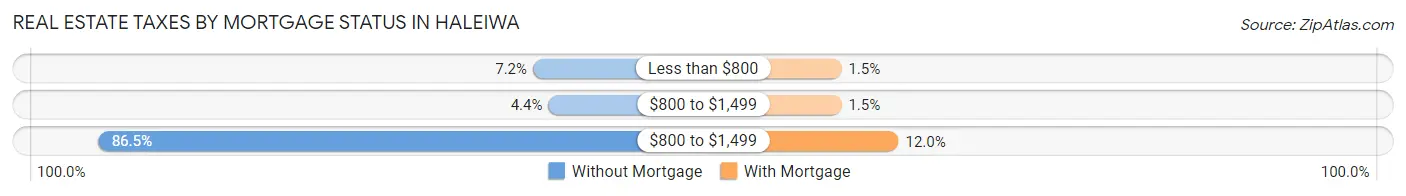
| Property Taxes | Without Mortgage | With Mortgage |
| Less than $800 | 28 (7.2%) | 8 (1.5%) |
| $800 to $1,499 | 17 (4.3%) | 8 (1.5%) |
| $800 to $1,499 | 338 (86.5%) | 62 (12.0%) |
| Total | 391 (100.0%) | 518 (100.0%) |
Health & Disability in Haleiwa
Health Insurance Coverage by Age in Haleiwa
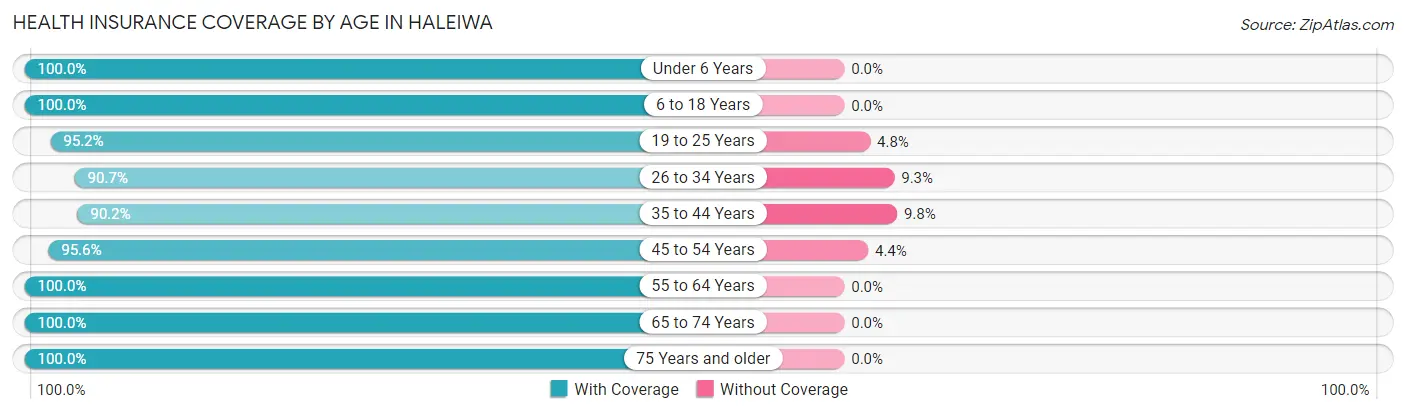
| Age Bracket | With Coverage | Without Coverage |
| Under 6 Years | 407 (100.0%) | 0 (0.0%) |
| 6 to 18 Years | 538 (100.0%) | 0 (0.0%) |
| 19 to 25 Years | 198 (95.2%) | 10 (4.8%) |
| 26 to 34 Years | 496 (90.7%) | 51 (9.3%) |
| 35 to 44 Years | 642 (90.2%) | 70 (9.8%) |
| 45 to 54 Years | 453 (95.6%) | 21 (4.4%) |
| 55 to 64 Years | 672 (100.0%) | 0 (0.0%) |
| 65 to 74 Years | 666 (100.0%) | 0 (0.0%) |
| 75 Years and older | 443 (100.0%) | 0 (0.0%) |
| Total | 4,515 (96.7%) | 152 (3.3%) |
Health Insurance Coverage by Citizenship Status in Haleiwa
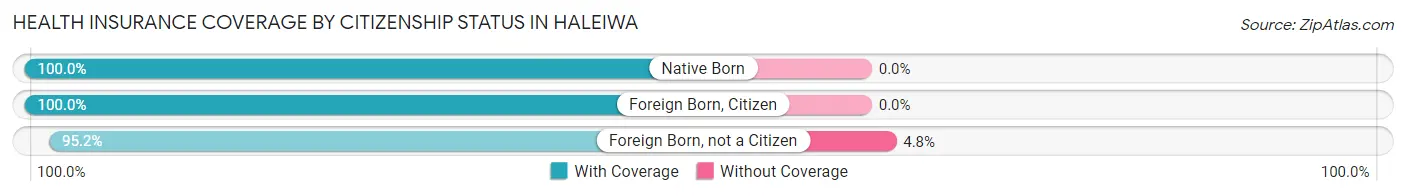
| Citizenship Status | With Coverage | Without Coverage |
| Native Born | 407 (100.0%) | 0 (0.0%) |
| Foreign Born, Citizen | 538 (100.0%) | 0 (0.0%) |
| Foreign Born, not a Citizen | 198 (95.2%) | 10 (4.8%) |
Health Insurance Coverage by Household Income in Haleiwa
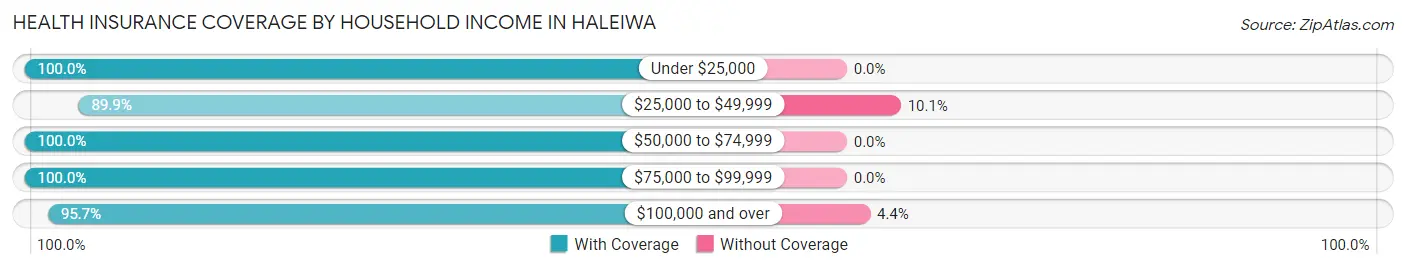
| Household Income | With Coverage | Without Coverage |
| Under $25,000 | 229 (100.0%) | 0 (0.0%) |
| $25,000 to $49,999 | 187 (89.9%) | 21 (10.1%) |
| $50,000 to $74,999 | 683 (100.0%) | 0 (0.0%) |
| $75,000 to $99,999 | 538 (100.0%) | 0 (0.0%) |
| $100,000 and over | 2,878 (95.7%) | 131 (4.3%) |
Public vs Private Health Insurance Coverage by Age in Haleiwa
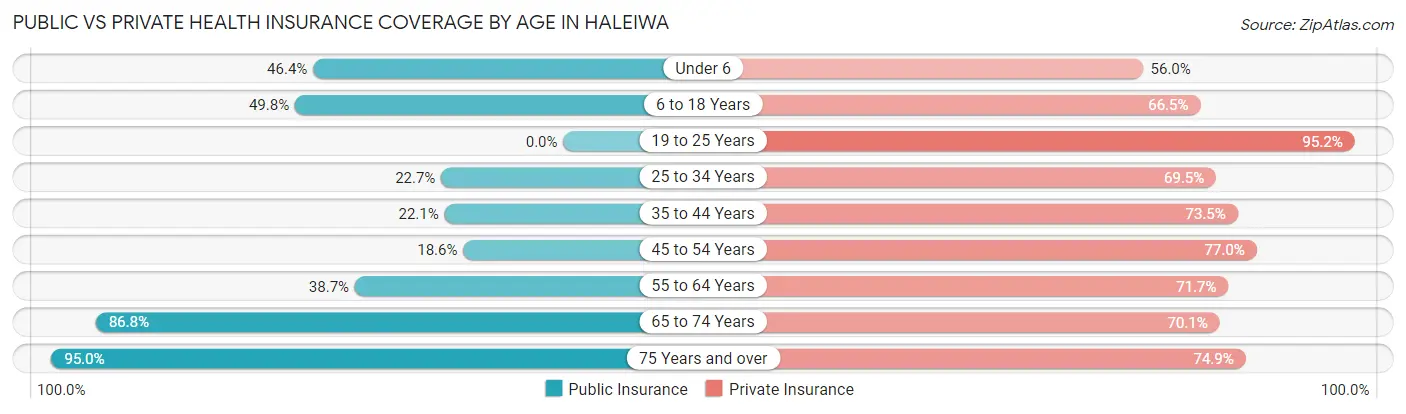
| Age Bracket | Public Insurance | Private Insurance |
| Under 6 | 189 (46.4%) | 228 (56.0%) |
| 6 to 18 Years | 268 (49.8%) | 358 (66.5%) |
| 19 to 25 Years | 0 (0.0%) | 198 (95.2%) |
| 25 to 34 Years | 124 (22.7%) | 380 (69.5%) |
| 35 to 44 Years | 157 (22.1%) | 523 (73.5%) |
| 45 to 54 Years | 88 (18.6%) | 365 (77.0%) |
| 55 to 64 Years | 260 (38.7%) | 482 (71.7%) |
| 65 to 74 Years | 578 (86.8%) | 467 (70.1%) |
| 75 Years and over | 421 (95.0%) | 332 (74.9%) |
| Total | 2,085 (44.7%) | 3,333 (71.4%) |
Disability Status by Sex by Age in Haleiwa
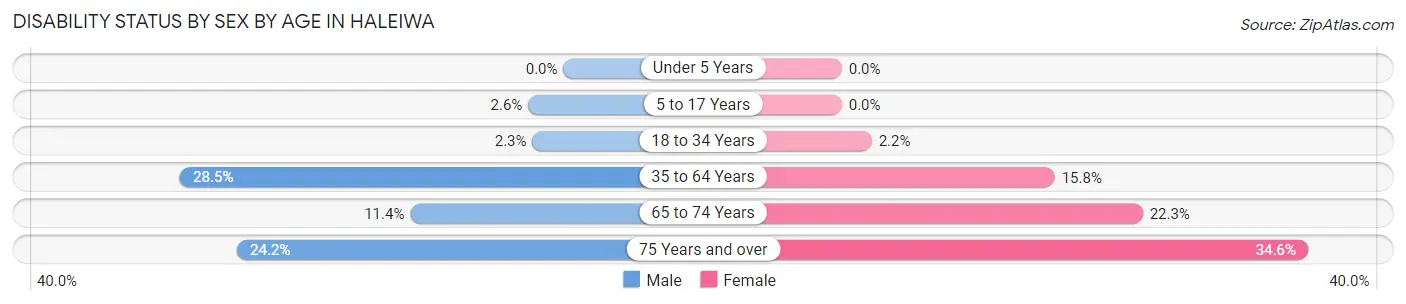
| Age Bracket | Male | Female |
| Under 5 Years | 0 (0.0%) | 0 (0.0%) |
| 5 to 17 Years | 8 (2.6%) | 0 (0.0%) |
| 18 to 34 Years | 8 (2.3%) | 10 (2.2%) |
| 35 to 64 Years | 291 (28.4%) | 132 (15.8%) |
| 65 to 74 Years | 34 (11.4%) | 82 (22.3%) |
| 75 Years and over | 31 (24.2%) | 109 (34.6%) |
Disability Class by Sex by Age in Haleiwa
Disability Class: Hearing Difficulty
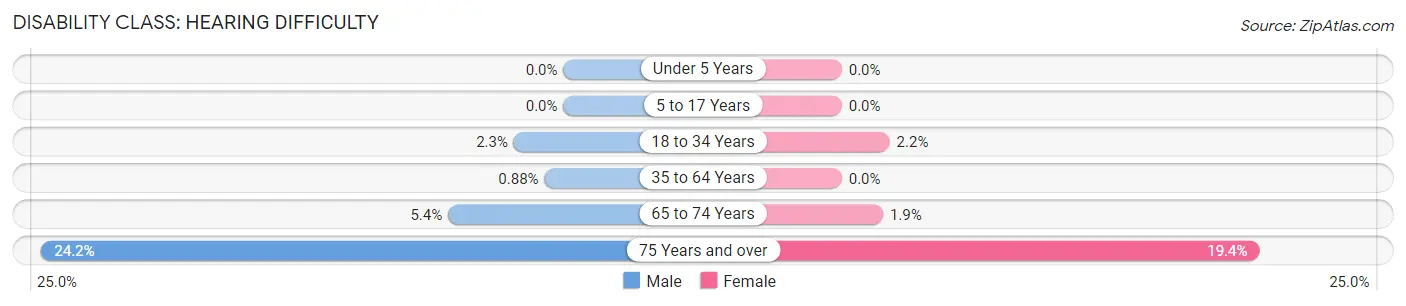
| Age Bracket | Male | Female |
| Under 5 Years | 0 (0.0%) | 0 (0.0%) |
| 5 to 17 Years | 0 (0.0%) | 0 (0.0%) |
| 18 to 34 Years | 8 (2.3%) | 10 (2.2%) |
| 35 to 64 Years | 9 (0.9%) | 0 (0.0%) |
| 65 to 74 Years | 16 (5.3%) | 7 (1.9%) |
| 75 Years and over | 31 (24.2%) | 61 (19.4%) |
Disability Class: Vision Difficulty
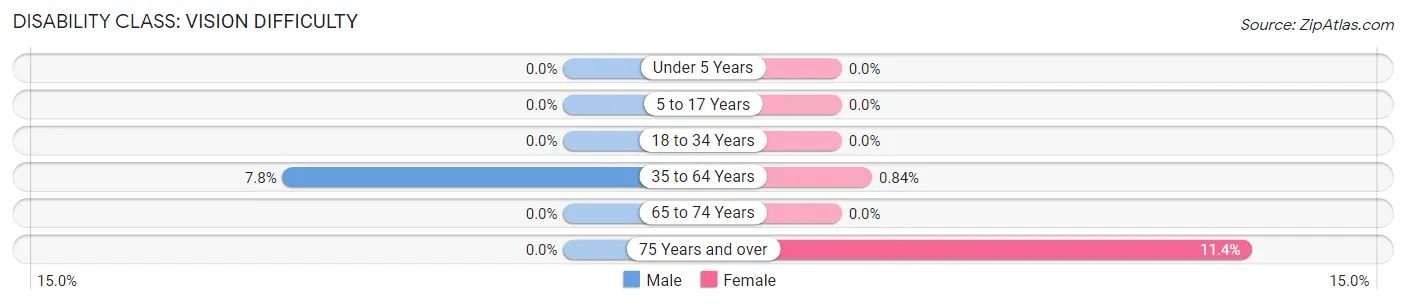
| Age Bracket | Male | Female |
| Under 5 Years | 0 (0.0%) | 0 (0.0%) |
| 5 to 17 Years | 0 (0.0%) | 0 (0.0%) |
| 18 to 34 Years | 0 (0.0%) | 0 (0.0%) |
| 35 to 64 Years | 80 (7.8%) | 7 (0.8%) |
| 65 to 74 Years | 0 (0.0%) | 0 (0.0%) |
| 75 Years and over | 0 (0.0%) | 36 (11.4%) |
Disability Class: Cognitive Difficulty
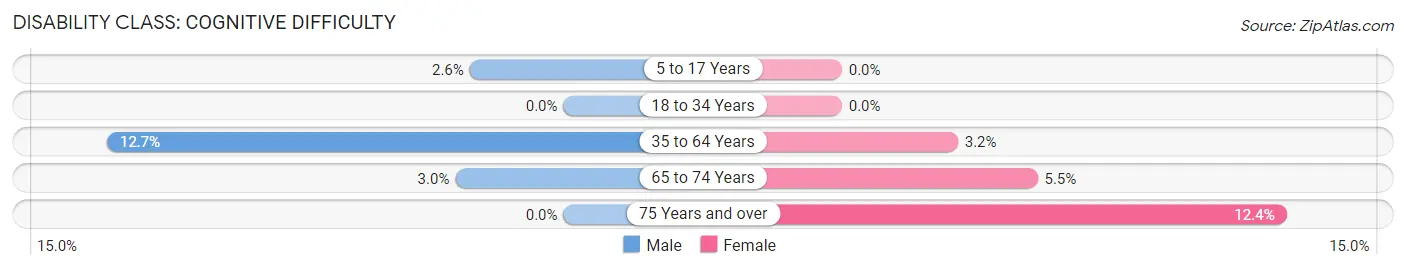
| Age Bracket | Male | Female |
| 5 to 17 Years | 8 (2.6%) | 0 (0.0%) |
| 18 to 34 Years | 0 (0.0%) | 0 (0.0%) |
| 35 to 64 Years | 130 (12.7%) | 27 (3.2%) |
| 65 to 74 Years | 9 (3.0%) | 20 (5.4%) |
| 75 Years and over | 0 (0.0%) | 39 (12.4%) |
Disability Class: Ambulatory Difficulty
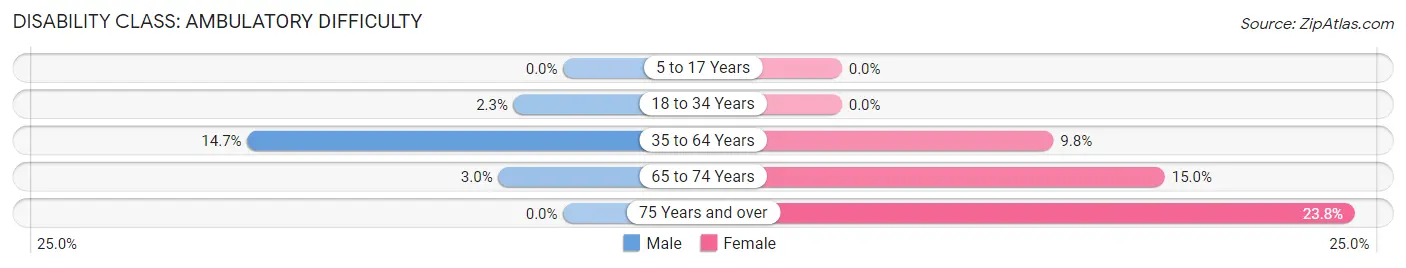
| Age Bracket | Male | Female |
| 5 to 17 Years | 0 (0.0%) | 0 (0.0%) |
| 18 to 34 Years | 8 (2.3%) | 0 (0.0%) |
| 35 to 64 Years | 150 (14.7%) | 82 (9.8%) |
| 65 to 74 Years | 9 (3.0%) | 55 (15.0%) |
| 75 Years and over | 0 (0.0%) | 75 (23.8%) |
Disability Class: Self-Care Difficulty
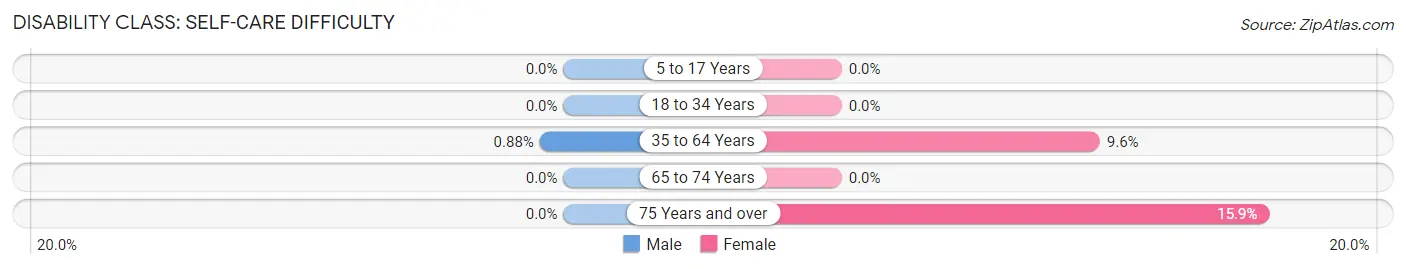
| Age Bracket | Male | Female |
| 5 to 17 Years | 0 (0.0%) | 0 (0.0%) |
| 18 to 34 Years | 0 (0.0%) | 0 (0.0%) |
| 35 to 64 Years | 9 (0.9%) | 80 (9.6%) |
| 65 to 74 Years | 0 (0.0%) | 0 (0.0%) |
| 75 Years and over | 0 (0.0%) | 50 (15.9%) |
Technology Access in Haleiwa
Computing Device Access in Haleiwa
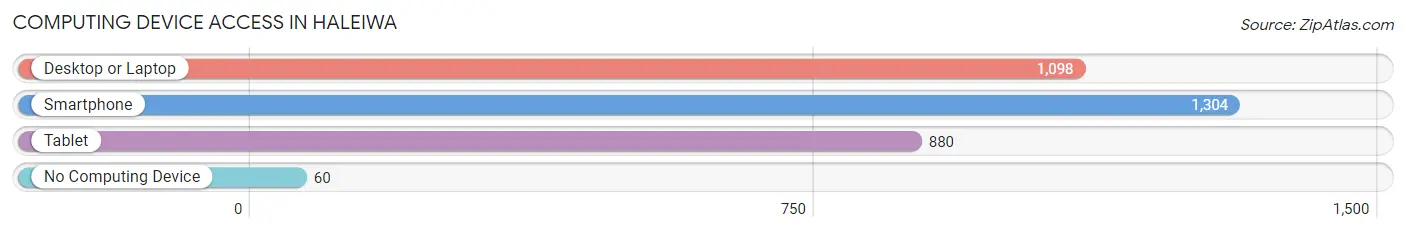
| Device Type | # Households | % Households |
| Desktop or Laptop | 1,098 | 73.4% |
| Smartphone | 1,304 | 87.1% |
| Tablet | 880 | 58.8% |
| No Computing Device | 60 | 4.0% |
| Total | 1,497 | 100.0% |
Internet Access in Haleiwa
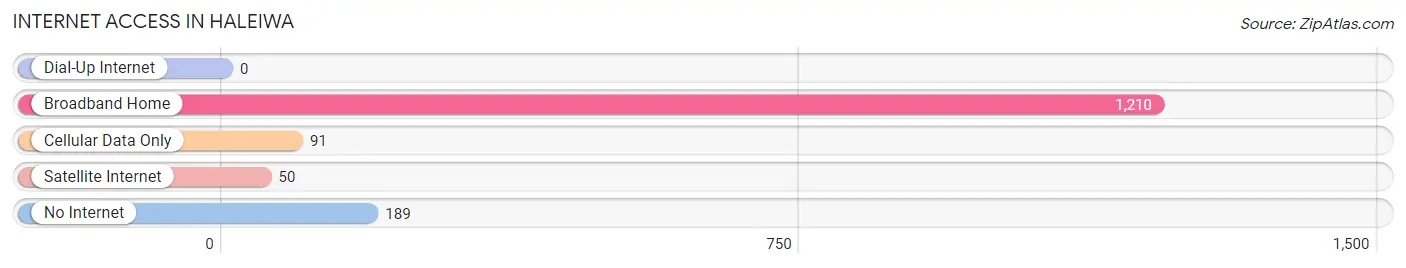
| Internet Type | # Households | % Households |
| Dial-Up Internet | 0 | 0.0% |
| Broadband Home | 1,210 | 80.8% |
| Cellular Data Only | 91 | 6.1% |
| Satellite Internet | 50 | 3.3% |
| No Internet | 189 | 12.6% |
| Total | 1,497 | 100.0% |
Haleiwa Summary
Haleiwa is a small town located on the North Shore of Oahu, Hawaii. It is a popular tourist destination and is known for its beautiful beaches, surfing, and laid-back atmosphere. The town has a population of approximately 2,000 people and is located about 30 miles from Honolulu.
History
Haleiwa was originally settled by Native Hawaiians in the late 1700s. The area was used for fishing and farming, and the name “Haleiwa” means “house of the frigate bird” in Hawaiian. In the late 1800s, the area was developed by Westerners, and the town was officially established in 1899. The town was a popular destination for tourists, and it was known for its beautiful beaches and surfing.
In the early 1900s, Haleiwa was a popular destination for Hollywood stars, and it was featured in several films. During World War II, the town was used as a military base, and it was home to several military installations. After the war, the town returned to its original purpose as a tourist destination.
Geography
Haleiwa is located on the North Shore of Oahu, Hawaii. It is situated on the Waialua Bay, and it is surrounded by the Waimea River and the Anahulu River. The town is located about 30 miles from Honolulu, and it is about a 45-minute drive from the city.
The town is known for its beautiful beaches, and it is a popular destination for surfers. The beaches are known for their large waves, and they are popular for surfing, bodyboarding, and stand-up paddleboarding. The town is also home to several parks, including Waimea Valley, which is a botanical garden and cultural center.
Economy
Haleiwa’s economy is largely based on tourism. The town is a popular destination for tourists, and it is known for its beautiful beaches and surfing. The town is home to several hotels, restaurants, and shops, and it is a popular destination for shopping and dining.
The town is also home to several businesses, including a brewery, a distillery, and a winery. The town is also home to several art galleries, and it is a popular destination for art lovers.
Demographics
Haleiwa has a population of approximately 2,000 people. The town is predominantly white, with about 75% of the population being white. The town is also home to a large Native Hawaiian population, with about 20% of the population being Native Hawaiian. The town is also home to a small Asian population, with about 5% of the population being Asian.
The town has a median household income of about $60,000, and the median home value is about $500,000. The town has a low unemployment rate, and the cost of living is relatively low.
Conclusion
Haleiwa is a small town located on the North Shore of Oahu, Hawaii. It is a popular tourist destination and is known for its beautiful beaches, surfing, and laid-back atmosphere. The town has a population of approximately 2,000 people and is located about 30 miles from Honolulu. The town’s economy is largely based on tourism, and it is home to several businesses, including a brewery, a distillery, and a winery. The town is predominantly white, with about 75% of the population being white, and it has a median household income of about $60,000.
Common Questions
What is the Total Population of Haleiwa?
Total Population of Haleiwa is 4,708.
What is the Total Male Population of Haleiwa?
Total Male Population of Haleiwa is 2,278.
What is the Total Female Population of Haleiwa?
Total Female Population of Haleiwa is 2,430.
What is the Ratio of Males per 100 Females in Haleiwa?
There are 93.74 Males per 100 Females in Haleiwa.
What is the Ratio of Females per 100 Males in Haleiwa?
There are 106.67 Females per 100 Males in Haleiwa.
What is the Median Population Age in Haleiwa?
Median Population Age in Haleiwa is 43.8 Years.
What is the Average Family Size in Haleiwa
Average Family Size in Haleiwa is 3.8 People.
What is the Average Household Size in Haleiwa
Average Household Size in Haleiwa is 3.1 People.
What is Per Capita Income in Haleiwa?
Per Capita income in Haleiwa is $41,206.
What is the Median Family Income in Haleiwa?
Median Family Income in Haleiwa is $115,134.
What is the Median Household income in Haleiwa?
Median Household Income in Haleiwa is $92,173.
What is Income or Wage Gap in Haleiwa?
Income or Wage Gap in Haleiwa is 0.5%.
Women in Haleiwa earn 99.5 cents for every dollar earned by a man.
What is Inequality or Gini Index in Haleiwa?
Inequality or Gini Index in Haleiwa is 0.42.
How Large is the Labor Force in Haleiwa?
There are 2,523 People in the Labor Forcein in Haleiwa.
What is the Percentage of People in the Labor Force in Haleiwa?
64.7% of People are in the Labor Force in Haleiwa.
What is the Unemployment Rate in Haleiwa?
Unemployment Rate in Haleiwa is 4.3%.