Pupukea, HI
Pupukea Map
Pupukea Overview
5,130
TOTAL POPULATION
2,579
MALE POPULATION
2,551
FEMALE POPULATION
101.10
MALES / 100 FEMALES
98.91
FEMALES / 100 MALES
39.7
MEDIAN AGE
3.9
AVG FAMILY SIZE
3.3
AVG HOUSEHOLD SIZE
$42,594
PER CAPITA INCOME
$134,716
AVG FAMILY INCOME
$99,180
AVG HOUSEHOLD INCOME
18.4%
WAGE / INCOME GAP [ % ]
81.6¢/ $1
WAGE / INCOME GAP [ $ ]
0.44
INEQUALITY / GINI INDEX
2,567
LABOR FORCE [ PEOPLE ]
60.2%
PERCENT IN LABOR FORCE
6.2%
UNEMPLOYMENT RATE
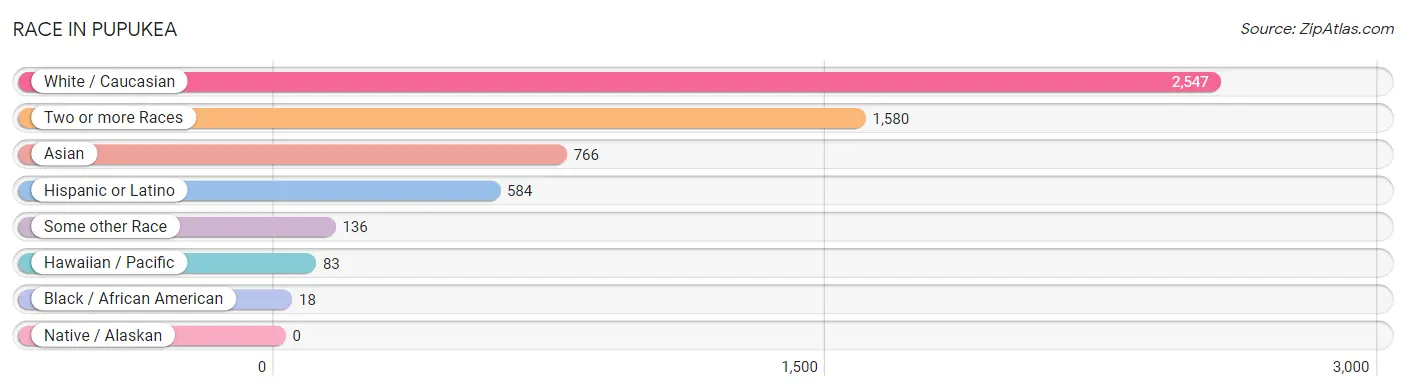
Race in Pupukea
The most populous races in Pupukea are White / Caucasian (2,547 | 49.6%), Two or more Races (1,580 | 30.8%), and Asian (766 | 14.9%).
| Race | # Population | % Population |
| Asian | 766 | 14.9% |
| Black / African American | 18 | 0.4% |
| Hawaiian / Pacific | 83 | 1.6% |
| Hispanic or Latino | 584 | 11.4% |
| Native / Alaskan | 0 | 0.0% |
| White / Caucasian | 2,547 | 49.6% |
| Two or more Races | 1,580 | 30.8% |
| Some other Race | 136 | 2.6% |
| Total | 5,130 | 100.0% |
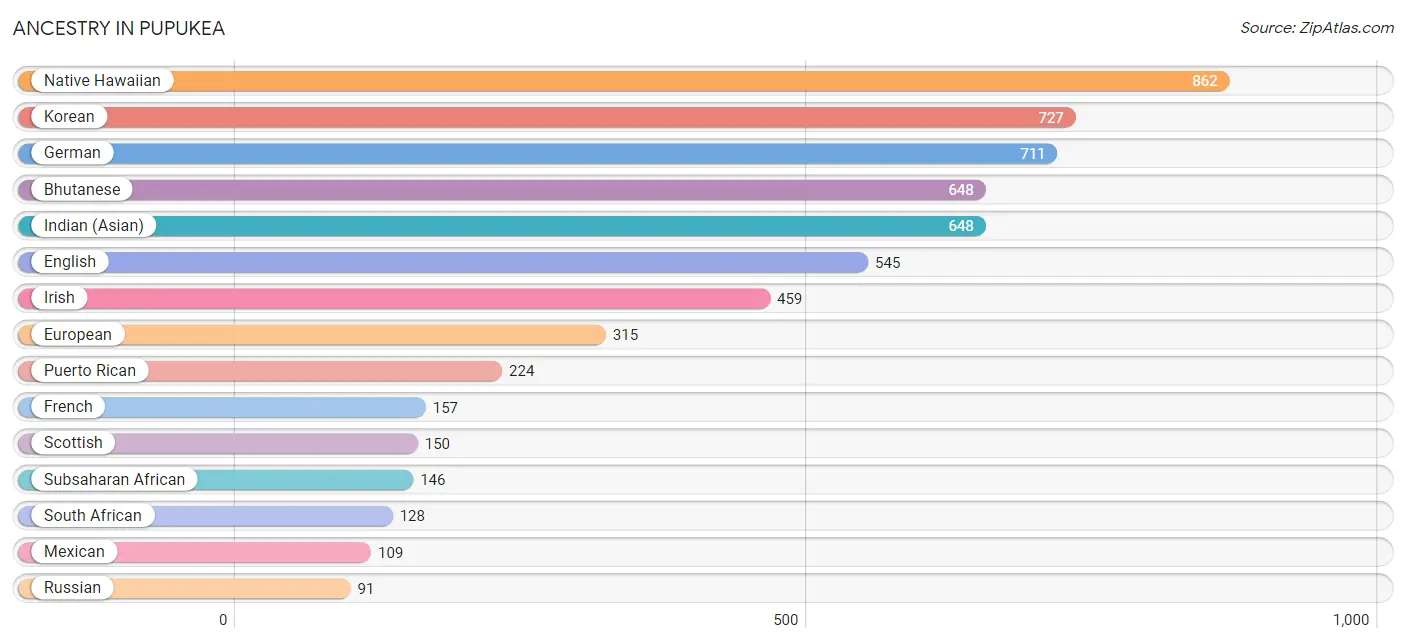
Ancestry in Pupukea
The most populous ancestries reported in Pupukea are Native Hawaiian (862 | 16.8%), Korean (727 | 14.2%), German (711 | 13.9%), Bhutanese (648 | 12.6%), and Indian (Asian) (648 | 12.6%), together accounting for 70.1% of all Pupukea residents.
| Ancestry | # Population | % Population |
| African | 18 | 0.4% |
| American | 31 | 0.6% |
| Australian | 9 | 0.2% |
| Bhutanese | 648 | 12.6% |
| Brazilian | 23 | 0.4% |
| Burmese | 35 | 0.7% |
| Central American Indian | 58 | 1.1% |
| Cherokee | 55 | 1.1% |
| Chippewa | 66 | 1.3% |
| Czech | 17 | 0.3% |
| Dutch | 15 | 0.3% |
| English | 545 | 10.6% |
| European | 315 | 6.1% |
| French | 157 | 3.1% |
| German | 711 | 13.9% |
| Greek | 5 | 0.1% |
| Hungarian | 33 | 0.6% |
| Indian (Asian) | 648 | 12.6% |
| Iranian | 14 | 0.3% |
| Irish | 459 | 8.9% |
| Italian | 86 | 1.7% |
| Korean | 727 | 14.2% |
| Mexican | 109 | 2.1% |
| Native Hawaiian | 862 | 16.8% |
| Northern European | 14 | 0.3% |
| Norwegian | 4 | 0.1% |
| Peruvian | 57 | 1.1% |
| Polish | 36 | 0.7% |
| Portuguese | 80 | 1.6% |
| Puerto Rican | 224 | 4.4% |
| Russian | 91 | 1.8% |
| Samoan | 62 | 1.2% |
| Scandinavian | 37 | 0.7% |
| Scotch-Irish | 32 | 0.6% |
| Scottish | 150 | 2.9% |
| South African | 128 | 2.5% |
| South American | 77 | 1.5% |
| Spanish | 43 | 0.8% |
| Subsaharan African | 146 | 2.9% |
| Swedish | 14 | 0.3% |
| Swiss | 33 | 0.6% |
| Thai | 14 | 0.3% |
| Ukrainian | 11 | 0.2% |
| Uruguayan | 20 | 0.4% |
| Welsh | 47 | 0.9% | View All 45 Rows |
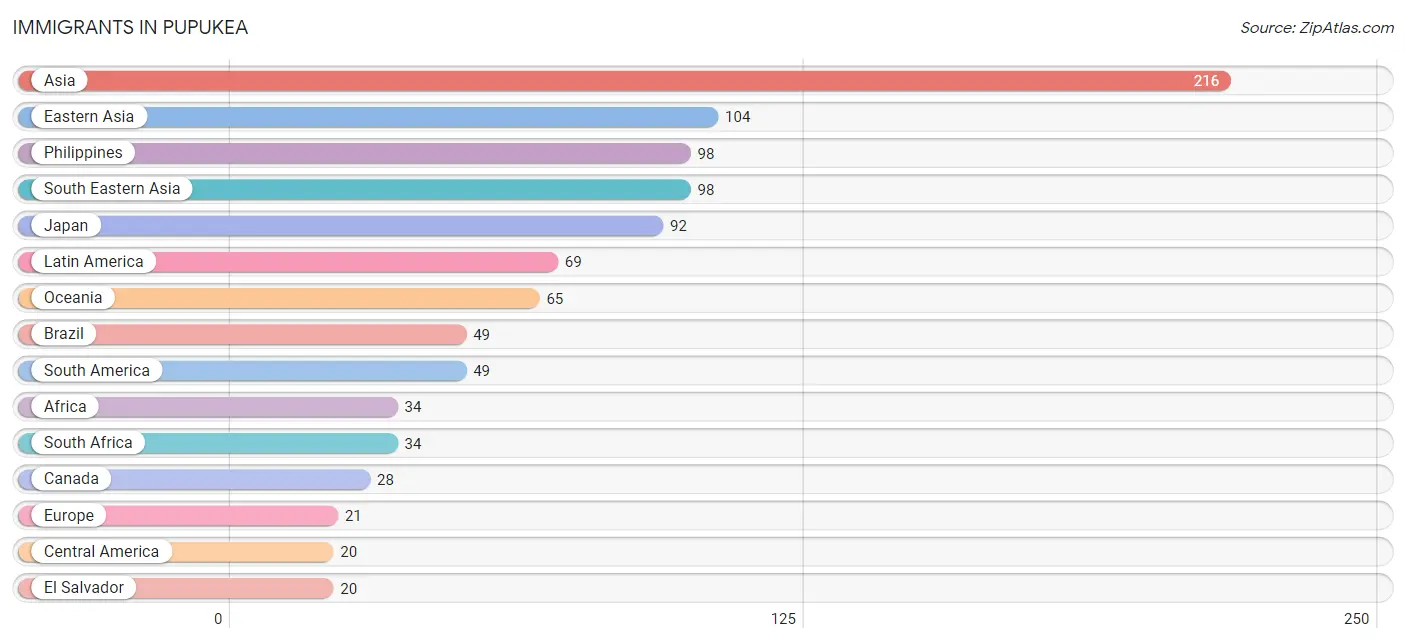
Immigrants in Pupukea
The most numerous immigrant groups reported in Pupukea came from Asia (216 | 4.2%), Eastern Asia (104 | 2.0%), Philippines (98 | 1.9%), South Eastern Asia (98 | 1.9%), and Japan (92 | 1.8%), together accounting for 11.8% of all Pupukea residents.
| Immigration Origin | # Population | % Population |
| Africa | 34 | 0.7% |
| Asia | 216 | 4.2% |
| Australia | 9 | 0.2% |
| Brazil | 49 | 1.0% |
| Canada | 28 | 0.5% |
| Central America | 20 | 0.4% |
| China | 6 | 0.1% |
| Eastern Asia | 104 | 2.0% |
| Eastern Europe | 8 | 0.2% |
| El Salvador | 20 | 0.4% |
| Europe | 21 | 0.4% |
| France | 13 | 0.3% |
| Iran | 14 | 0.3% |
| Japan | 92 | 1.8% |
| Korea | 6 | 0.1% |
| Latin America | 69 | 1.3% |
| Oceania | 65 | 1.3% |
| Philippines | 98 | 1.9% |
| Russia | 8 | 0.2% |
| South Africa | 34 | 0.7% |
| South America | 49 | 1.0% |
| South Central Asia | 14 | 0.3% |
| South Eastern Asia | 98 | 1.9% |
| Western Europe | 13 | 0.3% | View All 24 Rows |
Sex and Age in Pupukea
Sex and Age in Pupukea
The most populous age groups in Pupukea are 20 to 24 Years (255 | 9.9%) for men and 65 to 69 Years (312 | 12.2%) for women.
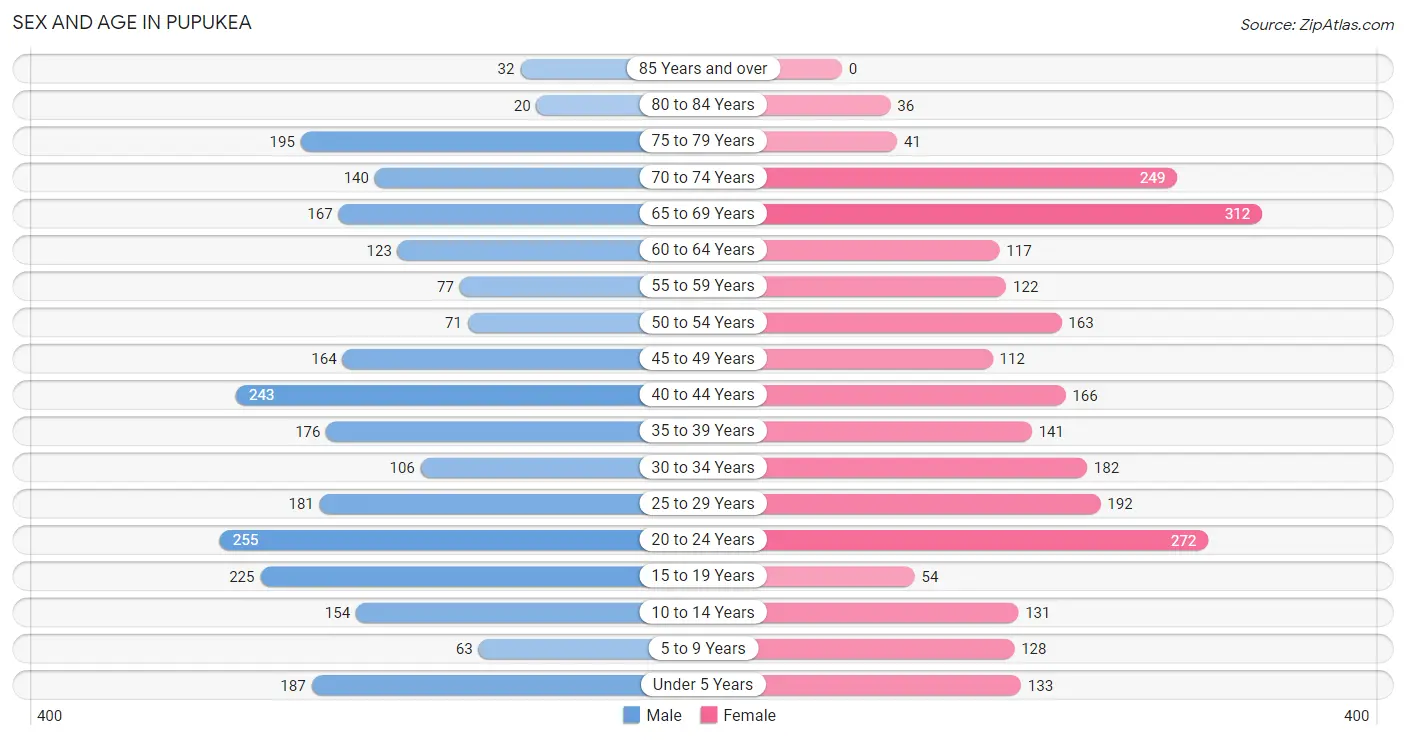
| Age Bracket | Male | Female |
| Under 5 Years | 187 (7.2%) | 133 (5.2%) |
| 5 to 9 Years | 63 (2.4%) | 128 (5.0%) |
| 10 to 14 Years | 154 (6.0%) | 131 (5.1%) |
| 15 to 19 Years | 225 (8.7%) | 54 (2.1%) |
| 20 to 24 Years | 255 (9.9%) | 272 (10.7%) |
| 25 to 29 Years | 181 (7.0%) | 192 (7.5%) |
| 30 to 34 Years | 106 (4.1%) | 182 (7.1%) |
| 35 to 39 Years | 176 (6.8%) | 141 (5.5%) |
| 40 to 44 Years | 243 (9.4%) | 166 (6.5%) |
| 45 to 49 Years | 164 (6.4%) | 112 (4.4%) |
| 50 to 54 Years | 71 (2.8%) | 163 (6.4%) |
| 55 to 59 Years | 77 (3.0%) | 122 (4.8%) |
| 60 to 64 Years | 123 (4.8%) | 117 (4.6%) |
| 65 to 69 Years | 167 (6.5%) | 312 (12.2%) |
| 70 to 74 Years | 140 (5.4%) | 249 (9.8%) |
| 75 to 79 Years | 195 (7.6%) | 41 (1.6%) |
| 80 to 84 Years | 20 (0.8%) | 36 (1.4%) |
| 85 Years and over | 32 (1.2%) | 0 (0.0%) |
| Total | 2,579 (100.0%) | 2,551 (100.0%) |
Families and Households in Pupukea
Median Family Size in Pupukea
The median family size in Pupukea is 3.87 persons per family, with single female/mother families (149 | 15.7%) accounting for the largest median family size of 5.61 persons per family. On the other hand, single male/father families (64 | 6.7%) represent the smallest median family size with 2.41 persons per family.
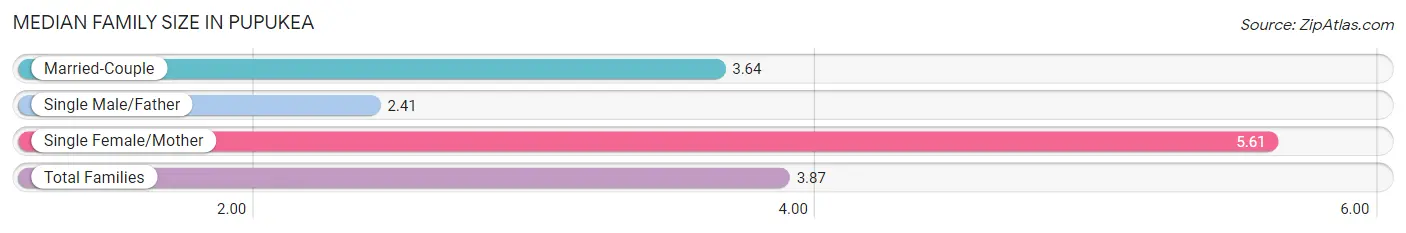
| Family Type | # Families | Family Size |
| Married-Couple | 738 (77.6%) | 3.64 |
| Single Male/Father | 64 (6.7%) | 2.41 |
| Single Female/Mother | 149 (15.7%) | 5.61 |
| Total Families | 951 (100.0%) | 3.87 |
Median Household Size in Pupukea
The median household size in Pupukea is 3.32 persons per household, with single female/mother households (149 | 9.7%) accounting for the largest median household size of 5.83 persons per household. non-family households (592 | 38.4%) represent the smallest median household size with 2.09 persons per household.
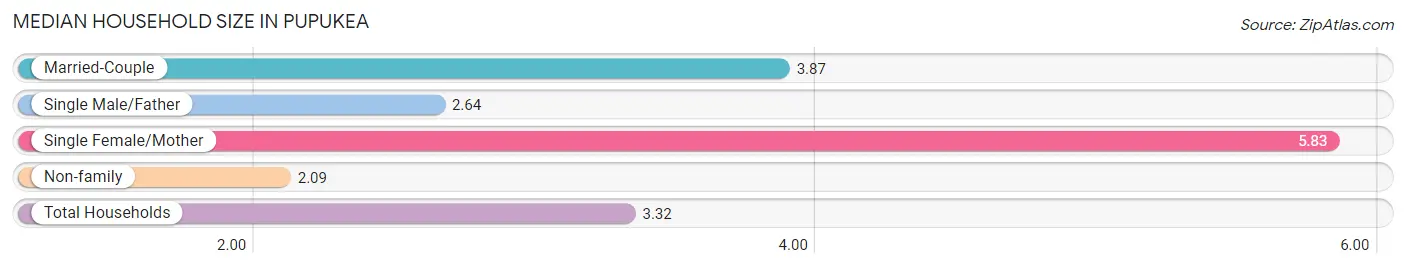
| Household Type | # Households | Household Size |
| Married-Couple | 738 (47.8%) | 3.87 |
| Single Male/Father | 64 (4.2%) | 2.64 |
| Single Female/Mother | 149 (9.7%) | 5.83 |
| Non-family | 592 (38.4%) | 2.09 |
| Total Households | 1,543 (100.0%) | 3.32 |
Household Size by Marriage Status in Pupukea
Out of a total of 1,543 households in Pupukea, 951 (61.6%) are family households, while 592 (38.4%) are nonfamily households. The most numerous type of family households are 2-person households, comprising 423, and the most common type of nonfamily households are 1-person households, comprising 234.
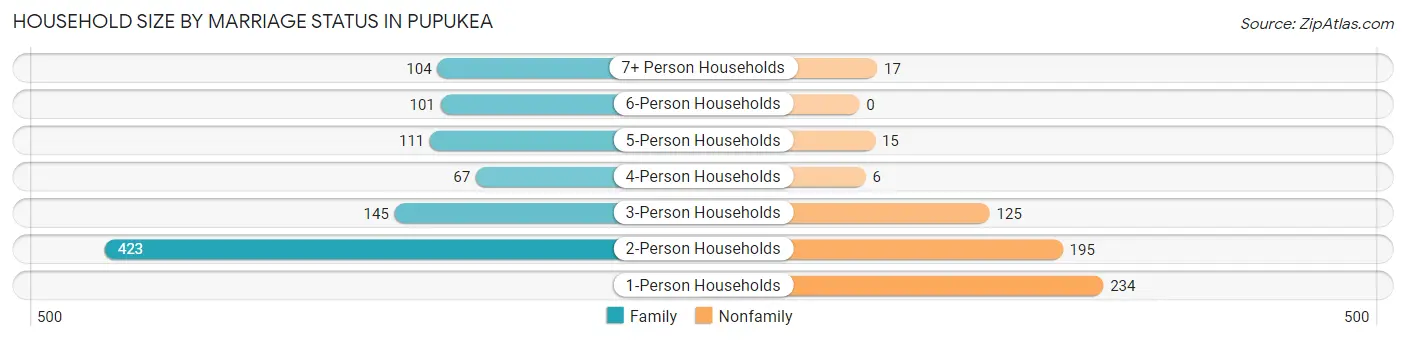
| Household Size | Family Households | Nonfamily Households |
| 1-Person Households | - | 234 (15.2%) |
| 2-Person Households | 423 (27.4%) | 195 (12.6%) |
| 3-Person Households | 145 (9.4%) | 125 (8.1%) |
| 4-Person Households | 67 (4.3%) | 6 (0.4%) |
| 5-Person Households | 111 (7.2%) | 15 (1.0%) |
| 6-Person Households | 101 (6.6%) | 0 (0.0%) |
| 7+ Person Households | 104 (6.7%) | 17 (1.1%) |
| Total | 951 (61.6%) | 592 (38.4%) |
Female Fertility in Pupukea
Fertility by Age in Pupukea
Average fertility rate in Pupukea is 29.0 births per 1,000 women. Women in the age bracket of 35 to 50 years have the highest fertility rate with 79.0 births per 1,000 women. Women in the age bracket of 35 to 50 years acount for 100.0% of all women with births.
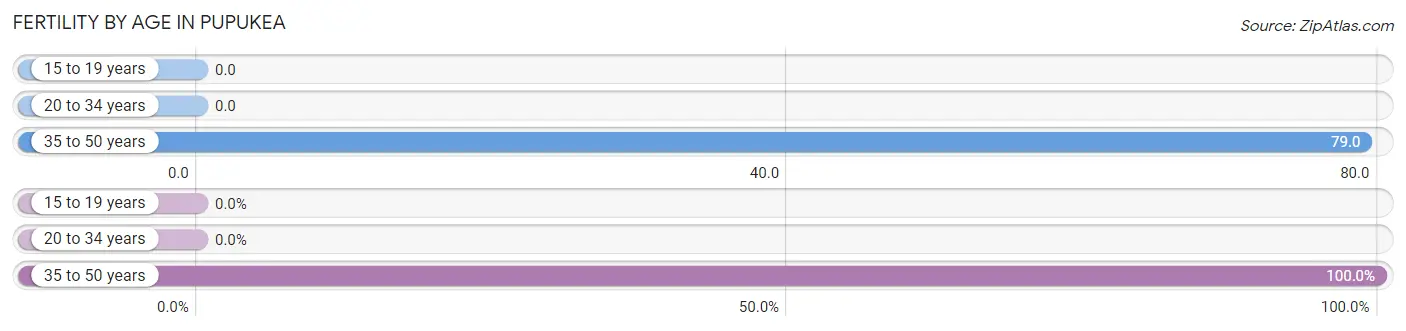
| Age Bracket | Women with Births | Births / 1,000 Women |
| 15 to 19 years | 0 (0.0%) | 0.0 |
| 20 to 34 years | 0 (0.0%) | 0.0 |
| 35 to 50 years | 33 (100.0%) | 79.0 |
| Total | 33 (100.0%) | 29.0 |
Fertility by Age by Marriage Status in Pupukea
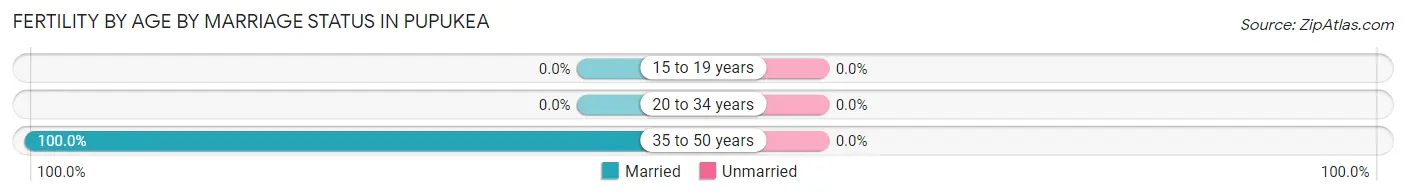
| Age Bracket | Married | Unmarried |
| 15 to 19 years | 0 (0.0%) | 0 (0.0%) |
| 20 to 34 years | 0 (0.0%) | 0 (0.0%) |
| 35 to 50 years | 33 (100.0%) | 0 (0.0%) |
| Total | 33 (100.0%) | 0 (0.0%) |
Fertility by Education in Pupukea
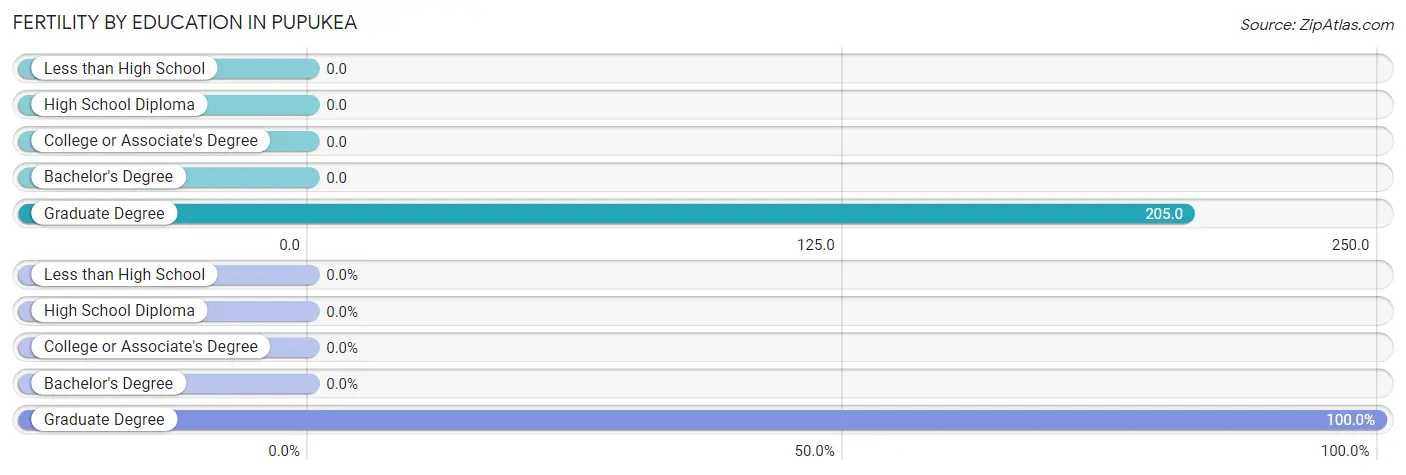
| Educational Attainment | Women with Births | Births / 1,000 Women |
| Less than High School | 0 (0.0%) | 0.0 |
| High School Diploma | 0 (0.0%) | 0.0 |
| College or Associate's Degree | 0 (0.0%) | 0.0 |
| Bachelor's Degree | 0 (0.0%) | 0.0 |
| Graduate Degree | 33 (100.0%) | 205.0 |
| Total | 33 (100.0%) | 29.0 |
Fertility by Education by Marriage Status in Pupukea
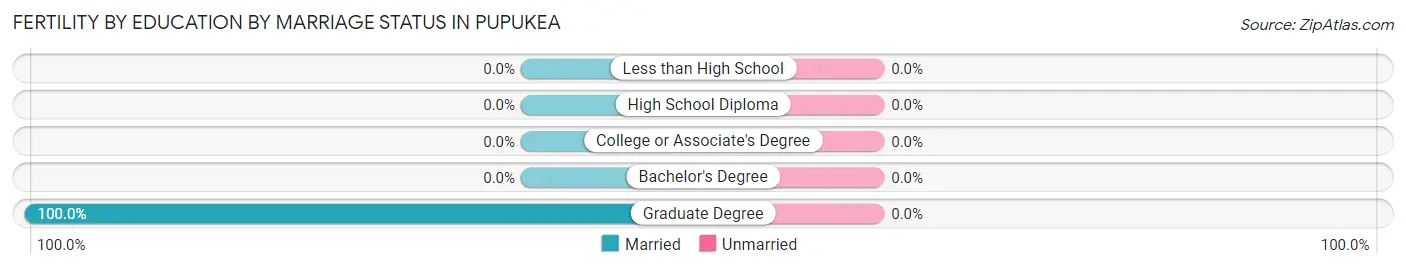
| Educational Attainment | Married | Unmarried |
| Less than High School | 0 (0.0%) | 0 (0.0%) |
| High School Diploma | 0 (0.0%) | 0 (0.0%) |
| College or Associate's Degree | 0 (0.0%) | 0 (0.0%) |
| Bachelor's Degree | 0 (0.0%) | 0 (0.0%) |
| Graduate Degree | 33 (100.0%) | 0 (0.0%) |
| Total | 33 (100.0%) | 0 (0.0%) |
Income in Pupukea
Income Overview in Pupukea
Per Capita Income in Pupukea is $42,594, while median incomes of families and households are $134,716 and $99,180 respectively.
| Characteristic | Number | Measure |
| Per Capita Income | 5,130 | $42,594 |
| Median Family Income | 951 | $134,716 |
| Mean Family Income | 951 | $164,656 |
| Median Household Income | 1,543 | $99,180 |
| Mean Household Income | 1,543 | $134,590 |
| Income Deficit | 951 | $0 |
| Wage / Income Gap (%) | 5,130 | 18.40% |
| Wage / Income Gap ($) | 5,130 | 81.60¢ per $1 |
| Gini / Inequality Index | 5,130 | 0.44 |
Earnings by Sex in Pupukea
Average Earnings in Pupukea are $41,250, $45,446 for men and $37,083 for women, a difference of 18.4%.
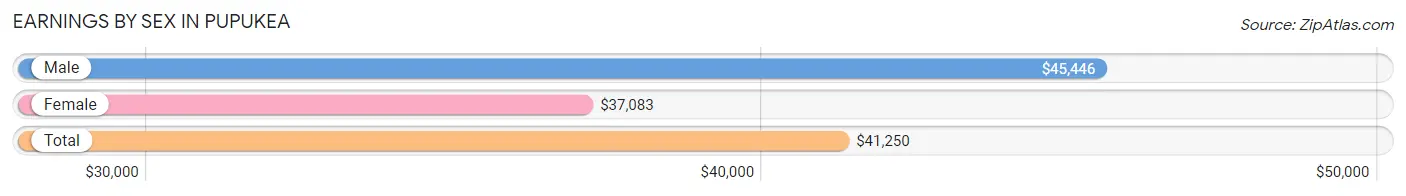
| Sex | Number | Average Earnings |
| Male | 1,498 (54.6%) | $45,446 |
| Female | 1,244 (45.4%) | $37,083 |
| Total | 2,742 (100.0%) | $41,250 |
Earnings by Sex by Income Bracket in Pupukea
The most common earnings brackets in Pupukea are $100,000+ for men (314 | 21.0%) and $2,499 or less for women (147 | 11.8%).
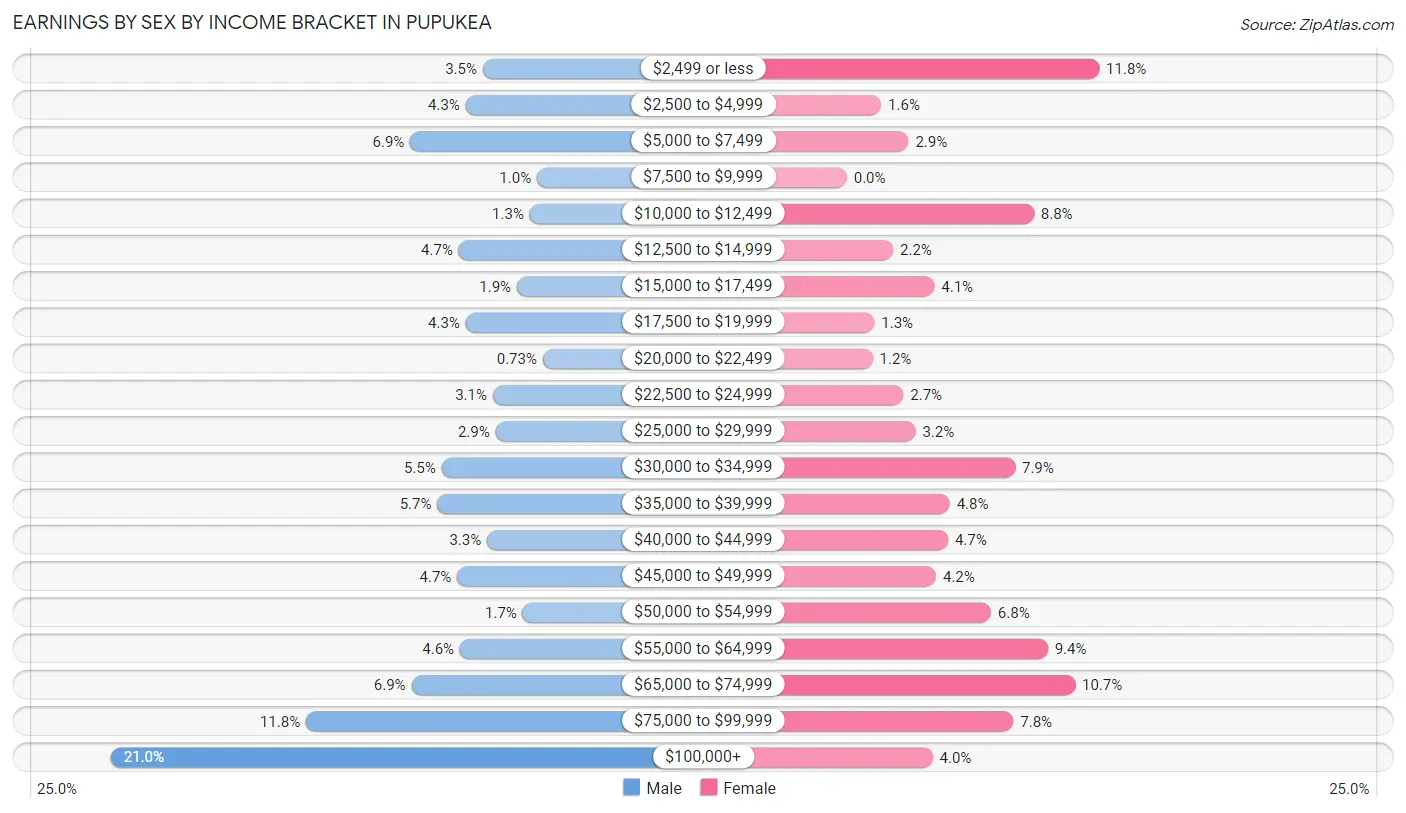
| Income | Male | Female |
| $2,499 or less | 53 (3.5%) | 147 (11.8%) |
| $2,500 to $4,999 | 65 (4.3%) | 20 (1.6%) |
| $5,000 to $7,499 | 104 (6.9%) | 36 (2.9%) |
| $7,500 to $9,999 | 15 (1.0%) | 0 (0.0%) |
| $10,000 to $12,499 | 20 (1.3%) | 109 (8.8%) |
| $12,500 to $14,999 | 70 (4.7%) | 27 (2.2%) |
| $15,000 to $17,499 | 29 (1.9%) | 51 (4.1%) |
| $17,500 to $19,999 | 65 (4.3%) | 16 (1.3%) |
| $20,000 to $22,499 | 11 (0.7%) | 15 (1.2%) |
| $22,500 to $24,999 | 46 (3.1%) | 33 (2.6%) |
| $25,000 to $29,999 | 44 (2.9%) | 40 (3.2%) |
| $30,000 to $34,999 | 82 (5.5%) | 98 (7.9%) |
| $35,000 to $39,999 | 85 (5.7%) | 60 (4.8%) |
| $40,000 to $44,999 | 50 (3.3%) | 59 (4.7%) |
| $45,000 to $49,999 | 71 (4.7%) | 52 (4.2%) |
| $50,000 to $54,999 | 25 (1.7%) | 84 (6.8%) |
| $55,000 to $64,999 | 69 (4.6%) | 117 (9.4%) |
| $65,000 to $74,999 | 103 (6.9%) | 133 (10.7%) |
| $75,000 to $99,999 | 177 (11.8%) | 97 (7.8%) |
| $100,000+ | 314 (21.0%) | 50 (4.0%) |
| Total | 1,498 (100.0%) | 1,244 (100.0%) |
Earnings by Sex by Educational Attainment in Pupukea
Average earnings in Pupukea are $58,750 for men and $40,568 for women, a difference of 30.9%. Men with an educational attainment of graduate degree enjoy the highest average annual earnings of $127,593, while those with high school diploma education earn the least with $40,703. Women with an educational attainment of college or associate's degree earn the most with the average annual earnings of $52,132, while those with less than high school education have the smallest earnings of $30,639.
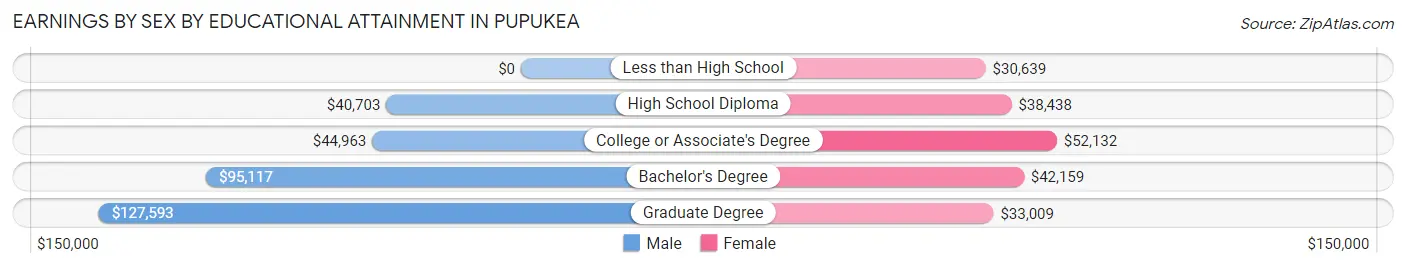
| Educational Attainment | Male Income | Female Income |
| Less than High School | - | - |
| High School Diploma | $40,703 | $38,438 |
| College or Associate's Degree | $44,963 | $52,132 |
| Bachelor's Degree | $95,117 | $42,159 |
| Graduate Degree | $127,593 | $33,009 |
| Total | $58,750 | $40,568 |
Family Income in Pupukea
Family Income Brackets in Pupukea
According to the Pupukea family income data, there are 302 families falling into the $200,000+ income range, which is the most common income bracket and makes up 31.8% of all families.
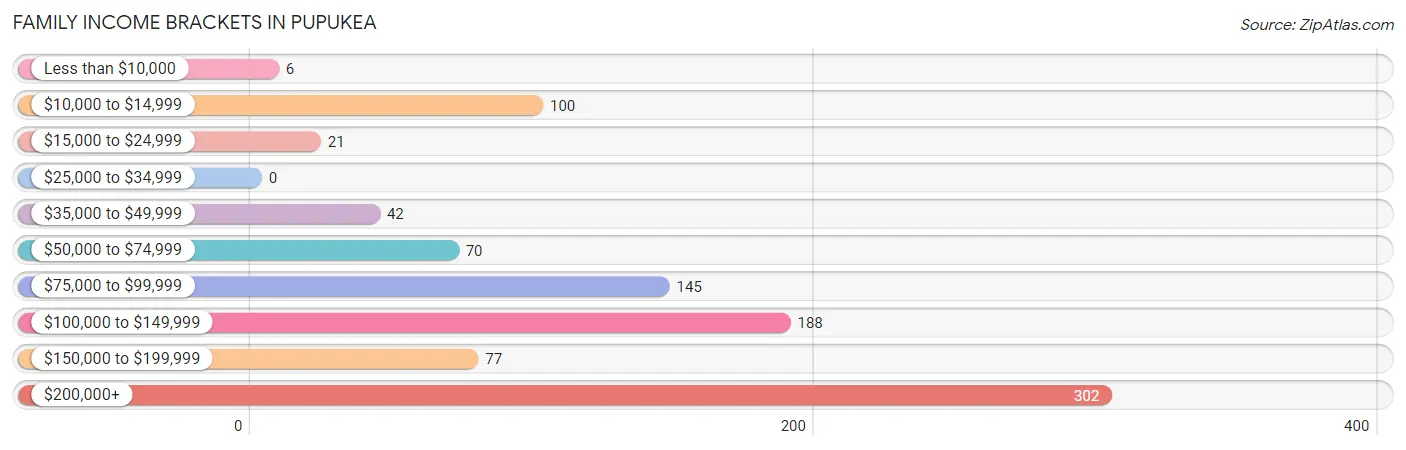
| Income Bracket | # Families | % Families |
| Less than $10,000 | 6 | 0.6% |
| $10,000 to $14,999 | 100 | 10.5% |
| $15,000 to $24,999 | 21 | 2.2% |
| $25,000 to $34,999 | 0 | 0.0% |
| $35,000 to $49,999 | 42 | 4.4% |
| $50,000 to $74,999 | 70 | 7.4% |
| $75,000 to $99,999 | 145 | 15.2% |
| $100,000 to $149,999 | 188 | 19.8% |
| $150,000 to $199,999 | 77 | 8.1% |
| $200,000+ | 302 | 31.8% |
Family Income by Famaliy Size in Pupukea
6-person families (101 | 10.6%) account for the highest median family income in Pupukea with $250,001 per family, while 3-person families (165 | 17.3%) have the highest median income of $49,370 per family member.
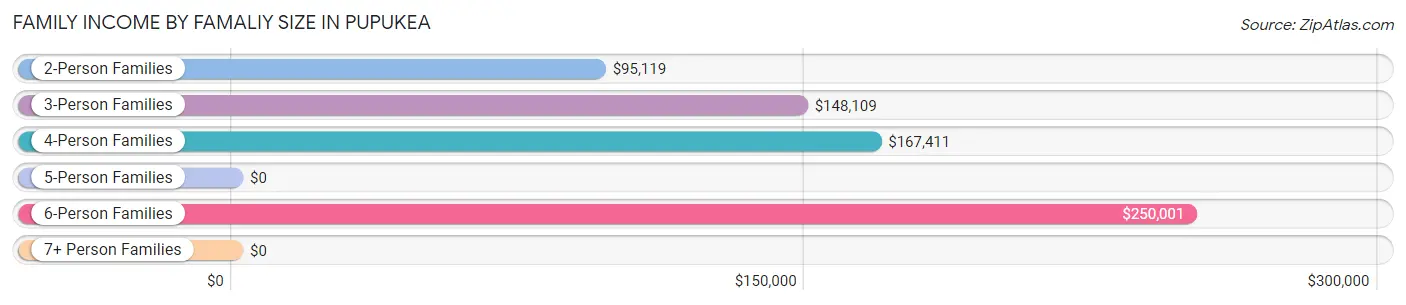
| Income Bracket | # Families | Median Income |
| 2-Person Families | 436 (45.9%) | $95,119 |
| 3-Person Families | 165 (17.3%) | $148,109 |
| 4-Person Families | 69 (7.3%) | $167,411 |
| 5-Person Families | 121 (12.7%) | $0 |
| 6-Person Families | 101 (10.6%) | $250,001 |
| 7+ Person Families | 59 (6.2%) | $0 |
| Total | 951 (100.0%) | $134,716 |
Family Income by Number of Earners in Pupukea
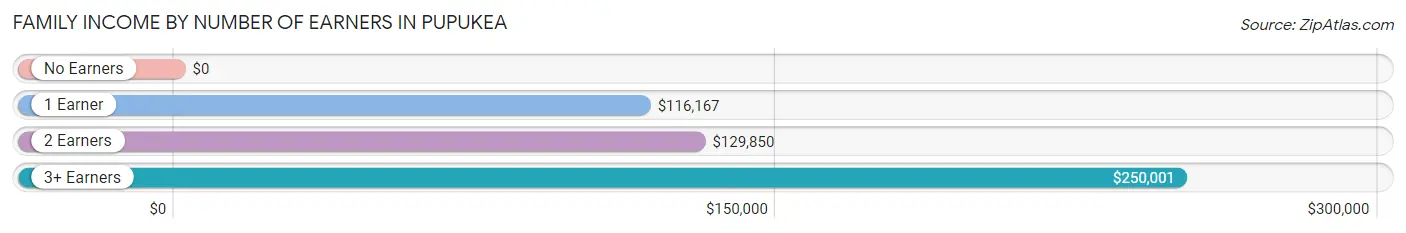
| Number of Earners | # Families | Median Income |
| No Earners | 176 (18.5%) | $0 |
| 1 Earner | 210 (22.1%) | $116,167 |
| 2 Earners | 325 (34.2%) | $129,850 |
| 3+ Earners | 240 (25.2%) | $250,001 |
| Total | 951 (100.0%) | $134,716 |
Household Income in Pupukea
Household Income Brackets in Pupukea
With 346 households falling in the category, the $100,000 to $149,999 income range is the most frequent in Pupukea, accounting for 22.4% of all households. In contrast, only 31 households (2.0%) fall into the $25,000 to $34,999 income bracket, making it the least populous group.
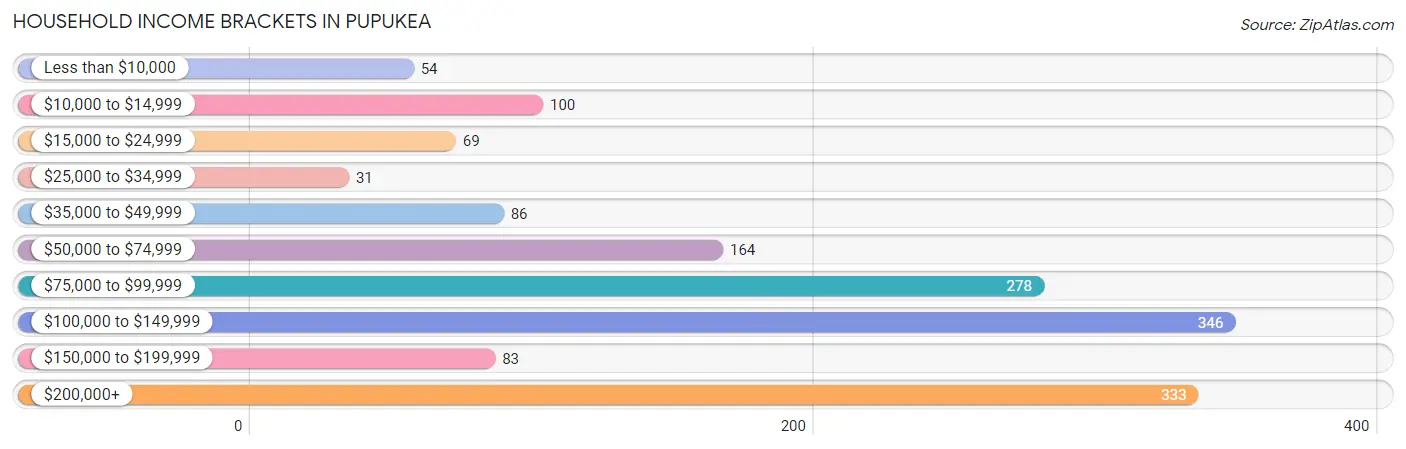
| Income Bracket | # Households | % Households |
| Less than $10,000 | 54 | 3.5% |
| $10,000 to $14,999 | 100 | 6.5% |
| $15,000 to $24,999 | 69 | 4.5% |
| $25,000 to $34,999 | 31 | 2.0% |
| $35,000 to $49,999 | 86 | 5.6% |
| $50,000 to $74,999 | 164 | 10.6% |
| $75,000 to $99,999 | 278 | 18.0% |
| $100,000 to $149,999 | 346 | 22.4% |
| $150,000 to $199,999 | 83 | 5.4% |
| $200,000+ | 333 | 21.6% |
Household Income by Householder Age in Pupukea
The median household income in Pupukea is $99,180, with the highest median household income of $147,784 found in the 45 to 64 years age bracket for the primary householder. A total of 380 households (24.6%) fall into this category. Meanwhile, the 15 to 24 years age bracket for the primary householder has the lowest median household income of $0, with 116 households (7.5%) in this group.
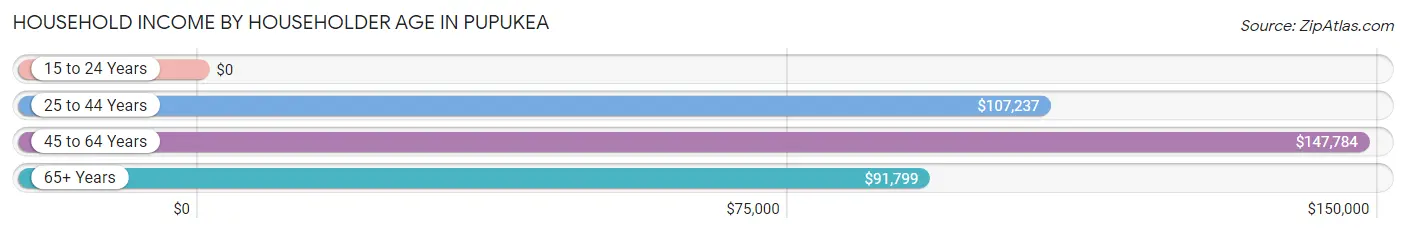
| Income Bracket | # Households | Median Income |
| 15 to 24 Years | 116 (7.5%) | $0 |
| 25 to 44 Years | 384 (24.9%) | $107,237 |
| 45 to 64 Years | 380 (24.6%) | $147,784 |
| 65+ Years | 663 (43.0%) | $91,799 |
| Total | 1,543 (100.0%) | $99,180 |
Poverty in Pupukea
Income Below Poverty by Sex and Age in Pupukea
With 17.8% poverty level for males and 10.3% for females among the residents of Pupukea, 75 year old and over males and 18 to 24 year old females are the most vulnerable to poverty, with 156 males (63.2%) and 84 females (30.9%) in their respective age groups living below the poverty level.
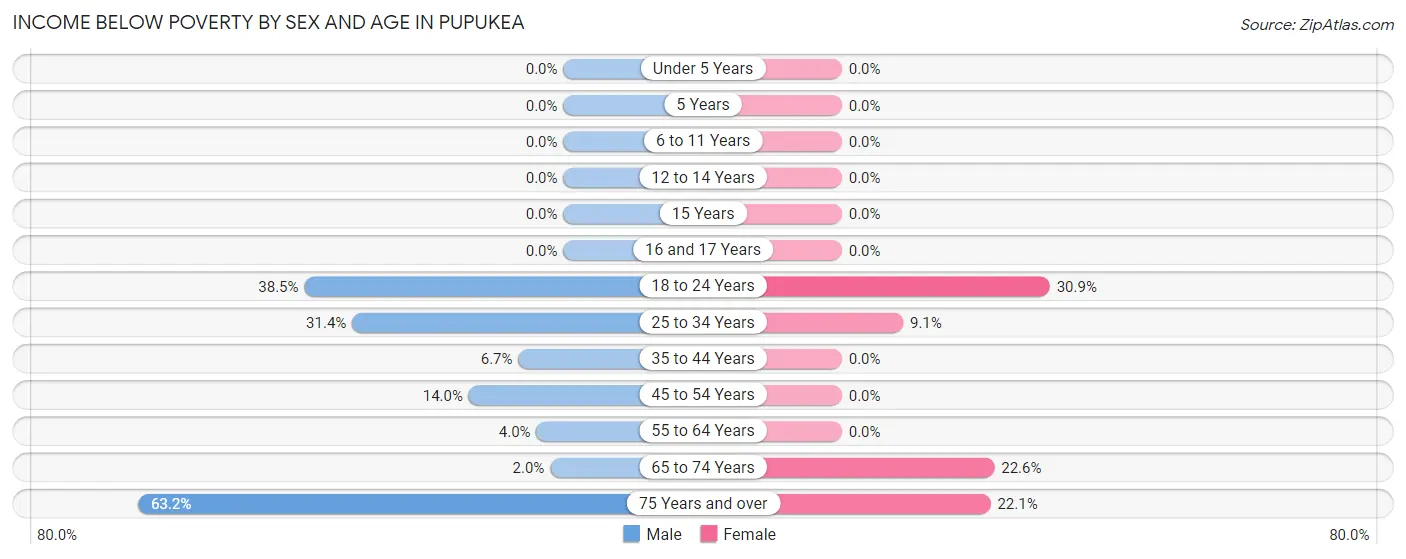
| Age Bracket | Male | Female |
| Under 5 Years | 0 (0.0%) | 0 (0.0%) |
| 5 Years | 0 (0.0%) | 0 (0.0%) |
| 6 to 11 Years | 0 (0.0%) | 0 (0.0%) |
| 12 to 14 Years | 0 (0.0%) | 0 (0.0%) |
| 15 Years | 0 (0.0%) | 0 (0.0%) |
| 16 and 17 Years | 0 (0.0%) | 0 (0.0%) |
| 18 to 24 Years | 115 (38.5%) | 84 (30.9%) |
| 25 to 34 Years | 90 (31.4%) | 34 (9.1%) |
| 35 to 44 Years | 28 (6.7%) | 0 (0.0%) |
| 45 to 54 Years | 33 (14.0%) | 0 (0.0%) |
| 55 to 64 Years | 8 (4.0%) | 0 (0.0%) |
| 65 to 74 Years | 6 (1.9%) | 127 (22.6%) |
| 75 Years and over | 156 (63.2%) | 17 (22.1%) |
| Total | 436 (17.8%) | 262 (10.3%) |
Income Above Poverty by Sex and Age in Pupukea
According to the poverty statistics in Pupukea, males aged under 5 years and females aged under 5 years are the age groups that are most secure financially, with 100.0% of males and 100.0% of females in these age groups living above the poverty line.
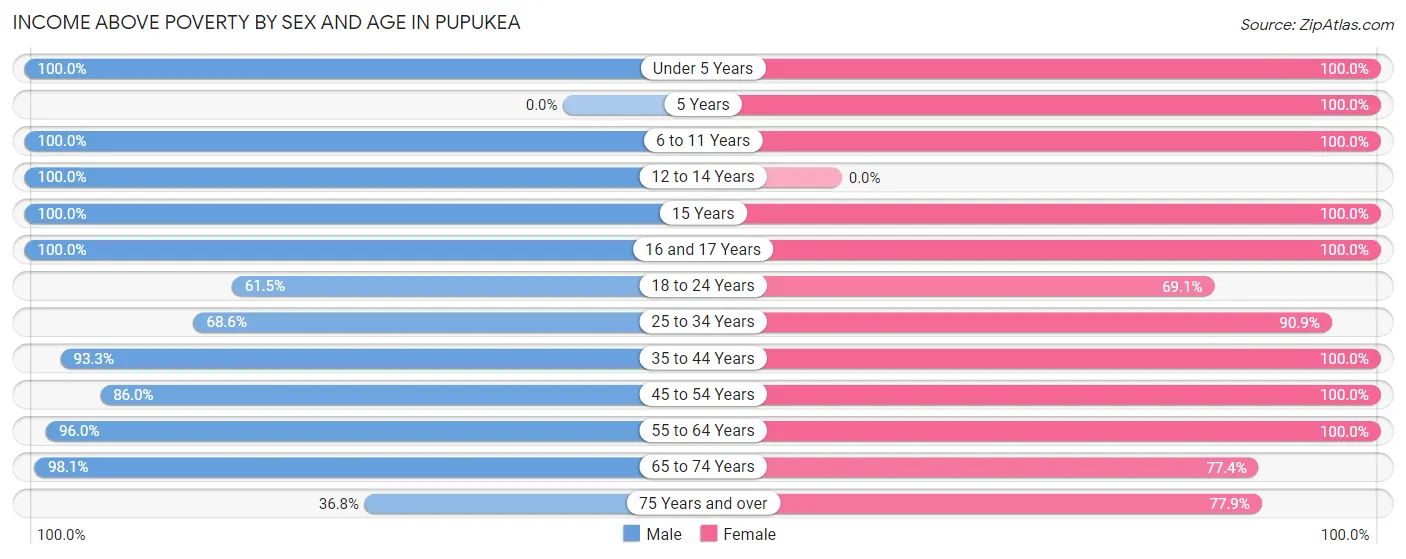
| Age Bracket | Male | Female |
| Under 5 Years | 93 (100.0%) | 133 (100.0%) |
| 5 Years | 0 (0.0%) | 18 (100.0%) |
| 6 to 11 Years | 70 (100.0%) | 241 (100.0%) |
| 12 to 14 Years | 108 (100.0%) | 0 (0.0%) |
| 15 Years | 34 (100.0%) | 36 (100.0%) |
| 16 and 17 Years | 147 (100.0%) | 18 (100.0%) |
| 18 to 24 Years | 184 (61.5%) | 188 (69.1%) |
| 25 to 34 Years | 197 (68.6%) | 340 (90.9%) |
| 35 to 44 Years | 391 (93.3%) | 307 (100.0%) |
| 45 to 54 Years | 202 (86.0%) | 275 (100.0%) |
| 55 to 64 Years | 192 (96.0%) | 239 (100.0%) |
| 65 to 74 Years | 301 (98.1%) | 434 (77.4%) |
| 75 Years and over | 91 (36.8%) | 60 (77.9%) |
| Total | 2,010 (82.2%) | 2,289 (89.7%) |
Income Below Poverty Among Married-Couple Families in Pupukea
The poverty statistics for married-couple families in Pupukea show that 14.4% or 106 of the total 738 families live below the poverty line. Families with no children have the highest poverty rate of 22.6%, comprising of 106 families. On the other hand, families with 1 or 2 children have the lowest poverty rate of 0.0%, which includes 0 families.
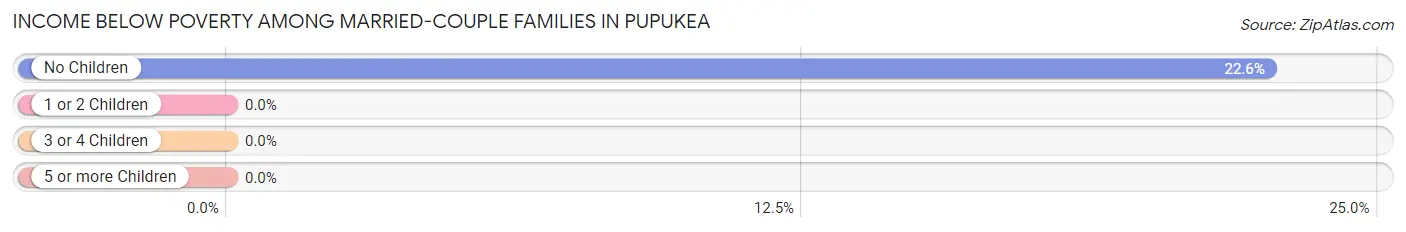
| Children | Above Poverty | Below Poverty |
| No Children | 363 (77.4%) | 106 (22.6%) |
| 1 or 2 Children | 186 (100.0%) | 0 (0.0%) |
| 3 or 4 Children | 83 (100.0%) | 0 (0.0%) |
| 5 or more Children | 0 (0.0%) | 0 (0.0%) |
| Total | 632 (85.6%) | 106 (14.4%) |
Income Below Poverty Among Single-Parent Households in Pupukea
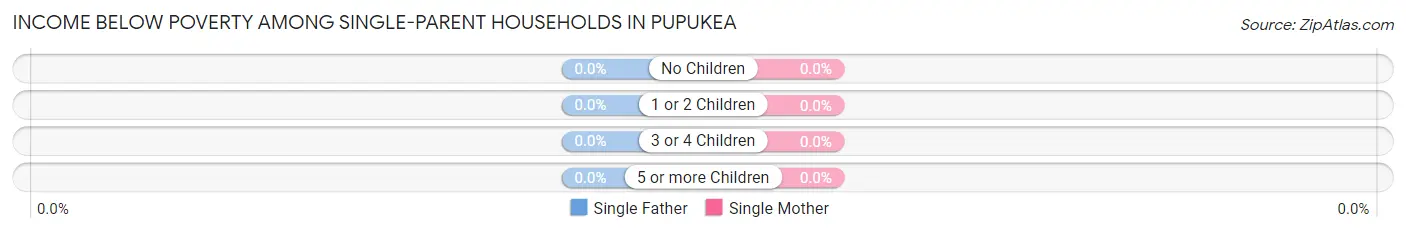
| Children | Single Father | Single Mother |
| No Children | 0 (0.0%) | 0 (0.0%) |
| 1 or 2 Children | 0 (0.0%) | 0 (0.0%) |
| 3 or 4 Children | 0 (0.0%) | 0 (0.0%) |
| 5 or more Children | 0 (0.0%) | 0 (0.0%) |
| Total | 0 (0.0%) | 0 (0.0%) |
Income Below Poverty Among Married-Couple vs Single-Parent Households in Pupukea
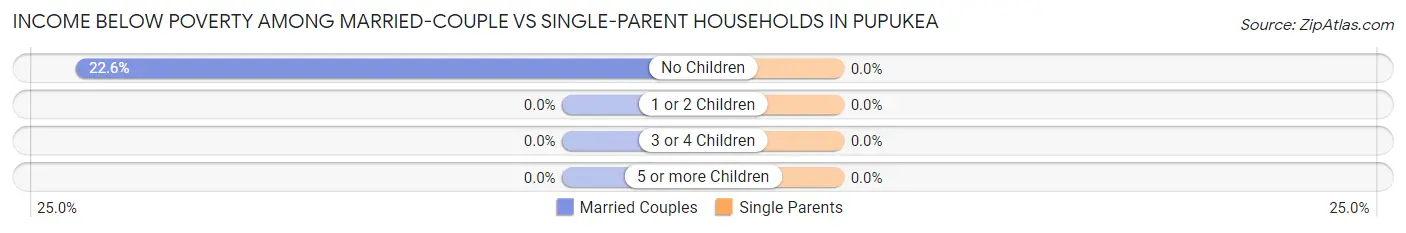
| Children | Married-Couple Families | Single-Parent Households |
| No Children | 106 (22.6%) | 0 (0.0%) |
| 1 or 2 Children | 0 (0.0%) | 0 (0.0%) |
| 3 or 4 Children | 0 (0.0%) | 0 (0.0%) |
| 5 or more Children | 0 (0.0%) | 0 (0.0%) |
| Total | 106 (14.4%) | 0 (0.0%) |
Employment Characteristics in Pupukea
Employment by Class of Employer in Pupukea
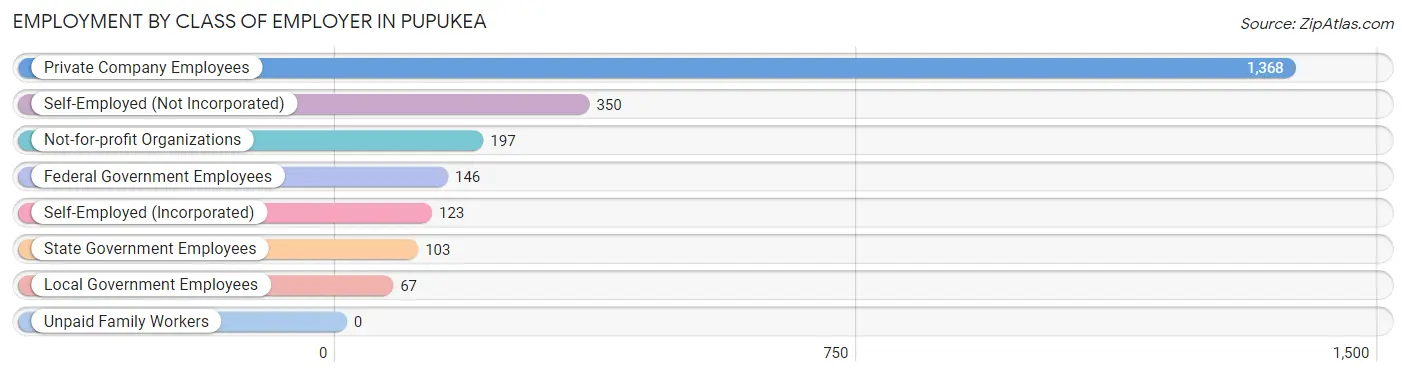
Among the 2,354 employed individuals in Pupukea, private company employees (1,368 | 58.1%), self-employed (not incorporated) (350 | 14.9%), and not-for-profit organizations (197 | 8.4%) make up the most common classes of employment.
| Employer Class | # Employees | % Employees |
| Private Company Employees | 1,368 | 58.1% |
| Self-Employed (Incorporated) | 123 | 5.2% |
| Self-Employed (Not Incorporated) | 350 | 14.9% |
| Not-for-profit Organizations | 197 | 8.4% |
| Local Government Employees | 67 | 2.9% |
| State Government Employees | 103 | 4.4% |
| Federal Government Employees | 146 | 6.2% |
| Unpaid Family Workers | 0 | 0.0% |
| Total | 2,354 | 100.0% |
Employment Status by Age in Pupukea
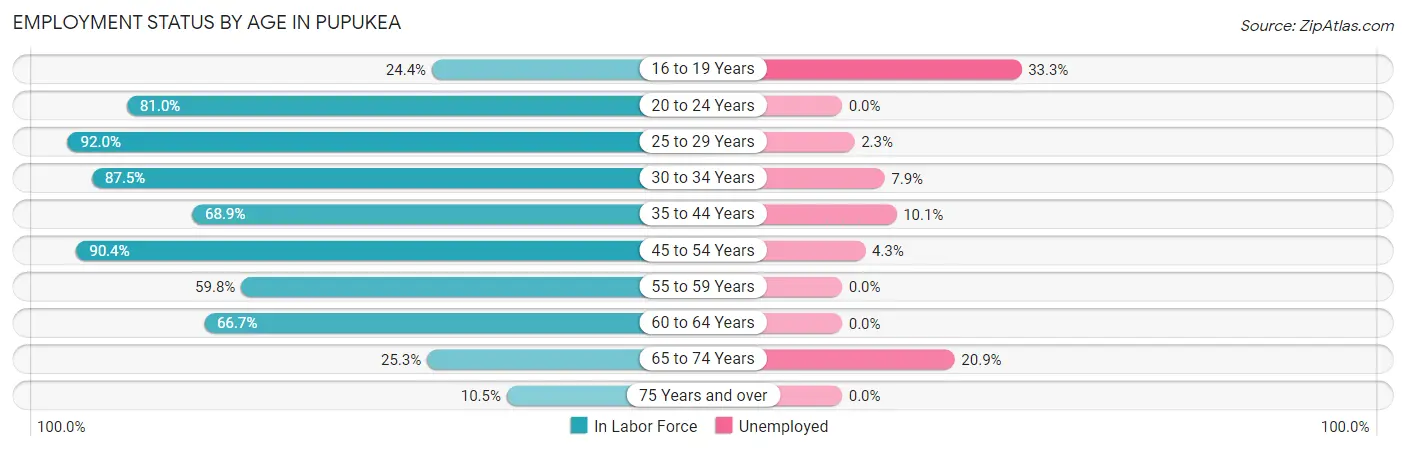
According to the labor force statistics for Pupukea, out of the total population over 16 years of age (4,264), 60.2% or 2,567 individuals are in the labor force, with 6.2% or 159 of them unemployed. The age group with the highest labor force participation rate is 25 to 29 years, with 92.0% or 343 individuals in the labor force. Within the labor force, the 16 to 19 years age range has the highest percentage of unemployed individuals, with 33.3% or 17 of them being unemployed.
| Age Bracket | In Labor Force | Unemployed |
| 16 to 19 Years | 51 (24.4%) | 17 (33.3%) |
| 20 to 24 Years | 427 (81.0%) | 0 (0.0%) |
| 25 to 29 Years | 343 (92.0%) | 8 (2.3%) |
| 30 to 34 Years | 252 (87.5%) | 20 (7.9%) |
| 35 to 44 Years | 500 (68.9%) | 50 (10.1%) |
| 45 to 54 Years | 461 (90.4%) | 20 (4.3%) |
| 55 to 59 Years | 119 (59.8%) | 0 (0.0%) |
| 60 to 64 Years | 160 (66.7%) | 0 (0.0%) |
| 65 to 74 Years | 220 (25.3%) | 46 (20.9%) |
| 75 Years and over | 34 (10.5%) | 0 (0.0%) |
| Total | 2,567 (60.2%) | 159 (6.2%) |
Employment Status by Educational Attainment in Pupukea
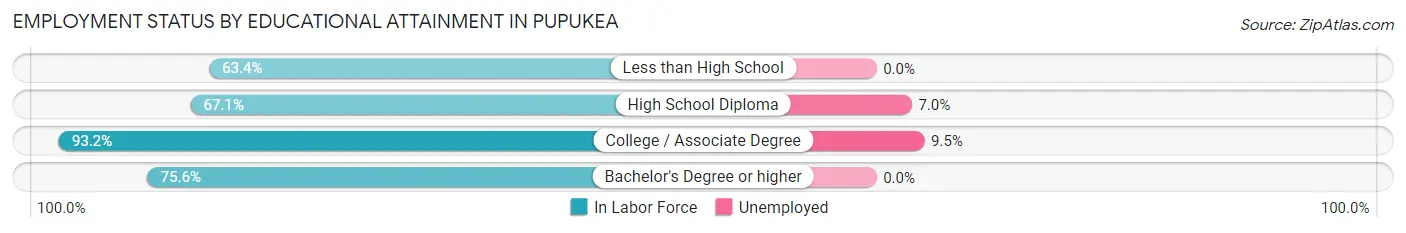
According to labor force statistics for Pupukea, 78.6% of individuals (1,836) out of the total population between 25 and 64 years of age (2,336) are in the labor force, with 5.2% or 95 of them being unemployed. The group with the highest labor force participation rate are those with the educational attainment of college / associate degree, with 93.2% or 685 individuals in the labor force. Within the labor force, individuals with college / associate degree education have the highest percentage of unemployment, with 9.5% or 65 of them being unemployed.
| Educational Attainment | In Labor Force | Unemployed |
| Less than High School | 52 (63.4%) | 0 (0.0%) |
| High School Diploma | 398 (67.1%) | 42 (7.0%) |
| College / Associate Degree | 685 (93.2%) | 70 (9.5%) |
| Bachelor's Degree or higher | 700 (75.6%) | 0 (0.0%) |
| Total | 1,836 (78.6%) | 121 (5.2%) |
Employment Occupations by Sex in Pupukea
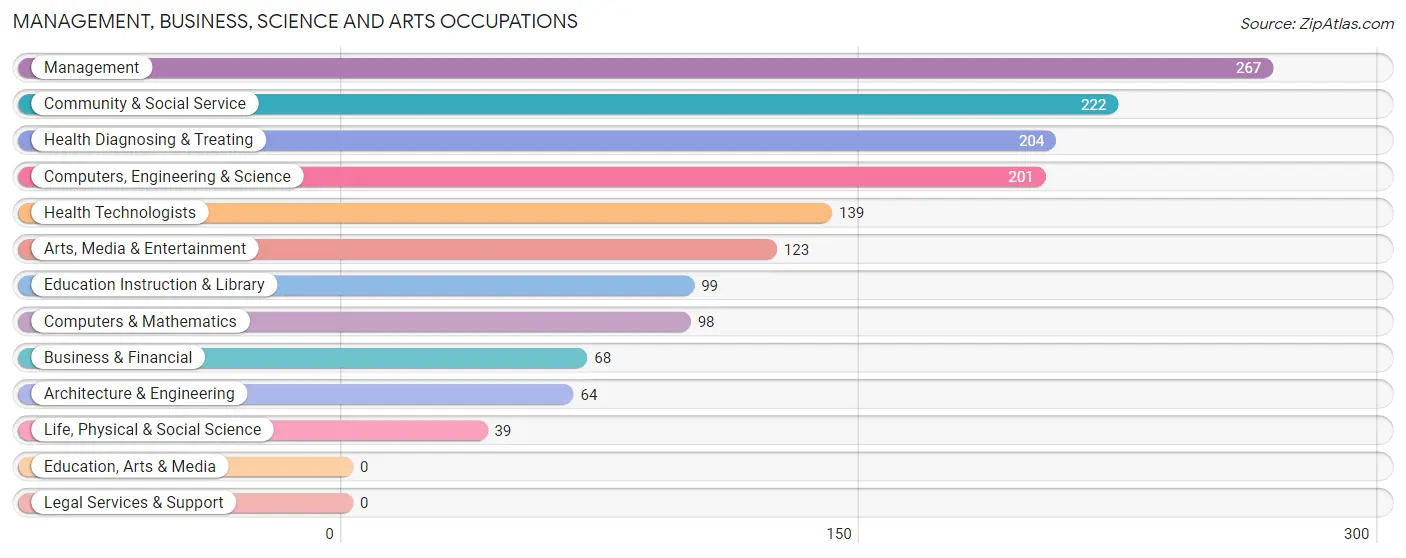
Management, Business, Science and Arts Occupations
The most common Management, Business, Science and Arts occupations in Pupukea are Management (267 | 11.3%), Community & Social Service (222 | 9.4%), Health Diagnosing & Treating (204 | 8.7%), Computers, Engineering & Science (201 | 8.5%), and Health Technologists (139 | 5.9%).
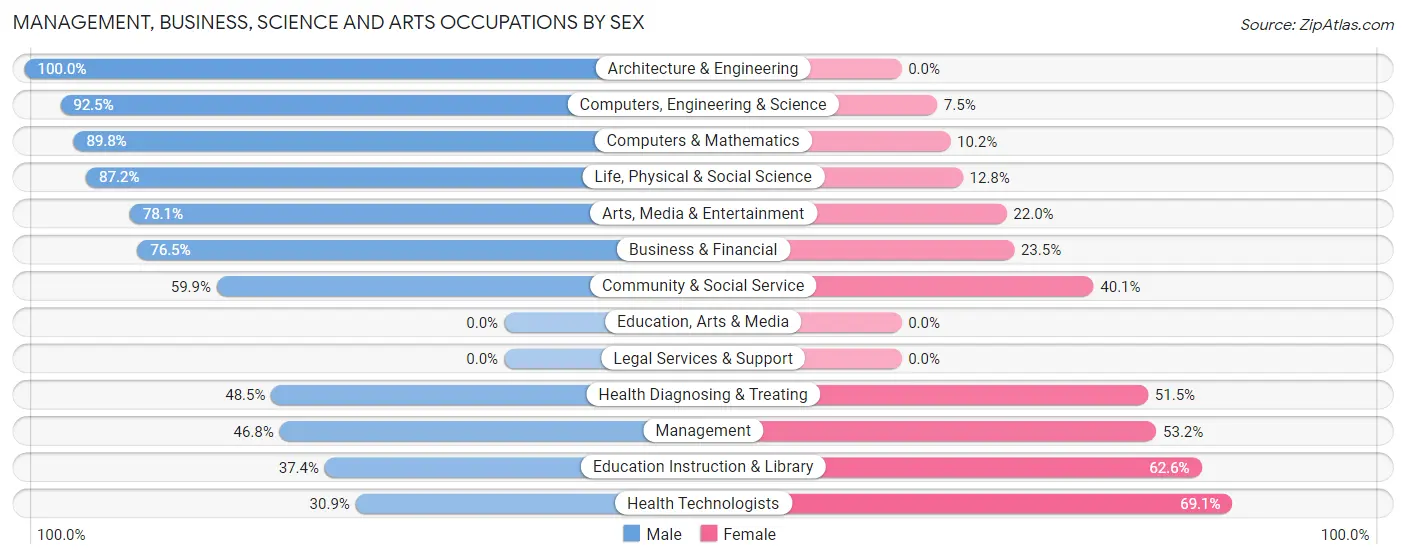
Management, Business, Science and Arts Occupations by Sex
Within the Management, Business, Science and Arts occupations in Pupukea, the most male-oriented occupations are Architecture & Engineering (100.0%), Computers, Engineering & Science (92.5%), and Computers & Mathematics (89.8%), while the most female-oriented occupations are Health Technologists (69.1%), Education Instruction & Library (62.6%), and Management (53.2%).
| Occupation | Male | Female |
| Management | 125 (46.8%) | 142 (53.2%) |
| Business & Financial | 52 (76.5%) | 16 (23.5%) |
| Computers, Engineering & Science | 186 (92.5%) | 15 (7.5%) |
| Computers & Mathematics | 88 (89.8%) | 10 (10.2%) |
| Architecture & Engineering | 64 (100.0%) | 0 (0.0%) |
| Life, Physical & Social Science | 34 (87.2%) | 5 (12.8%) |
| Community & Social Service | 133 (59.9%) | 89 (40.1%) |
| Education, Arts & Media | 0 (0.0%) | 0 (0.0%) |
| Legal Services & Support | 0 (0.0%) | 0 (0.0%) |
| Education Instruction & Library | 37 (37.4%) | 62 (62.6%) |
| Arts, Media & Entertainment | 96 (78.0%) | 27 (22.0%) |
| Health Diagnosing & Treating | 99 (48.5%) | 105 (51.5%) |
| Health Technologists | 43 (30.9%) | 96 (69.1%) |
| Total (Category) | 595 (61.9%) | 367 (38.2%) |
| Total (Overall) | 1,300 (55.1%) | 1,057 (44.9%) |
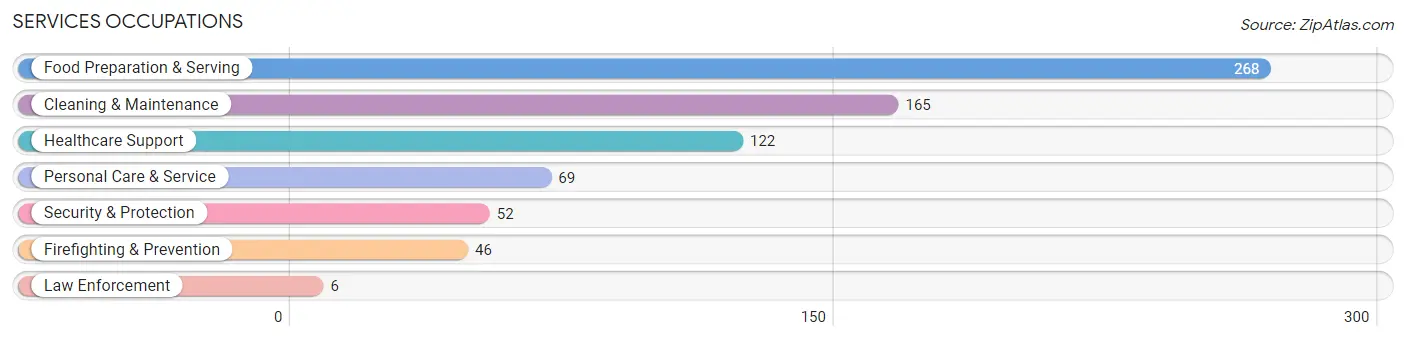
Services Occupations
The most common Services occupations in Pupukea are Food Preparation & Serving (268 | 11.4%), Cleaning & Maintenance (165 | 7.0%), Healthcare Support (122 | 5.2%), Personal Care & Service (69 | 2.9%), and Security & Protection (52 | 2.2%).
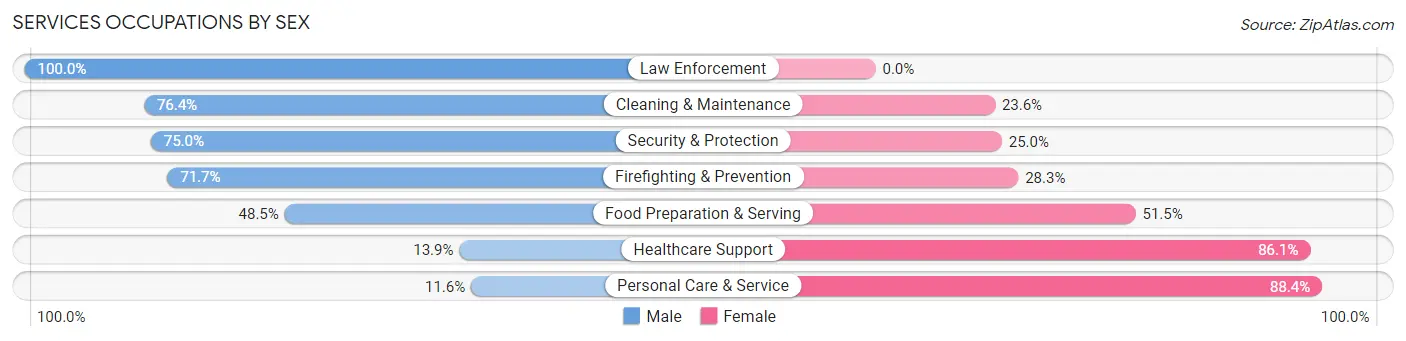
Services Occupations by Sex
Within the Services occupations in Pupukea, the most male-oriented occupations are Law Enforcement (100.0%), Cleaning & Maintenance (76.4%), and Security & Protection (75.0%), while the most female-oriented occupations are Personal Care & Service (88.4%), Healthcare Support (86.1%), and Food Preparation & Serving (51.5%).
| Occupation | Male | Female |
| Healthcare Support | 17 (13.9%) | 105 (86.1%) |
| Security & Protection | 39 (75.0%) | 13 (25.0%) |
| Firefighting & Prevention | 33 (71.7%) | 13 (28.3%) |
| Law Enforcement | 6 (100.0%) | 0 (0.0%) |
| Food Preparation & Serving | 130 (48.5%) | 138 (51.5%) |
| Cleaning & Maintenance | 126 (76.4%) | 39 (23.6%) |
| Personal Care & Service | 8 (11.6%) | 61 (88.4%) |
| Total (Category) | 320 (47.3%) | 356 (52.7%) |
| Total (Overall) | 1,300 (55.1%) | 1,057 (44.9%) |
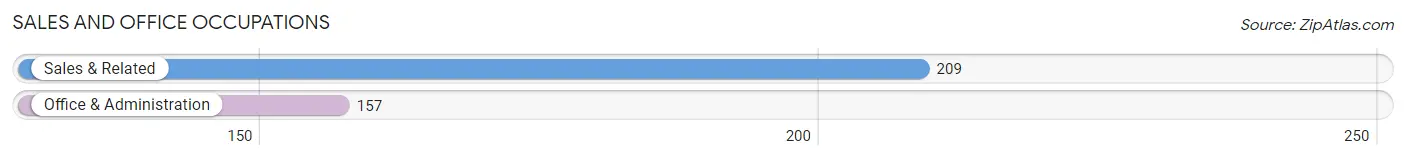
Sales and Office Occupations
The most common Sales and Office occupations in Pupukea are Sales & Related (209 | 8.9%), and Office & Administration (157 | 6.7%).
Sales and Office Occupations by Sex
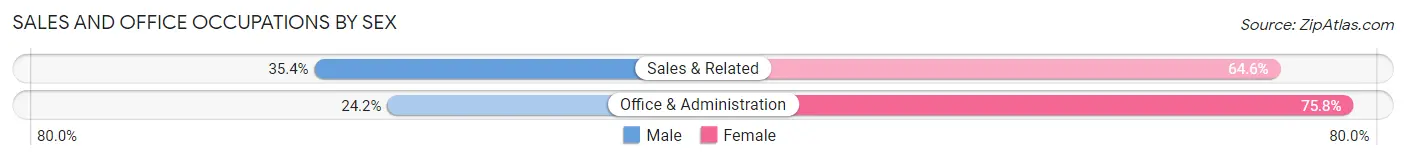
| Occupation | Male | Female |
| Sales & Related | 74 (35.4%) | 135 (64.6%) |
| Office & Administration | 38 (24.2%) | 119 (75.8%) |
| Total (Category) | 112 (30.6%) | 254 (69.4%) |
| Total (Overall) | 1,300 (55.1%) | 1,057 (44.9%) |
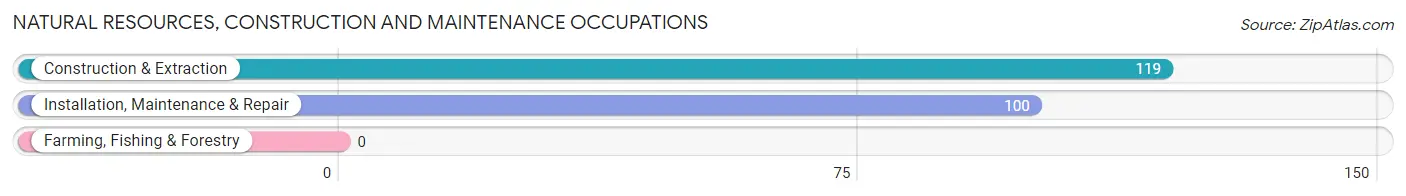
Natural Resources, Construction and Maintenance Occupations
The most common Natural Resources, Construction and Maintenance occupations in Pupukea are Construction & Extraction (119 | 5.1%), and Installation, Maintenance & Repair (100 | 4.2%).
Natural Resources, Construction and Maintenance Occupations by Sex
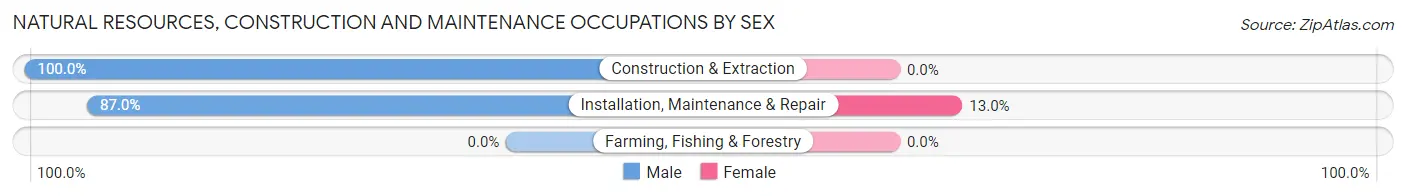
| Occupation | Male | Female |
| Farming, Fishing & Forestry | 0 (0.0%) | 0 (0.0%) |
| Construction & Extraction | 119 (100.0%) | 0 (0.0%) |
| Installation, Maintenance & Repair | 87 (87.0%) | 13 (13.0%) |
| Total (Category) | 206 (94.1%) | 13 (5.9%) |
| Total (Overall) | 1,300 (55.1%) | 1,057 (44.9%) |
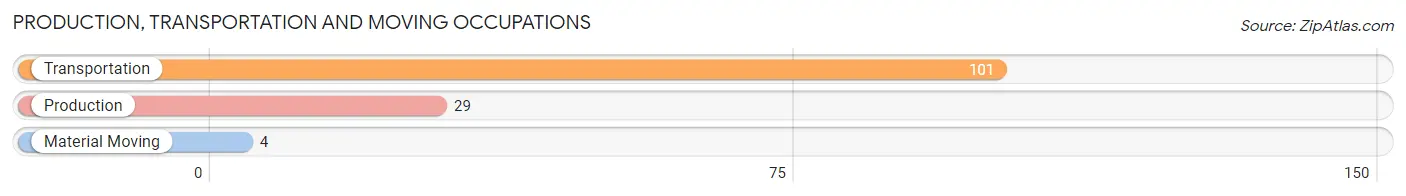
Production, Transportation and Moving Occupations
The most common Production, Transportation and Moving occupations in Pupukea are Transportation (101 | 4.3%), Production (29 | 1.2%), and Material Moving (4 | 0.2%).
Production, Transportation and Moving Occupations by Sex
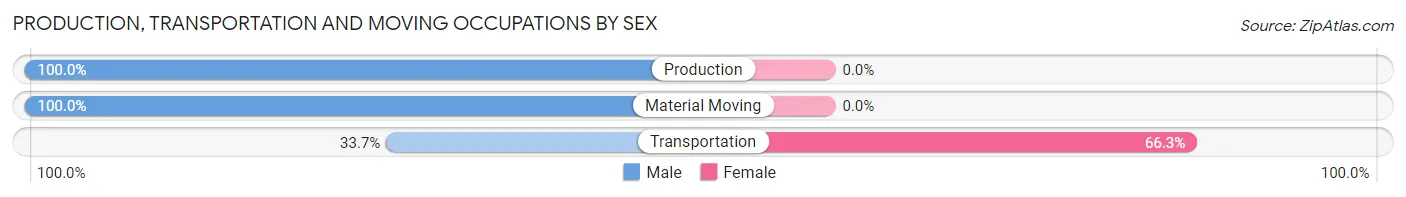
| Occupation | Male | Female |
| Production | 29 (100.0%) | 0 (0.0%) |
| Transportation | 34 (33.7%) | 67 (66.3%) |
| Material Moving | 4 (100.0%) | 0 (0.0%) |
| Total (Category) | 67 (50.0%) | 67 (50.0%) |
| Total (Overall) | 1,300 (55.1%) | 1,057 (44.9%) |
Employment Industries by Sex in Pupukea
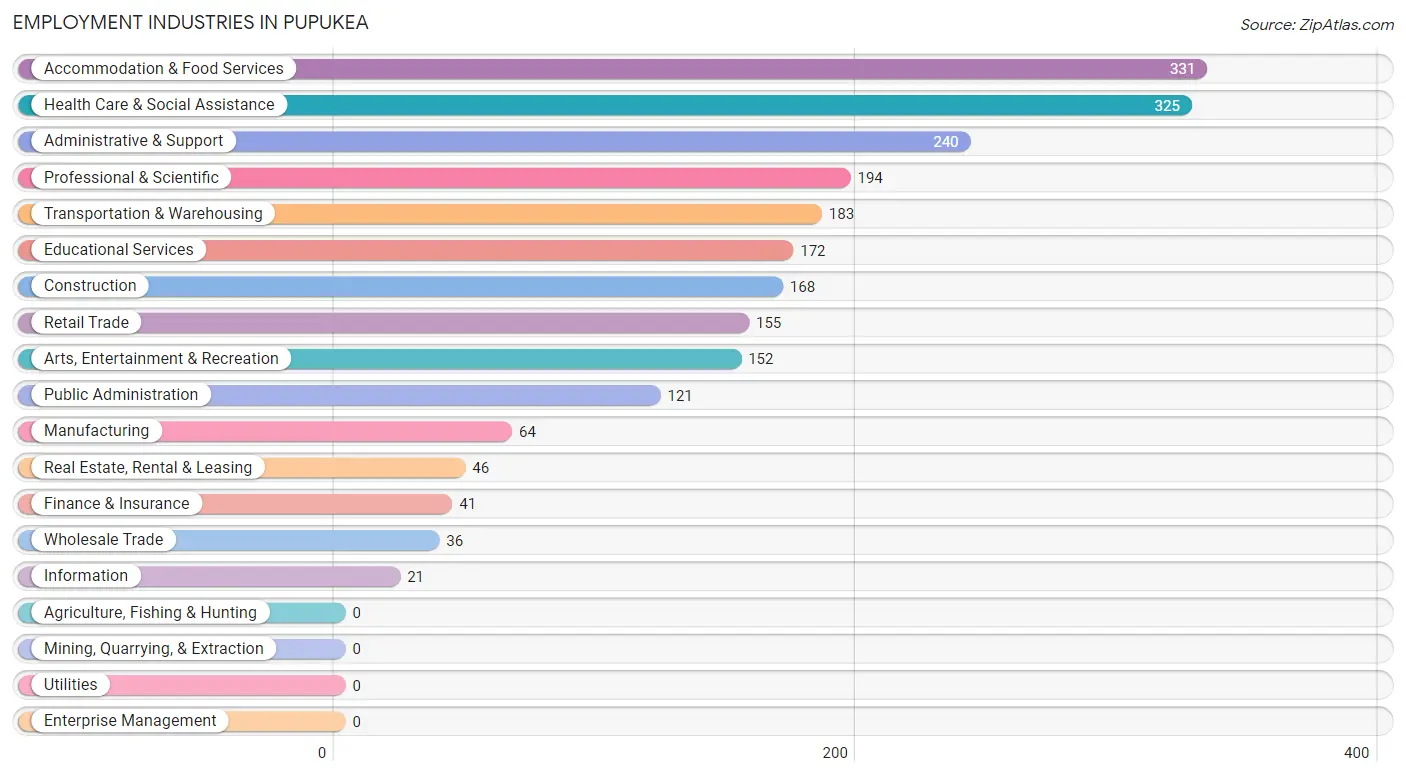
Employment Industries in Pupukea
The major employment industries in Pupukea include Accommodation & Food Services (331 | 14.0%), Health Care & Social Assistance (325 | 13.8%), Administrative & Support (240 | 10.2%), Professional & Scientific (194 | 8.2%), and Transportation & Warehousing (183 | 7.8%).
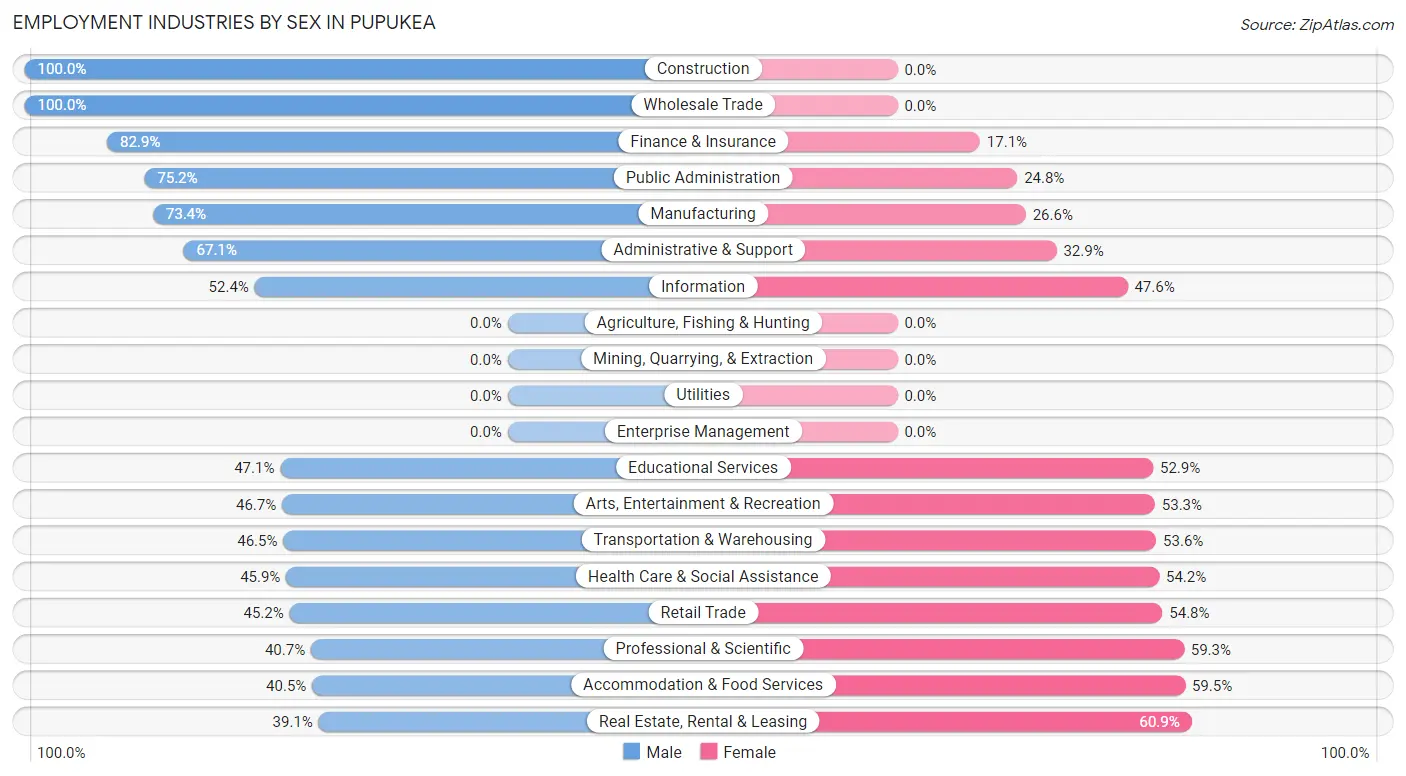
Employment Industries by Sex in Pupukea
The Pupukea industries that see more men than women are Construction (100.0%), Wholesale Trade (100.0%), and Finance & Insurance (82.9%), whereas the industries that tend to have a higher number of women are Real Estate, Rental & Leasing (60.9%), Accommodation & Food Services (59.5%), and Professional & Scientific (59.3%).
| Industry | Male | Female |
| Agriculture, Fishing & Hunting | 0 (0.0%) | 0 (0.0%) |
| Mining, Quarrying, & Extraction | 0 (0.0%) | 0 (0.0%) |
| Construction | 168 (100.0%) | 0 (0.0%) |
| Manufacturing | 47 (73.4%) | 17 (26.6%) |
| Wholesale Trade | 36 (100.0%) | 0 (0.0%) |
| Retail Trade | 70 (45.2%) | 85 (54.8%) |
| Transportation & Warehousing | 85 (46.5%) | 98 (53.5%) |
| Utilities | 0 (0.0%) | 0 (0.0%) |
| Information | 11 (52.4%) | 10 (47.6%) |
| Finance & Insurance | 34 (82.9%) | 7 (17.1%) |
| Real Estate, Rental & Leasing | 18 (39.1%) | 28 (60.9%) |
| Professional & Scientific | 79 (40.7%) | 115 (59.3%) |
| Enterprise Management | 0 (0.0%) | 0 (0.0%) |
| Administrative & Support | 161 (67.1%) | 79 (32.9%) |
| Educational Services | 81 (47.1%) | 91 (52.9%) |
| Health Care & Social Assistance | 149 (45.9%) | 176 (54.1%) |
| Arts, Entertainment & Recreation | 71 (46.7%) | 81 (53.3%) |
| Accommodation & Food Services | 134 (40.5%) | 197 (59.5%) |
| Public Administration | 91 (75.2%) | 30 (24.8%) |
| Total | 1,300 (55.1%) | 1,057 (44.9%) |
Education in Pupukea
School Enrollment in Pupukea
The most common levels of schooling among the 1,339 students in Pupukea are high school (342 | 25.5%), college / undergraduate (312 | 23.3%), and elementary school (241 | 18.0%).
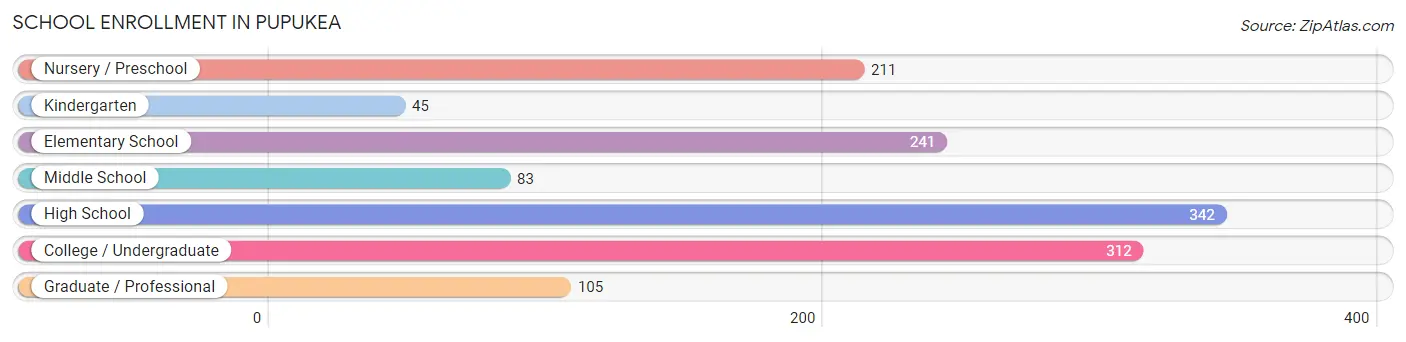
| School Level | # Students | % Students |
| Nursery / Preschool | 211 | 15.8% |
| Kindergarten | 45 | 3.4% |
| Elementary School | 241 | 18.0% |
| Middle School | 83 | 6.2% |
| High School | 342 | 25.5% |
| College / Undergraduate | 312 | 23.3% |
| Graduate / Professional | 105 | 7.8% |
| Total | 1,339 | 100.0% |
School Enrollment by Age by Funding Source in Pupukea
Out of a total of 1,339 students who are enrolled in schools in Pupukea, 311 (23.2%) attend a private institution, while the remaining 1,028 (76.8%) are enrolled in public schools. The age group of 3 to 4 year olds has the highest likelihood of being enrolled in private schools, with 172 (89.1% in the age bracket) enrolled. Conversely, the age group of 18 to 19 year olds has the lowest likelihood of being enrolled in a private school, with 44 (100.0% in the age bracket) attending a public institution.
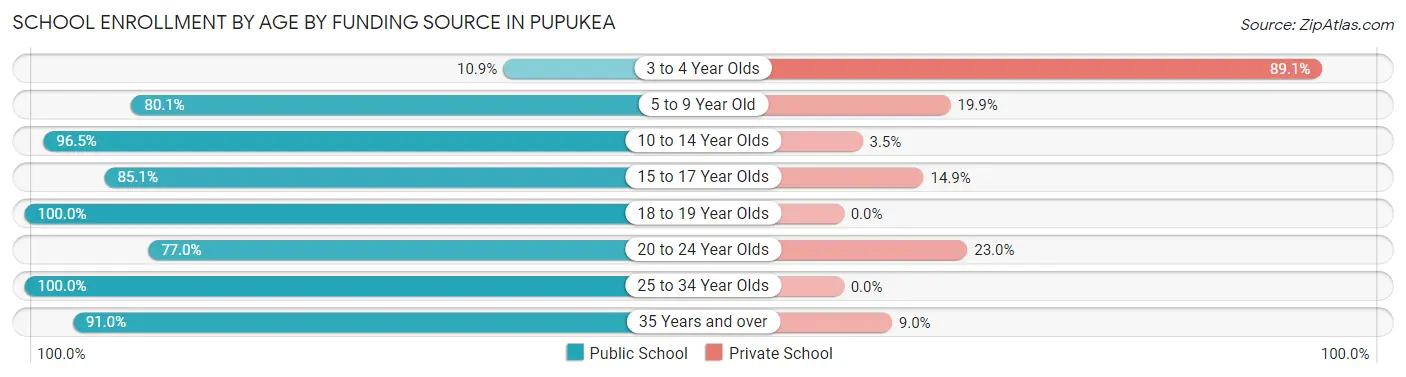
| Age Bracket | Public School | Private School |
| 3 to 4 Year Olds | 21 (10.9%) | 172 (89.1%) |
| 5 to 9 Year Old | 153 (80.1%) | 38 (19.9%) |
| 10 to 14 Year Olds | 275 (96.5%) | 10 (3.5%) |
| 15 to 17 Year Olds | 200 (85.1%) | 35 (14.9%) |
| 18 to 19 Year Olds | 44 (100.0%) | 0 (0.0%) |
| 20 to 24 Year Olds | 137 (77.0%) | 41 (23.0%) |
| 25 to 34 Year Olds | 46 (100.0%) | 0 (0.0%) |
| 35 Years and over | 152 (91.0%) | 15 (9.0%) |
| Total | 1,028 (76.8%) | 311 (23.2%) |
Educational Attainment by Field of Study in Pupukea
Business (223 | 17.9%), arts & humanities (178 | 14.3%), education (173 | 13.9%), engineering (115 | 9.2%), and computers & mathematics (99 | 7.9%) are the most common fields of study among 1,248 individuals in Pupukea who have obtained a bachelor's degree or higher.
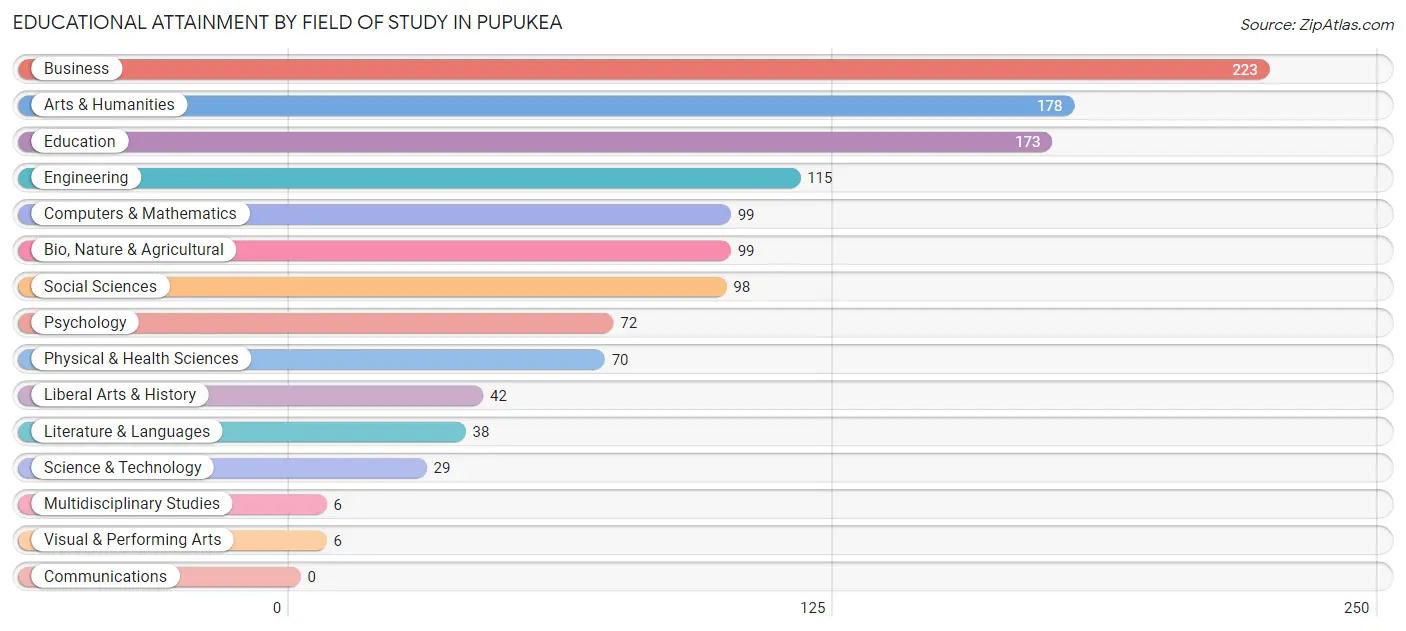
| Field of Study | # Graduates | % Graduates |
| Computers & Mathematics | 99 | 7.9% |
| Bio, Nature & Agricultural | 99 | 7.9% |
| Physical & Health Sciences | 70 | 5.6% |
| Psychology | 72 | 5.8% |
| Social Sciences | 98 | 7.9% |
| Engineering | 115 | 9.2% |
| Multidisciplinary Studies | 6 | 0.5% |
| Science & Technology | 29 | 2.3% |
| Business | 223 | 17.9% |
| Education | 173 | 13.9% |
| Literature & Languages | 38 | 3.0% |
| Liberal Arts & History | 42 | 3.4% |
| Visual & Performing Arts | 6 | 0.5% |
| Communications | 0 | 0.0% |
| Arts & Humanities | 178 | 14.3% |
| Total | 1,248 | 100.0% |
Transportation & Commute in Pupukea
Vehicle Availability by Sex in Pupukea
The most prevalent vehicle ownership categories in Pupukea are males with 3 vehicles (408, accounting for 30.6%) and females with 3 vehicles (251, making up 39.9%).
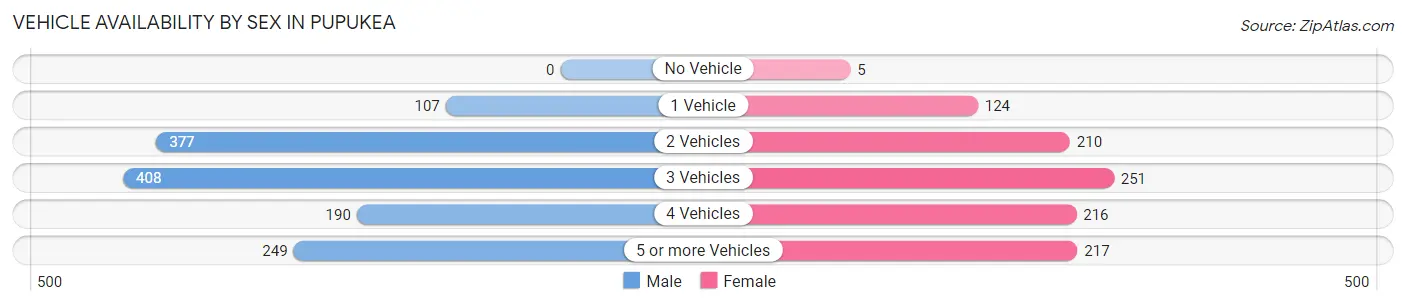
| Vehicles Available | Male | Female |
| No Vehicle | 0 (0.0%) | 5 (0.5%) |
| 1 Vehicle | 107 (8.0%) | 124 (12.1%) |
| 2 Vehicles | 377 (28.3%) | 210 (20.5%) |
| 3 Vehicles | 408 (30.6%) | 251 (24.5%) |
| 4 Vehicles | 190 (14.3%) | 216 (21.1%) |
| 5 or more Vehicles | 249 (18.7%) | 217 (21.2%) |
| Total | 1,331 (100.0%) | 1,023 (100.0%) |
Commute Time in Pupukea
The most frequently occuring commute durations in Pupukea are 60 to 89 minutes (579 commuters, 28.8%), 15 to 19 minutes (357 commuters, 17.7%), and 20 to 24 minutes (274 commuters, 13.6%).
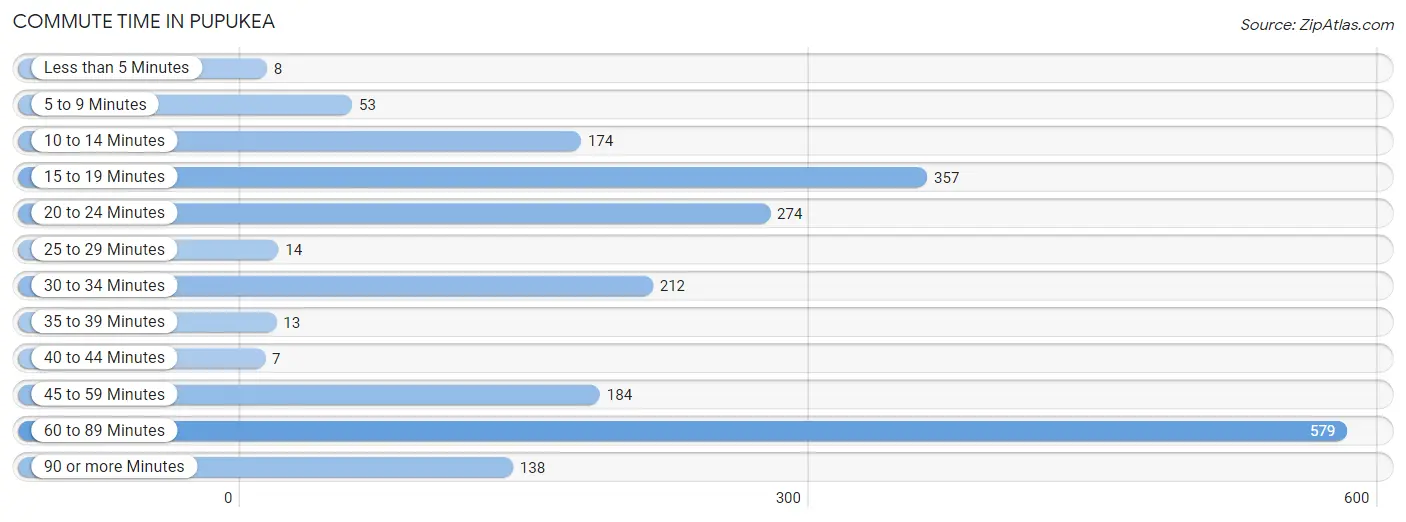
| Commute Time | # Commuters | % Commuters |
| Less than 5 Minutes | 8 | 0.4% |
| 5 to 9 Minutes | 53 | 2.6% |
| 10 to 14 Minutes | 174 | 8.6% |
| 15 to 19 Minutes | 357 | 17.7% |
| 20 to 24 Minutes | 274 | 13.6% |
| 25 to 29 Minutes | 14 | 0.7% |
| 30 to 34 Minutes | 212 | 10.5% |
| 35 to 39 Minutes | 13 | 0.6% |
| 40 to 44 Minutes | 7 | 0.4% |
| 45 to 59 Minutes | 184 | 9.1% |
| 60 to 89 Minutes | 579 | 28.8% |
| 90 or more Minutes | 138 | 6.9% |
Commute Time by Sex in Pupukea
The most common commute times in Pupukea are 60 to 89 minutes (400 commuters, 35.0%) for males and 15 to 19 minutes (202 commuters, 23.2%) for females.
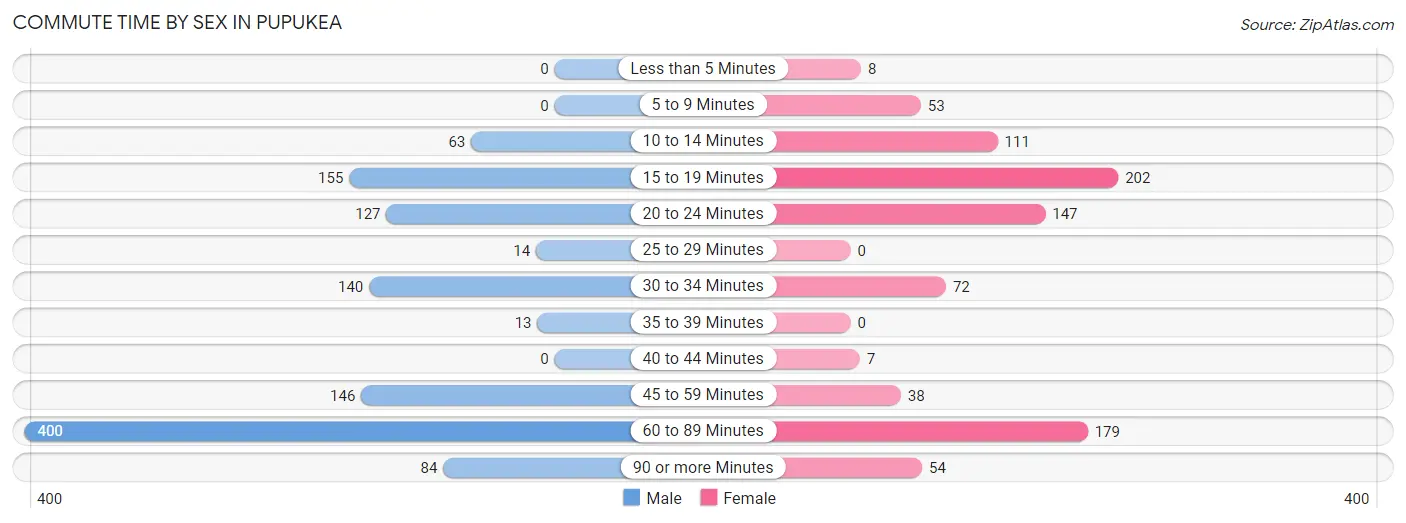
| Commute Time | Male | Female |
| Less than 5 Minutes | 0 (0.0%) | 8 (0.9%) |
| 5 to 9 Minutes | 0 (0.0%) | 53 (6.1%) |
| 10 to 14 Minutes | 63 (5.5%) | 111 (12.7%) |
| 15 to 19 Minutes | 155 (13.6%) | 202 (23.2%) |
| 20 to 24 Minutes | 127 (11.1%) | 147 (16.9%) |
| 25 to 29 Minutes | 14 (1.2%) | 0 (0.0%) |
| 30 to 34 Minutes | 140 (12.3%) | 72 (8.3%) |
| 35 to 39 Minutes | 13 (1.1%) | 0 (0.0%) |
| 40 to 44 Minutes | 0 (0.0%) | 7 (0.8%) |
| 45 to 59 Minutes | 146 (12.8%) | 38 (4.4%) |
| 60 to 89 Minutes | 400 (35.0%) | 179 (20.5%) |
| 90 or more Minutes | 84 (7.4%) | 54 (6.2%) |
Time of Departure to Work by Sex in Pupukea
The most frequent times of departure to work in Pupukea are 5:00 AM to 5:29 AM (170, 14.9%) for males and 8:00 AM to 8:29 AM (266, 30.5%) for females.
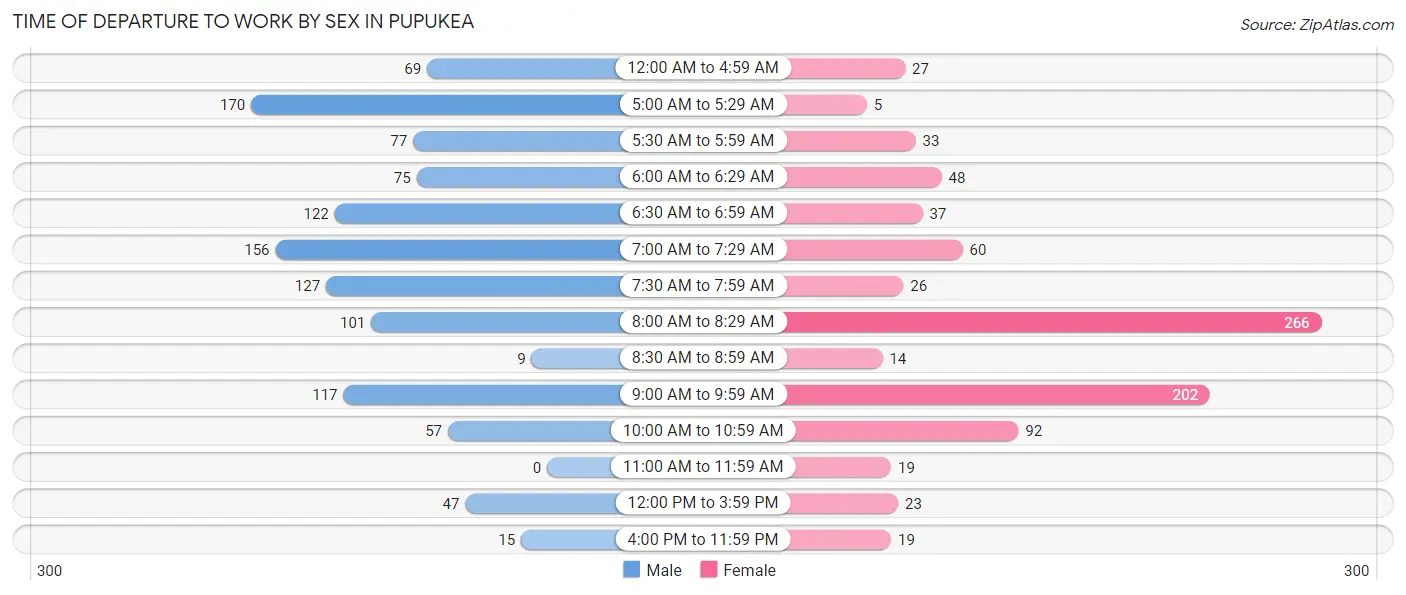
| Time of Departure | Male | Female |
| 12:00 AM to 4:59 AM | 69 (6.0%) | 27 (3.1%) |
| 5:00 AM to 5:29 AM | 170 (14.9%) | 5 (0.6%) |
| 5:30 AM to 5:59 AM | 77 (6.7%) | 33 (3.8%) |
| 6:00 AM to 6:29 AM | 75 (6.6%) | 48 (5.5%) |
| 6:30 AM to 6:59 AM | 122 (10.7%) | 37 (4.3%) |
| 7:00 AM to 7:29 AM | 156 (13.7%) | 60 (6.9%) |
| 7:30 AM to 7:59 AM | 127 (11.1%) | 26 (3.0%) |
| 8:00 AM to 8:29 AM | 101 (8.8%) | 266 (30.5%) |
| 8:30 AM to 8:59 AM | 9 (0.8%) | 14 (1.6%) |
| 9:00 AM to 9:59 AM | 117 (10.2%) | 202 (23.2%) |
| 10:00 AM to 10:59 AM | 57 (5.0%) | 92 (10.6%) |
| 11:00 AM to 11:59 AM | 0 (0.0%) | 19 (2.2%) |
| 12:00 PM to 3:59 PM | 47 (4.1%) | 23 (2.6%) |
| 4:00 PM to 11:59 PM | 15 (1.3%) | 19 (2.2%) |
| Total | 1,142 (100.0%) | 871 (100.0%) |
Housing Occupancy in Pupukea
Occupancy by Ownership in Pupukea
Of the total 1,543 dwellings in Pupukea, owner-occupied units account for 876 (56.8%), while renter-occupied units make up 667 (43.2%).
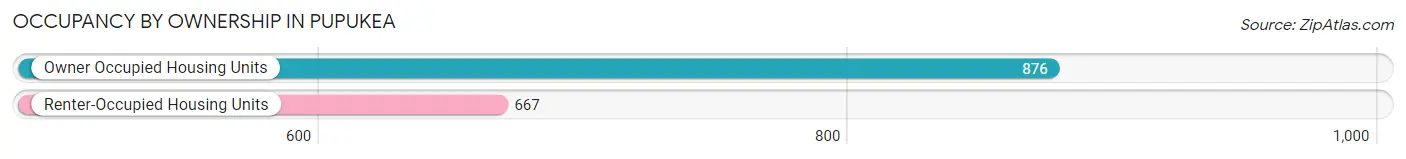
| Occupancy | # Housing Units | % Housing Units |
| Owner Occupied Housing Units | 876 | 56.8% |
| Renter-Occupied Housing Units | 667 | 43.2% |
| Total Occupied Housing Units | 1,543 | 100.0% |
Occupancy by Household Size in Pupukea
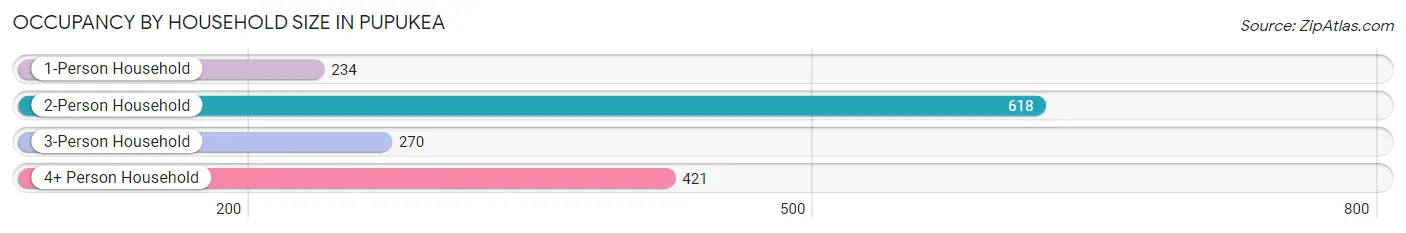
| Household Size | # Housing Units | % Housing Units |
| 1-Person Household | 234 | 15.2% |
| 2-Person Household | 618 | 40.1% |
| 3-Person Household | 270 | 17.5% |
| 4+ Person Household | 421 | 27.3% |
| Total Housing Units | 1,543 | 100.0% |
Occupancy by Ownership by Household Size in Pupukea
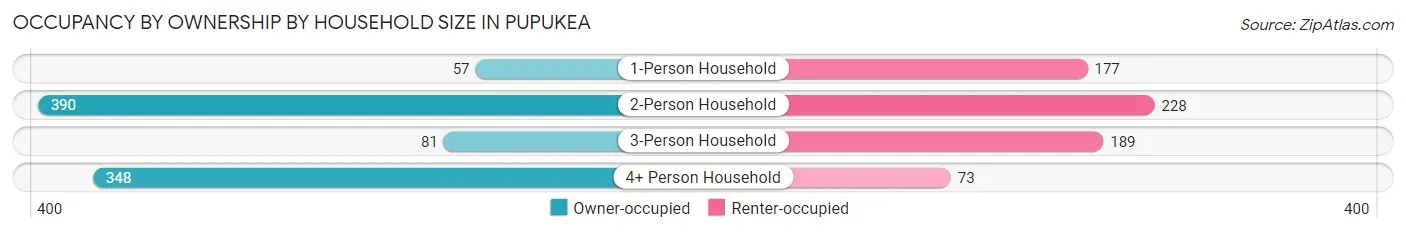
| Household Size | Owner-occupied | Renter-occupied |
| 1-Person Household | 57 (24.4%) | 177 (75.6%) |
| 2-Person Household | 390 (63.1%) | 228 (36.9%) |
| 3-Person Household | 81 (30.0%) | 189 (70.0%) |
| 4+ Person Household | 348 (82.7%) | 73 (17.3%) |
| Total Housing Units | 876 (56.8%) | 667 (43.2%) |
Occupancy by Educational Attainment in Pupukea
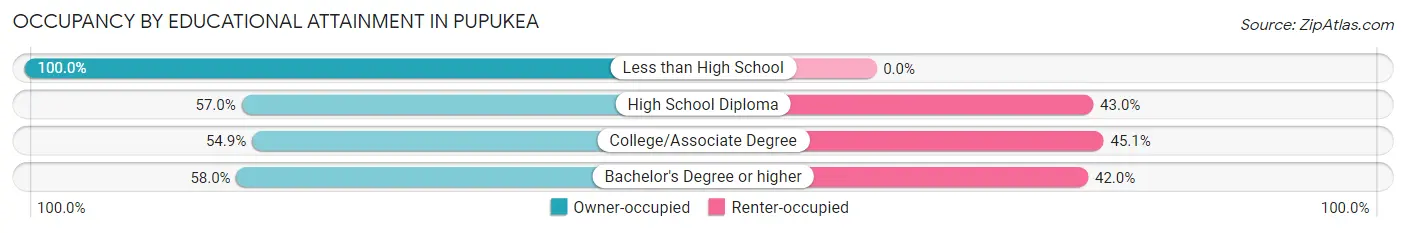
| Household Size | Owner-occupied | Renter-occupied |
| Less than High School | 8 (100.0%) | 0 (0.0%) |
| High School Diploma | 196 (57.0%) | 148 (43.0%) |
| College/Associate Degree | 335 (54.9%) | 275 (45.1%) |
| Bachelor's Degree or higher | 337 (58.0%) | 244 (42.0%) |
Occupancy by Age of Householder in Pupukea
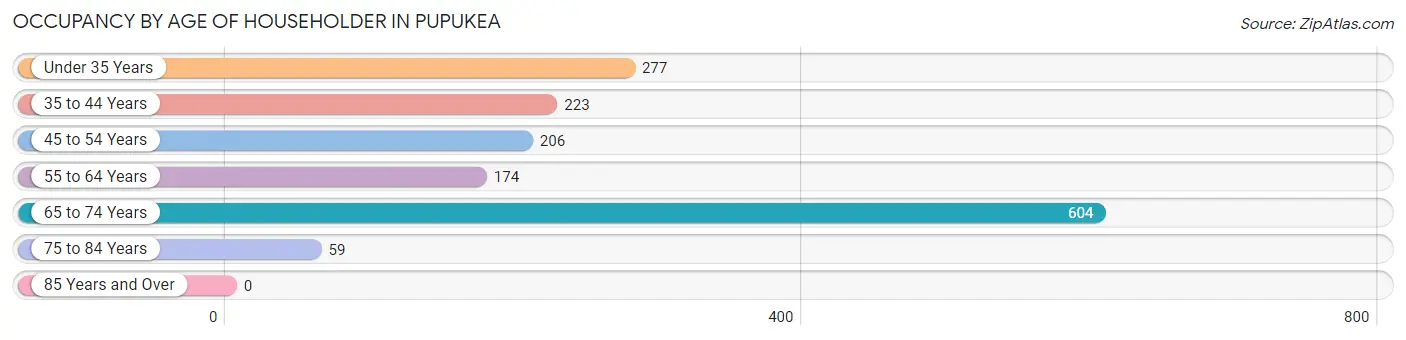
| Age Bracket | # Households | % Households |
| Under 35 Years | 277 | 17.9% |
| 35 to 44 Years | 223 | 14.4% |
| 45 to 54 Years | 206 | 13.4% |
| 55 to 64 Years | 174 | 11.3% |
| 65 to 74 Years | 604 | 39.1% |
| 75 to 84 Years | 59 | 3.8% |
| 85 Years and Over | 0 | 0.0% |
| Total | 1,543 | 100.0% |
Housing Finances in Pupukea
Median Income by Occupancy in Pupukea
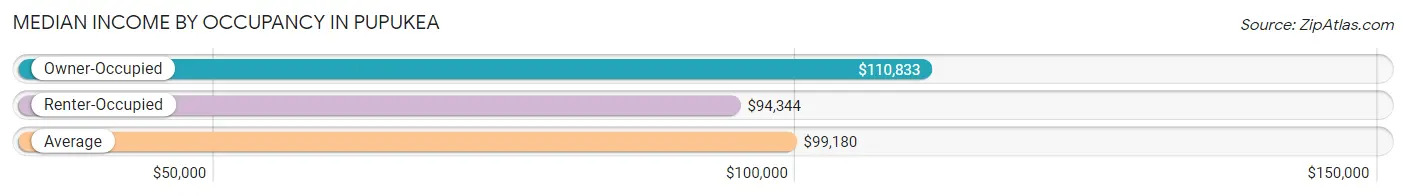
| Occupancy Type | # Households | Median Income |
| Owner-Occupied | 876 (56.8%) | $110,833 |
| Renter-Occupied | 667 (43.2%) | $94,344 |
| Average | 1,543 (100.0%) | $99,180 |
Occupancy by Householder Income Bracket in Pupukea
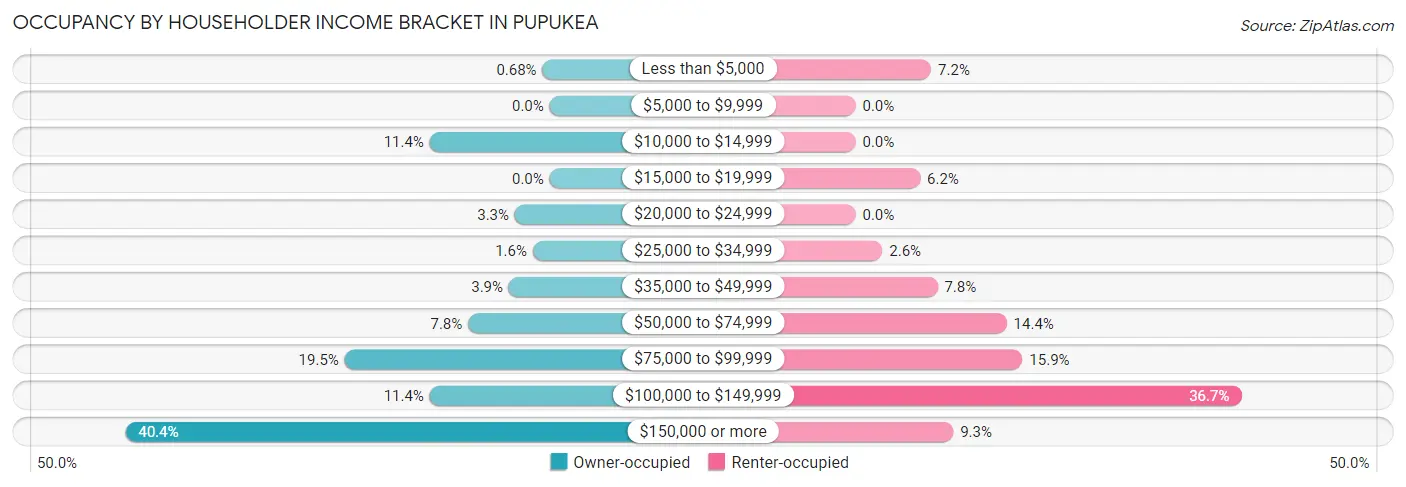
| Income Bracket | Owner-occupied | Renter-occupied |
| Less than $5,000 | 6 (0.7%) | 48 (7.2%) |
| $5,000 to $9,999 | 0 (0.0%) | 0 (0.0%) |
| $10,000 to $14,999 | 100 (11.4%) | 0 (0.0%) |
| $15,000 to $19,999 | 0 (0.0%) | 41 (6.1%) |
| $20,000 to $24,999 | 29 (3.3%) | 0 (0.0%) |
| $25,000 to $34,999 | 14 (1.6%) | 17 (2.5%) |
| $35,000 to $49,999 | 34 (3.9%) | 52 (7.8%) |
| $50,000 to $74,999 | 68 (7.8%) | 96 (14.4%) |
| $75,000 to $99,999 | 171 (19.5%) | 106 (15.9%) |
| $100,000 to $149,999 | 100 (11.4%) | 245 (36.7%) |
| $150,000 or more | 354 (40.4%) | 62 (9.3%) |
| Total | 876 (100.0%) | 667 (100.0%) |
Monthly Housing Cost Tiers in Pupukea
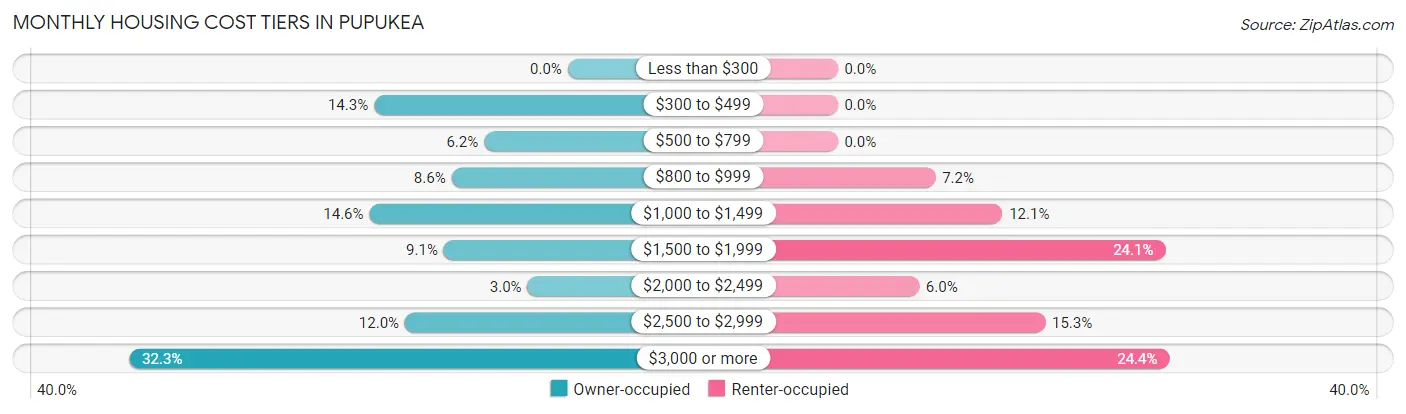
| Monthly Cost | Owner-occupied | Renter-occupied |
| Less than $300 | 0 (0.0%) | 0 (0.0%) |
| $300 to $499 | 125 (14.3%) | 0 (0.0%) |
| $500 to $799 | 54 (6.2%) | 0 (0.0%) |
| $800 to $999 | 75 (8.6%) | 48 (7.2%) |
| $1,000 to $1,499 | 128 (14.6%) | 81 (12.1%) |
| $1,500 to $1,999 | 80 (9.1%) | 161 (24.1%) |
| $2,000 to $2,499 | 26 (3.0%) | 40 (6.0%) |
| $2,500 to $2,999 | 105 (12.0%) | 102 (15.3%) |
| $3,000 or more | 283 (32.3%) | 163 (24.4%) |
| Total | 876 (100.0%) | 667 (100.0%) |
Physical Housing Characteristics in Pupukea
Housing Structures in Pupukea
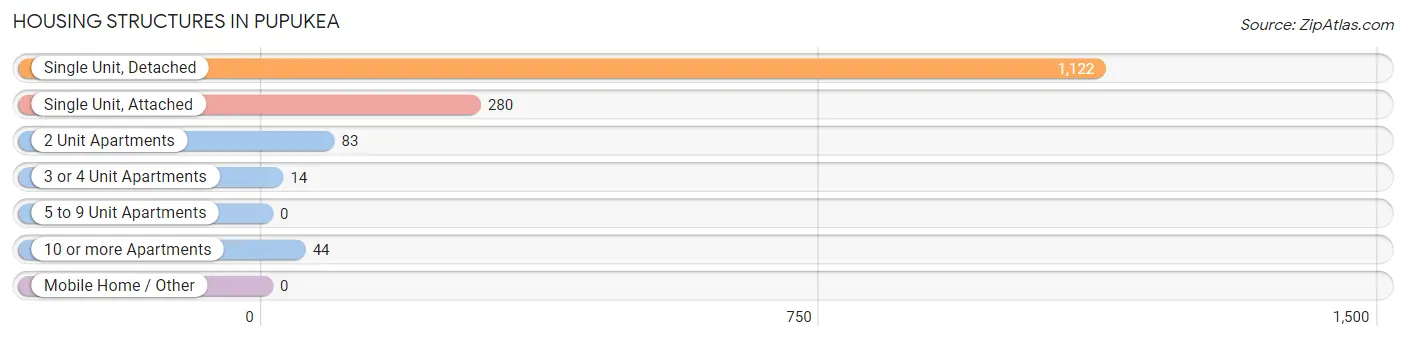
| Structure Type | # Housing Units | % Housing Units |
| Single Unit, Detached | 1,122 | 72.7% |
| Single Unit, Attached | 280 | 18.1% |
| 2 Unit Apartments | 83 | 5.4% |
| 3 or 4 Unit Apartments | 14 | 0.9% |
| 5 to 9 Unit Apartments | 0 | 0.0% |
| 10 or more Apartments | 44 | 2.9% |
| Mobile Home / Other | 0 | 0.0% |
| Total | 1,543 | 100.0% |
Housing Structures by Occupancy in Pupukea
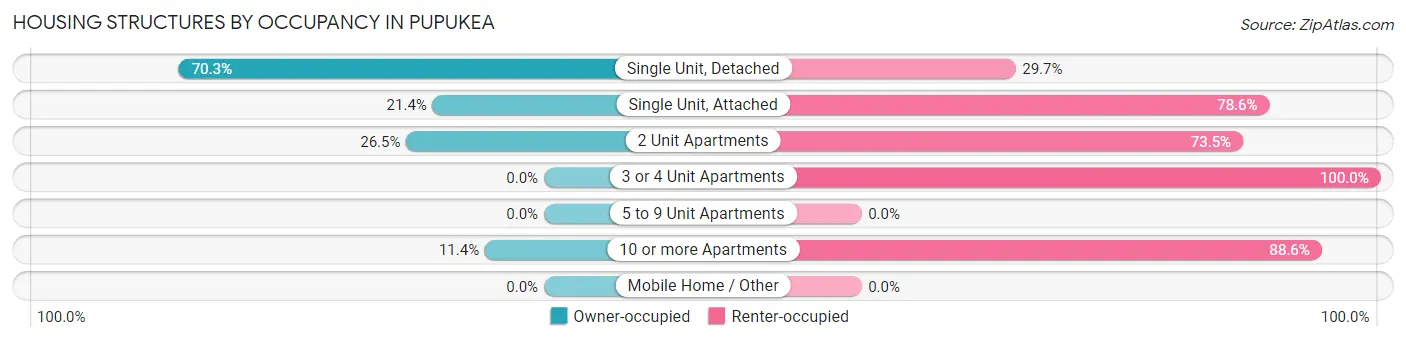
| Structure Type | Owner-occupied | Renter-occupied |
| Single Unit, Detached | 789 (70.3%) | 333 (29.7%) |
| Single Unit, Attached | 60 (21.4%) | 220 (78.6%) |
| 2 Unit Apartments | 22 (26.5%) | 61 (73.5%) |
| 3 or 4 Unit Apartments | 0 (0.0%) | 14 (100.0%) |
| 5 to 9 Unit Apartments | 0 (0.0%) | 0 (0.0%) |
| 10 or more Apartments | 5 (11.4%) | 39 (88.6%) |
| Mobile Home / Other | 0 (0.0%) | 0 (0.0%) |
| Total | 876 (56.8%) | 667 (43.2%) |
Housing Structures by Number of Rooms in Pupukea
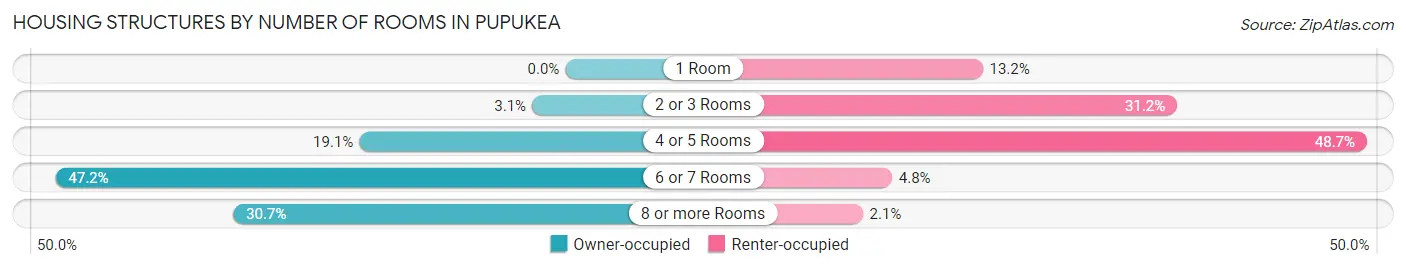
| Number of Rooms | Owner-occupied | Renter-occupied |
| 1 Room | 0 (0.0%) | 88 (13.2%) |
| 2 or 3 Rooms | 27 (3.1%) | 208 (31.2%) |
| 4 or 5 Rooms | 167 (19.1%) | 325 (48.7%) |
| 6 or 7 Rooms | 413 (47.1%) | 32 (4.8%) |
| 8 or more Rooms | 269 (30.7%) | 14 (2.1%) |
| Total | 876 (100.0%) | 667 (100.0%) |
Housing Structure by Heating Type in Pupukea
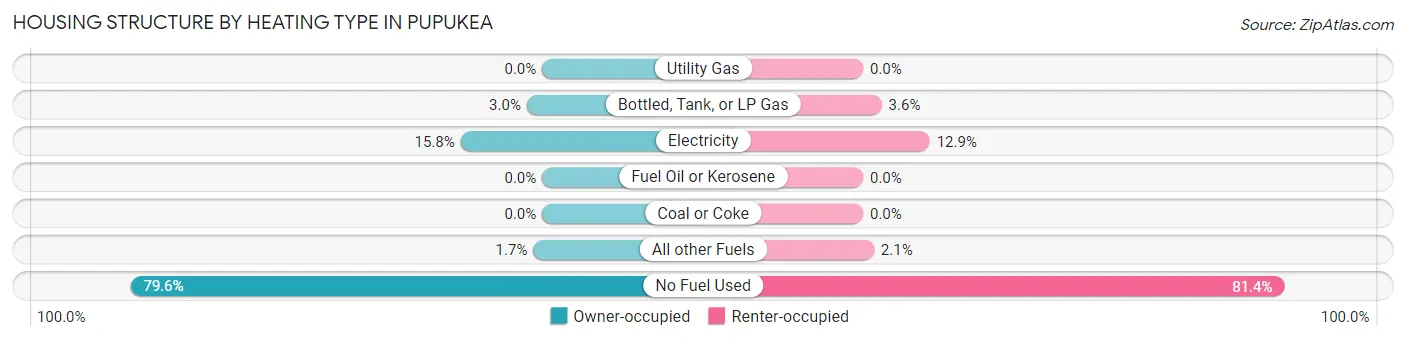
| Heating Type | Owner-occupied | Renter-occupied |
| Utility Gas | 0 (0.0%) | 0 (0.0%) |
| Bottled, Tank, or LP Gas | 26 (3.0%) | 24 (3.6%) |
| Electricity | 138 (15.8%) | 86 (12.9%) |
| Fuel Oil or Kerosene | 0 (0.0%) | 0 (0.0%) |
| Coal or Coke | 0 (0.0%) | 0 (0.0%) |
| All other Fuels | 15 (1.7%) | 14 (2.1%) |
| No Fuel Used | 697 (79.6%) | 543 (81.4%) |
| Total | 876 (100.0%) | 667 (100.0%) |
Household Vehicle Usage in Pupukea
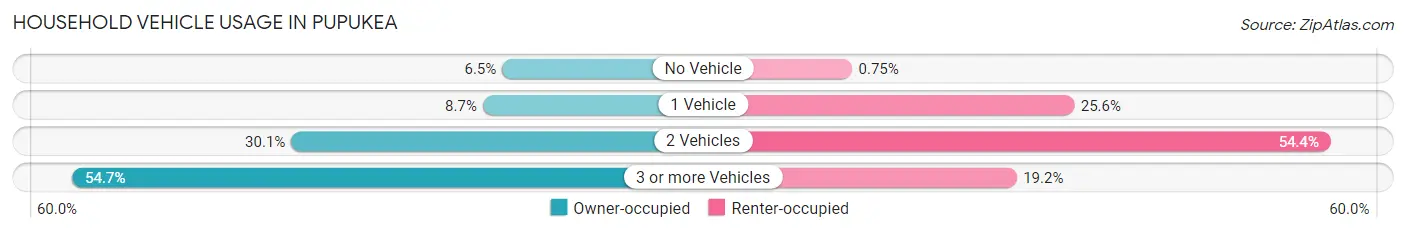
| Vehicles per Household | Owner-occupied | Renter-occupied |
| No Vehicle | 57 (6.5%) | 5 (0.7%) |
| 1 Vehicle | 76 (8.7%) | 171 (25.6%) |
| 2 Vehicles | 264 (30.1%) | 363 (54.4%) |
| 3 or more Vehicles | 479 (54.7%) | 128 (19.2%) |
| Total | 876 (100.0%) | 667 (100.0%) |
Real Estate & Mortgages in Pupukea
Real Estate and Mortgage Overview in Pupukea
| Characteristic | Without Mortgage | With Mortgage |
| Housing Units | 322 | 554 |
| Median Property Value | $1,138,700 | $1,243,900 |
| Median Household Income | $90,333 | $240 |
| Monthly Housing Costs | $750 | $283 |
| Real Estate Taxes | $3,725 | $8 |
Property Value by Mortgage Status in Pupukea
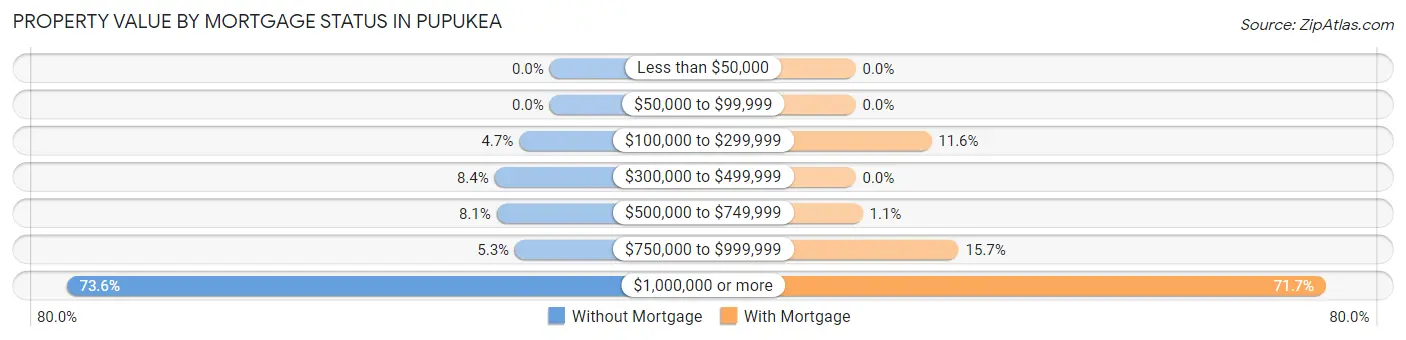
| Property Value | Without Mortgage | With Mortgage |
| Less than $50,000 | 0 (0.0%) | 0 (0.0%) |
| $50,000 to $99,999 | 0 (0.0%) | 0 (0.0%) |
| $100,000 to $299,999 | 15 (4.7%) | 64 (11.6%) |
| $300,000 to $499,999 | 27 (8.4%) | 0 (0.0%) |
| $500,000 to $749,999 | 26 (8.1%) | 6 (1.1%) |
| $750,000 to $999,999 | 17 (5.3%) | 87 (15.7%) |
| $1,000,000 or more | 237 (73.6%) | 397 (71.7%) |
| Total | 322 (100.0%) | 554 (100.0%) |
Household Income by Mortgage Status in Pupukea
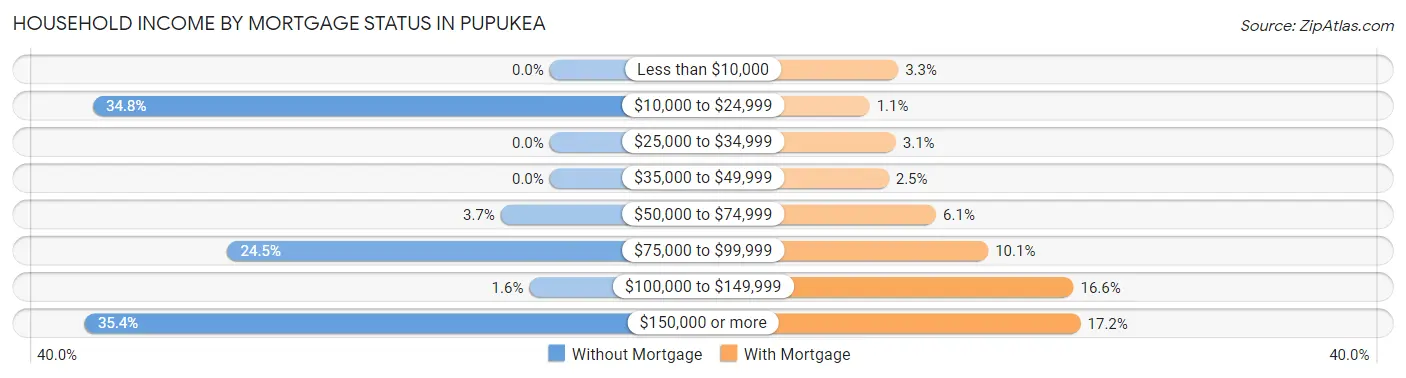
| Household Income | Without Mortgage | With Mortgage |
| Less than $10,000 | 0 (0.0%) | 18 (3.3%) |
| $10,000 to $24,999 | 112 (34.8%) | 6 (1.1%) |
| $25,000 to $34,999 | 0 (0.0%) | 17 (3.1%) |
| $35,000 to $49,999 | 0 (0.0%) | 14 (2.5%) |
| $50,000 to $74,999 | 12 (3.7%) | 34 (6.1%) |
| $75,000 to $99,999 | 79 (24.5%) | 56 (10.1%) |
| $100,000 to $149,999 | 5 (1.5%) | 92 (16.6%) |
| $150,000 or more | 114 (35.4%) | 95 (17.2%) |
| Total | 322 (100.0%) | 554 (100.0%) |
Property Value to Household Income Ratio in Pupukea
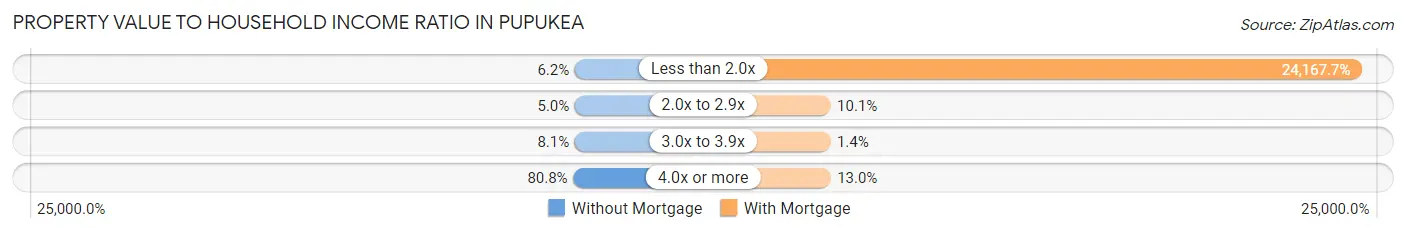
| Value-to-Income Ratio | Without Mortgage | With Mortgage |
| Less than 2.0x | 20 (6.2%) | 133,889 (24,167.7%) |
| 2.0x to 2.9x | 16 (5.0%) | 56 (10.1%) |
| 3.0x to 3.9x | 26 (8.1%) | 8 (1.4%) |
| 4.0x or more | 260 (80.7%) | 72 (13.0%) |
| Total | 322 (100.0%) | 554 (100.0%) |
Real Estate Taxes by Mortgage Status in Pupukea
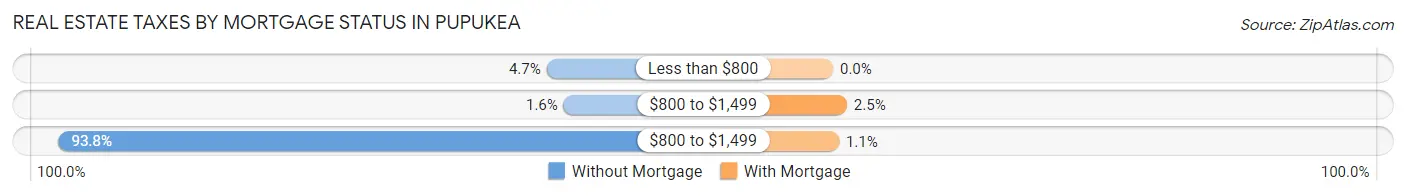
| Property Taxes | Without Mortgage | With Mortgage |
| Less than $800 | 15 (4.7%) | 0 (0.0%) |
| $800 to $1,499 | 5 (1.5%) | 14 (2.5%) |
| $800 to $1,499 | 302 (93.8%) | 6 (1.1%) |
| Total | 322 (100.0%) | 554 (100.0%) |
Health & Disability in Pupukea
Health Insurance Coverage by Age in Pupukea
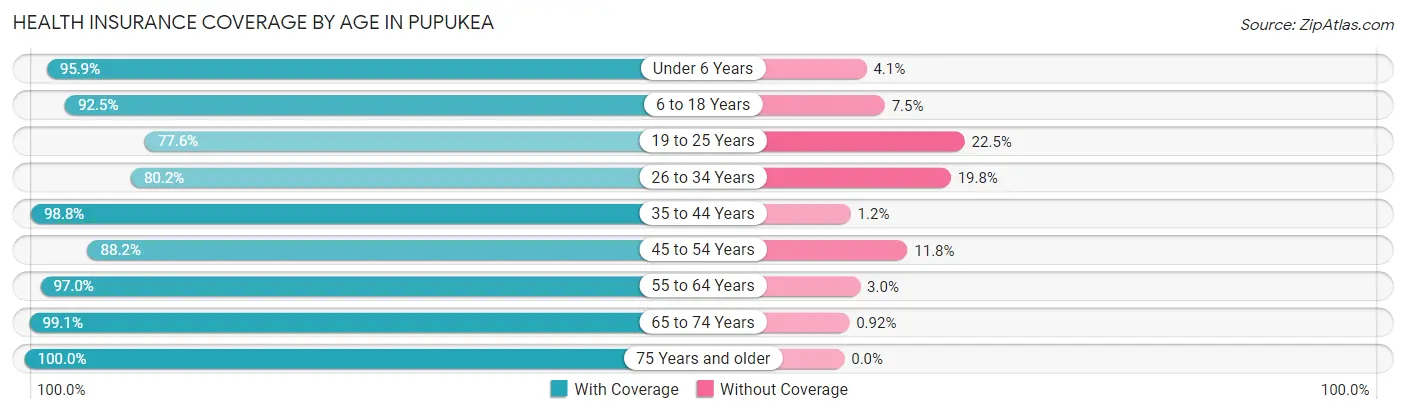
| Age Bracket | With Coverage | Without Coverage |
| Under 6 Years | 324 (95.9%) | 14 (4.1%) |
| 6 to 18 Years | 650 (92.5%) | 53 (7.5%) |
| 19 to 25 Years | 463 (77.5%) | 134 (22.5%) |
| 26 to 34 Years | 501 (80.2%) | 124 (19.8%) |
| 35 to 44 Years | 664 (98.8%) | 8 (1.2%) |
| 45 to 54 Years | 450 (88.2%) | 60 (11.8%) |
| 55 to 64 Years | 426 (97.0%) | 13 (3.0%) |
| 65 to 74 Years | 860 (99.1%) | 8 (0.9%) |
| 75 Years and older | 324 (100.0%) | 0 (0.0%) |
| Total | 4,662 (91.8%) | 414 (8.2%) |
Health Insurance Coverage by Citizenship Status in Pupukea
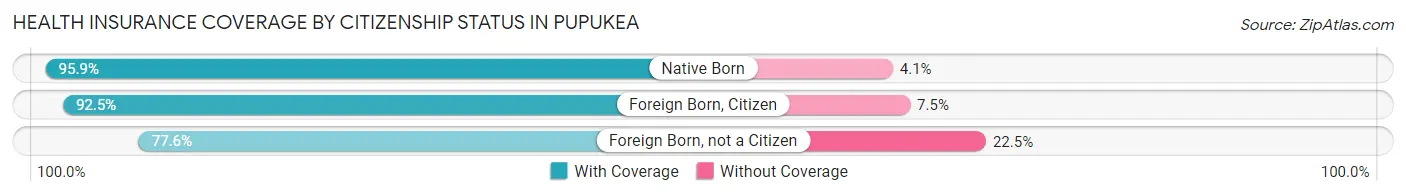
| Citizenship Status | With Coverage | Without Coverage |
| Native Born | 324 (95.9%) | 14 (4.1%) |
| Foreign Born, Citizen | 650 (92.5%) | 53 (7.5%) |
| Foreign Born, not a Citizen | 463 (77.5%) | 134 (22.5%) |
Health Insurance Coverage by Household Income in Pupukea
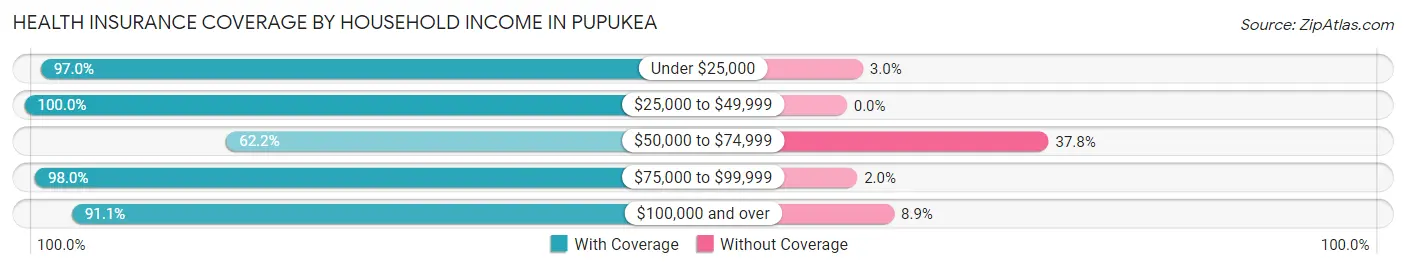
| Household Income | With Coverage | Without Coverage |
| Under $25,000 | 418 (97.0%) | 13 (3.0%) |
| $25,000 to $49,999 | 291 (100.0%) | 0 (0.0%) |
| $50,000 to $74,999 | 153 (62.2%) | 93 (37.8%) |
| $75,000 to $99,999 | 799 (98.0%) | 16 (2.0%) |
| $100,000 and over | 3,001 (91.1%) | 292 (8.9%) |
Public vs Private Health Insurance Coverage by Age in Pupukea
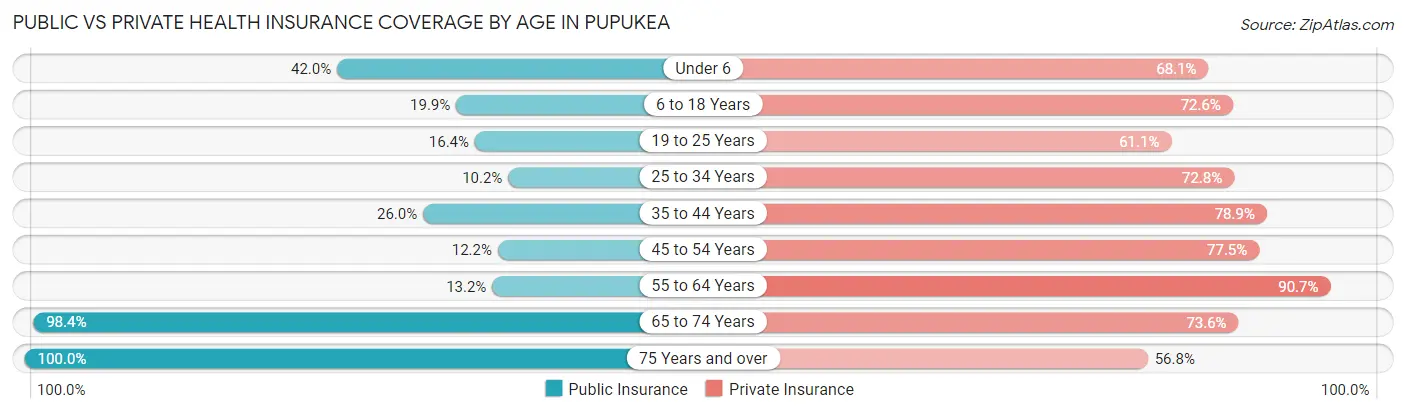
| Age Bracket | Public Insurance | Private Insurance |
| Under 6 | 142 (42.0%) | 230 (68.0%) |
| 6 to 18 Years | 140 (19.9%) | 510 (72.6%) |
| 19 to 25 Years | 98 (16.4%) | 365 (61.1%) |
| 25 to 34 Years | 64 (10.2%) | 455 (72.8%) |
| 35 to 44 Years | 175 (26.0%) | 530 (78.9%) |
| 45 to 54 Years | 62 (12.2%) | 395 (77.4%) |
| 55 to 64 Years | 58 (13.2%) | 398 (90.7%) |
| 65 to 74 Years | 854 (98.4%) | 639 (73.6%) |
| 75 Years and over | 324 (100.0%) | 184 (56.8%) |
| Total | 1,917 (37.8%) | 3,706 (73.0%) |
Disability Status by Sex by Age in Pupukea
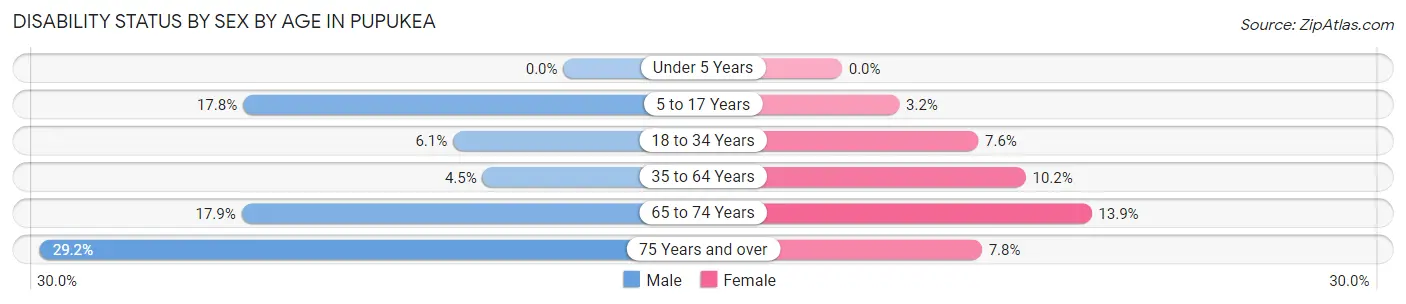
| Age Bracket | Male | Female |
| Under 5 Years | 0 (0.0%) | 0 (0.0%) |
| 5 to 17 Years | 71 (17.8%) | 10 (3.2%) |
| 18 to 34 Years | 36 (6.1%) | 49 (7.6%) |
| 35 to 64 Years | 36 (4.5%) | 84 (10.2%) |
| 65 to 74 Years | 55 (17.9%) | 78 (13.9%) |
| 75 Years and over | 72 (29.1%) | 6 (7.8%) |
Disability Class by Sex by Age in Pupukea
Disability Class: Hearing Difficulty
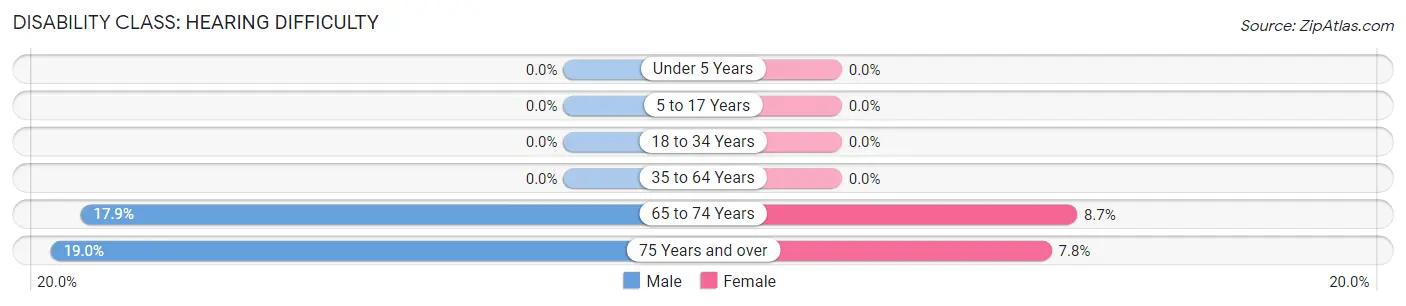
| Age Bracket | Male | Female |
| Under 5 Years | 0 (0.0%) | 0 (0.0%) |
| 5 to 17 Years | 0 (0.0%) | 0 (0.0%) |
| 18 to 34 Years | 0 (0.0%) | 0 (0.0%) |
| 35 to 64 Years | 0 (0.0%) | 0 (0.0%) |
| 65 to 74 Years | 55 (17.9%) | 49 (8.7%) |
| 75 Years and over | 47 (19.0%) | 6 (7.8%) |
Disability Class: Vision Difficulty
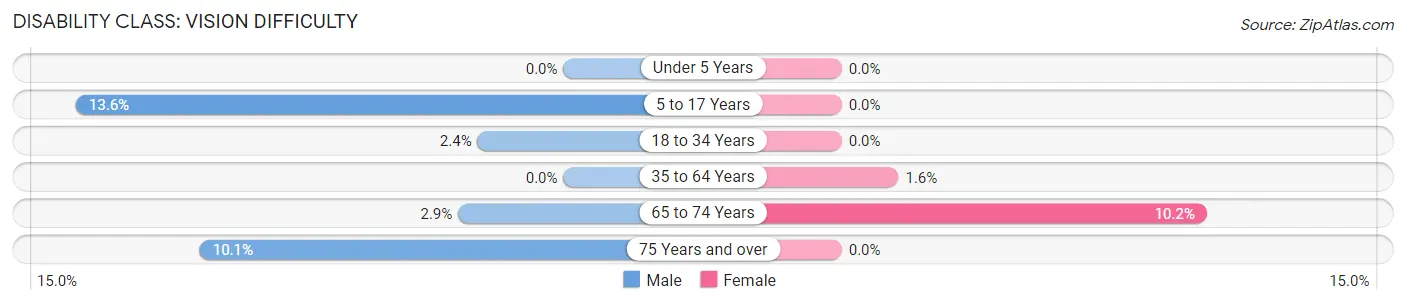
| Age Bracket | Male | Female |
| Under 5 Years | 0 (0.0%) | 0 (0.0%) |
| 5 to 17 Years | 54 (13.6%) | 0 (0.0%) |
| 18 to 34 Years | 14 (2.4%) | 0 (0.0%) |
| 35 to 64 Years | 0 (0.0%) | 13 (1.6%) |
| 65 to 74 Years | 9 (2.9%) | 57 (10.2%) |
| 75 Years and over | 25 (10.1%) | 0 (0.0%) |
Disability Class: Cognitive Difficulty
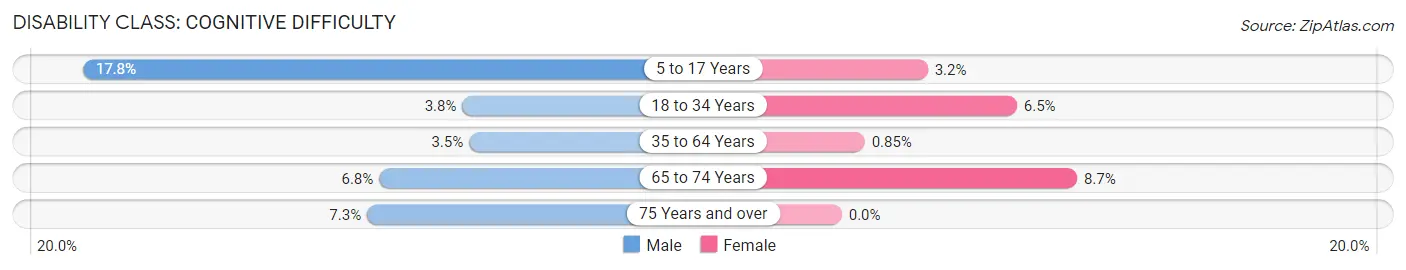
| Age Bracket | Male | Female |
| 5 to 17 Years | 71 (17.8%) | 10 (3.2%) |
| 18 to 34 Years | 22 (3.7%) | 42 (6.5%) |
| 35 to 64 Years | 28 (3.5%) | 7 (0.9%) |
| 65 to 74 Years | 21 (6.8%) | 49 (8.7%) |
| 75 Years and over | 18 (7.3%) | 0 (0.0%) |
Disability Class: Ambulatory Difficulty
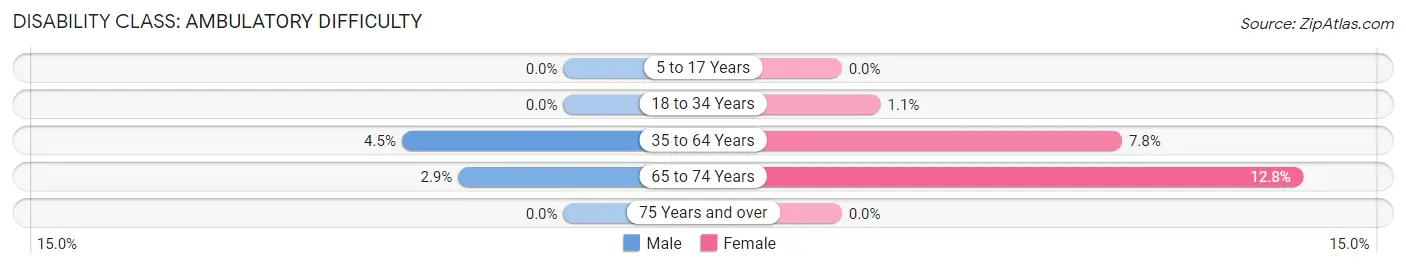
| Age Bracket | Male | Female |
| 5 to 17 Years | 0 (0.0%) | 0 (0.0%) |
| 18 to 34 Years | 0 (0.0%) | 7 (1.1%) |
| 35 to 64 Years | 36 (4.5%) | 64 (7.8%) |
| 65 to 74 Years | 9 (2.9%) | 72 (12.8%) |
| 75 Years and over | 0 (0.0%) | 0 (0.0%) |
Disability Class: Self-Care Difficulty
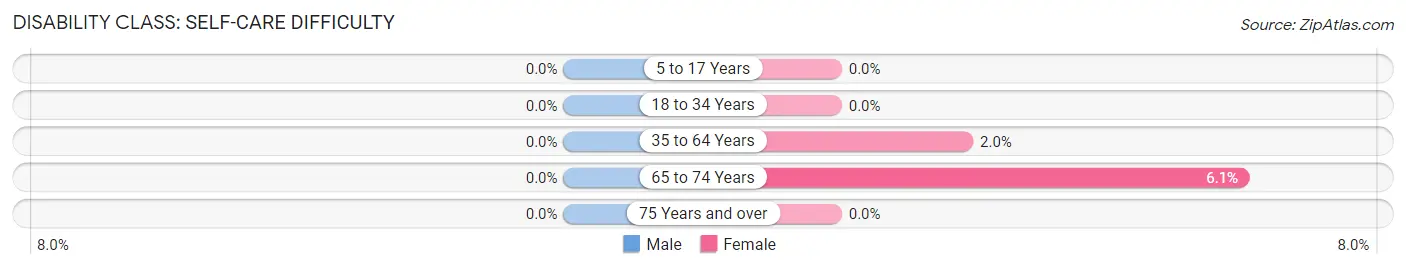
| Age Bracket | Male | Female |
| 5 to 17 Years | 0 (0.0%) | 0 (0.0%) |
| 18 to 34 Years | 0 (0.0%) | 0 (0.0%) |
| 35 to 64 Years | 0 (0.0%) | 16 (1.9%) |
| 65 to 74 Years | 0 (0.0%) | 34 (6.1%) |
| 75 Years and over | 0 (0.0%) | 0 (0.0%) |
Technology Access in Pupukea
Computing Device Access in Pupukea
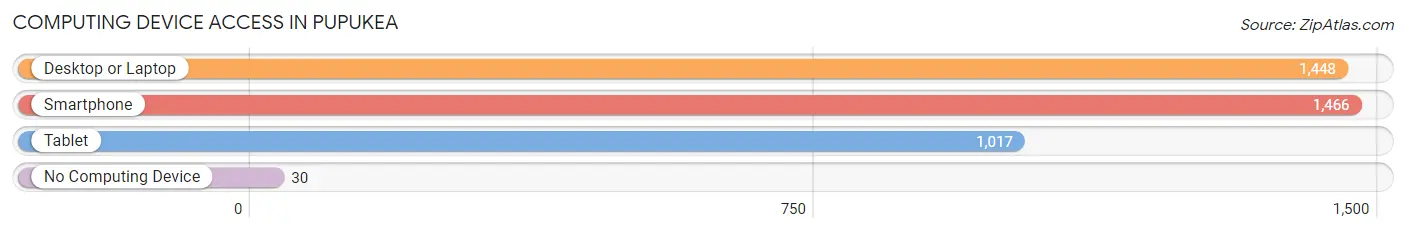
| Device Type | # Households | % Households |
| Desktop or Laptop | 1,448 | 93.8% |
| Smartphone | 1,466 | 95.0% |
| Tablet | 1,017 | 65.9% |
| No Computing Device | 30 | 1.9% |
| Total | 1,543 | 100.0% |
Internet Access in Pupukea
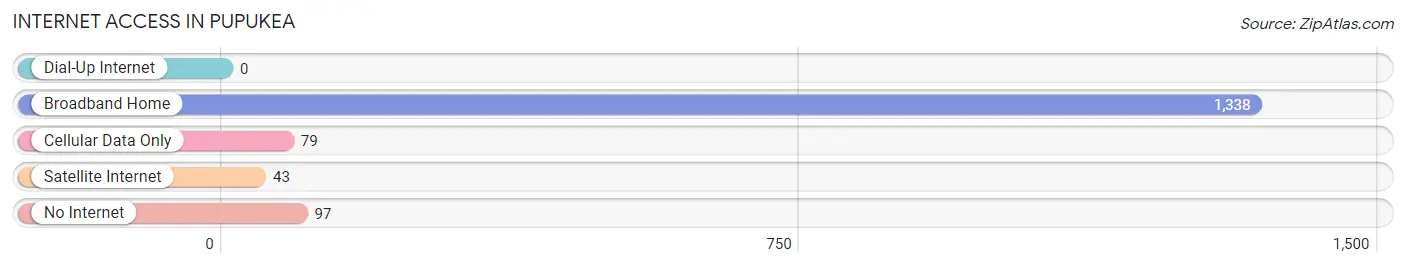
| Internet Type | # Households | % Households |
| Dial-Up Internet | 0 | 0.0% |
| Broadband Home | 1,338 | 86.7% |
| Cellular Data Only | 79 | 5.1% |
| Satellite Internet | 43 | 2.8% |
| No Internet | 97 | 6.3% |
| Total | 1,543 | 100.0% |
Pupukea Summary
Pupukea is a small, unincorporated community located on the North Shore of Oahu, Hawaii. It is situated between the towns of Waimea and Kahuku, and is part of the City and County of Honolulu. The area is known for its beautiful beaches, lush tropical forests, and stunning views of the Pacific Ocean.
Geography
Pupukea is located on the North Shore of Oahu, Hawaii, between the towns of Waimea and Kahuku. It is bordered by the Pacific Ocean to the east, Waimea Bay to the north, and the Waimea Valley to the south. The area is characterized by its rugged coastline, lush tropical forests, and stunning views of the ocean. The area is also home to several beaches, including Pupukea Beach Park, Shark's Cove, and Waimea Bay.
History
The area now known as Pupukea has a long and rich history. It was originally inhabited by the ancient Hawaiians, who used the area for fishing and farming. In the late 1800s, the area was developed by the sugar industry, and the first sugar mill was built in the area in 1876. In the early 1900s, the area was used for pineapple farming, and the first pineapple cannery was built in the area in 1912.
In the 1950s, the area began to be developed for tourism, and the first hotel was built in the area in 1954. In the 1960s, the area was developed for residential use, and the first homes were built in the area in 1965.
Economy
The economy of Pupukea is largely based on tourism and agriculture. The area is home to several hotels and resorts, as well as a variety of restaurants and shops. The area is also home to several farms, which produce a variety of fruits and vegetables.
Demographics
As of the 2010 census, the population of Pupukea was 1,845. The racial makeup of the area was 79.3% White, 8.2% Asian, 6.2% Native Hawaiian and Other Pacific Islander, 4.2% from other races, and 2.1% from two or more races. The median household income was $68,750, and the median family income was $76,250.
Conclusion
Pupukea is a small, unincorporated community located on the North Shore of Oahu, Hawaii. It is known for its beautiful beaches, lush tropical forests, and stunning views of the Pacific Ocean. The economy of the area is largely based on tourism and agriculture, and the population is largely composed of White, Asian, and Native Hawaiian and Other Pacific Islander residents.
Common Questions
What is the Total Population of Pupukea?
Total Population of Pupukea is 5,130.
What is the Total Male Population of Pupukea?
Total Male Population of Pupukea is 2,579.
What is the Total Female Population of Pupukea?
Total Female Population of Pupukea is 2,551.
What is the Ratio of Males per 100 Females in Pupukea?
There are 101.10 Males per 100 Females in Pupukea.
What is the Ratio of Females per 100 Males in Pupukea?
There are 98.91 Females per 100 Males in Pupukea.
What is the Median Population Age in Pupukea?
Median Population Age in Pupukea is 39.7 Years.
What is the Average Family Size in Pupukea
Average Family Size in Pupukea is 3.9 People.
What is the Average Household Size in Pupukea
Average Household Size in Pupukea is 3.3 People.
What is Per Capita Income in Pupukea?
Per Capita income in Pupukea is $42,594.
What is the Median Family Income in Pupukea?
Median Family Income in Pupukea is $134,716.
What is the Median Household income in Pupukea?
Median Household Income in Pupukea is $99,180.
What is Income or Wage Gap in Pupukea?
Income or Wage Gap in Pupukea is 18.4%.
Women in Pupukea earn 81.6 cents for every dollar earned by a man.
What is Inequality or Gini Index in Pupukea?
Inequality or Gini Index in Pupukea is 0.44.
How Large is the Labor Force in Pupukea?
There are 2,567 People in the Labor Forcein in Pupukea.
What is the Percentage of People in the Labor Force in Pupukea?
60.2% of People are in the Labor Force in Pupukea.
What is the Unemployment Rate in Pupukea?
Unemployment Rate in Pupukea is 6.2%.