Kualapuu, HI
Kualapuu Map
Kualapuu Overview
2,157
TOTAL POPULATION
1,111
MALE POPULATION
1,046
FEMALE POPULATION
106.21
MALES / 100 FEMALES
94.15
FEMALES / 100 MALES
41.1
MEDIAN AGE
4.0
AVG FAMILY SIZE
3.5
AVG HOUSEHOLD SIZE
$22,741
PER CAPITA INCOME
$62,625
AVG FAMILY INCOME
$46,711
AVG HOUSEHOLD INCOME
28.4%
WAGE / INCOME GAP [ % ]
71.6¢/ $1
WAGE / INCOME GAP [ $ ]
0.49
INEQUALITY / GINI INDEX
845
LABOR FORCE [ PEOPLE ]
51.4%
PERCENT IN LABOR FORCE
5.7%
UNEMPLOYMENT RATE
Kualapuu Zip Codes
Kualapuu Area Codes
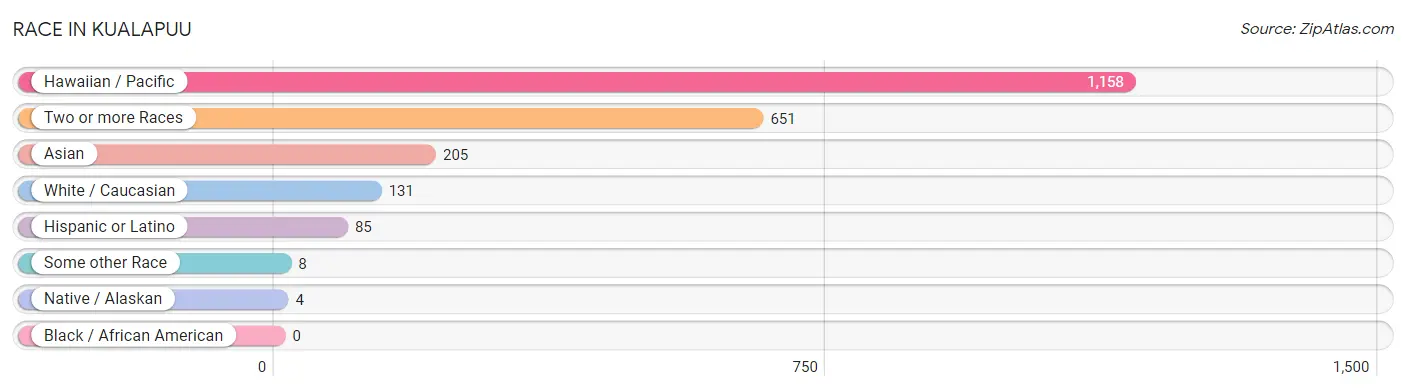
Race in Kualapuu
The most populous races in Kualapuu are Hawaiian / Pacific (1,158 | 53.7%), Two or more Races (651 | 30.2%), and Asian (205 | 9.5%).
| Race | # Population | % Population |
| Asian | 205 | 9.5% |
| Black / African American | 0 | 0.0% |
| Hawaiian / Pacific | 1,158 | 53.7% |
| Hispanic or Latino | 85 | 3.9% |
| Native / Alaskan | 4 | 0.2% |
| White / Caucasian | 131 | 6.1% |
| Two or more Races | 651 | 30.2% |
| Some other Race | 8 | 0.4% |
| Total | 2,157 | 100.0% |
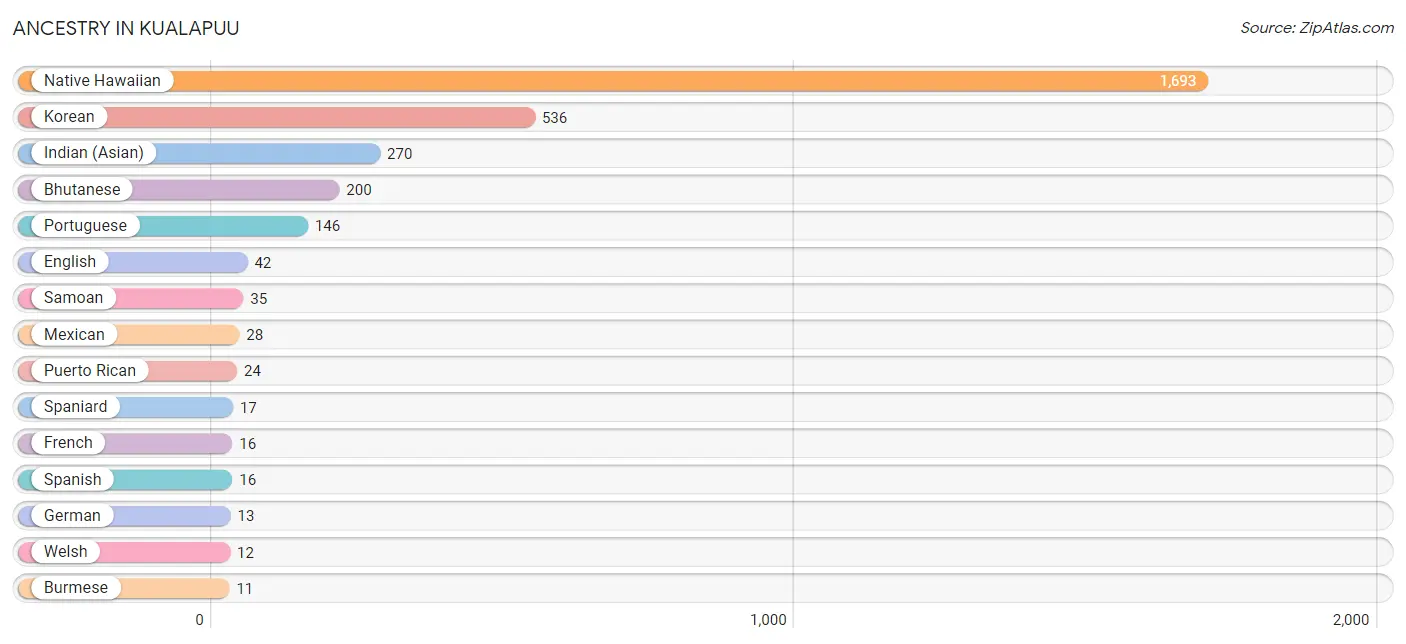
Ancestry in Kualapuu
The most populous ancestries reported in Kualapuu are Native Hawaiian (1,693 | 78.5%), Korean (536 | 24.8%), Indian (Asian) (270 | 12.5%), Bhutanese (200 | 9.3%), and Portuguese (146 | 6.8%), together accounting for 131.9% of all Kualapuu residents.
| Ancestry | # Population | % Population |
| Bhutanese | 200 | 9.3% |
| Burmese | 11 | 0.5% |
| Cherokee | 3 | 0.1% |
| Chinese | 8 | 0.4% |
| Colville | 4 | 0.2% |
| English | 42 | 1.9% |
| European | 10 | 0.5% |
| Fijian | 5 | 0.2% |
| French | 16 | 0.7% |
| German | 13 | 0.6% |
| Indian (Asian) | 270 | 12.5% |
| Irish | 9 | 0.4% |
| Italian | 3 | 0.1% |
| Korean | 536 | 24.8% |
| Mexican | 28 | 1.3% |
| Native Hawaiian | 1,693 | 78.5% |
| Portuguese | 146 | 6.8% |
| Puerto Rican | 24 | 1.1% |
| Samoan | 35 | 1.6% |
| Spaniard | 17 | 0.8% |
| Spanish | 16 | 0.7% |
| Tongan | 2 | 0.1% |
| Welsh | 12 | 0.6% | View All 23 Rows |
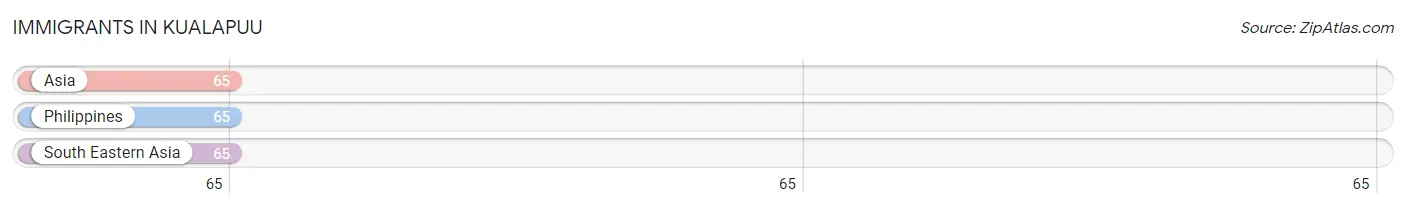
Immigrants in Kualapuu
The most numerous immigrant groups reported in Kualapuu came from Asia (65 | 3.0%), Philippines (65 | 3.0%), and South Eastern Asia (65 | 3.0%), together accounting for 9.0% of all Kualapuu residents.
| Immigration Origin | # Population | % Population |
| Asia | 65 | 3.0% |
| Philippines | 65 | 3.0% |
| South Eastern Asia | 65 | 3.0% | View All 3 Rows |
Sex and Age in Kualapuu
Sex and Age in Kualapuu
The most populous age groups in Kualapuu are 65 to 69 Years (100 | 9.0%) for men and 15 to 19 Years (117 | 11.2%) for women.
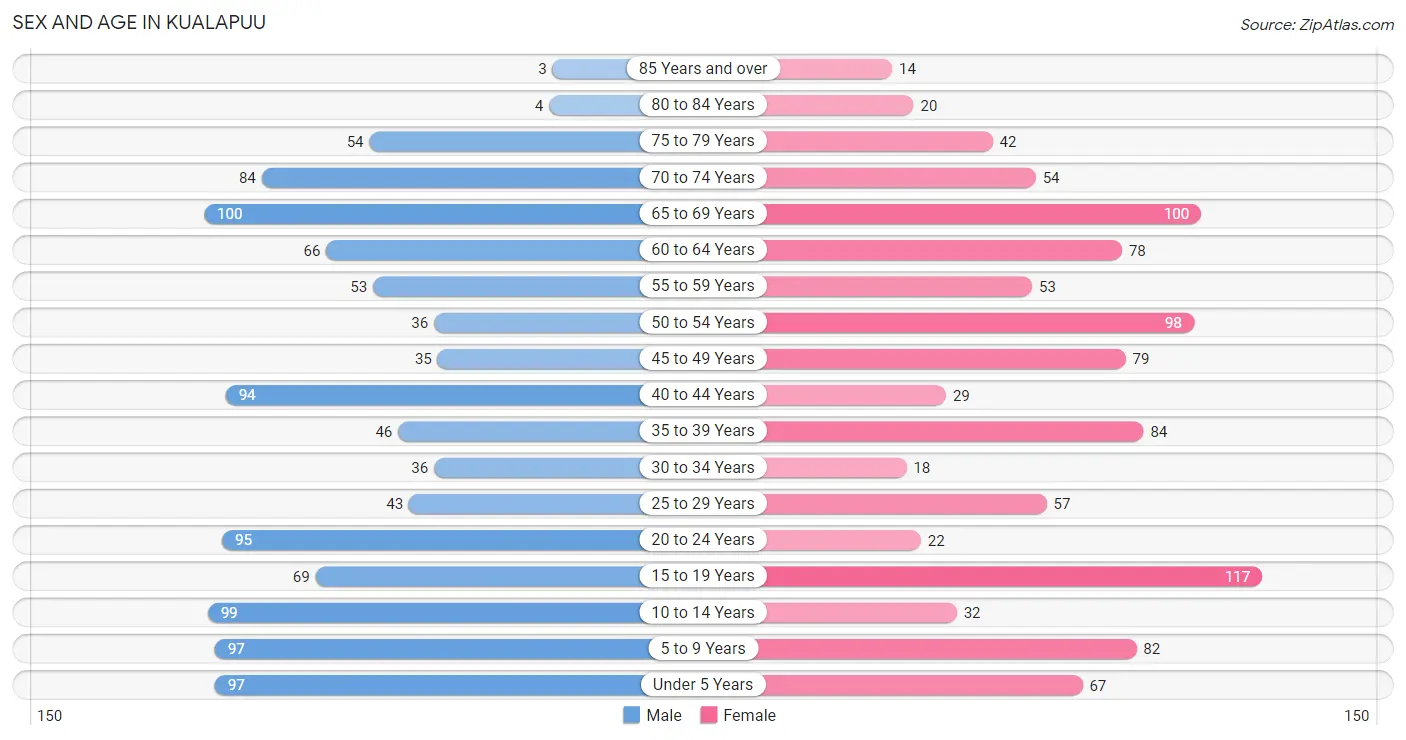
| Age Bracket | Male | Female |
| Under 5 Years | 97 (8.7%) | 67 (6.4%) |
| 5 to 9 Years | 97 (8.7%) | 82 (7.8%) |
| 10 to 14 Years | 99 (8.9%) | 32 (3.1%) |
| 15 to 19 Years | 69 (6.2%) | 117 (11.2%) |
| 20 to 24 Years | 95 (8.6%) | 22 (2.1%) |
| 25 to 29 Years | 43 (3.9%) | 57 (5.4%) |
| 30 to 34 Years | 36 (3.2%) | 18 (1.7%) |
| 35 to 39 Years | 46 (4.1%) | 84 (8.0%) |
| 40 to 44 Years | 94 (8.5%) | 29 (2.8%) |
| 45 to 49 Years | 35 (3.2%) | 79 (7.5%) |
| 50 to 54 Years | 36 (3.2%) | 98 (9.4%) |
| 55 to 59 Years | 53 (4.8%) | 53 (5.1%) |
| 60 to 64 Years | 66 (5.9%) | 78 (7.5%) |
| 65 to 69 Years | 100 (9.0%) | 100 (9.6%) |
| 70 to 74 Years | 84 (7.6%) | 54 (5.2%) |
| 75 to 79 Years | 54 (4.9%) | 42 (4.0%) |
| 80 to 84 Years | 4 (0.4%) | 20 (1.9%) |
| 85 Years and over | 3 (0.3%) | 14 (1.3%) |
| Total | 1,111 (100.0%) | 1,046 (100.0%) |
Families and Households in Kualapuu
Median Family Size in Kualapuu
The median family size in Kualapuu is 3.95 persons per family, with married-couple families (353 | 70.5%) accounting for the largest median family size of 4.16 persons per family. On the other hand, single male/father families (68 | 13.6%) represent the smallest median family size with 3.04 persons per family.
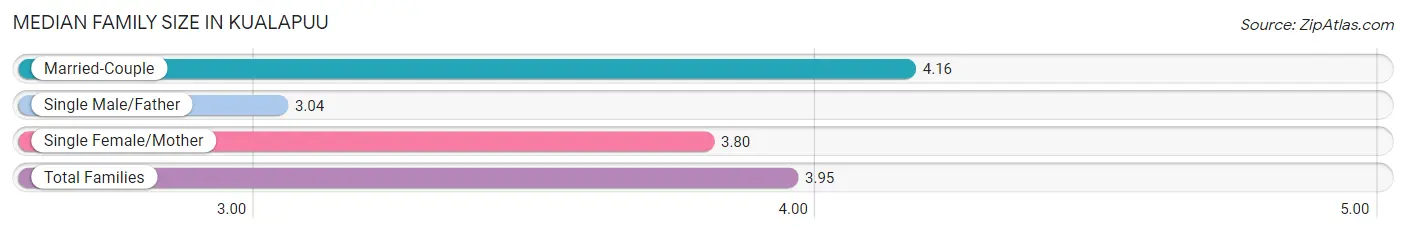
| Family Type | # Families | Family Size |
| Married-Couple | 353 (70.5%) | 4.16 |
| Single Male/Father | 68 (13.6%) | 3.04 |
| Single Female/Mother | 80 (16.0%) | 3.80 |
| Total Families | 501 (100.0%) | 3.95 |
Median Household Size in Kualapuu
The median household size in Kualapuu is 3.55 persons per household, with married-couple households (353 | 58.1%) accounting for the largest median household size of 4.25 persons per household. non-family households (107 | 17.6%) represent the smallest median household size with 1.07 persons per household.
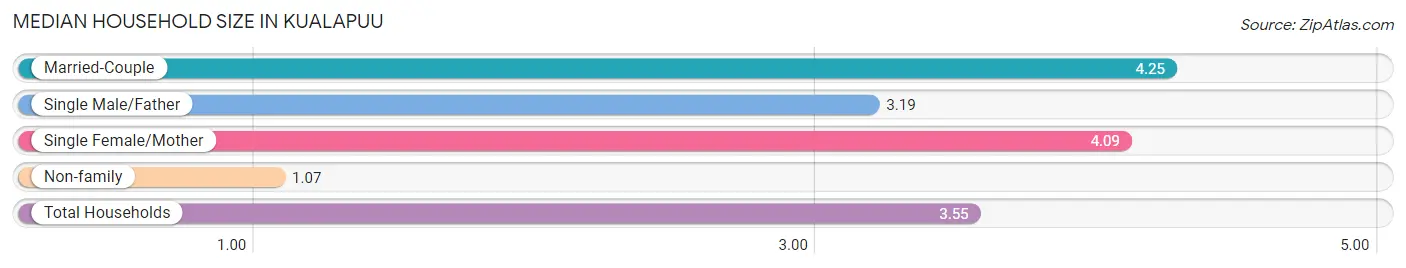
| Household Type | # Households | Household Size |
| Married-Couple | 353 (58.1%) | 4.25 |
| Single Male/Father | 68 (11.2%) | 3.19 |
| Single Female/Mother | 80 (13.2%) | 4.09 |
| Non-family | 107 (17.6%) | 1.07 |
| Total Households | 608 (100.0%) | 3.55 |
Household Size by Marriage Status in Kualapuu
Out of a total of 608 households in Kualapuu, 501 (82.4%) are family households, while 107 (17.6%) are nonfamily households. The most numerous type of family households are 2-person households, comprising 189, and the most common type of nonfamily households are 1-person households, comprising 101.
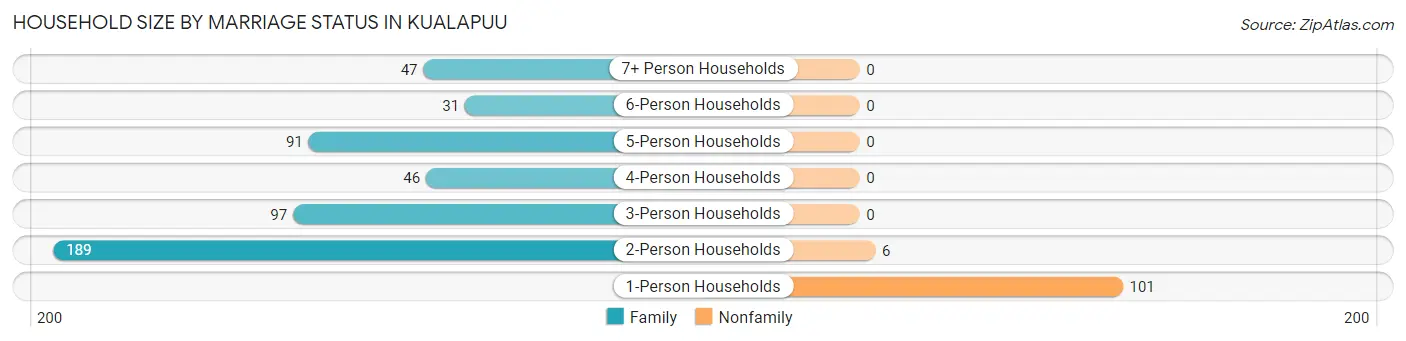
| Household Size | Family Households | Nonfamily Households |
| 1-Person Households | - | 101 (16.6%) |
| 2-Person Households | 189 (31.1%) | 6 (1.0%) |
| 3-Person Households | 97 (16.0%) | 0 (0.0%) |
| 4-Person Households | 46 (7.6%) | 0 (0.0%) |
| 5-Person Households | 91 (15.0%) | 0 (0.0%) |
| 6-Person Households | 31 (5.1%) | 0 (0.0%) |
| 7+ Person Households | 47 (7.7%) | 0 (0.0%) |
| Total | 501 (82.4%) | 107 (17.6%) |
Female Fertility in Kualapuu
Fertility by Age in Kualapuu
Average fertility rate in Kualapuu is 39.0 births per 1,000 women. Women in the age bracket of 20 to 34 years have the highest fertility rate with 124.0 births per 1,000 women. Women in the age bracket of 20 to 34 years acount for 70.6% of all women with births.
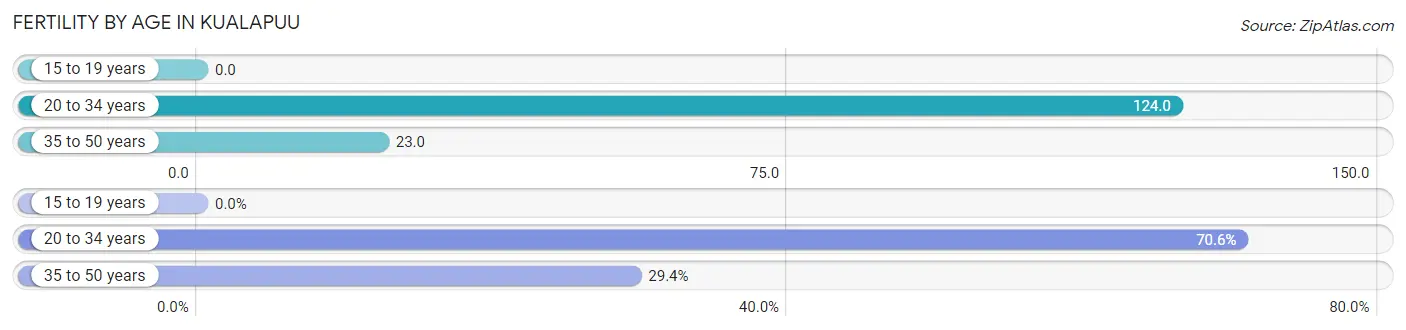
| Age Bracket | Women with Births | Births / 1,000 Women |
| 15 to 19 years | 0 (0.0%) | 0.0 |
| 20 to 34 years | 12 (70.6%) | 124.0 |
| 35 to 50 years | 5 (29.4%) | 23.0 |
| Total | 17 (100.0%) | 39.0 |
Fertility by Age by Marriage Status in Kualapuu
70.6% of women with births (17) in Kualapuu are married. The highest percentage of unmarried women with births falls into 35 to 50 years age bracket with 100.0% of them unmarried at the time of birth, while the lowest percentage of unmarried women with births belong to 20 to 34 years age bracket with 0.0% of them unmarried.
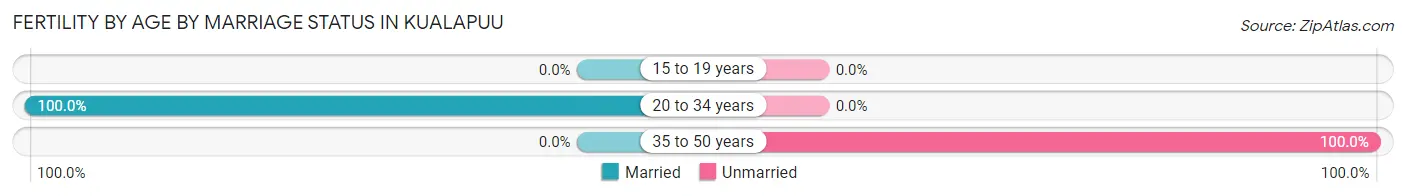
| Age Bracket | Married | Unmarried |
| 15 to 19 years | 0 (0.0%) | 0 (0.0%) |
| 20 to 34 years | 12 (100.0%) | 0 (0.0%) |
| 35 to 50 years | 0 (0.0%) | 5 (100.0%) |
| Total | 12 (70.6%) | 5 (29.4%) |
Fertility by Education in Kualapuu
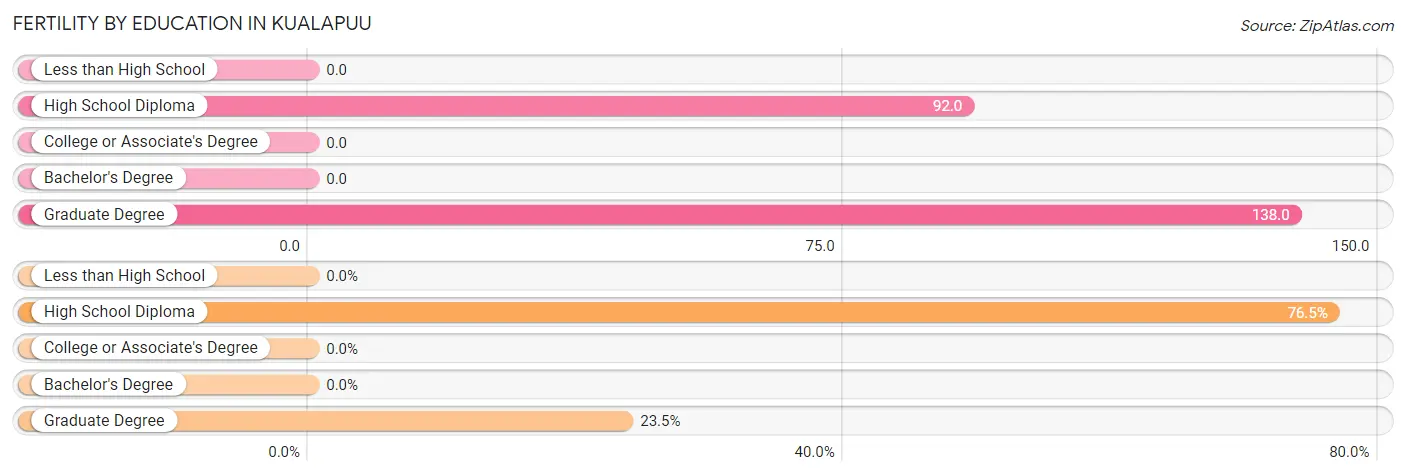
| Educational Attainment | Women with Births | Births / 1,000 Women |
| Less than High School | 0 (0.0%) | 0.0 |
| High School Diploma | 13 (76.5%) | 92.0 |
| College or Associate's Degree | 0 (0.0%) | 0.0 |
| Bachelor's Degree | 0 (0.0%) | 0.0 |
| Graduate Degree | 4 (23.5%) | 138.0 |
| Total | 17 (100.0%) | 39.0 |
Fertility by Education by Marriage Status in Kualapuu
29.4% of women with births in Kualapuu are unmarried. Women with the educational attainment of graduate degree are most likely to be married with 100.0% of them married at childbirth, while women with the educational attainment of high school diploma are least likely to be married with 38.5% of them unmarried at childbirth.
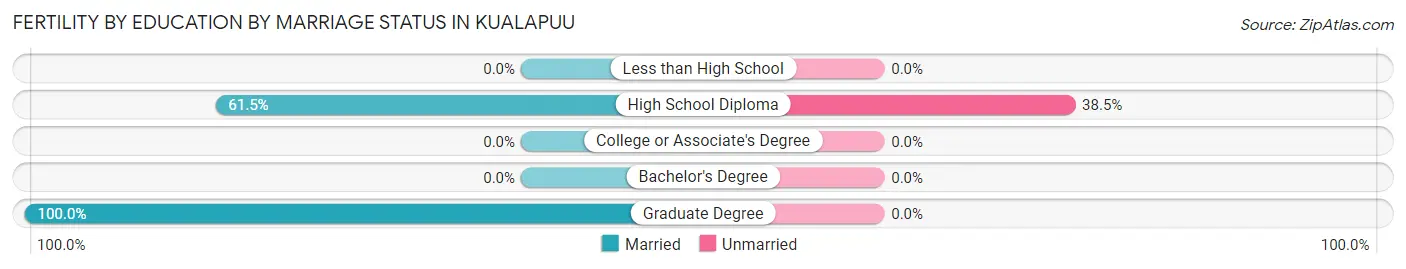
| Educational Attainment | Married | Unmarried |
| Less than High School | 0 (0.0%) | 0 (0.0%) |
| High School Diploma | 8 (61.5%) | 5 (38.5%) |
| College or Associate's Degree | 0 (0.0%) | 0 (0.0%) |
| Bachelor's Degree | 0 (0.0%) | 0 (0.0%) |
| Graduate Degree | 4 (100.0%) | 0 (0.0%) |
| Total | 12 (70.6%) | 5 (29.4%) |
Income in Kualapuu
Income Overview in Kualapuu
Per Capita Income in Kualapuu is $22,741, while median incomes of families and households are $62,625 and $46,711 respectively.
| Characteristic | Number | Measure |
| Per Capita Income | 2,157 | $22,741 |
| Median Family Income | 501 | $62,625 |
| Mean Family Income | 501 | $81,741 |
| Median Household Income | 608 | $46,711 |
| Mean Household Income | 608 | $75,643 |
| Income Deficit | 501 | $0 |
| Wage / Income Gap (%) | 2,157 | 28.45% |
| Wage / Income Gap ($) | 2,157 | 71.55¢ per $1 |
| Gini / Inequality Index | 2,157 | 0.49 |
Earnings by Sex in Kualapuu
Average Earnings in Kualapuu are $29,976, $25,000 for men and $34,940 for women, a difference of 28.4%.
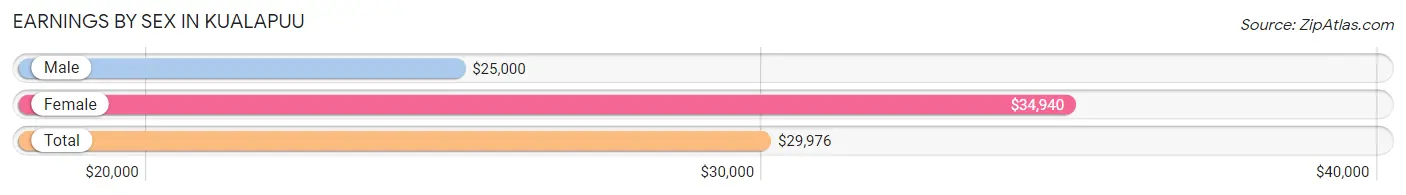
| Sex | Number | Average Earnings |
| Male | 362 (42.9%) | $25,000 |
| Female | 481 (57.1%) | $34,940 |
| Total | 843 (100.0%) | $29,976 |
Earnings by Sex by Income Bracket in Kualapuu
The most common earnings brackets in Kualapuu are $100,000+ for men (40 | 11.1%) and $35,000 to $39,999 for women (68 | 14.1%).
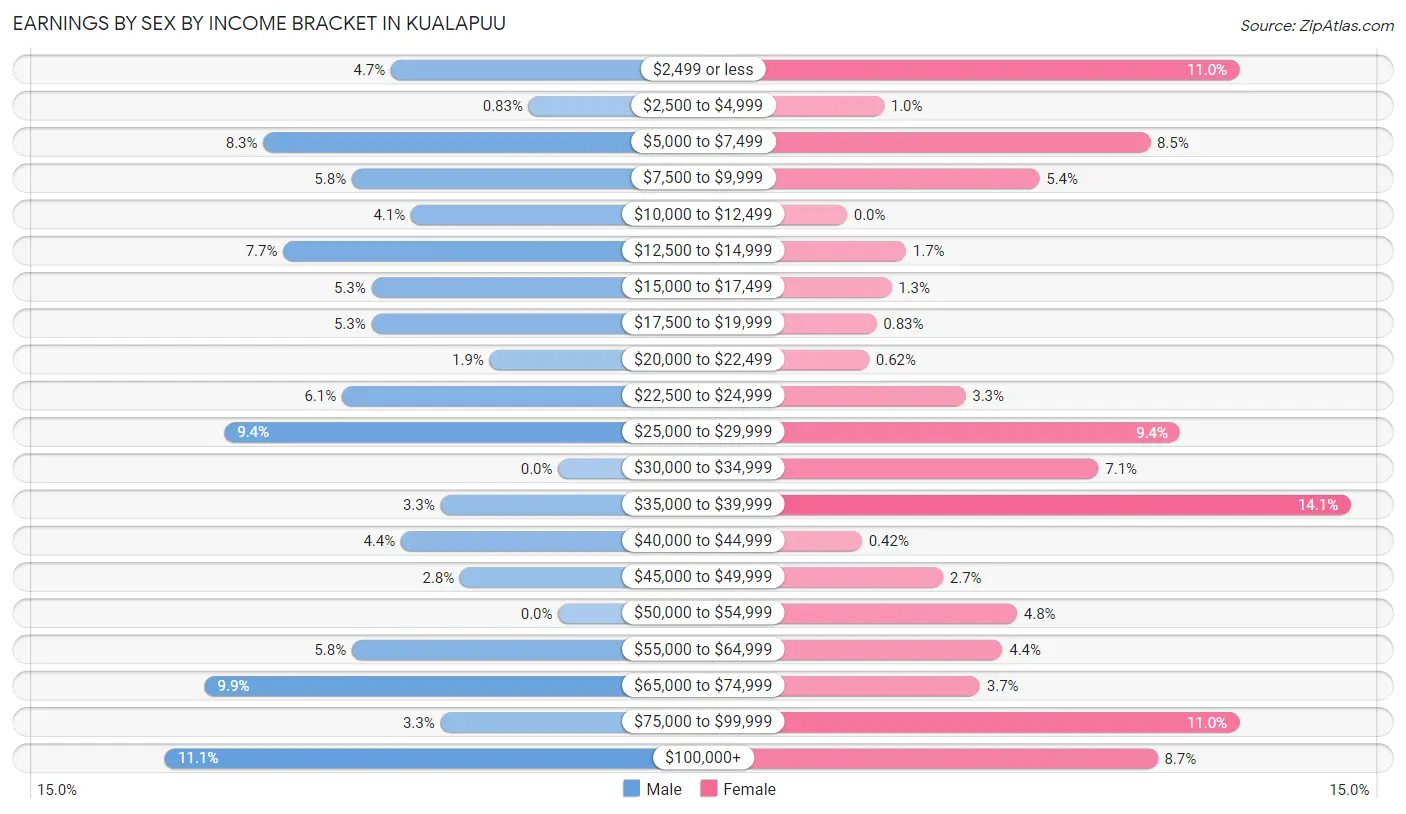
| Income | Male | Female |
| $2,499 or less | 17 (4.7%) | 53 (11.0%) |
| $2,500 to $4,999 | 3 (0.8%) | 5 (1.0%) |
| $5,000 to $7,499 | 30 (8.3%) | 41 (8.5%) |
| $7,500 to $9,999 | 21 (5.8%) | 26 (5.4%) |
| $10,000 to $12,499 | 15 (4.1%) | 0 (0.0%) |
| $12,500 to $14,999 | 28 (7.7%) | 8 (1.7%) |
| $15,000 to $17,499 | 19 (5.2%) | 6 (1.3%) |
| $17,500 to $19,999 | 19 (5.2%) | 4 (0.8%) |
| $20,000 to $22,499 | 7 (1.9%) | 3 (0.6%) |
| $22,500 to $24,999 | 22 (6.1%) | 16 (3.3%) |
| $25,000 to $29,999 | 34 (9.4%) | 45 (9.4%) |
| $30,000 to $34,999 | 0 (0.0%) | 34 (7.1%) |
| $35,000 to $39,999 | 12 (3.3%) | 68 (14.1%) |
| $40,000 to $44,999 | 16 (4.4%) | 2 (0.4%) |
| $45,000 to $49,999 | 10 (2.8%) | 13 (2.7%) |
| $50,000 to $54,999 | 0 (0.0%) | 23 (4.8%) |
| $55,000 to $64,999 | 21 (5.8%) | 21 (4.4%) |
| $65,000 to $74,999 | 36 (9.9%) | 18 (3.7%) |
| $75,000 to $99,999 | 12 (3.3%) | 53 (11.0%) |
| $100,000+ | 40 (11.1%) | 42 (8.7%) |
| Total | 362 (100.0%) | 481 (100.0%) |
Earnings by Sex by Educational Attainment in Kualapuu
Average earnings in Kualapuu are $29,514 for men and $37,872 for women, a difference of 22.1%. Men with an educational attainment of college or associate's degree enjoy the highest average annual earnings of $57,083, while those with high school diploma education earn the least with $22,083. Women with an educational attainment of graduate degree earn the most with the average annual earnings of $87,411, while those with college or associate's degree education have the smallest earnings of $30,000.
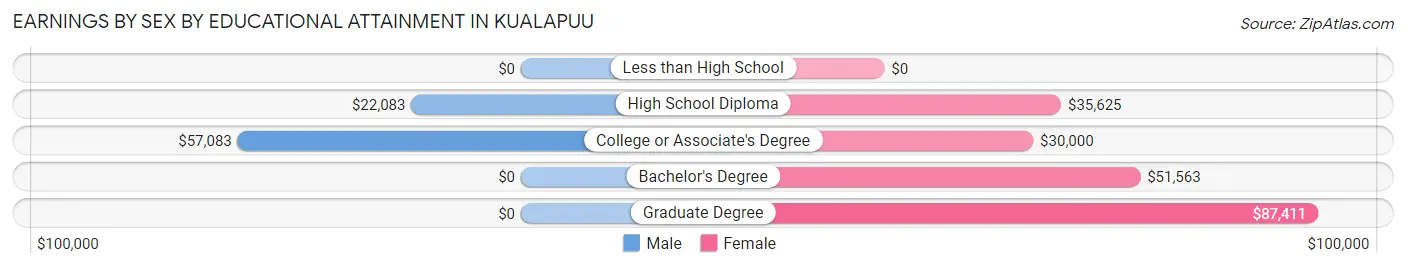
| Educational Attainment | Male Income | Female Income |
| Less than High School | - | - |
| High School Diploma | $22,083 | $35,625 |
| College or Associate's Degree | $57,083 | $30,000 |
| Bachelor's Degree | - | - |
| Graduate Degree | - | - |
| Total | $29,514 | $37,872 |
Family Income in Kualapuu
Family Income Brackets in Kualapuu
According to the Kualapuu family income data, there are 81 families falling into the $100,000 to $149,999 income range, which is the most common income bracket and makes up 16.2% of all families. Conversely, the less than $10,000 income bracket is the least frequent group with only 25 families (5.0%) belonging to this category.
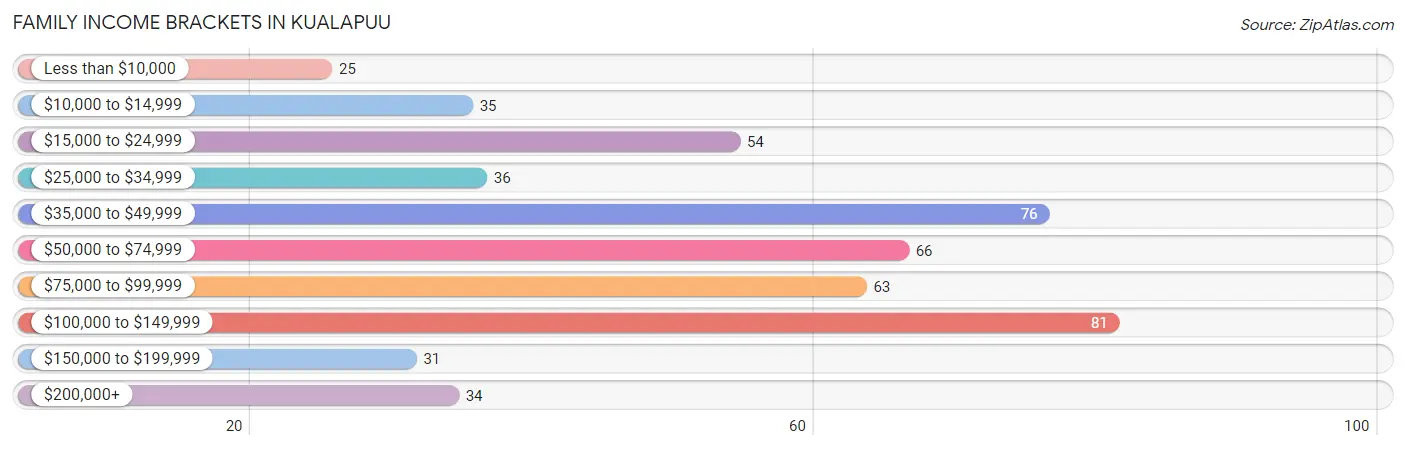
| Income Bracket | # Families | % Families |
| Less than $10,000 | 25 | 5.0% |
| $10,000 to $14,999 | 35 | 7.0% |
| $15,000 to $24,999 | 54 | 10.8% |
| $25,000 to $34,999 | 36 | 7.2% |
| $35,000 to $49,999 | 76 | 15.2% |
| $50,000 to $74,999 | 66 | 13.2% |
| $75,000 to $99,999 | 63 | 12.6% |
| $100,000 to $149,999 | 81 | 16.2% |
| $150,000 to $199,999 | 31 | 6.2% |
| $200,000+ | 34 | 6.8% |
Family Income by Famaliy Size in Kualapuu
5-person families (96 | 19.2%) account for the highest median family income in Kualapuu with $82,500 per family, while 3-person families (103 | 20.6%) have the highest median income of $25,982 per family member.
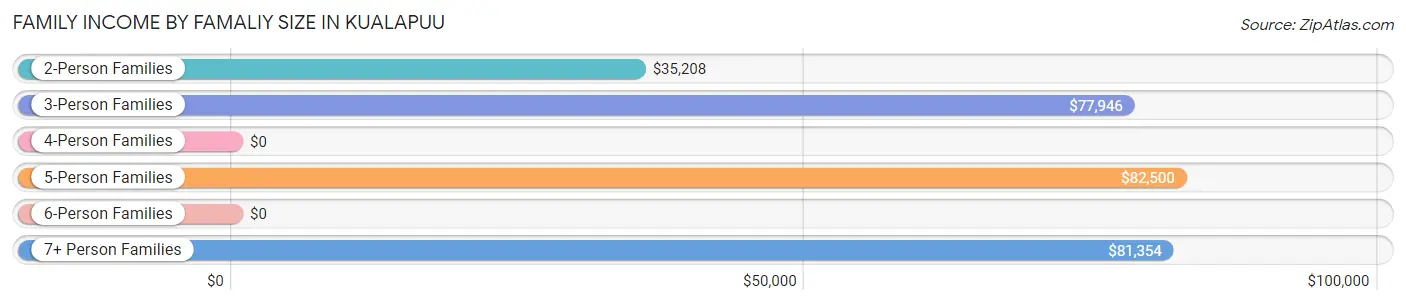
| Income Bracket | # Families | Median Income |
| 2-Person Families | 197 (39.3%) | $35,208 |
| 3-Person Families | 103 (20.6%) | $77,946 |
| 4-Person Families | 40 (8.0%) | $0 |
| 5-Person Families | 96 (19.2%) | $82,500 |
| 6-Person Families | 18 (3.6%) | $0 |
| 7+ Person Families | 47 (9.4%) | $81,354 |
| Total | 501 (100.0%) | $62,625 |
Family Income by Number of Earners in Kualapuu
The median family income in Kualapuu is $62,625, with families comprising 3+ earners (76) having the highest median family income of $173,846, while families with no earners (165) have the lowest median family income of $22,031, accounting for 15.2% and 32.9% of families, respectively.
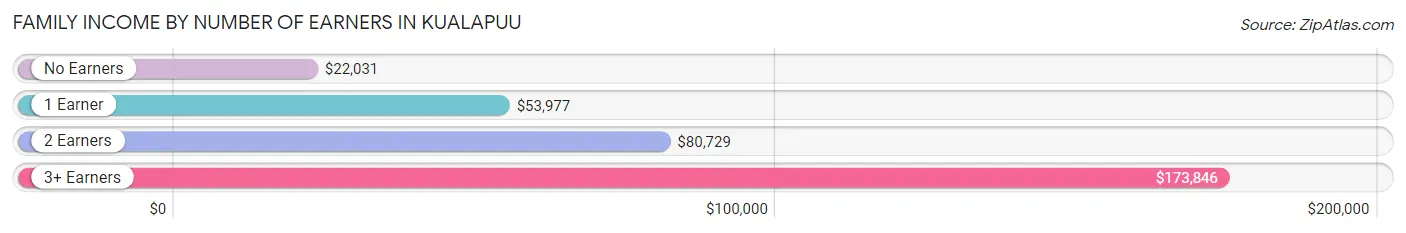
| Number of Earners | # Families | Median Income |
| No Earners | 165 (32.9%) | $22,031 |
| 1 Earner | 131 (26.2%) | $53,977 |
| 2 Earners | 129 (25.8%) | $80,729 |
| 3+ Earners | 76 (15.2%) | $173,846 |
| Total | 501 (100.0%) | $62,625 |
Household Income in Kualapuu
Household Income Brackets in Kualapuu
With 108 households falling in the category, the $35,000 to $49,999 income range is the most frequent in Kualapuu, accounting for 17.8% of all households. In contrast, only 34 households (5.6%) fall into the $200,000+ income bracket, making it the least populous group.
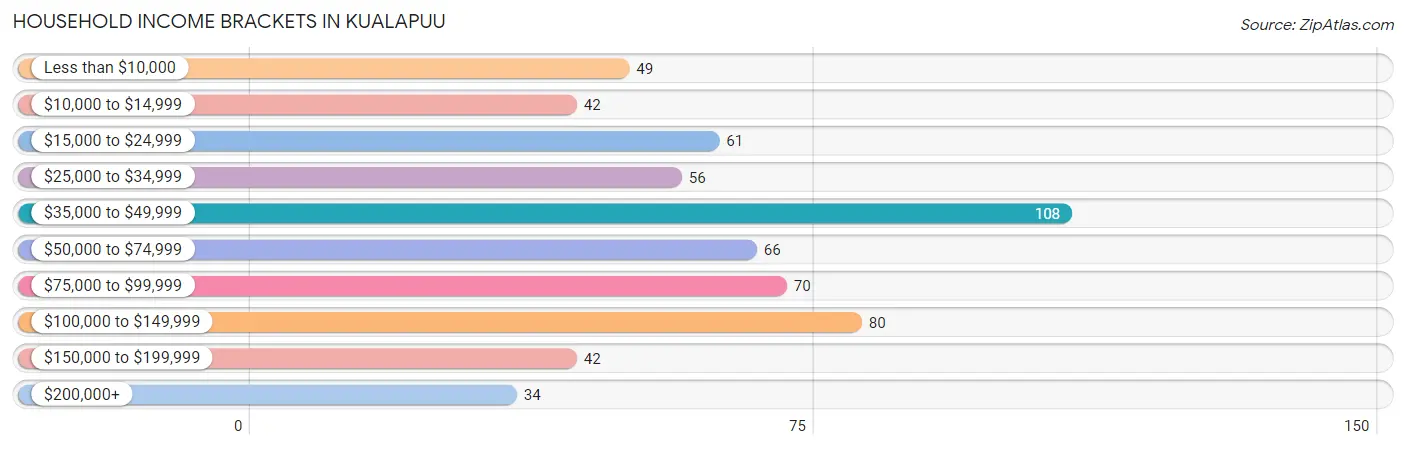
| Income Bracket | # Households | % Households |
| Less than $10,000 | 49 | 8.1% |
| $10,000 to $14,999 | 42 | 6.9% |
| $15,000 to $24,999 | 61 | 10.0% |
| $25,000 to $34,999 | 56 | 9.2% |
| $35,000 to $49,999 | 108 | 17.8% |
| $50,000 to $74,999 | 66 | 10.9% |
| $75,000 to $99,999 | 70 | 11.5% |
| $100,000 to $149,999 | 80 | 13.2% |
| $150,000 to $199,999 | 42 | 6.9% |
| $200,000+ | 34 | 5.6% |
Household Income by Householder Age in Kualapuu
The median household income in Kualapuu is $46,711, with the highest median household income of $81,354 found in the 25 to 44 years age bracket for the primary householder. A total of 85 households (14.0%) fall into this category. Meanwhile, the 15 to 24 years age bracket for the primary householder has the lowest median household income of $0, with 4 households (0.7%) in this group.
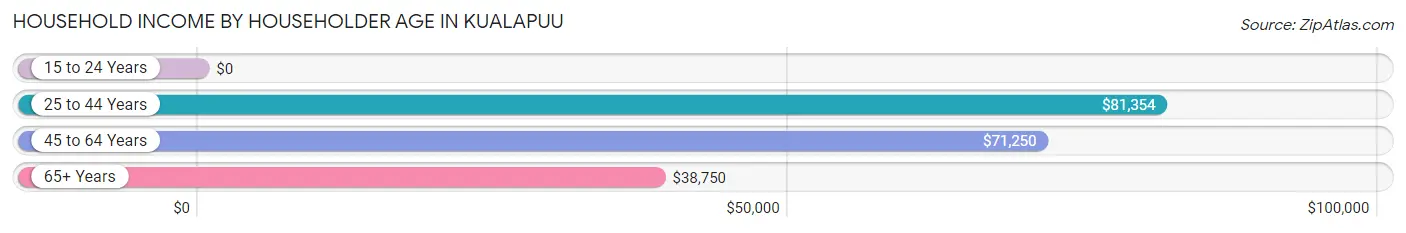
| Income Bracket | # Households | Median Income |
| 15 to 24 Years | 4 (0.7%) | $0 |
| 25 to 44 Years | 85 (14.0%) | $81,354 |
| 45 to 64 Years | 281 (46.2%) | $71,250 |
| 65+ Years | 238 (39.1%) | $38,750 |
| Total | 608 (100.0%) | $46,711 |
Poverty in Kualapuu
Income Below Poverty by Sex and Age in Kualapuu
With 16.2% poverty level for males and 14.2% for females among the residents of Kualapuu, 12 to 14 year old males and 18 to 24 year old females are the most vulnerable to poverty, with 25 males (38.5%) and 18 females (33.3%) in their respective age groups living below the poverty level.
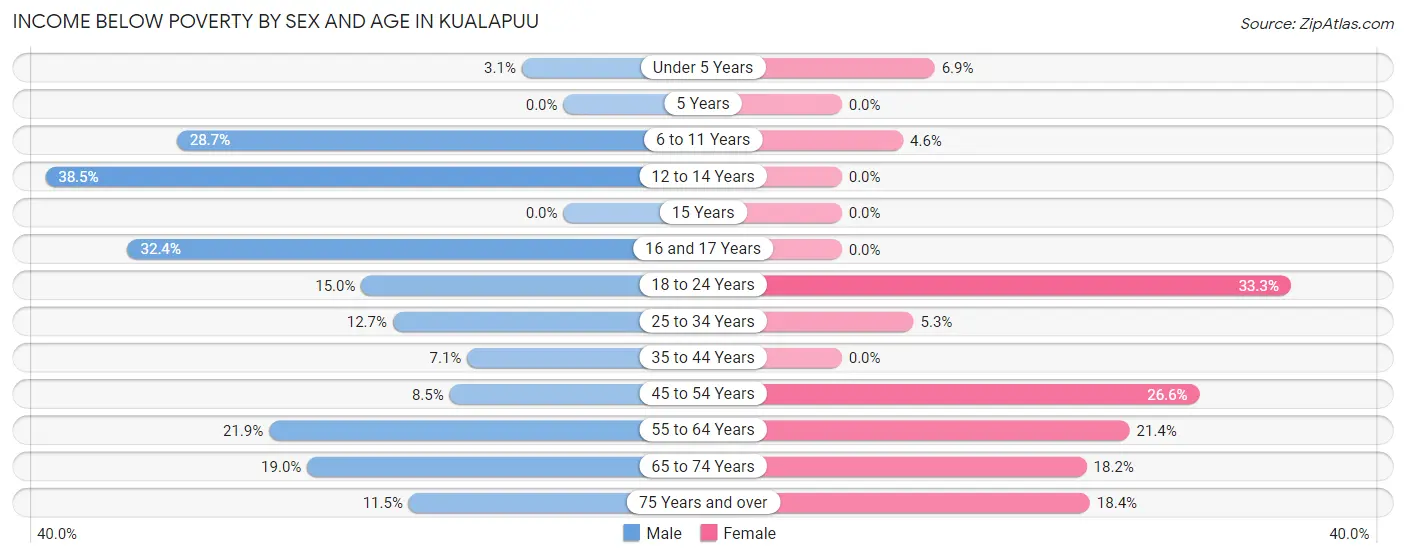
| Age Bracket | Male | Female |
| Under 5 Years | 3 (3.1%) | 4 (6.9%) |
| 5 Years | 0 (0.0%) | 0 (0.0%) |
| 6 to 11 Years | 31 (28.7%) | 3 (4.5%) |
| 12 to 14 Years | 25 (38.5%) | 0 (0.0%) |
| 15 Years | 0 (0.0%) | 0 (0.0%) |
| 16 and 17 Years | 11 (32.4%) | 0 (0.0%) |
| 18 to 24 Years | 15 (15.0%) | 18 (33.3%) |
| 25 to 34 Years | 10 (12.7%) | 4 (5.3%) |
| 35 to 44 Years | 10 (7.1%) | 0 (0.0%) |
| 45 to 54 Years | 6 (8.5%) | 47 (26.6%) |
| 55 to 64 Years | 26 (21.8%) | 28 (21.4%) |
| 65 to 74 Years | 35 (19.0%) | 28 (18.2%) |
| 75 Years and over | 7 (11.5%) | 14 (18.4%) |
| Total | 179 (16.2%) | 146 (14.2%) |
Income Above Poverty by Sex and Age in Kualapuu
According to the poverty statistics in Kualapuu, males aged 5 years and females aged 5 years are the age groups that are most secure financially, with 100.0% of males and 100.0% of females in these age groups living above the poverty line.
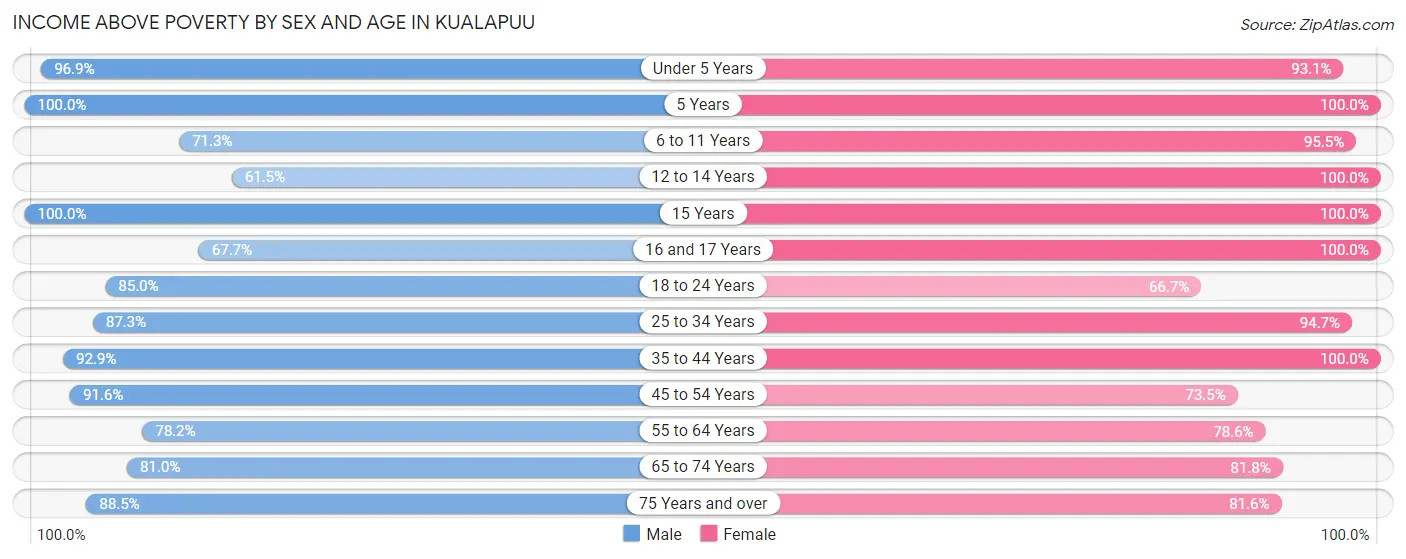
| Age Bracket | Male | Female |
| Under 5 Years | 94 (96.9%) | 54 (93.1%) |
| 5 Years | 20 (100.0%) | 17 (100.0%) |
| 6 to 11 Years | 77 (71.3%) | 63 (95.5%) |
| 12 to 14 Years | 40 (61.5%) | 22 (100.0%) |
| 15 Years | 30 (100.0%) | 10 (100.0%) |
| 16 and 17 Years | 23 (67.6%) | 75 (100.0%) |
| 18 to 24 Years | 85 (85.0%) | 36 (66.7%) |
| 25 to 34 Years | 69 (87.3%) | 71 (94.7%) |
| 35 to 44 Years | 130 (92.9%) | 113 (100.0%) |
| 45 to 54 Years | 65 (91.5%) | 130 (73.5%) |
| 55 to 64 Years | 93 (78.1%) | 103 (78.6%) |
| 65 to 74 Years | 149 (81.0%) | 126 (81.8%) |
| 75 Years and over | 54 (88.5%) | 62 (81.6%) |
| Total | 929 (83.8%) | 882 (85.8%) |
Income Below Poverty Among Married-Couple Families in Kualapuu
The poverty statistics for married-couple families in Kualapuu show that 12.2% or 43 of the total 353 families live below the poverty line. Families with 3 or 4 children have the highest poverty rate of 22.3%, comprising of 23 families. On the other hand, families with 1 or 2 children have the lowest poverty rate of 0.0%, which includes 0 families.
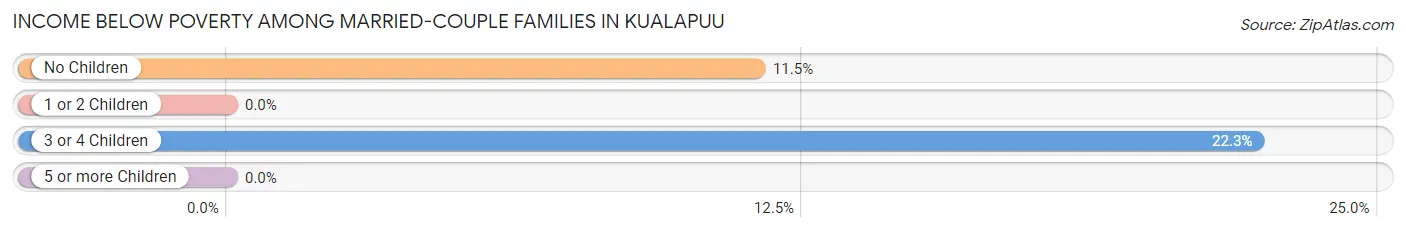
| Children | Above Poverty | Below Poverty |
| No Children | 154 (88.5%) | 20 (11.5%) |
| 1 or 2 Children | 76 (100.0%) | 0 (0.0%) |
| 3 or 4 Children | 80 (77.7%) | 23 (22.3%) |
| 5 or more Children | 0 (0.0%) | 0 (0.0%) |
| Total | 310 (87.8%) | 43 (12.2%) |
Income Below Poverty Among Single-Parent Households in Kualapuu
According to the poverty data in Kualapuu, 11.8% or 8 single-father households and 41.2% or 33 single-mother households are living below the poverty line. Among single-father households, those with no children have the highest poverty rate, with 8 households (12.5%) experiencing poverty. Likewise, among single-mother households, those with no children have the highest poverty rate, with 22 households (57.9%) falling below the poverty line.
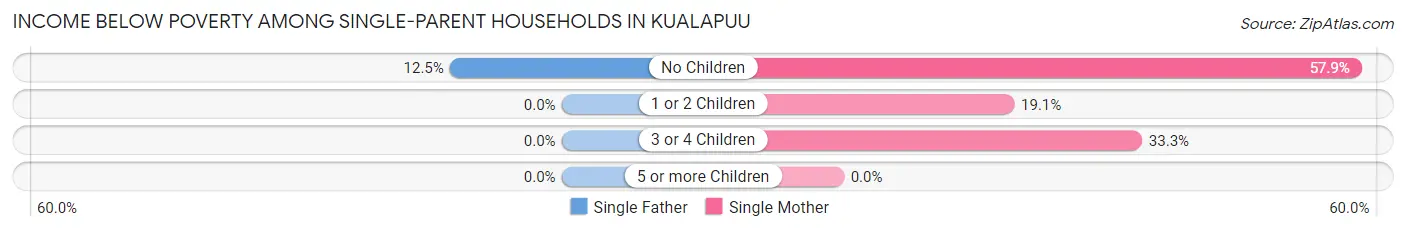
| Children | Single Father | Single Mother |
| No Children | 8 (12.5%) | 22 (57.9%) |
| 1 or 2 Children | 0 (0.0%) | 4 (19.1%) |
| 3 or 4 Children | 0 (0.0%) | 7 (33.3%) |
| 5 or more Children | 0 (0.0%) | 0 (0.0%) |
| Total | 8 (11.8%) | 33 (41.2%) |
Income Below Poverty Among Married-Couple vs Single-Parent Households in Kualapuu
The poverty data for Kualapuu shows that 43 of the married-couple family households (12.2%) and 41 of the single-parent households (27.7%) are living below the poverty level. Within the married-couple family households, those with 3 or 4 children have the highest poverty rate, with 23 households (22.3%) falling below the poverty line. Among the single-parent households, those with 3 or 4 children have the highest poverty rate, with 7 household (33.3%) living below poverty.
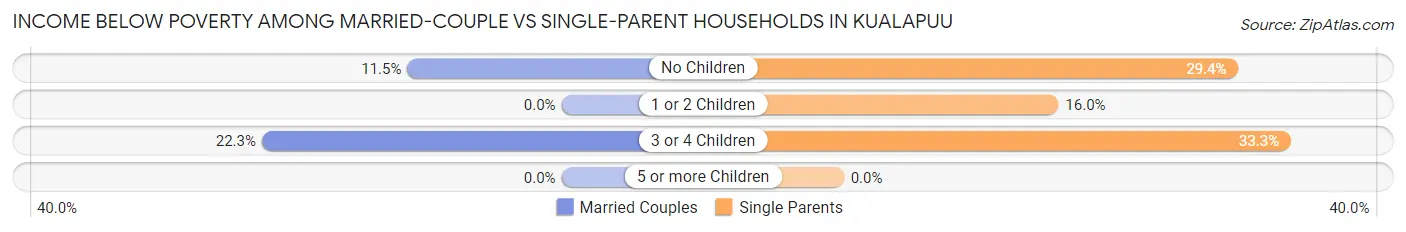
| Children | Married-Couple Families | Single-Parent Households |
| No Children | 20 (11.5%) | 30 (29.4%) |
| 1 or 2 Children | 0 (0.0%) | 4 (16.0%) |
| 3 or 4 Children | 23 (22.3%) | 7 (33.3%) |
| 5 or more Children | 0 (0.0%) | 0 (0.0%) |
| Total | 43 (12.2%) | 41 (27.7%) |
Employment Characteristics in Kualapuu
Employment by Class of Employer in Kualapuu
Among the 789 employed individuals in Kualapuu, private company employees (329 | 41.7%), state government employees (140 | 17.7%), and not-for-profit organizations (102 | 12.9%) make up the most common classes of employment.
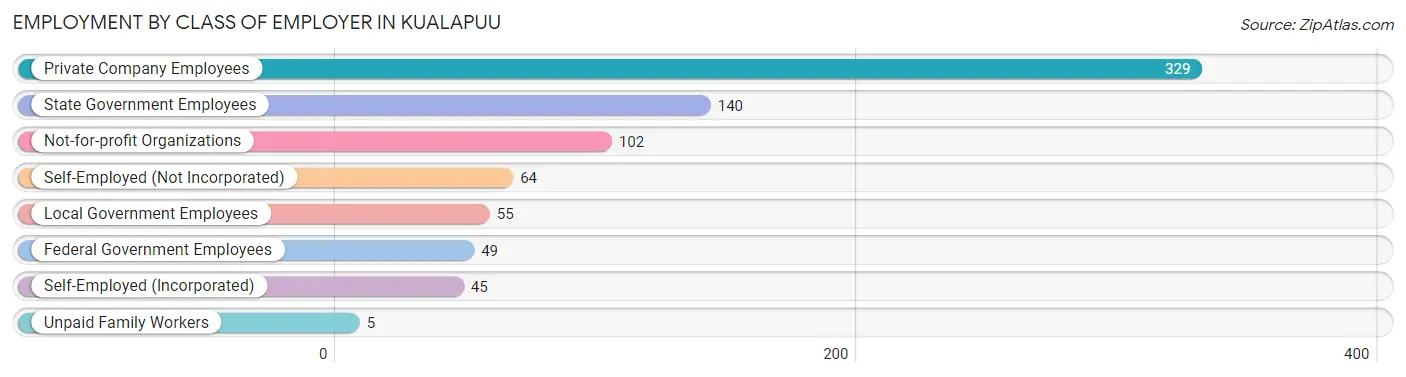
| Employer Class | # Employees | % Employees |
| Private Company Employees | 329 | 41.7% |
| Self-Employed (Incorporated) | 45 | 5.7% |
| Self-Employed (Not Incorporated) | 64 | 8.1% |
| Not-for-profit Organizations | 102 | 12.9% |
| Local Government Employees | 55 | 7.0% |
| State Government Employees | 140 | 17.7% |
| Federal Government Employees | 49 | 6.2% |
| Unpaid Family Workers | 5 | 0.6% |
| Total | 789 | 100.0% |
Employment Status by Age in Kualapuu
According to the labor force statistics for Kualapuu, out of the total population over 16 years of age (1,643), 51.4% or 845 individuals are in the labor force, with 5.7% or 48 of them unemployed. The age group with the highest labor force participation rate is 30 to 34 years, with 81.5% or 44 individuals in the labor force. Within the labor force, the 25 to 29 years age range has the highest percentage of unemployed individuals, with 18.2% or 14 of them being unemployed.
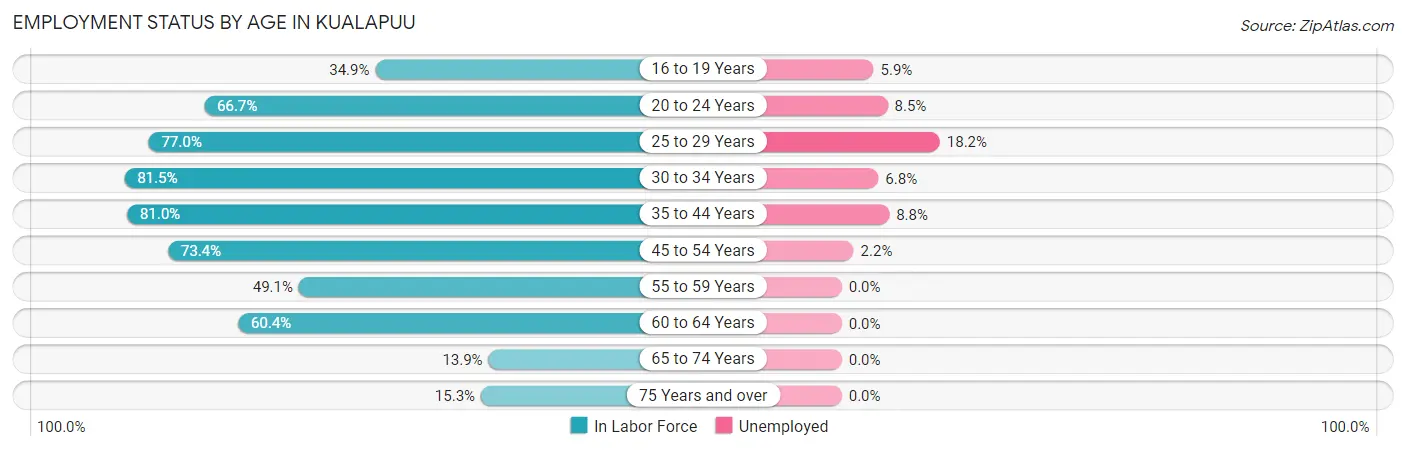
| Age Bracket | In Labor Force | Unemployed |
| 16 to 19 Years | 51 (34.9%) | 3 (5.9%) |
| 20 to 24 Years | 78 (66.7%) | 7 (8.5%) |
| 25 to 29 Years | 77 (77.0%) | 14 (18.2%) |
| 30 to 34 Years | 44 (81.5%) | 3 (6.8%) |
| 35 to 44 Years | 205 (81.0%) | 18 (8.8%) |
| 45 to 54 Years | 182 (73.4%) | 4 (2.2%) |
| 55 to 59 Years | 52 (49.1%) | 0 (0.0%) |
| 60 to 64 Years | 87 (60.4%) | 0 (0.0%) |
| 65 to 74 Years | 47 (13.9%) | 0 (0.0%) |
| 75 Years and over | 21 (15.3%) | 0 (0.0%) |
| Total | 845 (51.4%) | 48 (5.7%) |
Employment Status by Educational Attainment in Kualapuu
According to labor force statistics for Kualapuu, 71.5% of individuals (647) out of the total population between 25 and 64 years of age (905) are in the labor force, with 6.0% or 39 of them being unemployed. The group with the highest labor force participation rate are those with the educational attainment of bachelor's degree or higher, with 84.7% or 172 individuals in the labor force. Within the labor force, individuals with high school diploma education have the highest percentage of unemployment, with 8.2% or 21 of them being unemployed.
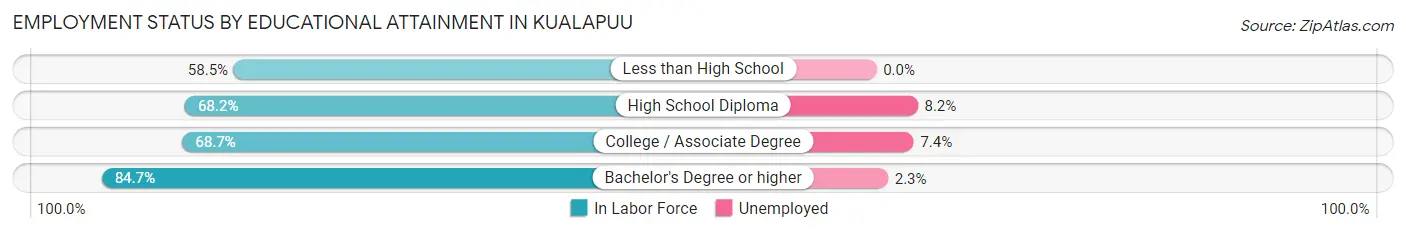
| Educational Attainment | In Labor Force | Unemployed |
| Less than High School | 31 (58.5%) | 0 (0.0%) |
| High School Diploma | 255 (68.2%) | 31 (8.2%) |
| College / Associate Degree | 189 (68.7%) | 20 (7.4%) |
| Bachelor's Degree or higher | 172 (84.7%) | 5 (2.3%) |
| Total | 647 (71.5%) | 54 (6.0%) |
Employment Occupations by Sex in Kualapuu
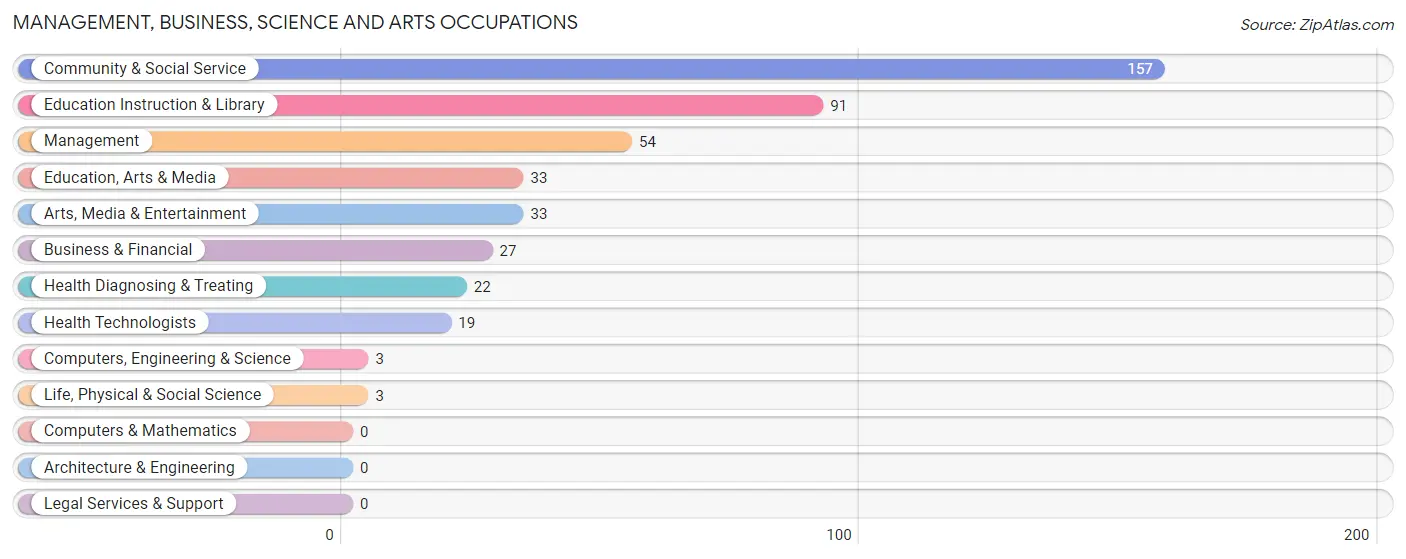
Management, Business, Science and Arts Occupations
The most common Management, Business, Science and Arts occupations in Kualapuu are Community & Social Service (157 | 20.2%), Education Instruction & Library (91 | 11.7%), Management (54 | 6.9%), Education, Arts & Media (33 | 4.2%), and Arts, Media & Entertainment (33 | 4.2%).
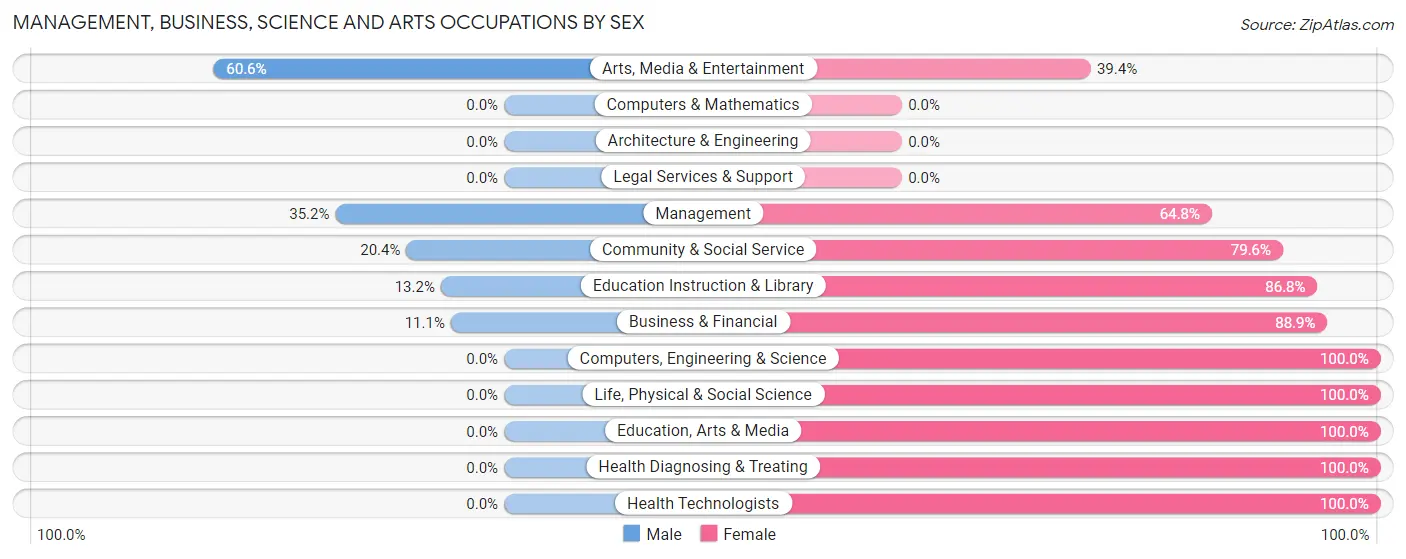
Management, Business, Science and Arts Occupations by Sex
Within the Management, Business, Science and Arts occupations in Kualapuu, the most male-oriented occupations are Arts, Media & Entertainment (60.6%), Management (35.2%), and Community & Social Service (20.4%), while the most female-oriented occupations are Computers, Engineering & Science (100.0%), Life, Physical & Social Science (100.0%), and Education, Arts & Media (100.0%).
| Occupation | Male | Female |
| Management | 19 (35.2%) | 35 (64.8%) |
| Business & Financial | 3 (11.1%) | 24 (88.9%) |
| Computers, Engineering & Science | 0 (0.0%) | 3 (100.0%) |
| Computers & Mathematics | 0 (0.0%) | 0 (0.0%) |
| Architecture & Engineering | 0 (0.0%) | 0 (0.0%) |
| Life, Physical & Social Science | 0 (0.0%) | 3 (100.0%) |
| Community & Social Service | 32 (20.4%) | 125 (79.6%) |
| Education, Arts & Media | 0 (0.0%) | 33 (100.0%) |
| Legal Services & Support | 0 (0.0%) | 0 (0.0%) |
| Education Instruction & Library | 12 (13.2%) | 79 (86.8%) |
| Arts, Media & Entertainment | 20 (60.6%) | 13 (39.4%) |
| Health Diagnosing & Treating | 0 (0.0%) | 22 (100.0%) |
| Health Technologists | 0 (0.0%) | 19 (100.0%) |
| Total (Category) | 54 (20.5%) | 209 (79.5%) |
| Total (Overall) | 337 (43.3%) | 441 (56.7%) |
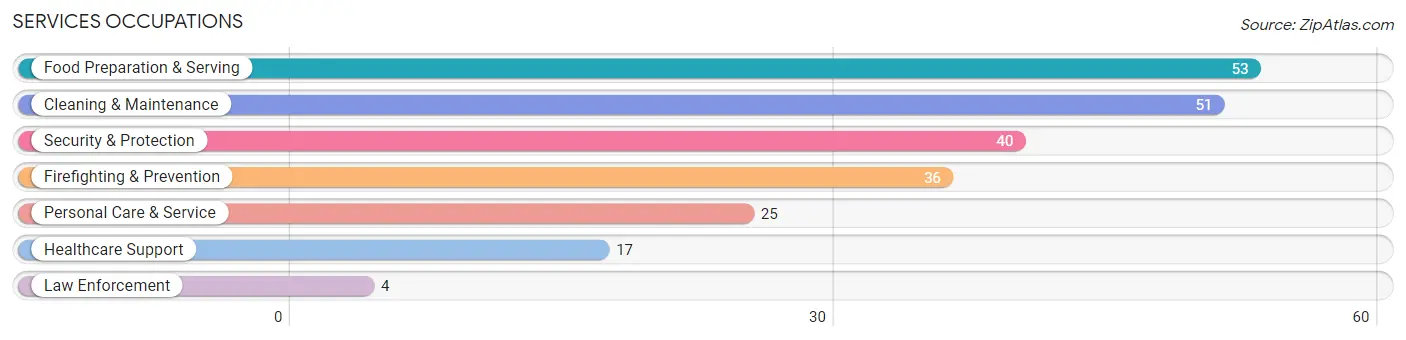
Services Occupations
The most common Services occupations in Kualapuu are Food Preparation & Serving (53 | 6.8%), Cleaning & Maintenance (51 | 6.6%), Security & Protection (40 | 5.1%), Firefighting & Prevention (36 | 4.6%), and Personal Care & Service (25 | 3.2%).
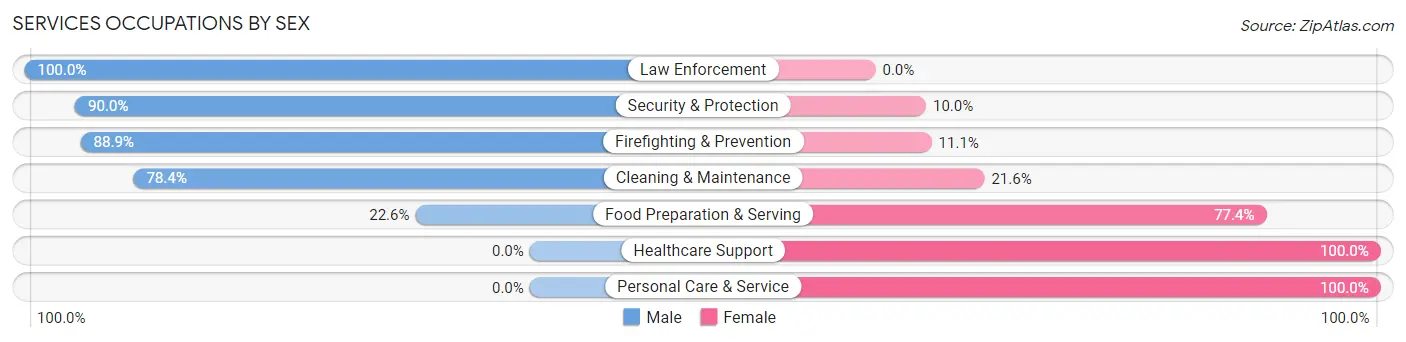
Services Occupations by Sex
Within the Services occupations in Kualapuu, the most male-oriented occupations are Law Enforcement (100.0%), Security & Protection (90.0%), and Firefighting & Prevention (88.9%), while the most female-oriented occupations are Healthcare Support (100.0%), Personal Care & Service (100.0%), and Food Preparation & Serving (77.4%).
| Occupation | Male | Female |
| Healthcare Support | 0 (0.0%) | 17 (100.0%) |
| Security & Protection | 36 (90.0%) | 4 (10.0%) |
| Firefighting & Prevention | 32 (88.9%) | 4 (11.1%) |
| Law Enforcement | 4 (100.0%) | 0 (0.0%) |
| Food Preparation & Serving | 12 (22.6%) | 41 (77.4%) |
| Cleaning & Maintenance | 40 (78.4%) | 11 (21.6%) |
| Personal Care & Service | 0 (0.0%) | 25 (100.0%) |
| Total (Category) | 88 (47.3%) | 98 (52.7%) |
| Total (Overall) | 337 (43.3%) | 441 (56.7%) |
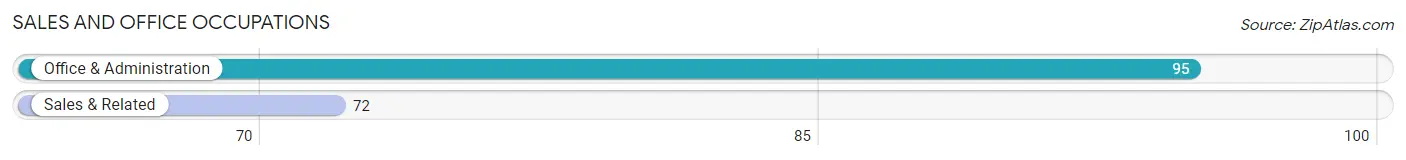
Sales and Office Occupations
The most common Sales and Office occupations in Kualapuu are Office & Administration (95 | 12.2%), and Sales & Related (72 | 9.2%).
Sales and Office Occupations by Sex
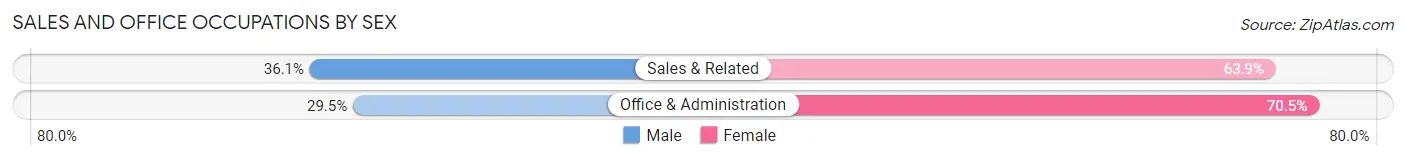
| Occupation | Male | Female |
| Sales & Related | 26 (36.1%) | 46 (63.9%) |
| Office & Administration | 28 (29.5%) | 67 (70.5%) |
| Total (Category) | 54 (32.3%) | 113 (67.7%) |
| Total (Overall) | 337 (43.3%) | 441 (56.7%) |
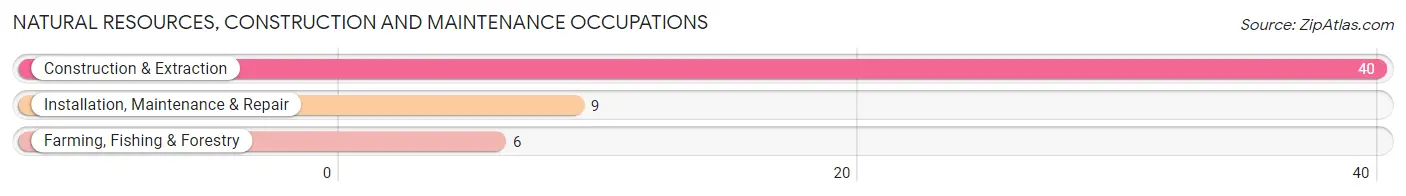
Natural Resources, Construction and Maintenance Occupations
The most common Natural Resources, Construction and Maintenance occupations in Kualapuu are Construction & Extraction (40 | 5.1%), Installation, Maintenance & Repair (9 | 1.2%), and Farming, Fishing & Forestry (6 | 0.8%).
Natural Resources, Construction and Maintenance Occupations by Sex
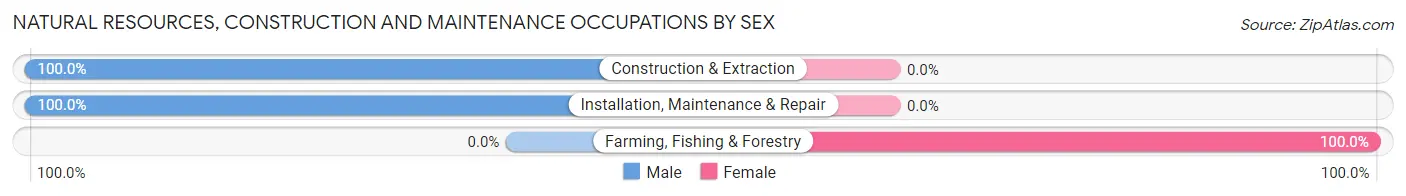
| Occupation | Male | Female |
| Farming, Fishing & Forestry | 0 (0.0%) | 6 (100.0%) |
| Construction & Extraction | 40 (100.0%) | 0 (0.0%) |
| Installation, Maintenance & Repair | 9 (100.0%) | 0 (0.0%) |
| Total (Category) | 49 (89.1%) | 6 (10.9%) |
| Total (Overall) | 337 (43.3%) | 441 (56.7%) |
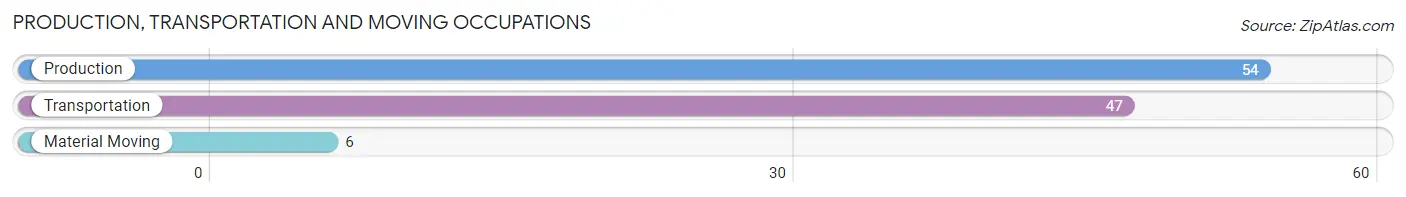
Production, Transportation and Moving Occupations
The most common Production, Transportation and Moving occupations in Kualapuu are Production (54 | 6.9%), Transportation (47 | 6.0%), and Material Moving (6 | 0.8%).
Production, Transportation and Moving Occupations by Sex
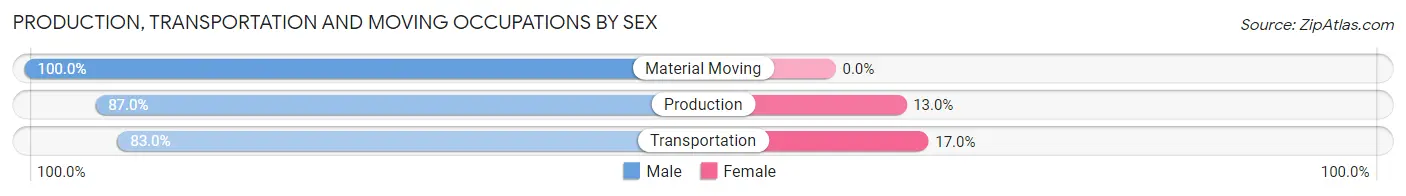
| Occupation | Male | Female |
| Production | 47 (87.0%) | 7 (13.0%) |
| Transportation | 39 (83.0%) | 8 (17.0%) |
| Material Moving | 6 (100.0%) | 0 (0.0%) |
| Total (Category) | 92 (86.0%) | 15 (14.0%) |
| Total (Overall) | 337 (43.3%) | 441 (56.7%) |
Employment Industries by Sex in Kualapuu
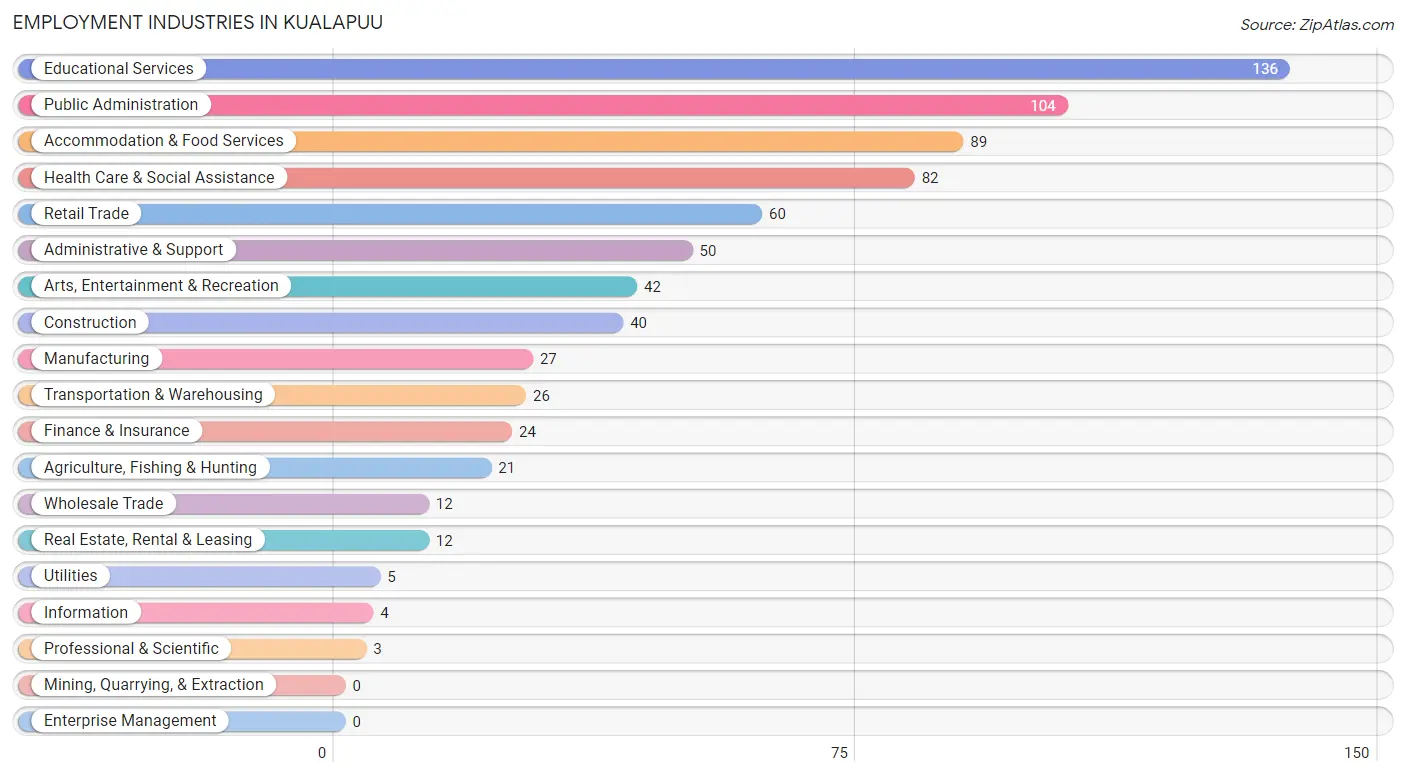
Employment Industries in Kualapuu
The major employment industries in Kualapuu include Educational Services (136 | 17.5%), Public Administration (104 | 13.4%), Accommodation & Food Services (89 | 11.4%), Health Care & Social Assistance (82 | 10.5%), and Retail Trade (60 | 7.7%).
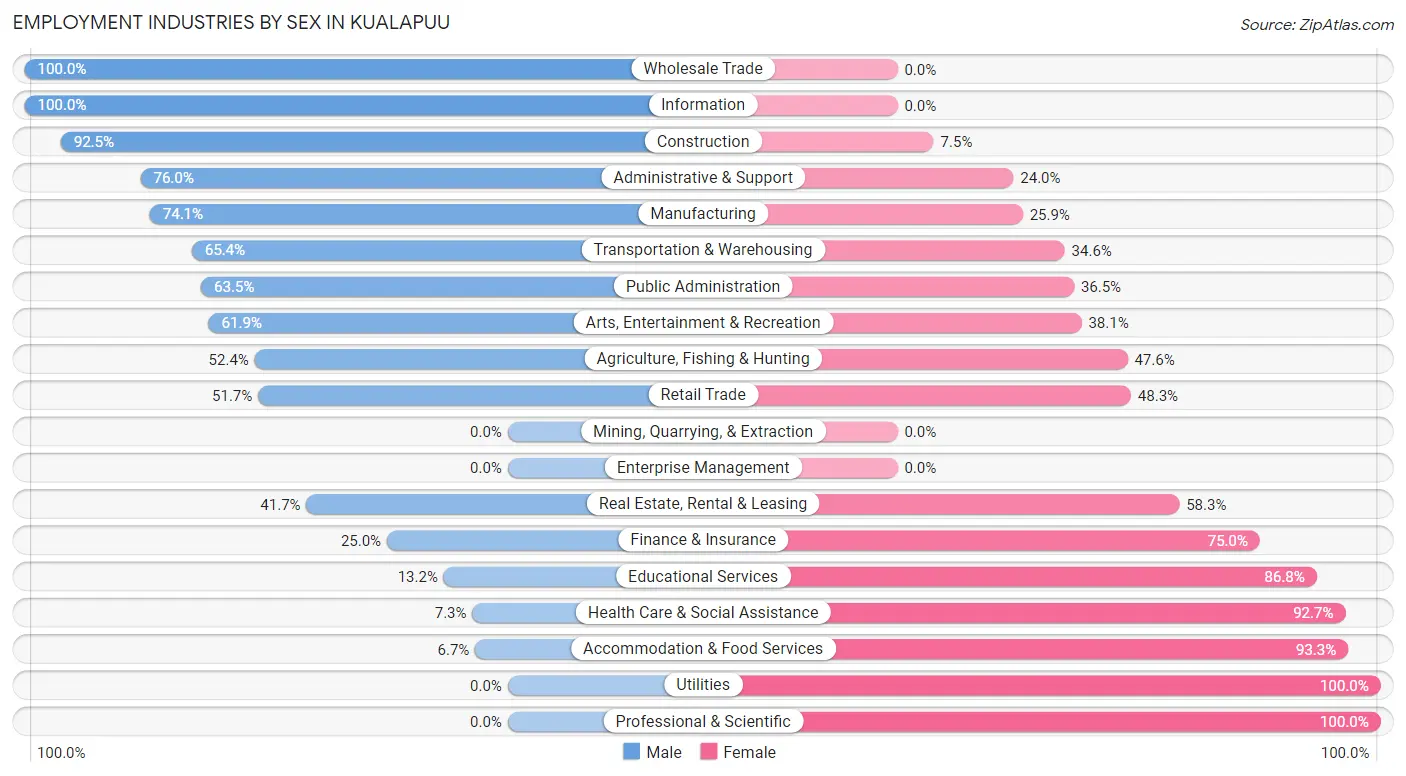
Employment Industries by Sex in Kualapuu
The Kualapuu industries that see more men than women are Wholesale Trade (100.0%), Information (100.0%), and Construction (92.5%), whereas the industries that tend to have a higher number of women are Utilities (100.0%), Professional & Scientific (100.0%), and Accommodation & Food Services (93.3%).
| Industry | Male | Female |
| Agriculture, Fishing & Hunting | 11 (52.4%) | 10 (47.6%) |
| Mining, Quarrying, & Extraction | 0 (0.0%) | 0 (0.0%) |
| Construction | 37 (92.5%) | 3 (7.5%) |
| Manufacturing | 20 (74.1%) | 7 (25.9%) |
| Wholesale Trade | 12 (100.0%) | 0 (0.0%) |
| Retail Trade | 31 (51.7%) | 29 (48.3%) |
| Transportation & Warehousing | 17 (65.4%) | 9 (34.6%) |
| Utilities | 0 (0.0%) | 5 (100.0%) |
| Information | 4 (100.0%) | 0 (0.0%) |
| Finance & Insurance | 6 (25.0%) | 18 (75.0%) |
| Real Estate, Rental & Leasing | 5 (41.7%) | 7 (58.3%) |
| Professional & Scientific | 0 (0.0%) | 3 (100.0%) |
| Enterprise Management | 0 (0.0%) | 0 (0.0%) |
| Administrative & Support | 38 (76.0%) | 12 (24.0%) |
| Educational Services | 18 (13.2%) | 118 (86.8%) |
| Health Care & Social Assistance | 6 (7.3%) | 76 (92.7%) |
| Arts, Entertainment & Recreation | 26 (61.9%) | 16 (38.1%) |
| Accommodation & Food Services | 6 (6.7%) | 83 (93.3%) |
| Public Administration | 66 (63.5%) | 38 (36.5%) |
| Total | 337 (43.3%) | 441 (56.7%) |
Education in Kualapuu
School Enrollment in Kualapuu
The most common levels of schooling among the 539 students in Kualapuu are high school (199 | 36.9%), elementary school (119 | 22.1%), and middle school (86 | 16.0%).
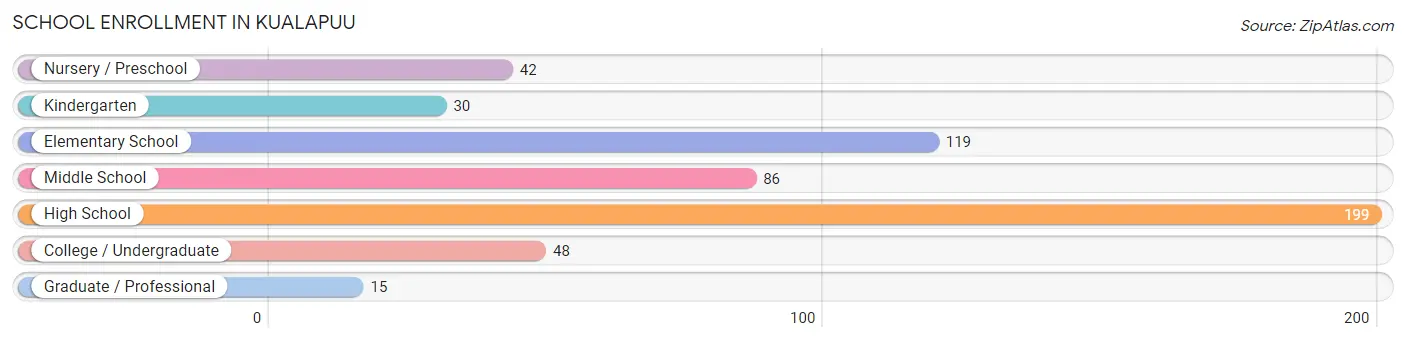
| School Level | # Students | % Students |
| Nursery / Preschool | 42 | 7.8% |
| Kindergarten | 30 | 5.6% |
| Elementary School | 119 | 22.1% |
| Middle School | 86 | 16.0% |
| High School | 199 | 36.9% |
| College / Undergraduate | 48 | 8.9% |
| Graduate / Professional | 15 | 2.8% |
| Total | 539 | 100.0% |
School Enrollment by Age by Funding Source in Kualapuu
Out of a total of 539 students who are enrolled in schools in Kualapuu, 95 (17.6%) attend a private institution, while the remaining 444 (82.4%) are enrolled in public schools. The age group of 20 to 24 year olds has the highest likelihood of being enrolled in private schools, with 14 (70.0% in the age bracket) enrolled. Conversely, the age group of 3 to 4 year olds has the lowest likelihood of being enrolled in a private school, with 22 (100.0% in the age bracket) attending a public institution.
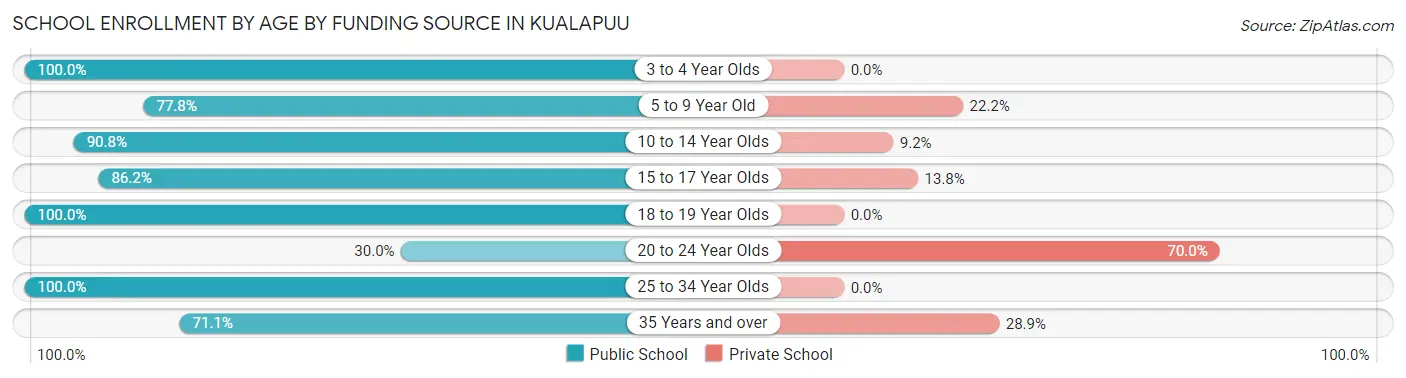
| Age Bracket | Public School | Private School |
| 3 to 4 Year Olds | 22 (100.0%) | 0 (0.0%) |
| 5 to 9 Year Old | 130 (77.8%) | 37 (22.2%) |
| 10 to 14 Year Olds | 119 (90.8%) | 12 (9.2%) |
| 15 to 17 Year Olds | 119 (86.2%) | 19 (13.8%) |
| 18 to 19 Year Olds | 14 (100.0%) | 0 (0.0%) |
| 20 to 24 Year Olds | 6 (30.0%) | 14 (70.0%) |
| 25 to 34 Year Olds | 2 (100.0%) | 0 (0.0%) |
| 35 Years and over | 32 (71.1%) | 13 (28.9%) |
| Total | 444 (82.4%) | 95 (17.6%) |
Educational Attainment by Field of Study in Kualapuu
Education (54 | 18.3%), science & technology (45 | 15.2%), visual & performing arts (39 | 13.2%), psychology (33 | 11.2%), and arts & humanities (33 | 11.2%) are the most common fields of study among 295 individuals in Kualapuu who have obtained a bachelor's degree or higher.
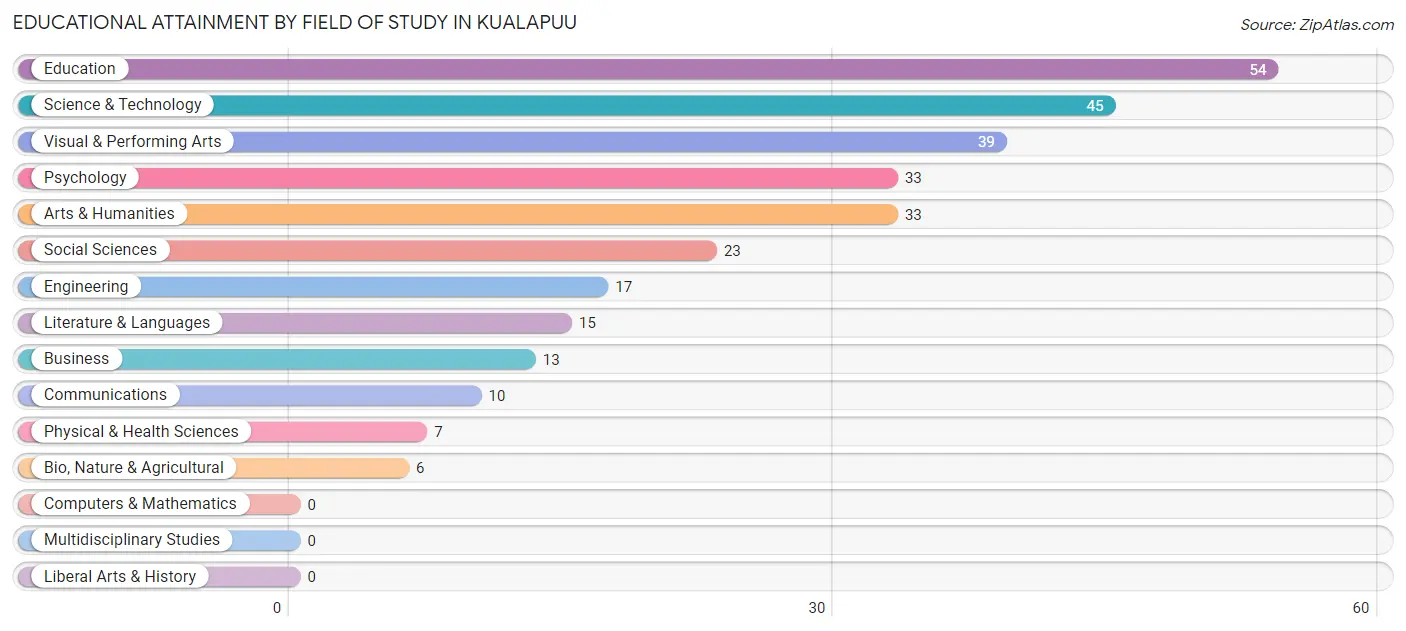
| Field of Study | # Graduates | % Graduates |
| Computers & Mathematics | 0 | 0.0% |
| Bio, Nature & Agricultural | 6 | 2.0% |
| Physical & Health Sciences | 7 | 2.4% |
| Psychology | 33 | 11.2% |
| Social Sciences | 23 | 7.8% |
| Engineering | 17 | 5.8% |
| Multidisciplinary Studies | 0 | 0.0% |
| Science & Technology | 45 | 15.2% |
| Business | 13 | 4.4% |
| Education | 54 | 18.3% |
| Literature & Languages | 15 | 5.1% |
| Liberal Arts & History | 0 | 0.0% |
| Visual & Performing Arts | 39 | 13.2% |
| Communications | 10 | 3.4% |
| Arts & Humanities | 33 | 11.2% |
| Total | 295 | 100.0% |
Transportation & Commute in Kualapuu
Vehicle Availability by Sex in Kualapuu
The most prevalent vehicle ownership categories in Kualapuu are males with 2 vehicles (149, accounting for 42.8%) and females with 2 vehicles (220, making up 33.8%).
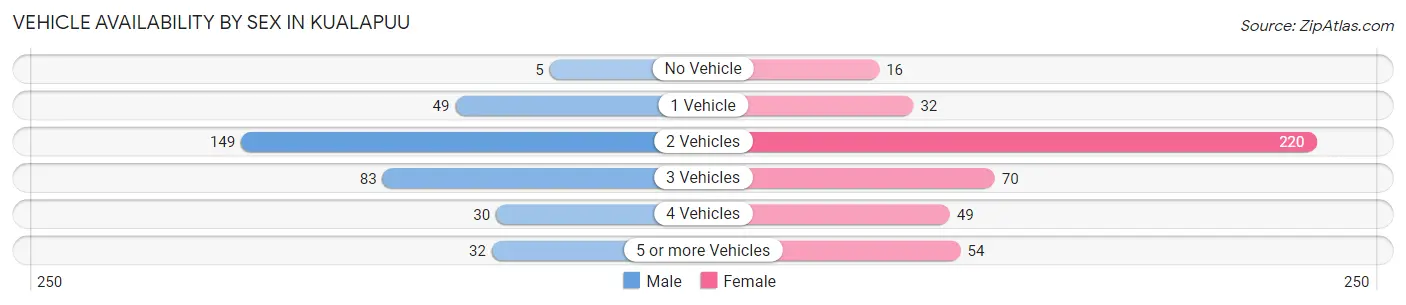
| Vehicles Available | Male | Female |
| No Vehicle | 5 (1.4%) | 16 (3.6%) |
| 1 Vehicle | 49 (14.1%) | 32 (7.3%) |
| 2 Vehicles | 149 (42.8%) | 220 (49.9%) |
| 3 Vehicles | 83 (23.8%) | 70 (15.9%) |
| 4 Vehicles | 30 (8.6%) | 49 (11.1%) |
| 5 or more Vehicles | 32 (9.2%) | 54 (12.2%) |
| Total | 348 (100.0%) | 441 (100.0%) |
Commute Time in Kualapuu
The most frequently occuring commute durations in Kualapuu are 15 to 19 minutes (193 commuters, 29.1%), 30 to 34 minutes (132 commuters, 19.9%), and 10 to 14 minutes (85 commuters, 12.8%).
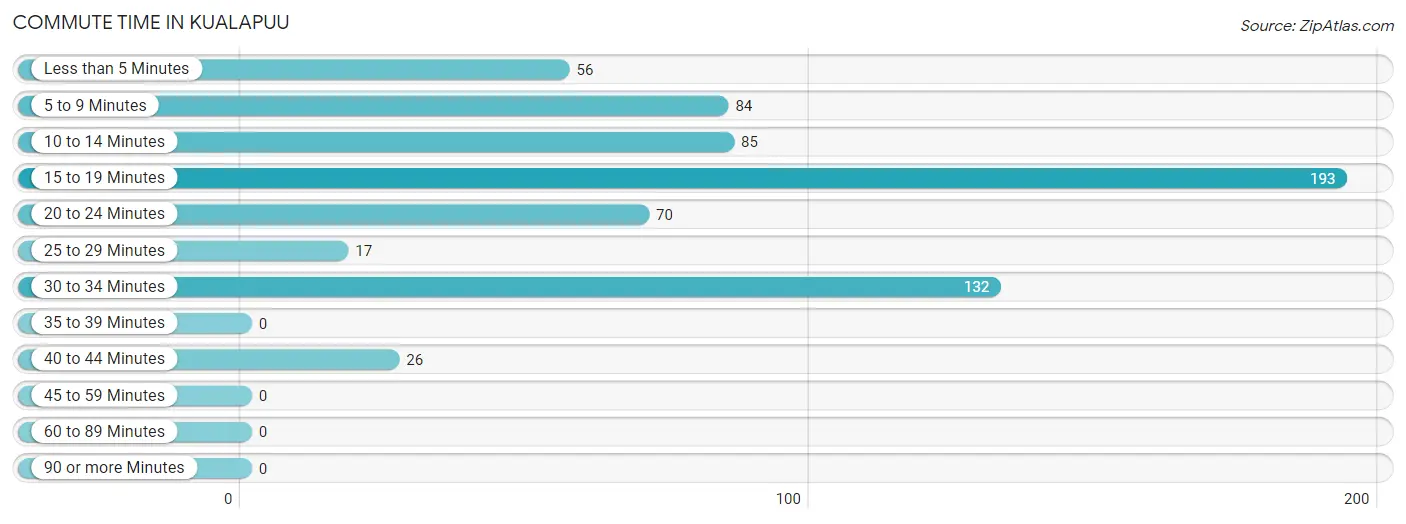
| Commute Time | # Commuters | % Commuters |
| Less than 5 Minutes | 56 | 8.5% |
| 5 to 9 Minutes | 84 | 12.7% |
| 10 to 14 Minutes | 85 | 12.8% |
| 15 to 19 Minutes | 193 | 29.1% |
| 20 to 24 Minutes | 70 | 10.6% |
| 25 to 29 Minutes | 17 | 2.6% |
| 30 to 34 Minutes | 132 | 19.9% |
| 35 to 39 Minutes | 0 | 0.0% |
| 40 to 44 Minutes | 26 | 3.9% |
| 45 to 59 Minutes | 0 | 0.0% |
| 60 to 89 Minutes | 0 | 0.0% |
| 90 or more Minutes | 0 | 0.0% |
Commute Time by Sex in Kualapuu
The most common commute times in Kualapuu are 15 to 19 minutes (60 commuters, 20.8%) for males and 15 to 19 minutes (133 commuters, 35.6%) for females.
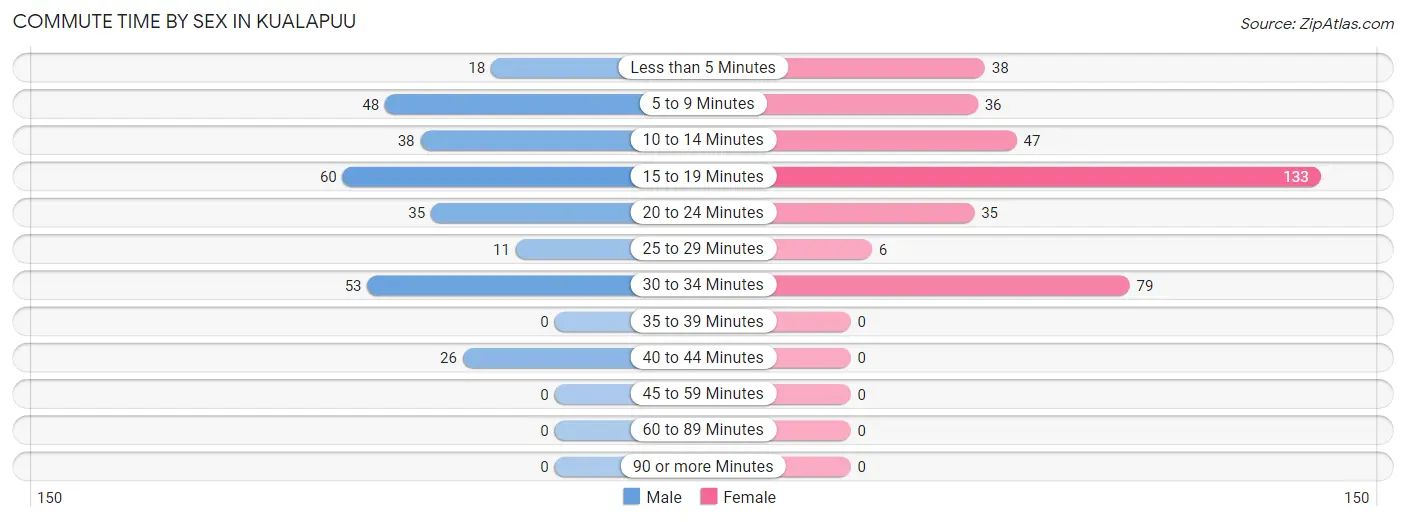
| Commute Time | Male | Female |
| Less than 5 Minutes | 18 (6.2%) | 38 (10.2%) |
| 5 to 9 Minutes | 48 (16.6%) | 36 (9.6%) |
| 10 to 14 Minutes | 38 (13.2%) | 47 (12.6%) |
| 15 to 19 Minutes | 60 (20.8%) | 133 (35.6%) |
| 20 to 24 Minutes | 35 (12.1%) | 35 (9.4%) |
| 25 to 29 Minutes | 11 (3.8%) | 6 (1.6%) |
| 30 to 34 Minutes | 53 (18.3%) | 79 (21.1%) |
| 35 to 39 Minutes | 0 (0.0%) | 0 (0.0%) |
| 40 to 44 Minutes | 26 (9.0%) | 0 (0.0%) |
| 45 to 59 Minutes | 0 (0.0%) | 0 (0.0%) |
| 60 to 89 Minutes | 0 (0.0%) | 0 (0.0%) |
| 90 or more Minutes | 0 (0.0%) | 0 (0.0%) |
Time of Departure to Work by Sex in Kualapuu
The most frequent times of departure to work in Kualapuu are 7:00 AM to 7:29 AM (83, 28.7%) for males and 7:00 AM to 7:29 AM (109, 29.1%) for females.
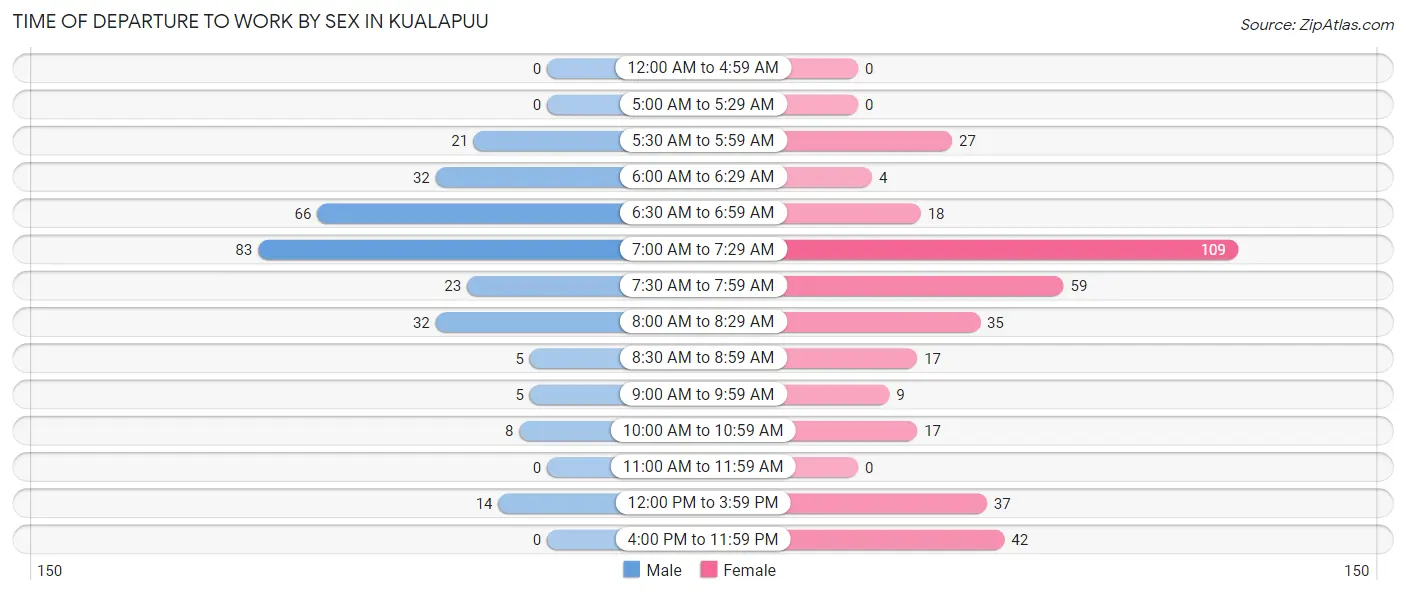
| Time of Departure | Male | Female |
| 12:00 AM to 4:59 AM | 0 (0.0%) | 0 (0.0%) |
| 5:00 AM to 5:29 AM | 0 (0.0%) | 0 (0.0%) |
| 5:30 AM to 5:59 AM | 21 (7.3%) | 27 (7.2%) |
| 6:00 AM to 6:29 AM | 32 (11.1%) | 4 (1.1%) |
| 6:30 AM to 6:59 AM | 66 (22.8%) | 18 (4.8%) |
| 7:00 AM to 7:29 AM | 83 (28.7%) | 109 (29.1%) |
| 7:30 AM to 7:59 AM | 23 (8.0%) | 59 (15.8%) |
| 8:00 AM to 8:29 AM | 32 (11.1%) | 35 (9.4%) |
| 8:30 AM to 8:59 AM | 5 (1.7%) | 17 (4.5%) |
| 9:00 AM to 9:59 AM | 5 (1.7%) | 9 (2.4%) |
| 10:00 AM to 10:59 AM | 8 (2.8%) | 17 (4.5%) |
| 11:00 AM to 11:59 AM | 0 (0.0%) | 0 (0.0%) |
| 12:00 PM to 3:59 PM | 14 (4.8%) | 37 (9.9%) |
| 4:00 PM to 11:59 PM | 0 (0.0%) | 42 (11.2%) |
| Total | 289 (100.0%) | 374 (100.0%) |
Housing Occupancy in Kualapuu
Occupancy by Ownership in Kualapuu
Of the total 608 dwellings in Kualapuu, owner-occupied units account for 500 (82.2%), while renter-occupied units make up 108 (17.8%).
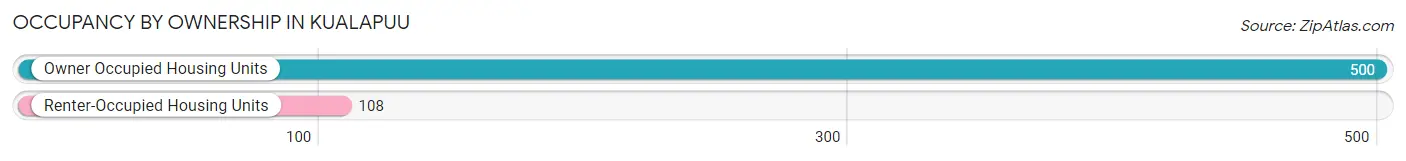
| Occupancy | # Housing Units | % Housing Units |
| Owner Occupied Housing Units | 500 | 82.2% |
| Renter-Occupied Housing Units | 108 | 17.8% |
| Total Occupied Housing Units | 608 | 100.0% |
Occupancy by Household Size in Kualapuu
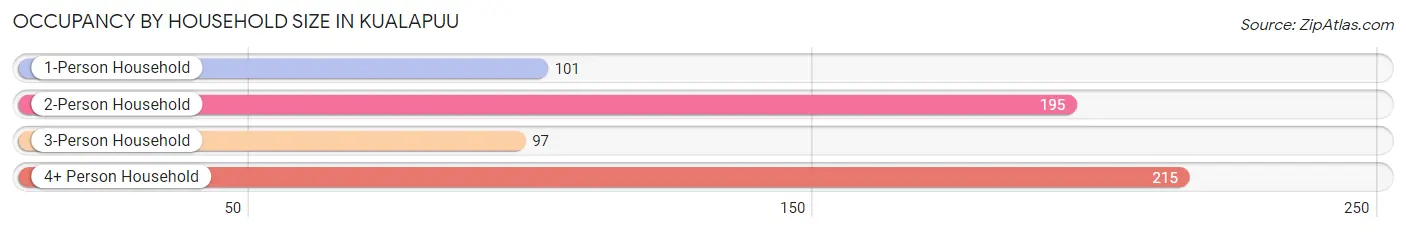
| Household Size | # Housing Units | % Housing Units |
| 1-Person Household | 101 | 16.6% |
| 2-Person Household | 195 | 32.1% |
| 3-Person Household | 97 | 16.0% |
| 4+ Person Household | 215 | 35.4% |
| Total Housing Units | 608 | 100.0% |
Occupancy by Ownership by Household Size in Kualapuu
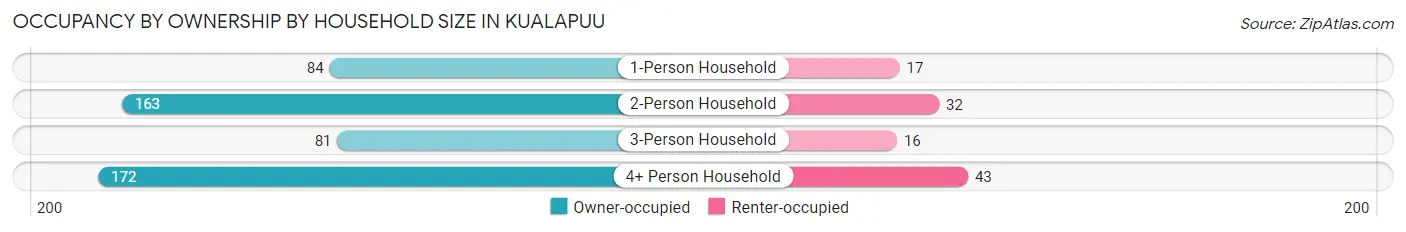
| Household Size | Owner-occupied | Renter-occupied |
| 1-Person Household | 84 (83.2%) | 17 (16.8%) |
| 2-Person Household | 163 (83.6%) | 32 (16.4%) |
| 3-Person Household | 81 (83.5%) | 16 (16.5%) |
| 4+ Person Household | 172 (80.0%) | 43 (20.0%) |
| Total Housing Units | 500 (82.2%) | 108 (17.8%) |
Occupancy by Educational Attainment in Kualapuu
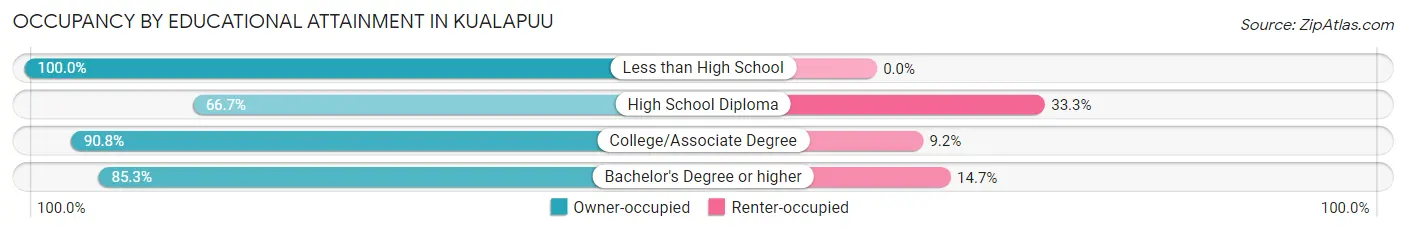
| Household Size | Owner-occupied | Renter-occupied |
| Less than High School | 26 (100.0%) | 0 (0.0%) |
| High School Diploma | 128 (66.7%) | 64 (33.3%) |
| College/Associate Degree | 218 (90.8%) | 22 (9.2%) |
| Bachelor's Degree or higher | 128 (85.3%) | 22 (14.7%) |
Occupancy by Age of Householder in Kualapuu
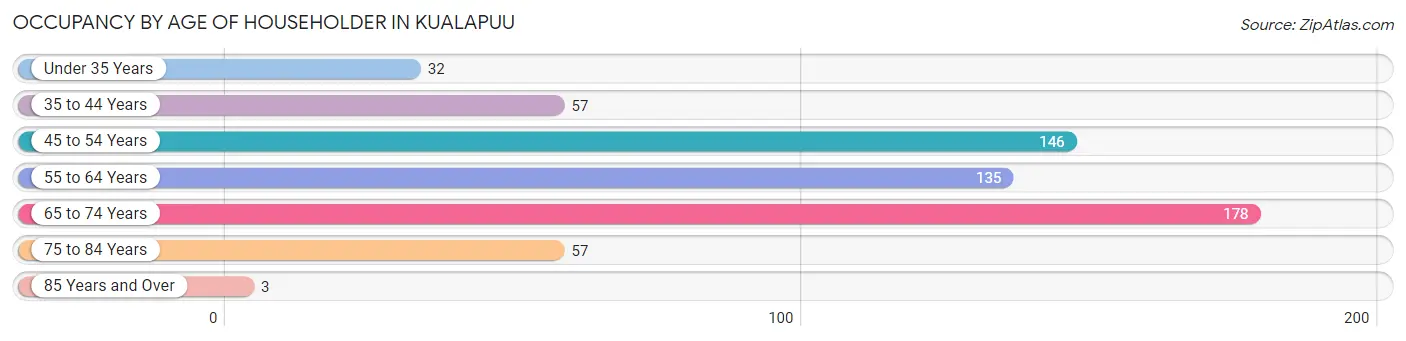
| Age Bracket | # Households | % Households |
| Under 35 Years | 32 | 5.3% |
| 35 to 44 Years | 57 | 9.4% |
| 45 to 54 Years | 146 | 24.0% |
| 55 to 64 Years | 135 | 22.2% |
| 65 to 74 Years | 178 | 29.3% |
| 75 to 84 Years | 57 | 9.4% |
| 85 Years and Over | 3 | 0.5% |
| Total | 608 | 100.0% |
Housing Finances in Kualapuu
Median Income by Occupancy in Kualapuu
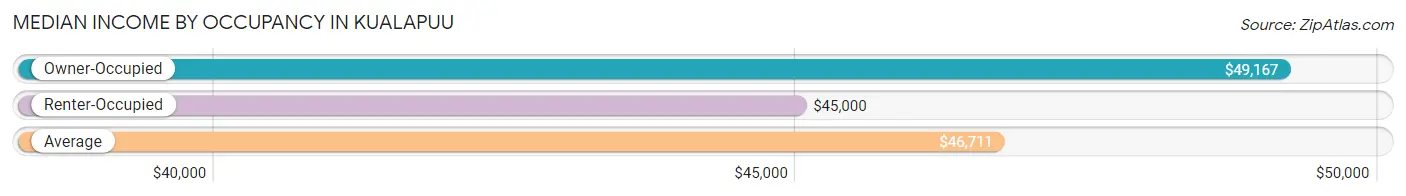
| Occupancy Type | # Households | Median Income |
| Owner-Occupied | 500 (82.2%) | $49,167 |
| Renter-Occupied | 108 (17.8%) | $45,000 |
| Average | 608 (100.0%) | $46,711 |
Occupancy by Householder Income Bracket in Kualapuu
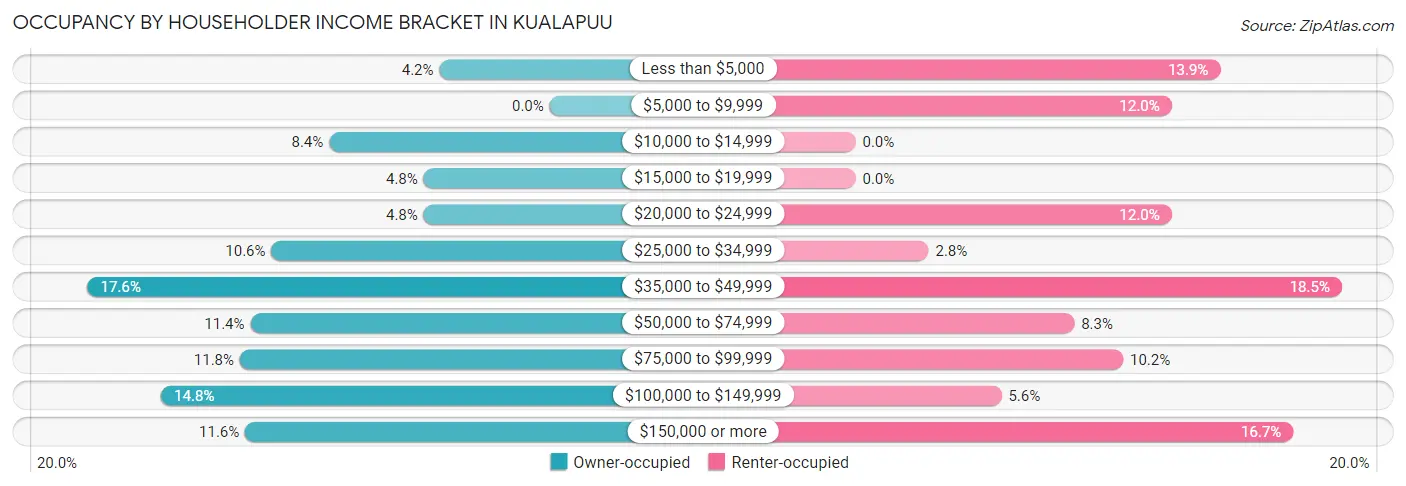
| Income Bracket | Owner-occupied | Renter-occupied |
| Less than $5,000 | 21 (4.2%) | 15 (13.9%) |
| $5,000 to $9,999 | 0 (0.0%) | 13 (12.0%) |
| $10,000 to $14,999 | 42 (8.4%) | 0 (0.0%) |
| $15,000 to $19,999 | 24 (4.8%) | 0 (0.0%) |
| $20,000 to $24,999 | 24 (4.8%) | 13 (12.0%) |
| $25,000 to $34,999 | 53 (10.6%) | 3 (2.8%) |
| $35,000 to $49,999 | 88 (17.6%) | 20 (18.5%) |
| $50,000 to $74,999 | 57 (11.4%) | 9 (8.3%) |
| $75,000 to $99,999 | 59 (11.8%) | 11 (10.2%) |
| $100,000 to $149,999 | 74 (14.8%) | 6 (5.6%) |
| $150,000 or more | 58 (11.6%) | 18 (16.7%) |
| Total | 500 (100.0%) | 108 (100.0%) |
Monthly Housing Cost Tiers in Kualapuu
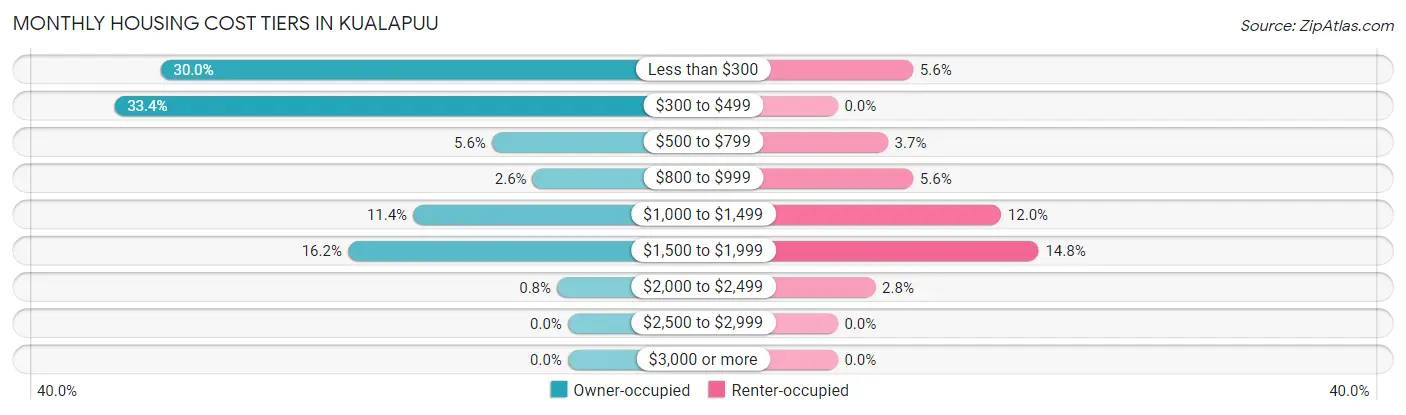
| Monthly Cost | Owner-occupied | Renter-occupied |
| Less than $300 | 150 (30.0%) | 6 (5.6%) |
| $300 to $499 | 167 (33.4%) | 0 (0.0%) |
| $500 to $799 | 28 (5.6%) | 4 (3.7%) |
| $800 to $999 | 13 (2.6%) | 6 (5.6%) |
| $1,000 to $1,499 | 57 (11.4%) | 13 (12.0%) |
| $1,500 to $1,999 | 81 (16.2%) | 16 (14.8%) |
| $2,000 to $2,499 | 4 (0.8%) | 3 (2.8%) |
| $2,500 to $2,999 | 0 (0.0%) | 0 (0.0%) |
| $3,000 or more | 0 (0.0%) | 0 (0.0%) |
| Total | 500 (100.0%) | 108 (100.0%) |
Physical Housing Characteristics in Kualapuu
Housing Structures in Kualapuu
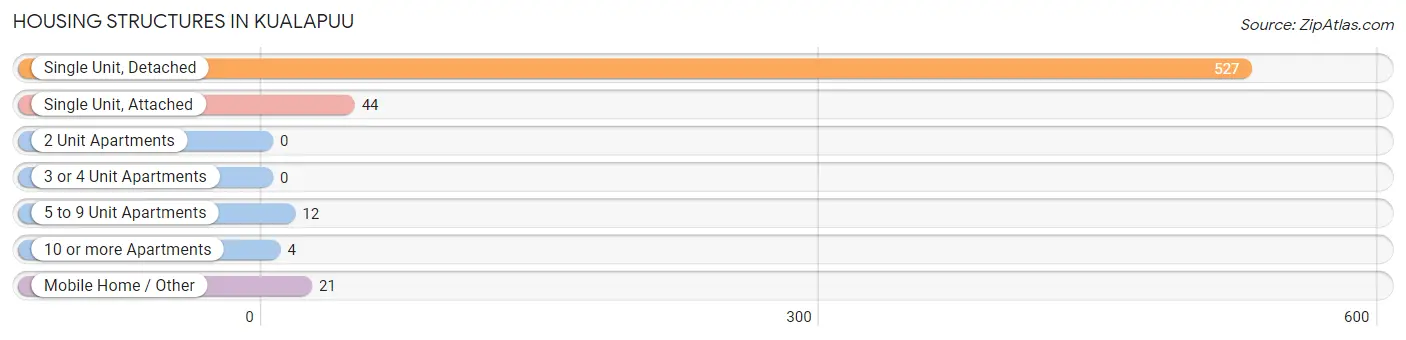
| Structure Type | # Housing Units | % Housing Units |
| Single Unit, Detached | 527 | 86.7% |
| Single Unit, Attached | 44 | 7.2% |
| 2 Unit Apartments | 0 | 0.0% |
| 3 or 4 Unit Apartments | 0 | 0.0% |
| 5 to 9 Unit Apartments | 12 | 2.0% |
| 10 or more Apartments | 4 | 0.7% |
| Mobile Home / Other | 21 | 3.5% |
| Total | 608 | 100.0% |
Housing Structures by Occupancy in Kualapuu
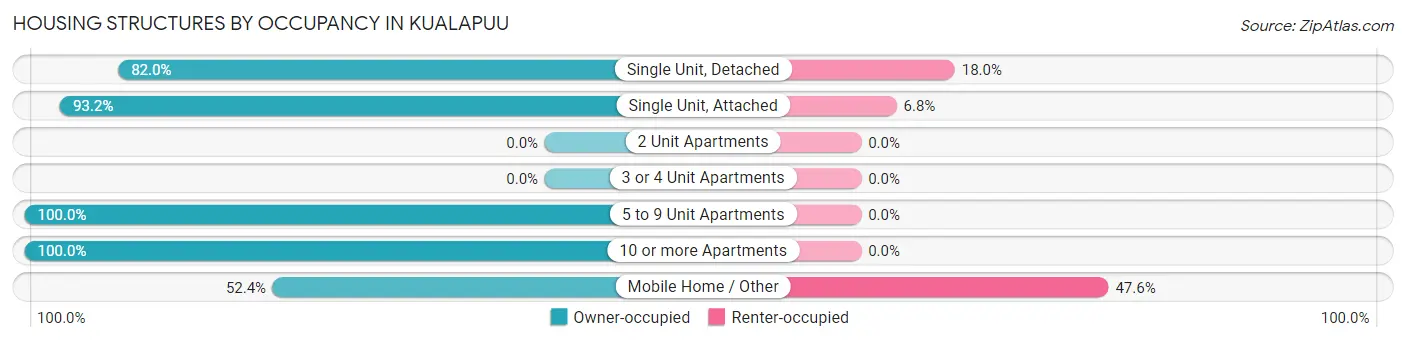
| Structure Type | Owner-occupied | Renter-occupied |
| Single Unit, Detached | 432 (82.0%) | 95 (18.0%) |
| Single Unit, Attached | 41 (93.2%) | 3 (6.8%) |
| 2 Unit Apartments | 0 (0.0%) | 0 (0.0%) |
| 3 or 4 Unit Apartments | 0 (0.0%) | 0 (0.0%) |
| 5 to 9 Unit Apartments | 12 (100.0%) | 0 (0.0%) |
| 10 or more Apartments | 4 (100.0%) | 0 (0.0%) |
| Mobile Home / Other | 11 (52.4%) | 10 (47.6%) |
| Total | 500 (82.2%) | 108 (17.8%) |
Housing Structures by Number of Rooms in Kualapuu
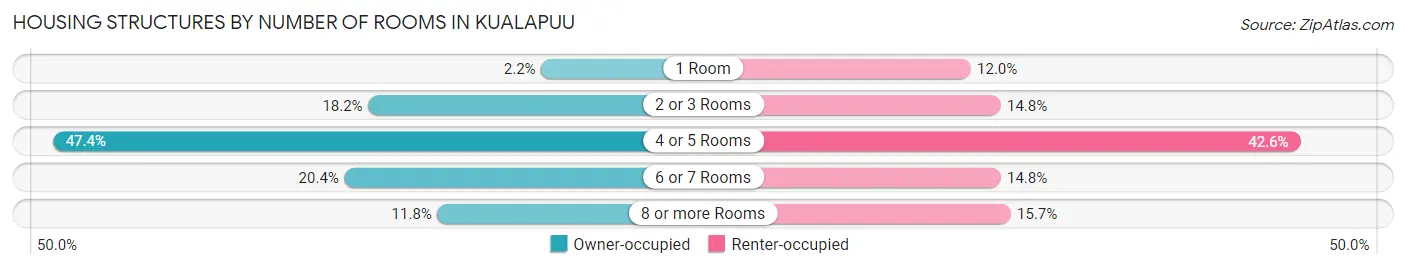
| Number of Rooms | Owner-occupied | Renter-occupied |
| 1 Room | 11 (2.2%) | 13 (12.0%) |
| 2 or 3 Rooms | 91 (18.2%) | 16 (14.8%) |
| 4 or 5 Rooms | 237 (47.4%) | 46 (42.6%) |
| 6 or 7 Rooms | 102 (20.4%) | 16 (14.8%) |
| 8 or more Rooms | 59 (11.8%) | 17 (15.7%) |
| Total | 500 (100.0%) | 108 (100.0%) |
Housing Structure by Heating Type in Kualapuu
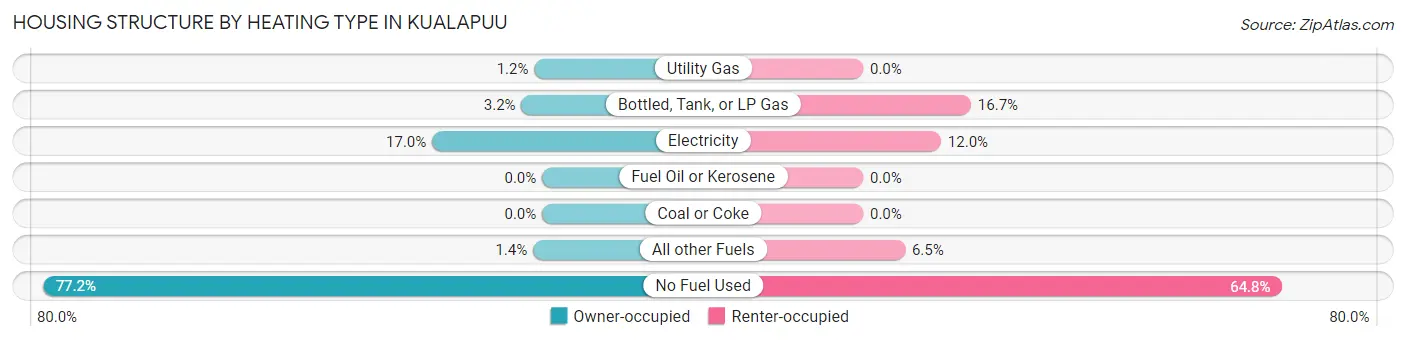
| Heating Type | Owner-occupied | Renter-occupied |
| Utility Gas | 6 (1.2%) | 0 (0.0%) |
| Bottled, Tank, or LP Gas | 16 (3.2%) | 18 (16.7%) |
| Electricity | 85 (17.0%) | 13 (12.0%) |
| Fuel Oil or Kerosene | 0 (0.0%) | 0 (0.0%) |
| Coal or Coke | 0 (0.0%) | 0 (0.0%) |
| All other Fuels | 7 (1.4%) | 7 (6.5%) |
| No Fuel Used | 386 (77.2%) | 70 (64.8%) |
| Total | 500 (100.0%) | 108 (100.0%) |
Household Vehicle Usage in Kualapuu
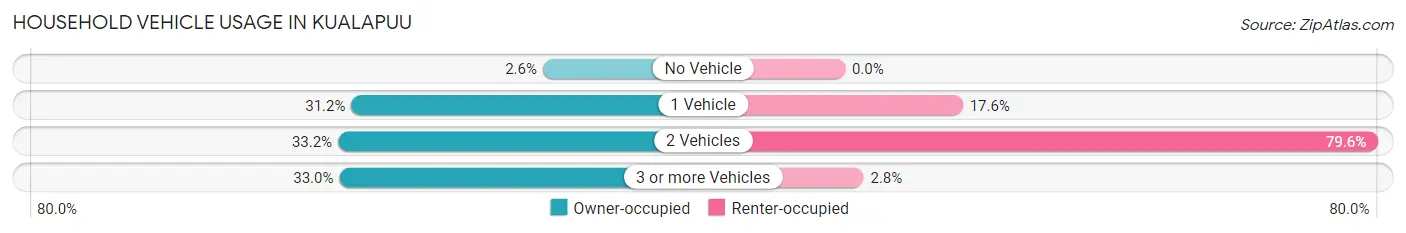
| Vehicles per Household | Owner-occupied | Renter-occupied |
| No Vehicle | 13 (2.6%) | 0 (0.0%) |
| 1 Vehicle | 156 (31.2%) | 19 (17.6%) |
| 2 Vehicles | 166 (33.2%) | 86 (79.6%) |
| 3 or more Vehicles | 165 (33.0%) | 3 (2.8%) |
| Total | 500 (100.0%) | 108 (100.0%) |
Real Estate & Mortgages in Kualapuu
Real Estate and Mortgage Overview in Kualapuu
| Characteristic | Without Mortgage | With Mortgage |
| Housing Units | 341 | 159 |
| Median Property Value | $208,600 | $389,400 |
| Median Household Income | $38,173 | $35 |
| Monthly Housing Costs | $313 | $0 |
| Real Estate Taxes | $509 | $7 |
Property Value by Mortgage Status in Kualapuu
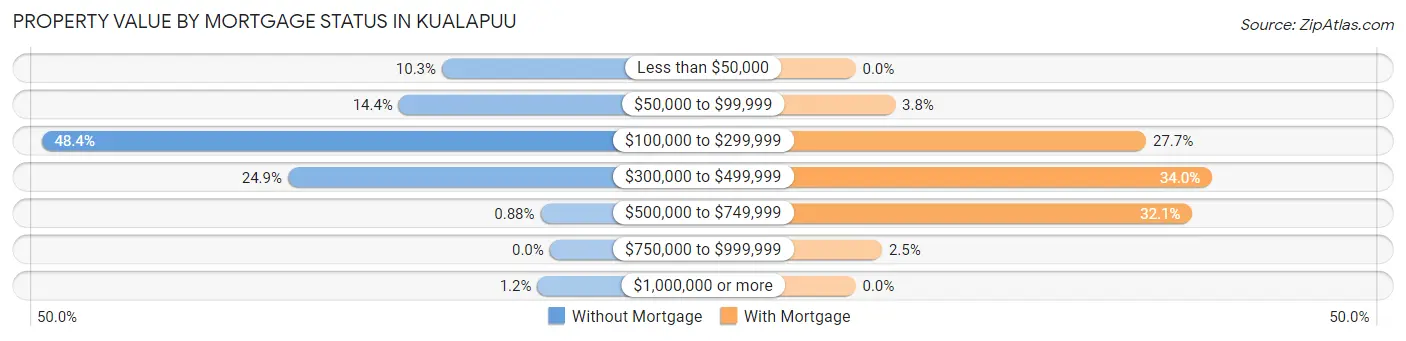
| Property Value | Without Mortgage | With Mortgage |
| Less than $50,000 | 35 (10.3%) | 0 (0.0%) |
| $50,000 to $99,999 | 49 (14.4%) | 6 (3.8%) |
| $100,000 to $299,999 | 165 (48.4%) | 44 (27.7%) |
| $300,000 to $499,999 | 85 (24.9%) | 54 (34.0%) |
| $500,000 to $749,999 | 3 (0.9%) | 51 (32.1%) |
| $750,000 to $999,999 | 0 (0.0%) | 4 (2.5%) |
| $1,000,000 or more | 4 (1.2%) | 0 (0.0%) |
| Total | 341 (100.0%) | 159 (100.0%) |
Household Income by Mortgage Status in Kualapuu
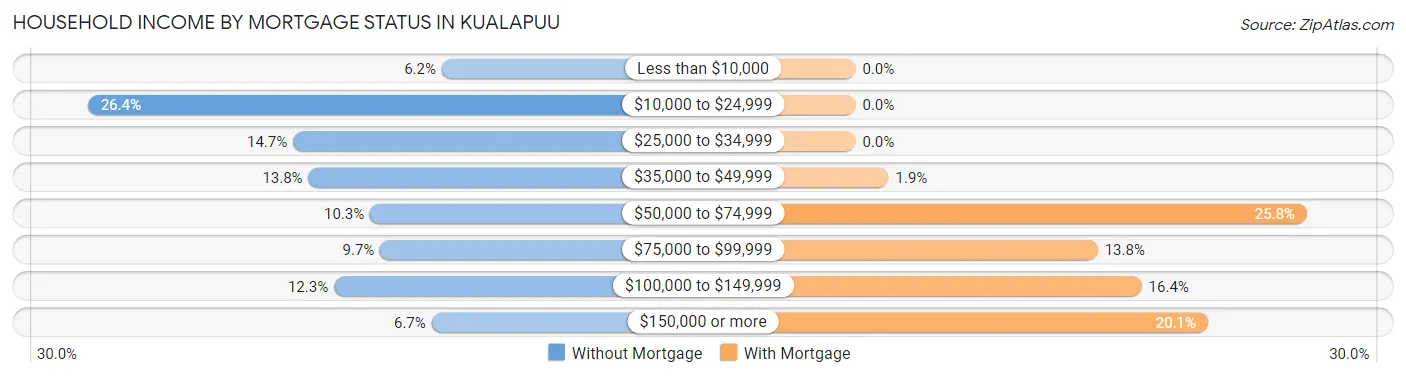
| Household Income | Without Mortgage | With Mortgage |
| Less than $10,000 | 21 (6.2%) | 0 (0.0%) |
| $10,000 to $24,999 | 90 (26.4%) | 0 (0.0%) |
| $25,000 to $34,999 | 50 (14.7%) | 0 (0.0%) |
| $35,000 to $49,999 | 47 (13.8%) | 3 (1.9%) |
| $50,000 to $74,999 | 35 (10.3%) | 41 (25.8%) |
| $75,000 to $99,999 | 33 (9.7%) | 22 (13.8%) |
| $100,000 to $149,999 | 42 (12.3%) | 26 (16.4%) |
| $150,000 or more | 23 (6.7%) | 32 (20.1%) |
| Total | 341 (100.0%) | 159 (100.0%) |
Property Value to Household Income Ratio in Kualapuu
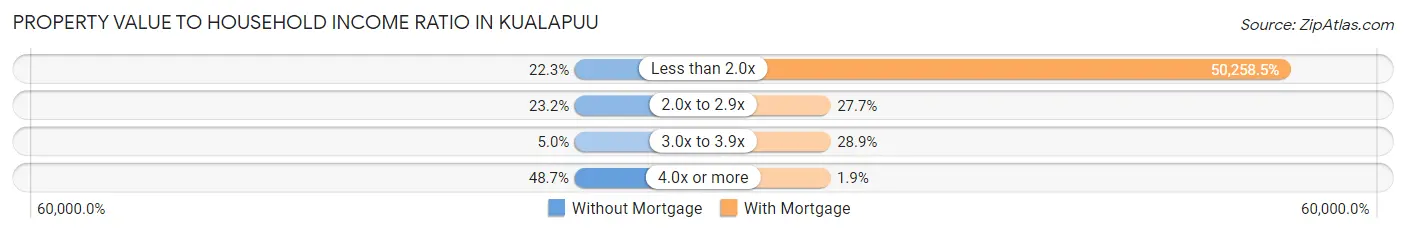
| Value-to-Income Ratio | Without Mortgage | With Mortgage |
| Less than 2.0x | 76 (22.3%) | 79,911 (50,258.5%) |
| 2.0x to 2.9x | 79 (23.2%) | 44 (27.7%) |
| 3.0x to 3.9x | 17 (5.0%) | 46 (28.9%) |
| 4.0x or more | 166 (48.7%) | 3 (1.9%) |
| Total | 341 (100.0%) | 159 (100.0%) |
Real Estate Taxes by Mortgage Status in Kualapuu
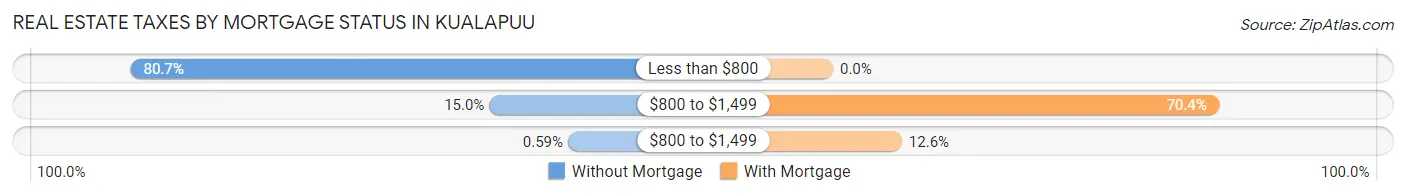
| Property Taxes | Without Mortgage | With Mortgage |
| Less than $800 | 275 (80.6%) | 0 (0.0%) |
| $800 to $1,499 | 51 (15.0%) | 112 (70.4%) |
| $800 to $1,499 | 2 (0.6%) | 20 (12.6%) |
| Total | 341 (100.0%) | 159 (100.0%) |
Health & Disability in Kualapuu
Health Insurance Coverage by Age in Kualapuu
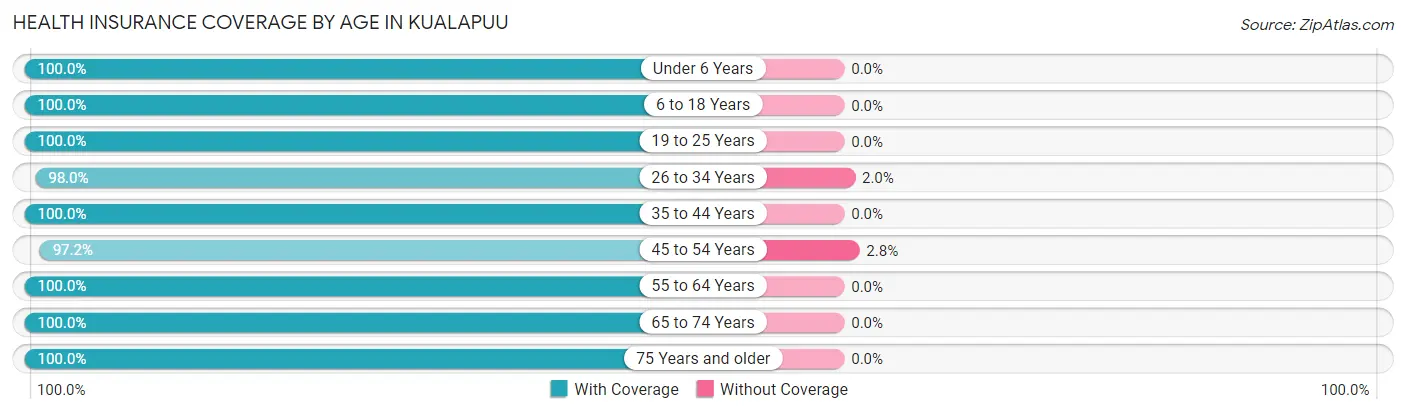
| Age Bracket | With Coverage | Without Coverage |
| Under 6 Years | 201 (100.0%) | 0 (0.0%) |
| 6 to 18 Years | 454 (100.0%) | 0 (0.0%) |
| 19 to 25 Years | 107 (100.0%) | 0 (0.0%) |
| 26 to 34 Years | 147 (98.0%) | 3 (2.0%) |
| 35 to 44 Years | 253 (100.0%) | 0 (0.0%) |
| 45 to 54 Years | 241 (97.2%) | 7 (2.8%) |
| 55 to 64 Years | 250 (100.0%) | 0 (0.0%) |
| 65 to 74 Years | 338 (100.0%) | 0 (0.0%) |
| 75 Years and older | 137 (100.0%) | 0 (0.0%) |
| Total | 2,128 (99.5%) | 10 (0.5%) |
Health Insurance Coverage by Citizenship Status in Kualapuu
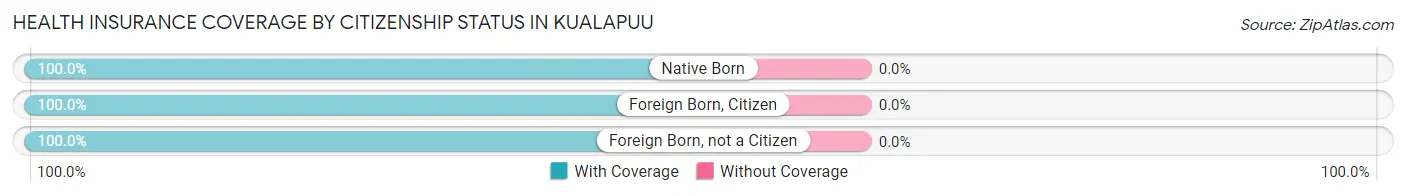
| Citizenship Status | With Coverage | Without Coverage |
| Native Born | 201 (100.0%) | 0 (0.0%) |
| Foreign Born, Citizen | 454 (100.0%) | 0 (0.0%) |
| Foreign Born, not a Citizen | 107 (100.0%) | 0 (0.0%) |
Health Insurance Coverage by Household Income in Kualapuu
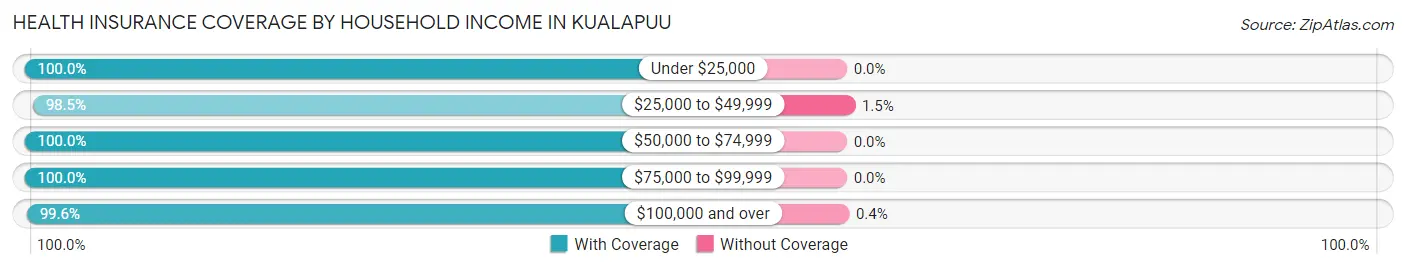
| Household Income | With Coverage | Without Coverage |
| Under $25,000 | 333 (100.0%) | 0 (0.0%) |
| $25,000 to $49,999 | 450 (98.5%) | 7 (1.5%) |
| $50,000 to $74,999 | 287 (100.0%) | 0 (0.0%) |
| $75,000 to $99,999 | 306 (100.0%) | 0 (0.0%) |
| $100,000 and over | 752 (99.6%) | 3 (0.4%) |
Public vs Private Health Insurance Coverage by Age in Kualapuu
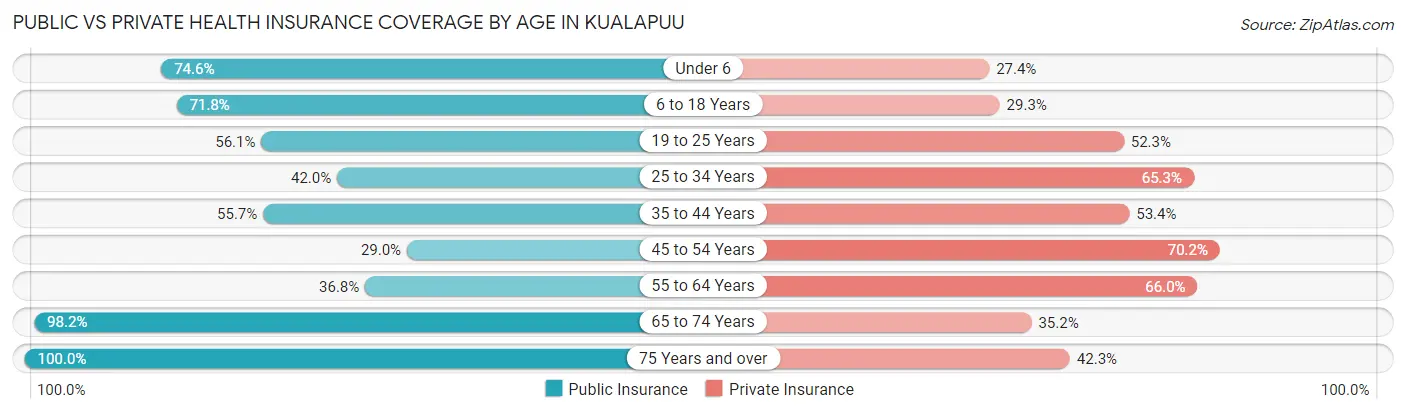
| Age Bracket | Public Insurance | Private Insurance |
| Under 6 | 150 (74.6%) | 55 (27.4%) |
| 6 to 18 Years | 326 (71.8%) | 133 (29.3%) |
| 19 to 25 Years | 60 (56.1%) | 56 (52.3%) |
| 25 to 34 Years | 63 (42.0%) | 98 (65.3%) |
| 35 to 44 Years | 141 (55.7%) | 135 (53.4%) |
| 45 to 54 Years | 72 (29.0%) | 174 (70.2%) |
| 55 to 64 Years | 92 (36.8%) | 165 (66.0%) |
| 65 to 74 Years | 332 (98.2%) | 119 (35.2%) |
| 75 Years and over | 137 (100.0%) | 58 (42.3%) |
| Total | 1,373 (64.2%) | 993 (46.5%) |
Disability Status by Sex by Age in Kualapuu
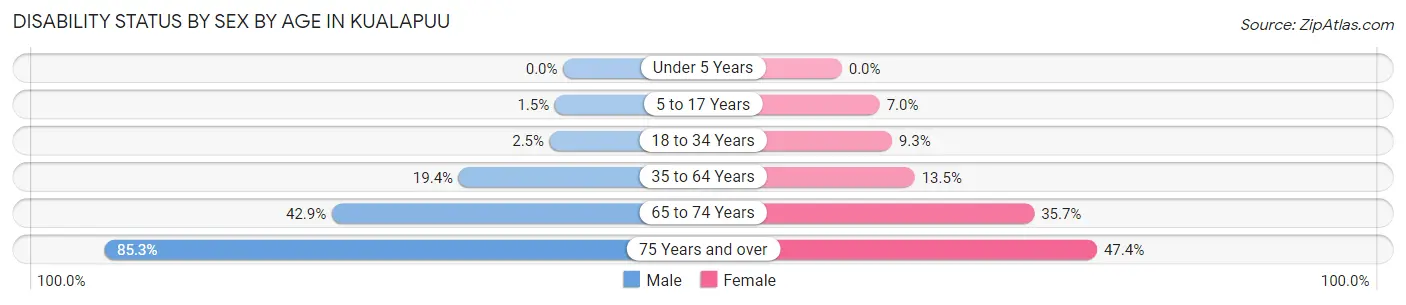
| Age Bracket | Male | Female |
| Under 5 Years | 0 (0.0%) | 0 (0.0%) |
| 5 to 17 Years | 4 (1.5%) | 14 (7.0%) |
| 18 to 34 Years | 4 (2.5%) | 12 (9.3%) |
| 35 to 64 Years | 64 (19.4%) | 57 (13.5%) |
| 65 to 74 Years | 79 (42.9%) | 55 (35.7%) |
| 75 Years and over | 52 (85.3%) | 36 (47.4%) |
Disability Class by Sex by Age in Kualapuu
Disability Class: Hearing Difficulty
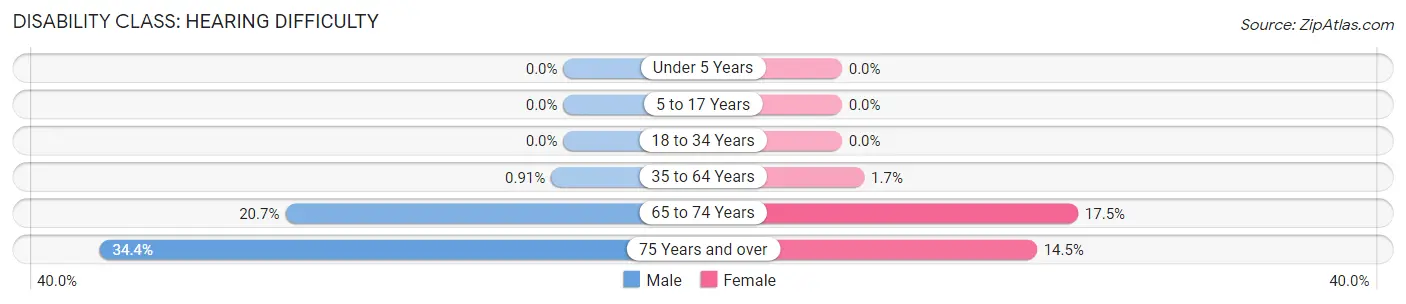
| Age Bracket | Male | Female |
| Under 5 Years | 0 (0.0%) | 0 (0.0%) |
| 5 to 17 Years | 0 (0.0%) | 0 (0.0%) |
| 18 to 34 Years | 0 (0.0%) | 0 (0.0%) |
| 35 to 64 Years | 3 (0.9%) | 7 (1.7%) |
| 65 to 74 Years | 38 (20.6%) | 27 (17.5%) |
| 75 Years and over | 21 (34.4%) | 11 (14.5%) |
Disability Class: Vision Difficulty
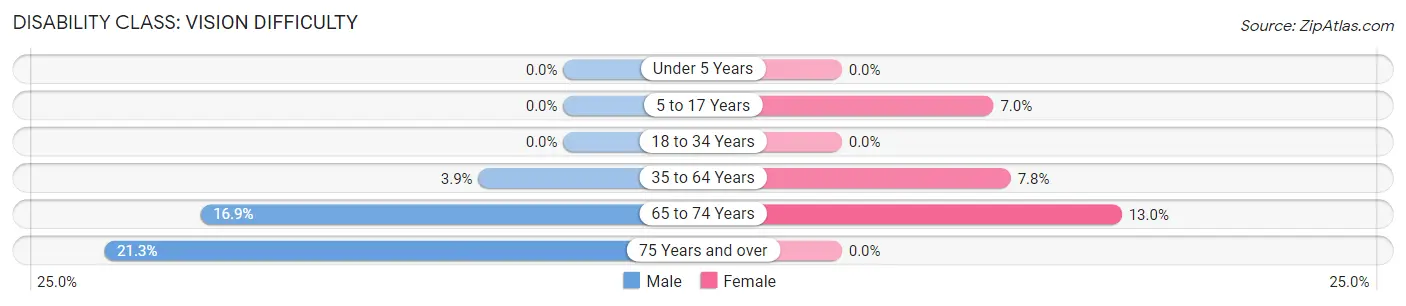
| Age Bracket | Male | Female |
| Under 5 Years | 0 (0.0%) | 0 (0.0%) |
| 5 to 17 Years | 0 (0.0%) | 14 (7.0%) |
| 18 to 34 Years | 0 (0.0%) | 0 (0.0%) |
| 35 to 64 Years | 13 (3.9%) | 33 (7.8%) |
| 65 to 74 Years | 31 (16.9%) | 20 (13.0%) |
| 75 Years and over | 13 (21.3%) | 0 (0.0%) |
Disability Class: Cognitive Difficulty
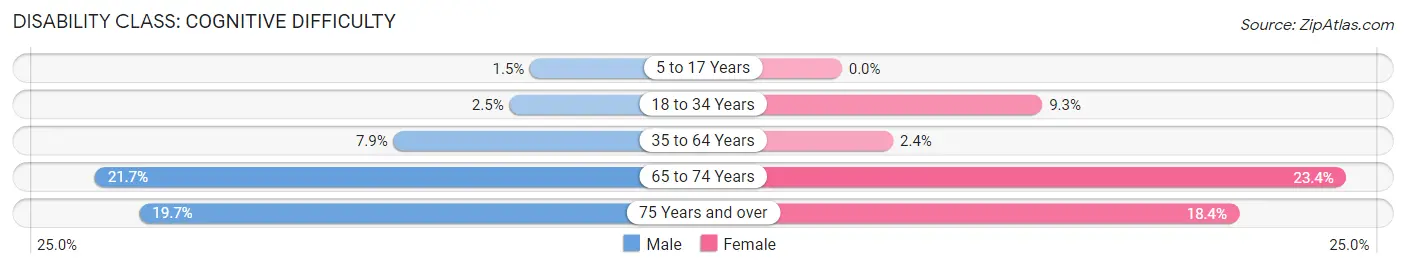
| Age Bracket | Male | Female |
| 5 to 17 Years | 4 (1.5%) | 0 (0.0%) |
| 18 to 34 Years | 4 (2.5%) | 12 (9.3%) |
| 35 to 64 Years | 26 (7.9%) | 10 (2.4%) |
| 65 to 74 Years | 40 (21.7%) | 36 (23.4%) |
| 75 Years and over | 12 (19.7%) | 14 (18.4%) |
Disability Class: Ambulatory Difficulty
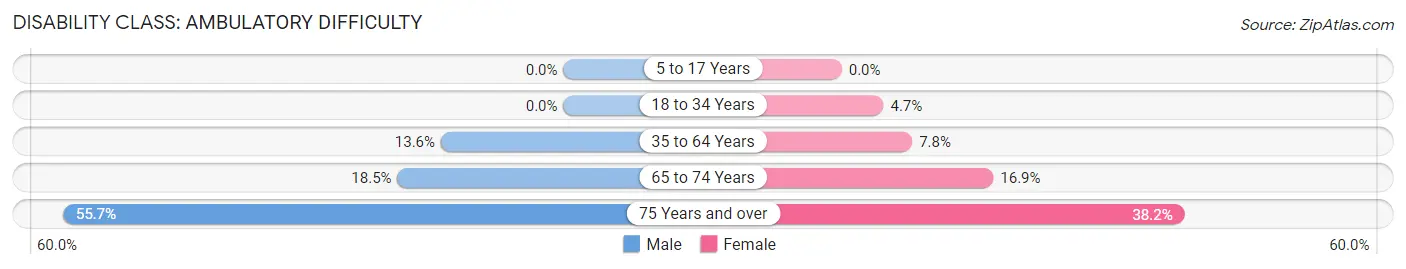
| Age Bracket | Male | Female |
| 5 to 17 Years | 0 (0.0%) | 0 (0.0%) |
| 18 to 34 Years | 0 (0.0%) | 6 (4.6%) |
| 35 to 64 Years | 45 (13.6%) | 33 (7.8%) |
| 65 to 74 Years | 34 (18.5%) | 26 (16.9%) |
| 75 Years and over | 34 (55.7%) | 29 (38.2%) |
Disability Class: Self-Care Difficulty
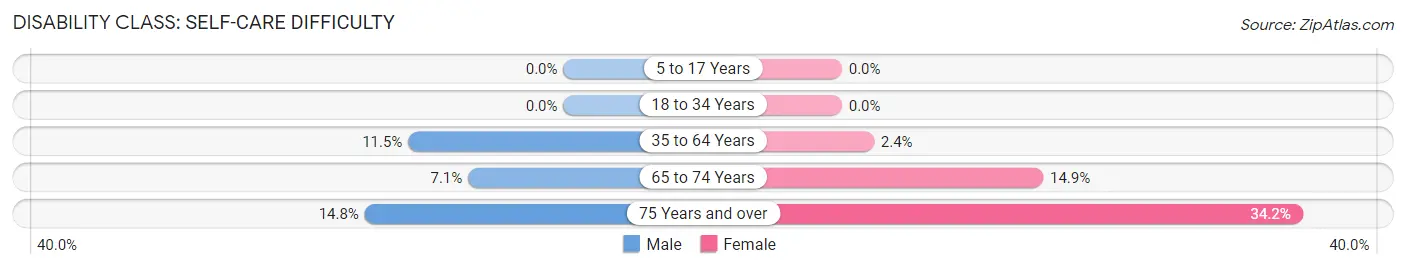
| Age Bracket | Male | Female |
| 5 to 17 Years | 0 (0.0%) | 0 (0.0%) |
| 18 to 34 Years | 0 (0.0%) | 0 (0.0%) |
| 35 to 64 Years | 38 (11.5%) | 10 (2.4%) |
| 65 to 74 Years | 13 (7.1%) | 23 (14.9%) |
| 75 Years and over | 9 (14.7%) | 26 (34.2%) |
Technology Access in Kualapuu
Computing Device Access in Kualapuu
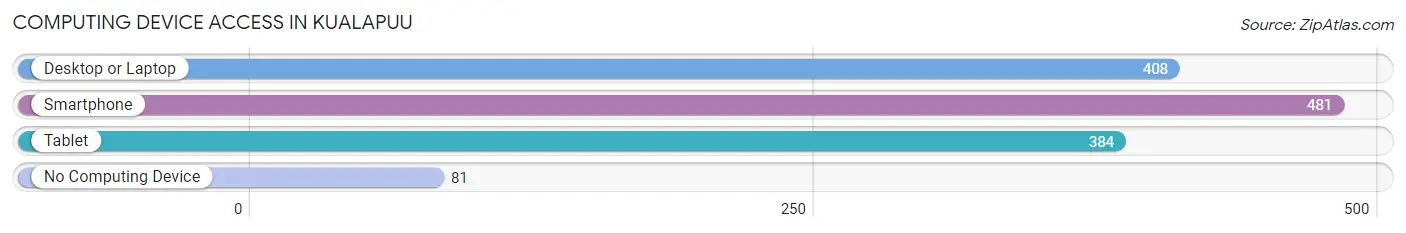
| Device Type | # Households | % Households |
| Desktop or Laptop | 408 | 67.1% |
| Smartphone | 481 | 79.1% |
| Tablet | 384 | 63.2% |
| No Computing Device | 81 | 13.3% |
| Total | 608 | 100.0% |
Internet Access in Kualapuu
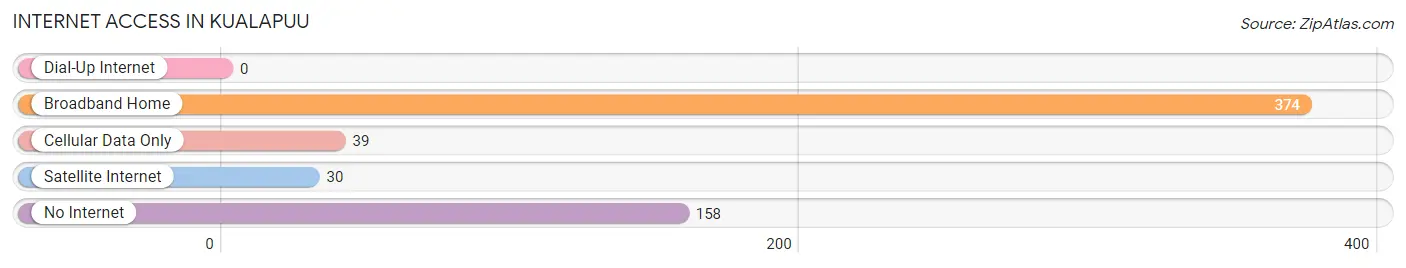
| Internet Type | # Households | % Households |
| Dial-Up Internet | 0 | 0.0% |
| Broadband Home | 374 | 61.5% |
| Cellular Data Only | 39 | 6.4% |
| Satellite Internet | 30 | 4.9% |
| No Internet | 158 | 26.0% |
| Total | 608 | 100.0% |
Kualapuu Summary
Kualapuu is a small unincorporated community located on the island of Molokai in the state of Hawaii. It is located in the southeastern part of the island, about 10 miles from the town of Kaunakakai. The population of Kualapuu was 1,845 as of the 2010 census.
History
Kualapuu was first settled by Native Hawaiians in the late 1700s. The area was used for farming and fishing, and the residents lived in small villages. In the early 1800s, the area was used for ranching and the population began to grow. In 1848, the first school was established in Kualapuu.
In the late 1800s, the area was used for sugar cane production. The sugar industry brought many immigrants to the area, including Chinese, Japanese, Portuguese, and Filipino workers. The population of Kualapuu grew rapidly during this time.
In the early 1900s, the sugar industry declined and the population of Kualapuu began to decline as well. In the 1950s, the area was used for pineapple production. The pineapple industry brought more immigrants to the area, including Filipino and Puerto Rican workers.
Geography
Kualapuu is located on the southeastern part of the island of Molokai. It is bordered by the Pacific Ocean to the east and the Kalaupapa National Historical Park to the west. The area is mostly rural, with rolling hills and lush vegetation. The climate is tropical, with temperatures ranging from 70 to 90 degrees Fahrenheit.
Economy
The economy of Kualapuu is largely based on agriculture. The area is known for its pineapple production, as well as its production of coffee, macadamia nuts, and other crops. Tourism is also an important part of the economy, with many visitors coming to the area to enjoy the beaches and other attractions.
Demographics
As of the 2010 census, the population of Kualapuu was 1,845. The racial makeup of the population was 57.3% Native Hawaiian, 24.2% White, 8.2% Filipino, 5.2% Asian, and 4.9% other. The median household income was $45,000, and the median age was 44.
Kualapuu is a small, rural community with a rich history and culture. The area is known for its agricultural production and its beautiful beaches. The population is diverse, with a mix of Native Hawaiian, Asian, and other ethnicities. The economy is largely based on agriculture and tourism, and the area is a popular destination for visitors from around the world.
Common Questions
What is the Total Population of Kualapuu?
Total Population of Kualapuu is 2,157.
What is the Total Male Population of Kualapuu?
Total Male Population of Kualapuu is 1,111.
What is the Total Female Population of Kualapuu?
Total Female Population of Kualapuu is 1,046.
What is the Ratio of Males per 100 Females in Kualapuu?
There are 106.21 Males per 100 Females in Kualapuu.
What is the Ratio of Females per 100 Males in Kualapuu?
There are 94.15 Females per 100 Males in Kualapuu.
What is the Median Population Age in Kualapuu?
Median Population Age in Kualapuu is 41.1 Years.
What is the Average Family Size in Kualapuu
Average Family Size in Kualapuu is 4.0 People.
What is the Average Household Size in Kualapuu
Average Household Size in Kualapuu is 3.5 People.
What is Per Capita Income in Kualapuu?
Per Capita income in Kualapuu is $22,741.
What is the Median Family Income in Kualapuu?
Median Family Income in Kualapuu is $62,625.
What is the Median Household income in Kualapuu?
Median Household Income in Kualapuu is $46,711.
What is Income or Wage Gap in Kualapuu?
Income or Wage Gap in Kualapuu is 28.4%.
Women in Kualapuu earn 71.6 cents for every dollar earned by a man.
What is Inequality or Gini Index in Kualapuu?
Inequality or Gini Index in Kualapuu is 0.49.
How Large is the Labor Force in Kualapuu?
There are 845 People in the Labor Forcein in Kualapuu.
What is the Percentage of People in the Labor Force in Kualapuu?
51.4% of People are in the Labor Force in Kualapuu.
What is the Unemployment Rate in Kualapuu?
Unemployment Rate in Kualapuu is 5.7%.