Paia, HI
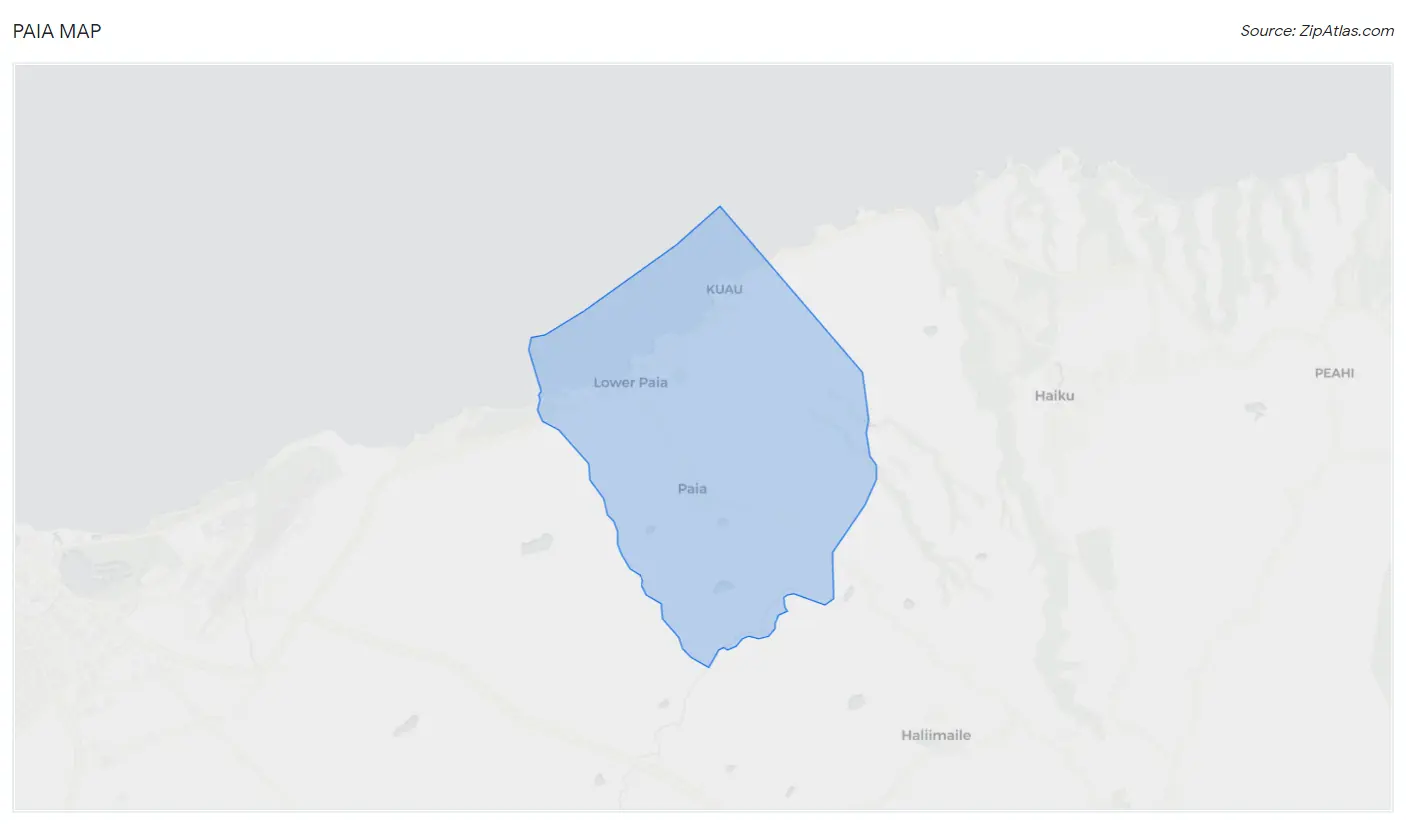
Paia Map
Paia Overview
2,211
TOTAL POPULATION
1,195
MALE POPULATION
1,016
FEMALE POPULATION
117.62
MALES / 100 FEMALES
85.02
FEMALES / 100 MALES
42.3
MEDIAN AGE
3.0
AVG FAMILY SIZE
2.7
AVG HOUSEHOLD SIZE
$46,999
PER CAPITA INCOME
$122,821
AVG FAMILY INCOME
$113,750
AVG HOUSEHOLD INCOME
22.2%
WAGE / INCOME GAP [ % ]
77.8¢/ $1
WAGE / INCOME GAP [ $ ]
0.41
INEQUALITY / GINI INDEX
1,445
LABOR FORCE [ PEOPLE ]
76.0%
PERCENT IN LABOR FORCE
12.9%
UNEMPLOYMENT RATE
Paia Zip Codes
Paia Area Codes
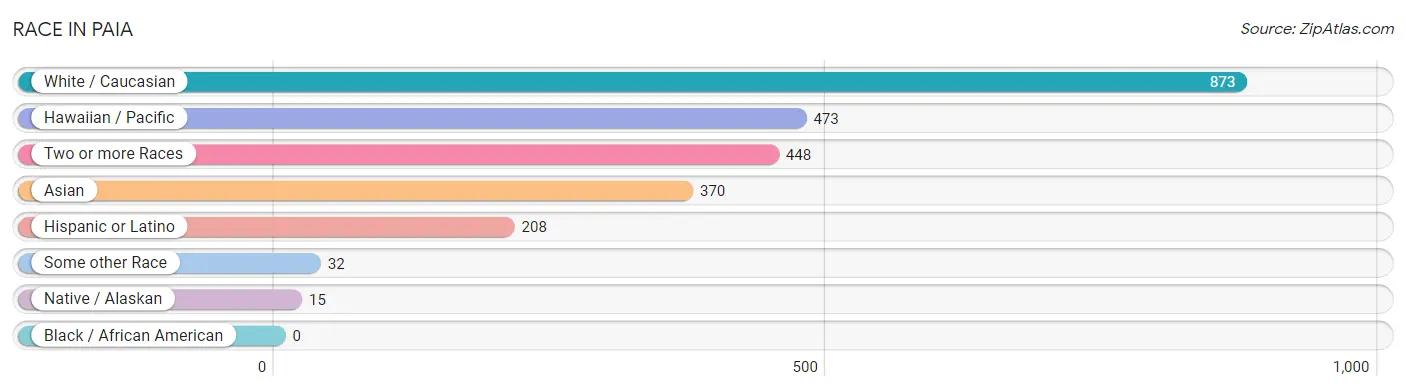
Race in Paia
The most populous races in Paia are White / Caucasian (873 | 39.5%), Hawaiian / Pacific (473 | 21.4%), and Two or more Races (448 | 20.3%).
| Race | # Population | % Population |
| Asian | 370 | 16.7% |
| Black / African American | 0 | 0.0% |
| Hawaiian / Pacific | 473 | 21.4% |
| Hispanic or Latino | 208 | 9.4% |
| Native / Alaskan | 15 | 0.7% |
| White / Caucasian | 873 | 39.5% |
| Two or more Races | 448 | 20.3% |
| Some other Race | 32 | 1.5% |
| Total | 2,211 | 100.0% |
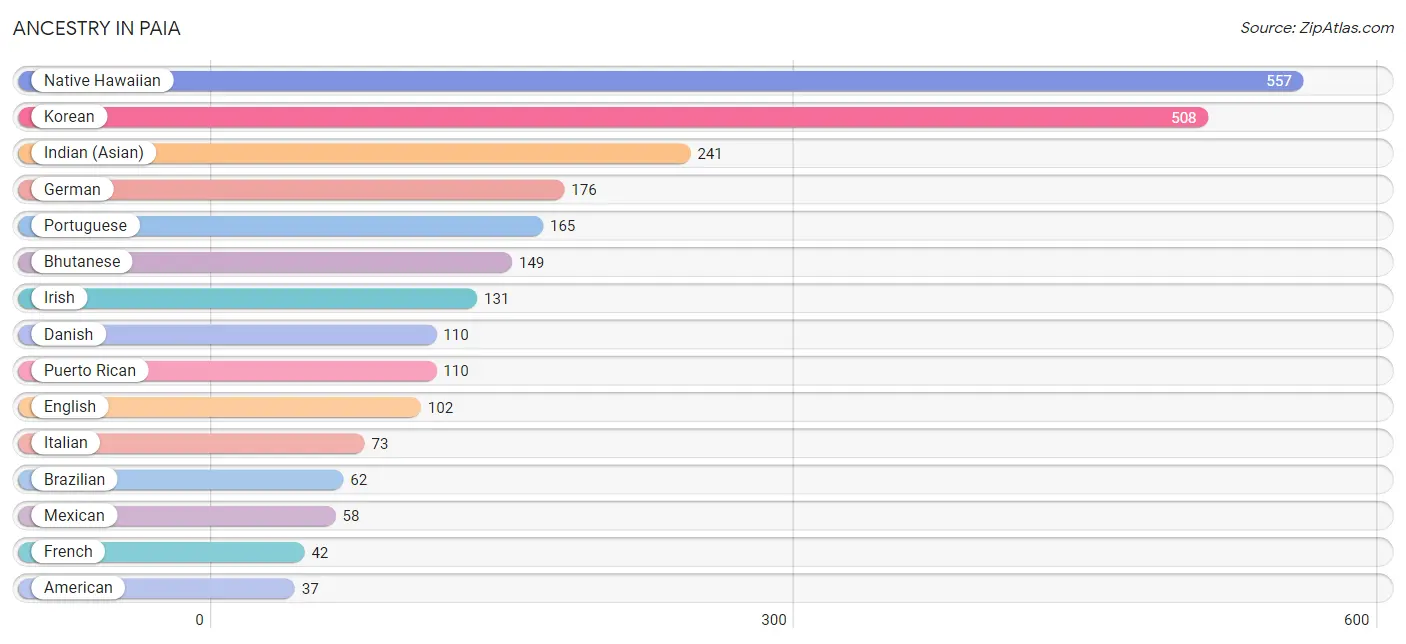
Ancestry in Paia
The most populous ancestries reported in Paia are Native Hawaiian (557 | 25.2%), Korean (508 | 23.0%), Indian (Asian) (241 | 10.9%), German (176 | 8.0%), and Portuguese (165 | 7.5%), together accounting for 74.5% of all Paia residents.
| Ancestry | # Population | % Population |
| American | 37 | 1.7% |
| Argentinean | 22 | 1.0% |
| Bhutanese | 149 | 6.7% |
| Brazilian | 62 | 2.8% |
| British | 22 | 1.0% |
| Bulgarian | 16 | 0.7% |
| Burmese | 19 | 0.9% |
| Celtic | 13 | 0.6% |
| Cherokee | 15 | 0.7% |
| Creek | 14 | 0.6% |
| Czech | 10 | 0.4% |
| Danish | 110 | 5.0% |
| Dutch | 6 | 0.3% |
| English | 102 | 4.6% |
| European | 15 | 0.7% |
| Fijian | 4 | 0.2% |
| French | 42 | 1.9% |
| German | 176 | 8.0% |
| Indian (Asian) | 241 | 10.9% |
| Iranian | 6 | 0.3% |
| Irish | 131 | 5.9% |
| Italian | 73 | 3.3% |
| Korean | 508 | 23.0% |
| Laotian | 9 | 0.4% |
| Mexican | 58 | 2.6% |
| Native Hawaiian | 557 | 25.2% |
| Northern European | 13 | 0.6% |
| Norwegian | 11 | 0.5% |
| Polish | 18 | 0.8% |
| Portuguese | 165 | 7.5% |
| Puerto Rican | 110 | 5.0% |
| Russian | 7 | 0.3% |
| Samoan | 20 | 0.9% |
| Scotch-Irish | 10 | 0.4% |
| Scottish | 6 | 0.3% |
| South American | 22 | 1.0% |
| Spaniard | 18 | 0.8% |
| Swiss | 6 | 0.3% |
| Turkish | 5 | 0.2% |
| Ukrainian | 32 | 1.5% |
| Welsh | 13 | 0.6% | View All 41 Rows |
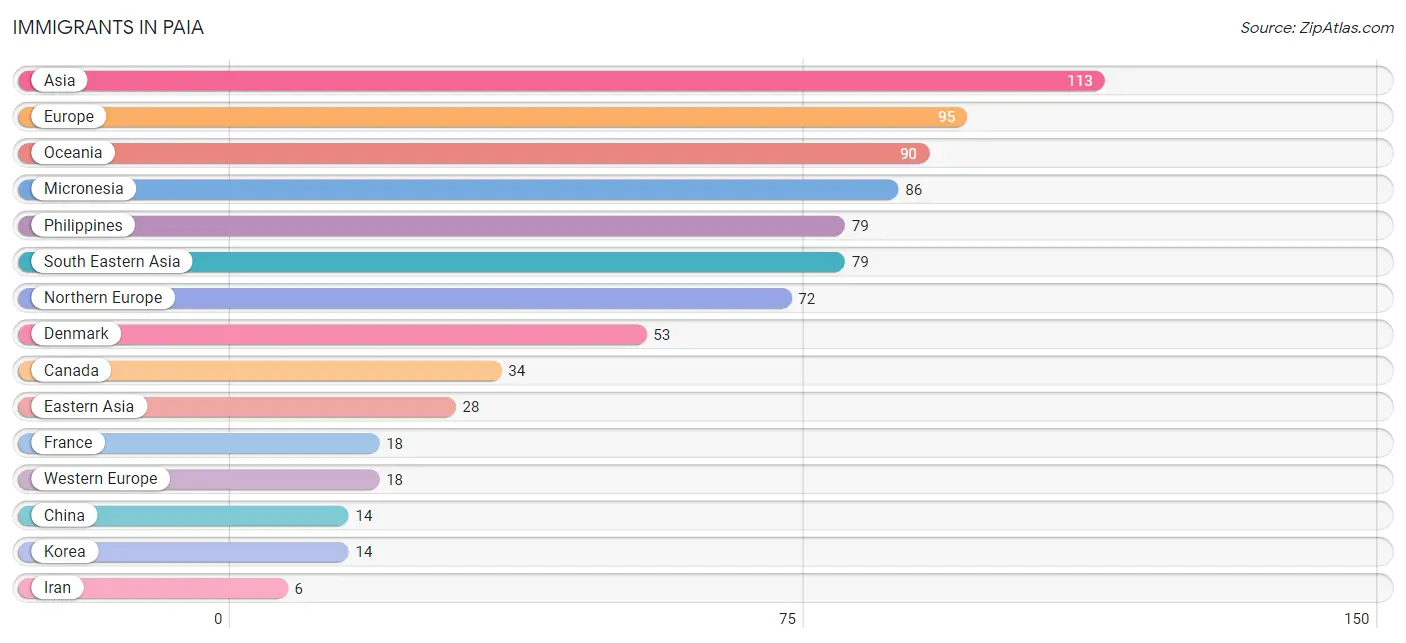
Immigrants in Paia
The most numerous immigrant groups reported in Paia came from Asia (113 | 5.1%), Europe (95 | 4.3%), Oceania (90 | 4.1%), Micronesia (86 | 3.9%), and Philippines (79 | 3.6%), together accounting for 20.9% of all Paia residents.
| Immigration Origin | # Population | % Population |
| Asia | 113 | 5.1% |
| Canada | 34 | 1.5% |
| Central America | 2 | 0.1% |
| China | 14 | 0.6% |
| Denmark | 53 | 2.4% |
| Eastern Asia | 28 | 1.3% |
| Europe | 95 | 4.3% |
| France | 18 | 0.8% |
| Iran | 6 | 0.3% |
| Korea | 14 | 0.6% |
| Latin America | 2 | 0.1% |
| Mexico | 2 | 0.1% |
| Micronesia | 86 | 3.9% |
| Northern Europe | 72 | 3.3% |
| Oceania | 90 | 4.1% |
| Philippines | 79 | 3.6% |
| Portugal | 5 | 0.2% |
| South Central Asia | 6 | 0.3% |
| South Eastern Asia | 79 | 3.6% |
| Southern Europe | 5 | 0.2% |
| Western Europe | 18 | 0.8% | View All 21 Rows |
Sex and Age in Paia
Sex and Age in Paia
The most populous age groups in Paia are 35 to 39 Years (147 | 12.3%) for men and 20 to 24 Years (107 | 10.5%) for women.
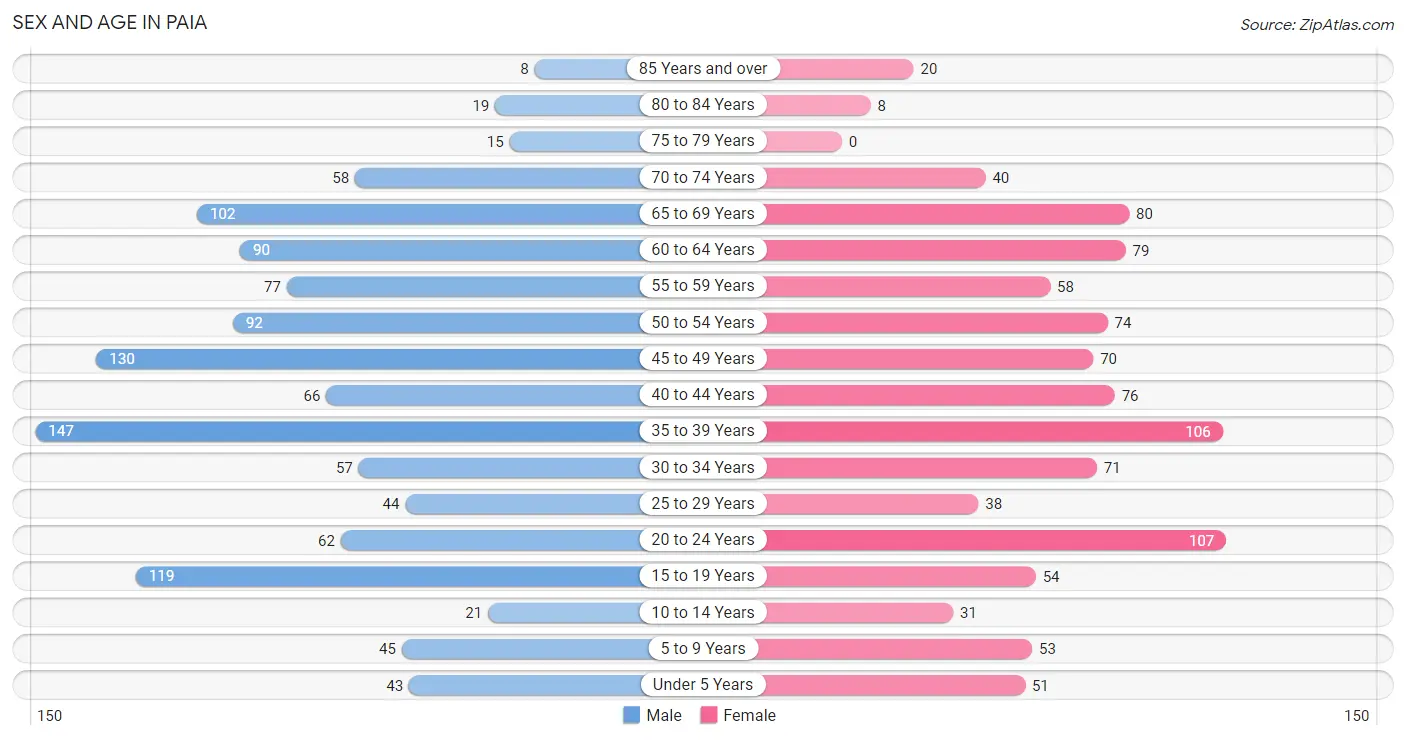
| Age Bracket | Male | Female |
| Under 5 Years | 43 (3.6%) | 51 (5.0%) |
| 5 to 9 Years | 45 (3.8%) | 53 (5.2%) |
| 10 to 14 Years | 21 (1.8%) | 31 (3.0%) |
| 15 to 19 Years | 119 (10.0%) | 54 (5.3%) |
| 20 to 24 Years | 62 (5.2%) | 107 (10.5%) |
| 25 to 29 Years | 44 (3.7%) | 38 (3.7%) |
| 30 to 34 Years | 57 (4.8%) | 71 (7.0%) |
| 35 to 39 Years | 147 (12.3%) | 106 (10.4%) |
| 40 to 44 Years | 66 (5.5%) | 76 (7.5%) |
| 45 to 49 Years | 130 (10.9%) | 70 (6.9%) |
| 50 to 54 Years | 92 (7.7%) | 74 (7.3%) |
| 55 to 59 Years | 77 (6.4%) | 58 (5.7%) |
| 60 to 64 Years | 90 (7.5%) | 79 (7.8%) |
| 65 to 69 Years | 102 (8.5%) | 80 (7.9%) |
| 70 to 74 Years | 58 (4.9%) | 40 (3.9%) |
| 75 to 79 Years | 15 (1.3%) | 0 (0.0%) |
| 80 to 84 Years | 19 (1.6%) | 8 (0.8%) |
| 85 Years and over | 8 (0.7%) | 20 (2.0%) |
| Total | 1,195 (100.0%) | 1,016 (100.0%) |
Families and Households in Paia
Median Family Size in Paia
The median family size in Paia is 2.99 persons per family, with single female/mother families (83 | 14.5%) accounting for the largest median family size of 3.49 persons per family. On the other hand, single male/father families (123 | 21.5%) represent the smallest median family size with 2.45 persons per family.
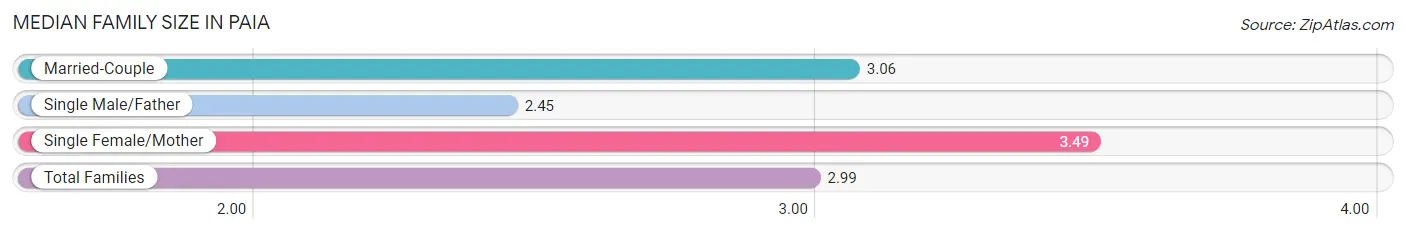
| Family Type | # Families | Family Size |
| Married-Couple | 366 (64.0%) | 3.06 |
| Single Male/Father | 123 (21.5%) | 2.45 |
| Single Female/Mother | 83 (14.5%) | 3.49 |
| Total Families | 572 (100.0%) | 2.99 |
Median Household Size in Paia
The median household size in Paia is 2.74 persons per household, with single female/mother households (83 | 10.4%) accounting for the largest median household size of 4.12 persons per household. non-family households (228 | 28.5%) represent the smallest median household size with 1.45 persons per household.
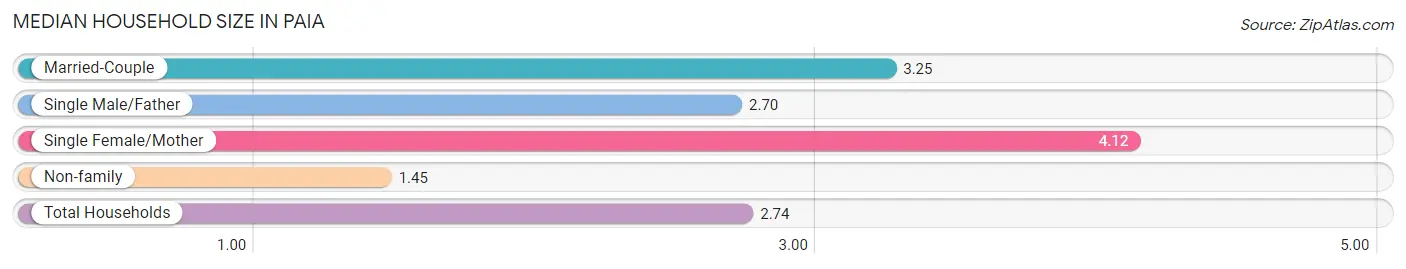
| Household Type | # Households | Household Size |
| Married-Couple | 366 (45.8%) | 3.25 |
| Single Male/Father | 123 (15.4%) | 2.70 |
| Single Female/Mother | 83 (10.4%) | 4.12 |
| Non-family | 228 (28.5%) | 1.45 |
| Total Households | 800 (100.0%) | 2.74 |
Household Size by Marriage Status in Paia
Out of a total of 800 households in Paia, 572 (71.5%) are family households, while 228 (28.5%) are nonfamily households. The most numerous type of family households are 2-person households, comprising 196, and the most common type of nonfamily households are 1-person households, comprising 146.
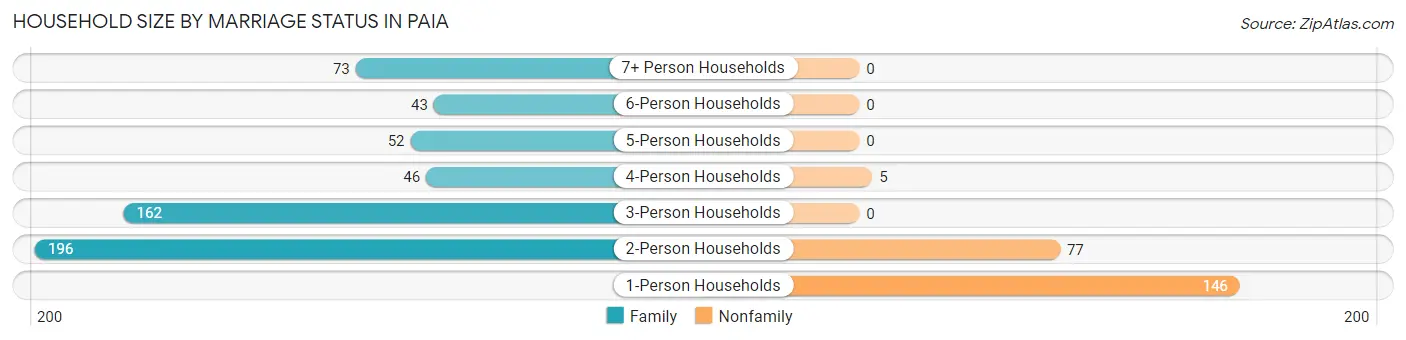
| Household Size | Family Households | Nonfamily Households |
| 1-Person Households | - | 146 (18.2%) |
| 2-Person Households | 196 (24.5%) | 77 (9.6%) |
| 3-Person Households | 162 (20.3%) | 0 (0.0%) |
| 4-Person Households | 46 (5.8%) | 5 (0.6%) |
| 5-Person Households | 52 (6.5%) | 0 (0.0%) |
| 6-Person Households | 43 (5.4%) | 0 (0.0%) |
| 7+ Person Households | 73 (9.1%) | 0 (0.0%) |
| Total | 572 (71.5%) | 228 (28.5%) |
Female Fertility in Paia
Fertility by Age in Paia
Average fertility rate in Paia is 231.0 births per 1,000 women. Women in the age bracket of 35 to 50 years have the highest fertility rate with 315.0 births per 1,000 women. Women in the age bracket of 35 to 50 years acount for 67.7% of all women with births.
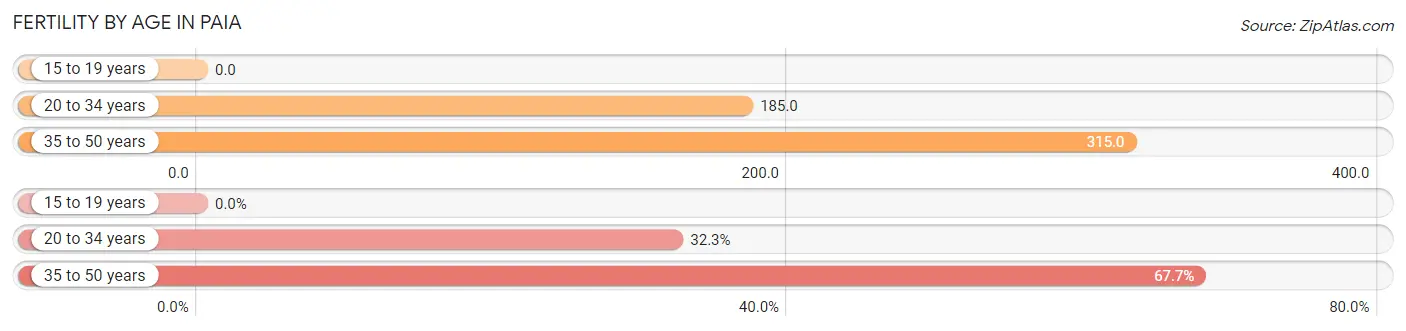
| Age Bracket | Women with Births | Births / 1,000 Women |
| 15 to 19 years | 0 (0.0%) | 0.0 |
| 20 to 34 years | 40 (32.3%) | 185.0 |
| 35 to 50 years | 84 (67.7%) | 315.0 |
| Total | 124 (100.0%) | 231.0 |
Fertility by Age by Marriage Status in Paia
83.1% of women with births (124) in Paia are married. The highest percentage of unmarried women with births falls into 35 to 50 years age bracket with 17.9% of them unmarried at the time of birth, while the lowest percentage of unmarried women with births belong to 20 to 34 years age bracket with 15.0% of them unmarried.
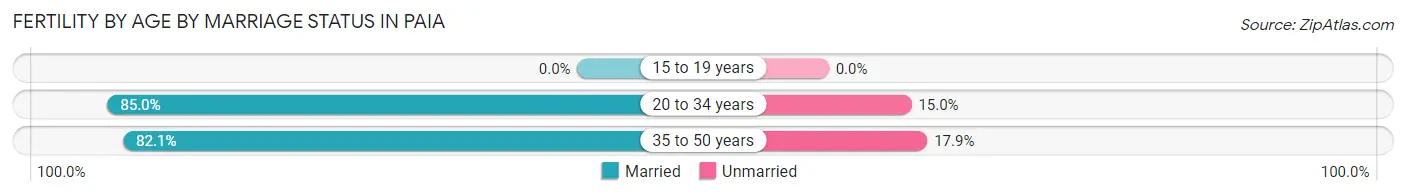
| Age Bracket | Married | Unmarried |
| 15 to 19 years | 0 (0.0%) | 0 (0.0%) |
| 20 to 34 years | 34 (85.0%) | 6 (15.0%) |
| 35 to 50 years | 69 (82.1%) | 15 (17.9%) |
| Total | 103 (83.1%) | 21 (16.9%) |
Fertility by Education in Paia
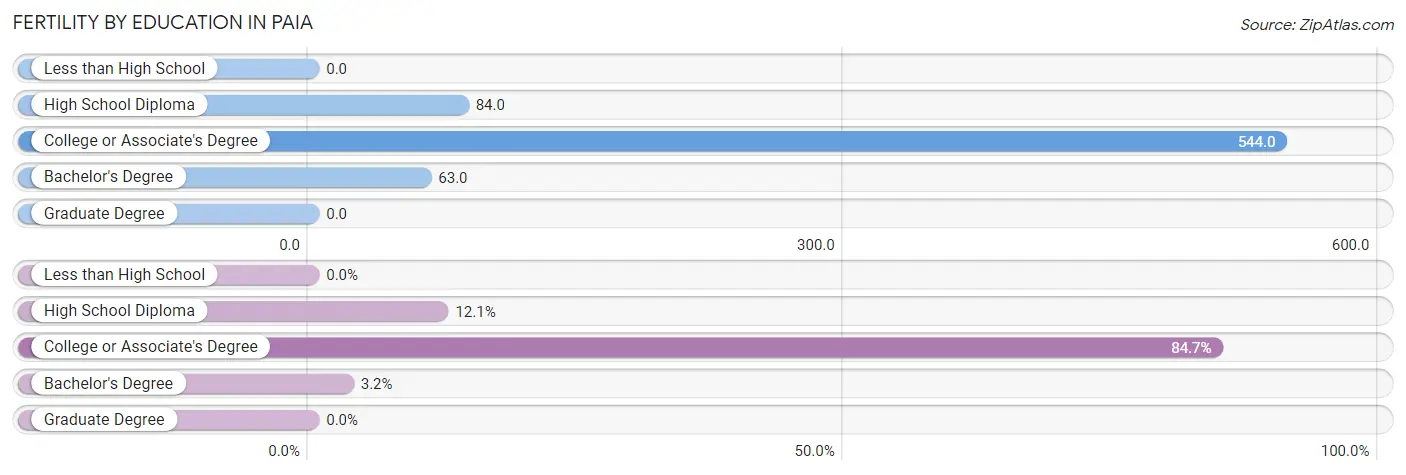
| Educational Attainment | Women with Births | Births / 1,000 Women |
| Less than High School | 0 (0.0%) | 0.0 |
| High School Diploma | 15 (12.1%) | 84.0 |
| College or Associate's Degree | 105 (84.7%) | 544.0 |
| Bachelor's Degree | 4 (3.2%) | 63.0 |
| Graduate Degree | 0 (0.0%) | 0.0 |
| Total | 124 (100.0%) | 231.0 |
Fertility by Education by Marriage Status in Paia
16.9% of women with births in Paia are unmarried. Women with the educational attainment of bachelor's degree are most likely to be married with 100.0% of them married at childbirth, while women with the educational attainment of high school diploma are least likely to be married with 40.0% of them unmarried at childbirth.
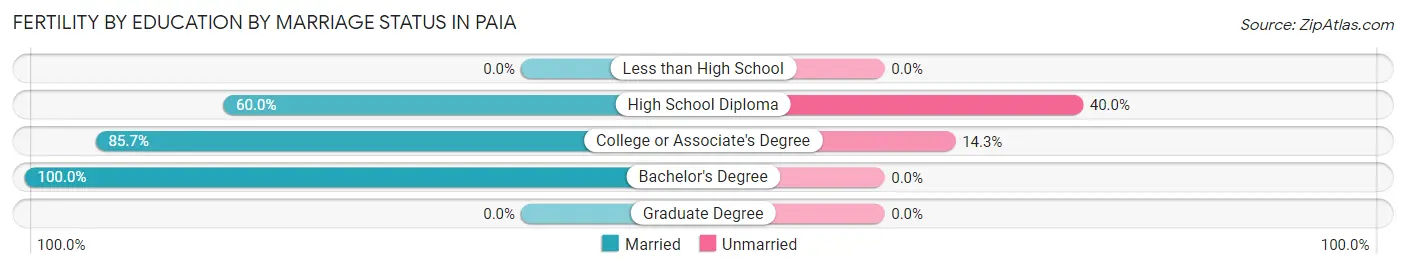
| Educational Attainment | Married | Unmarried |
| Less than High School | 0 (0.0%) | 0 (0.0%) |
| High School Diploma | 9 (60.0%) | 6 (40.0%) |
| College or Associate's Degree | 90 (85.7%) | 15 (14.3%) |
| Bachelor's Degree | 4 (100.0%) | 0 (0.0%) |
| Graduate Degree | 0 (0.0%) | 0 (0.0%) |
| Total | 103 (83.1%) | 21 (16.9%) |
Income in Paia
Income Overview in Paia
Per Capita Income in Paia is $46,999, while median incomes of families and households are $122,821 and $113,750 respectively.
| Characteristic | Number | Measure |
| Per Capita Income | 2,211 | $46,999 |
| Median Family Income | 572 | $122,821 |
| Mean Family Income | 572 | $132,189 |
| Median Household Income | 800 | $113,750 |
| Mean Household Income | 800 | $131,219 |
| Income Deficit | 572 | $0 |
| Wage / Income Gap (%) | 2,211 | 22.21% |
| Wage / Income Gap ($) | 2,211 | 77.79¢ per $1 |
| Gini / Inequality Index | 2,211 | 0.41 |
Earnings by Sex in Paia
Average Earnings in Paia are $42,500, $44,242 for men and $34,414 for women, a difference of 22.2%.
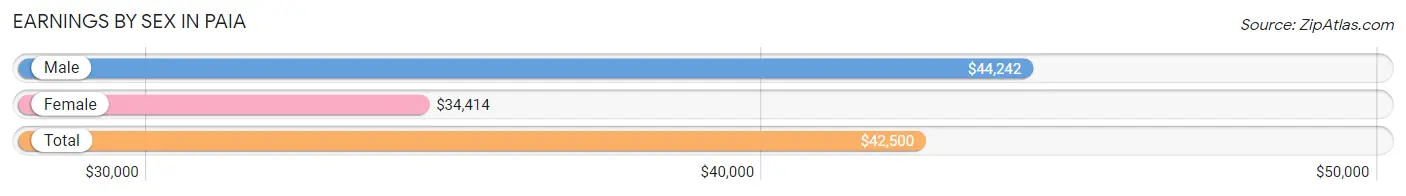
| Sex | Number | Average Earnings |
| Male | 778 (53.3%) | $44,242 |
| Female | 682 (46.7%) | $34,414 |
| Total | 1,460 (100.0%) | $42,500 |
Earnings by Sex by Income Bracket in Paia
The most common earnings brackets in Paia are $40,000 to $44,999 for men (156 | 20.1%) and $100,000+ for women (114 | 16.7%).
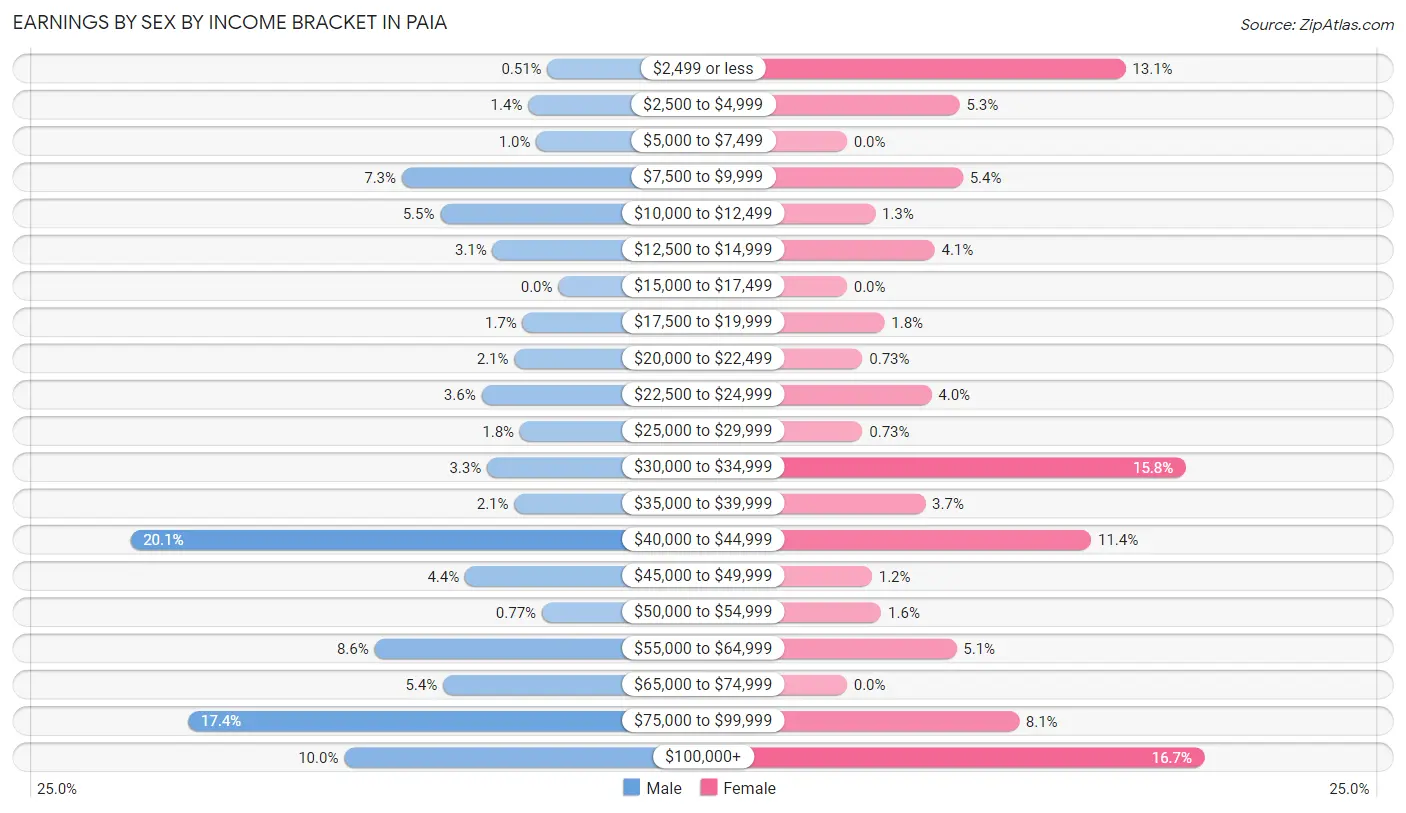
| Income | Male | Female |
| $2,499 or less | 4 (0.5%) | 89 (13.1%) |
| $2,500 to $4,999 | 11 (1.4%) | 36 (5.3%) |
| $5,000 to $7,499 | 8 (1.0%) | 0 (0.0%) |
| $7,500 to $9,999 | 57 (7.3%) | 37 (5.4%) |
| $10,000 to $12,499 | 43 (5.5%) | 9 (1.3%) |
| $12,500 to $14,999 | 24 (3.1%) | 28 (4.1%) |
| $15,000 to $17,499 | 0 (0.0%) | 0 (0.0%) |
| $17,500 to $19,999 | 13 (1.7%) | 12 (1.8%) |
| $20,000 to $22,499 | 16 (2.1%) | 5 (0.7%) |
| $22,500 to $24,999 | 28 (3.6%) | 27 (4.0%) |
| $25,000 to $29,999 | 14 (1.8%) | 5 (0.7%) |
| $30,000 to $34,999 | 26 (3.3%) | 108 (15.8%) |
| $35,000 to $39,999 | 16 (2.1%) | 25 (3.7%) |
| $40,000 to $44,999 | 156 (20.1%) | 78 (11.4%) |
| $45,000 to $49,999 | 34 (4.4%) | 8 (1.2%) |
| $50,000 to $54,999 | 6 (0.8%) | 11 (1.6%) |
| $55,000 to $64,999 | 67 (8.6%) | 35 (5.1%) |
| $65,000 to $74,999 | 42 (5.4%) | 0 (0.0%) |
| $75,000 to $99,999 | 135 (17.3%) | 55 (8.1%) |
| $100,000+ | 78 (10.0%) | 114 (16.7%) |
| Total | 778 (100.0%) | 682 (100.0%) |
Earnings by Sex by Educational Attainment in Paia
Average earnings in Paia are $44,326 for men and $40,852 for women, a difference of 7.8%. Men with an educational attainment of college or associate's degree enjoy the highest average annual earnings of $51,042, while those with high school diploma education earn the least with $41,625. Women with an educational attainment of bachelor's degree earn the most with the average annual earnings of $62,596, while those with college or associate's degree education have the smallest earnings of $2,499.
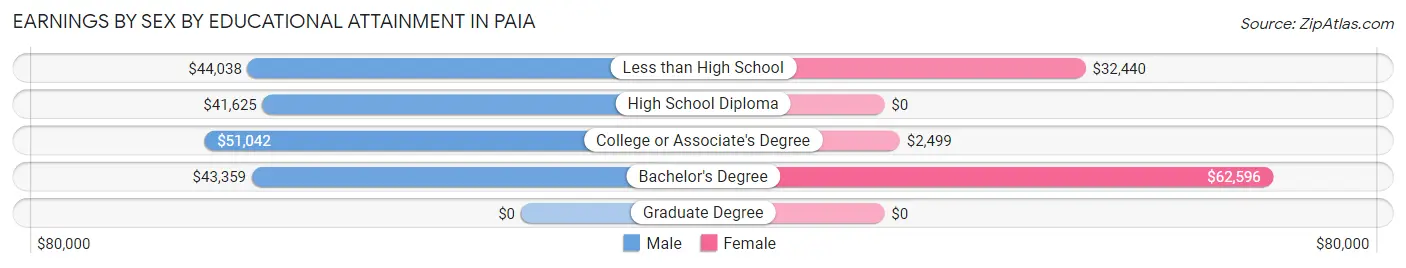
| Educational Attainment | Male Income | Female Income |
| Less than High School | $44,038 | $32,440 |
| High School Diploma | $41,625 | $0 |
| College or Associate's Degree | $51,042 | $2,499 |
| Bachelor's Degree | $43,359 | $62,596 |
| Graduate Degree | - | - |
| Total | $44,326 | $40,852 |
Family Income in Paia
Family Income Brackets in Paia
According to the Paia family income data, there are 141 families falling into the $100,000 to $149,999 income range, which is the most common income bracket and makes up 24.6% of all families.
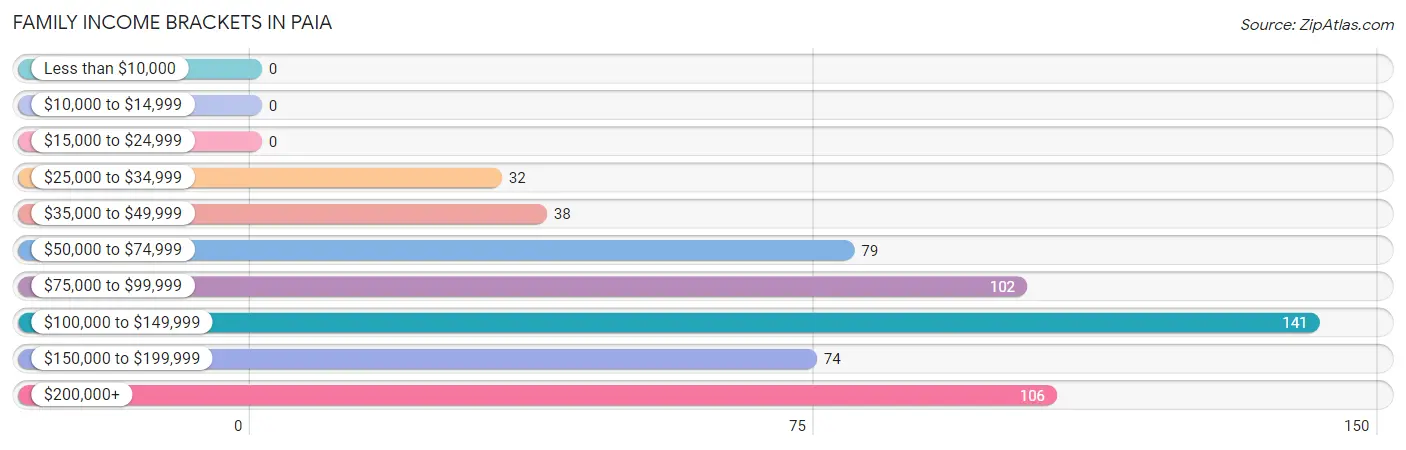
| Income Bracket | # Families | % Families |
| Less than $10,000 | 0 | 0.0% |
| $10,000 to $14,999 | 0 | 0.0% |
| $15,000 to $24,999 | 0 | 0.0% |
| $25,000 to $34,999 | 32 | 5.6% |
| $35,000 to $49,999 | 38 | 6.6% |
| $50,000 to $74,999 | 79 | 13.8% |
| $75,000 to $99,999 | 102 | 17.8% |
| $100,000 to $149,999 | 141 | 24.7% |
| $150,000 to $199,999 | 74 | 12.9% |
| $200,000+ | 106 | 18.5% |
Family Income by Famaliy Size in Paia
6-person families (31 | 5.4%) account for the highest median family income in Paia with $201,250 per family, while 2-person families (298 | 52.1%) have the highest median income of $57,188 per family member.
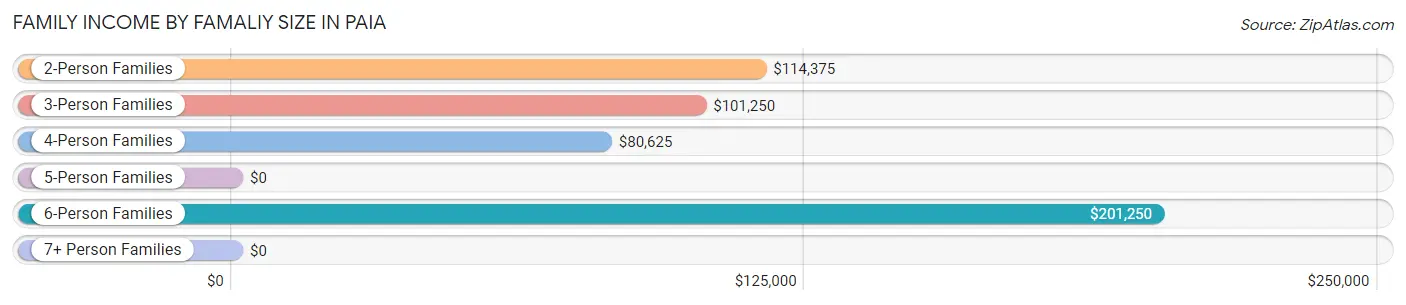
| Income Bracket | # Families | Median Income |
| 2-Person Families | 298 (52.1%) | $114,375 |
| 3-Person Families | 82 (14.3%) | $101,250 |
| 4-Person Families | 79 (13.8%) | $80,625 |
| 5-Person Families | 13 (2.3%) | $0 |
| 6-Person Families | 31 (5.4%) | $201,250 |
| 7+ Person Families | 69 (12.1%) | $0 |
| Total | 572 (100.0%) | $122,821 |
Family Income by Number of Earners in Paia
The median family income in Paia is $122,821, with families comprising 2 earners (249) having the highest median family income of $138,750, while families with no earners (47) have the lowest median family income of $76,023, accounting for 43.5% and 8.2% of families, respectively.
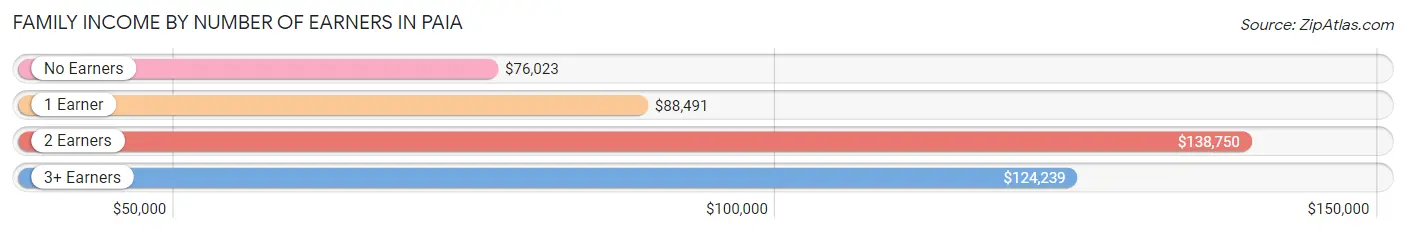
| Number of Earners | # Families | Median Income |
| No Earners | 47 (8.2%) | $76,023 |
| 1 Earner | 162 (28.3%) | $88,491 |
| 2 Earners | 249 (43.5%) | $138,750 |
| 3+ Earners | 114 (19.9%) | $124,239 |
| Total | 572 (100.0%) | $122,821 |
Household Income in Paia
Household Income Brackets in Paia
With 184 households falling in the category, the $100,000 to $149,999 income range is the most frequent in Paia, accounting for 23.0% of all households. In contrast, only 15 households (1.9%) fall into the $15,000 to $24,999 income bracket, making it the least populous group.
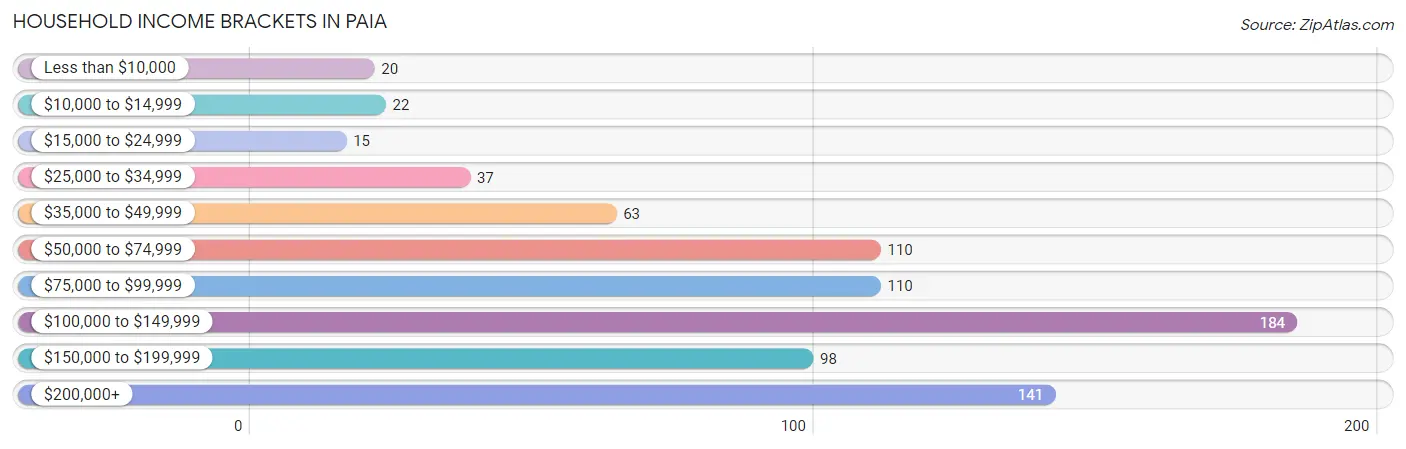
| Income Bracket | # Households | % Households |
| Less than $10,000 | 20 | 2.5% |
| $10,000 to $14,999 | 22 | 2.8% |
| $15,000 to $24,999 | 15 | 1.9% |
| $25,000 to $34,999 | 37 | 4.6% |
| $35,000 to $49,999 | 63 | 7.9% |
| $50,000 to $74,999 | 110 | 13.8% |
| $75,000 to $99,999 | 110 | 13.8% |
| $100,000 to $149,999 | 184 | 23.0% |
| $150,000 to $199,999 | 98 | 12.3% |
| $200,000+ | 141 | 17.6% |
Household Income by Householder Age in Paia
The median household income in Paia is $113,750, with the highest median household income of $122,645 found in the 25 to 44 years age bracket for the primary householder. A total of 222 households (27.8%) fall into this category. Meanwhile, the 15 to 24 years age bracket for the primary householder has the lowest median household income of $0, with 20 households (2.5%) in this group.
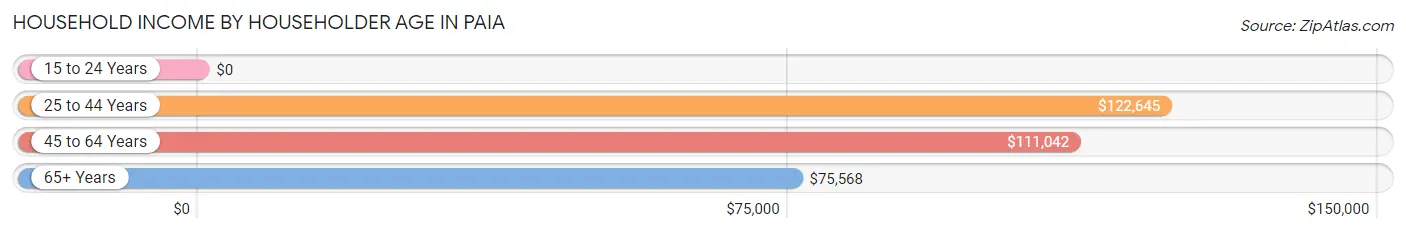
| Income Bracket | # Households | Median Income |
| 15 to 24 Years | 20 (2.5%) | $0 |
| 25 to 44 Years | 222 (27.8%) | $122,645 |
| 45 to 64 Years | 355 (44.4%) | $111,042 |
| 65+ Years | 203 (25.4%) | $75,568 |
| Total | 800 (100.0%) | $113,750 |
Poverty in Paia
Income Below Poverty by Sex and Age in Paia
With 10.0% poverty level for males and 6.9% for females among the residents of Paia, 18 to 24 year old males and 18 to 24 year old females are the most vulnerable to poverty, with 26 males (26.0%) and 32 females (23.7%) in their respective age groups living below the poverty level.
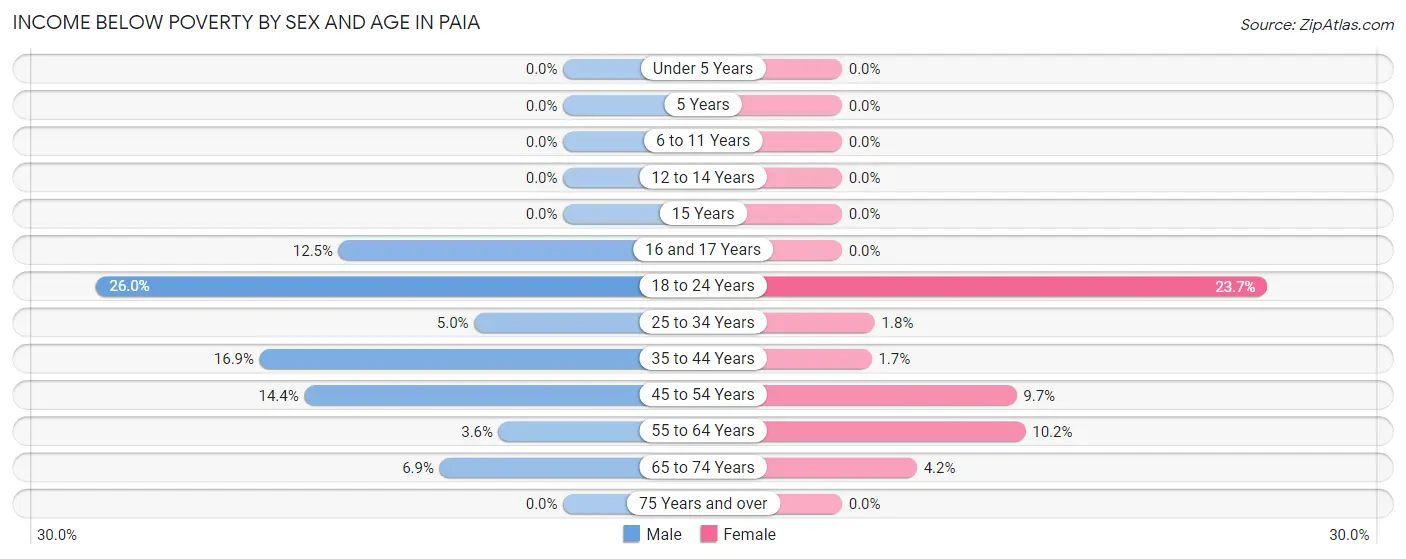
| Age Bracket | Male | Female |
| Under 5 Years | 0 (0.0%) | 0 (0.0%) |
| 5 Years | 0 (0.0%) | 0 (0.0%) |
| 6 to 11 Years | 0 (0.0%) | 0 (0.0%) |
| 12 to 14 Years | 0 (0.0%) | 0 (0.0%) |
| 15 Years | 0 (0.0%) | 0 (0.0%) |
| 16 and 17 Years | 4 (12.5%) | 0 (0.0%) |
| 18 to 24 Years | 26 (26.0%) | 32 (23.7%) |
| 25 to 34 Years | 5 (5.0%) | 2 (1.8%) |
| 35 to 44 Years | 36 (16.9%) | 3 (1.7%) |
| 45 to 54 Years | 32 (14.4%) | 14 (9.7%) |
| 55 to 64 Years | 6 (3.6%) | 14 (10.2%) |
| 65 to 74 Years | 11 (6.9%) | 5 (4.2%) |
| 75 Years and over | 0 (0.0%) | 0 (0.0%) |
| Total | 120 (10.0%) | 70 (6.9%) |
Income Above Poverty by Sex and Age in Paia
According to the poverty statistics in Paia, males aged under 5 years and females aged under 5 years are the age groups that are most secure financially, with 100.0% of males and 100.0% of females in these age groups living above the poverty line.
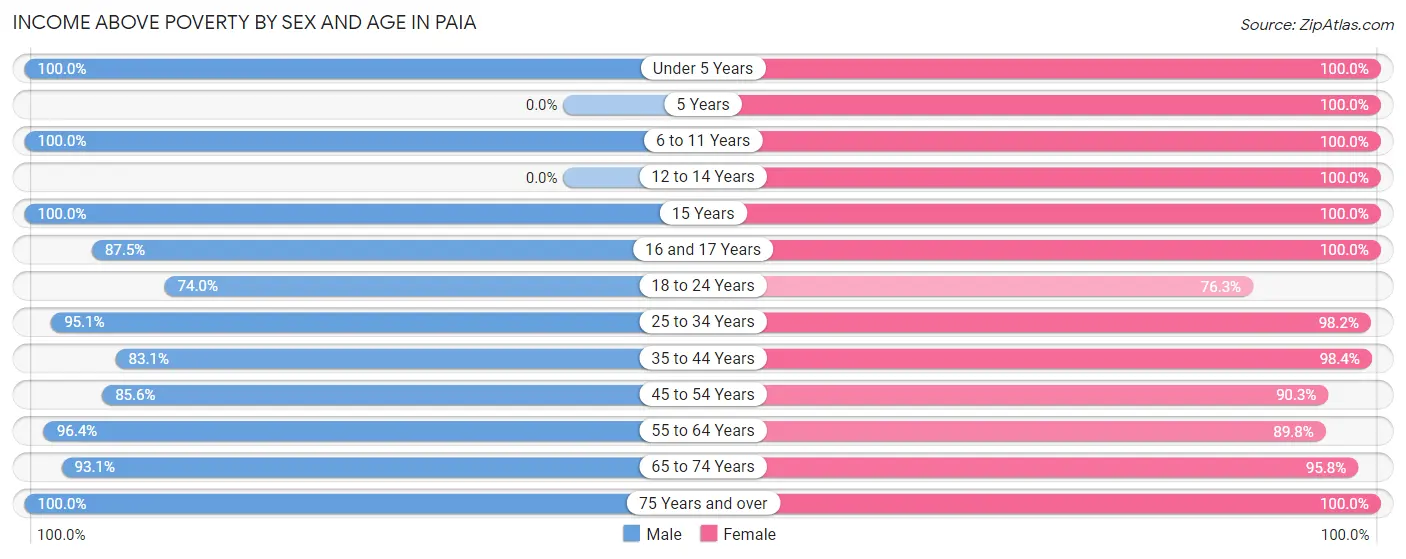
| Age Bracket | Male | Female |
| Under 5 Years | 43 (100.0%) | 51 (100.0%) |
| 5 Years | 0 (0.0%) | 5 (100.0%) |
| 6 to 11 Years | 66 (100.0%) | 68 (100.0%) |
| 12 to 14 Years | 0 (0.0%) | 11 (100.0%) |
| 15 Years | 49 (100.0%) | 17 (100.0%) |
| 16 and 17 Years | 28 (87.5%) | 9 (100.0%) |
| 18 to 24 Years | 74 (74.0%) | 103 (76.3%) |
| 25 to 34 Years | 96 (95.1%) | 107 (98.2%) |
| 35 to 44 Years | 177 (83.1%) | 179 (98.4%) |
| 45 to 54 Years | 190 (85.6%) | 130 (90.3%) |
| 55 to 64 Years | 161 (96.4%) | 123 (89.8%) |
| 65 to 74 Years | 149 (93.1%) | 115 (95.8%) |
| 75 Years and over | 42 (100.0%) | 28 (100.0%) |
| Total | 1,075 (90.0%) | 946 (93.1%) |
Income Below Poverty Among Married-Couple Families in Paia
The poverty statistics for married-couple families in Paia show that 3.0% or 11 of the total 366 families live below the poverty line. Families with no children have the highest poverty rate of 4.7%, comprising of 11 families. On the other hand, families with 1 or 2 children have the lowest poverty rate of 0.0%, which includes 0 families.
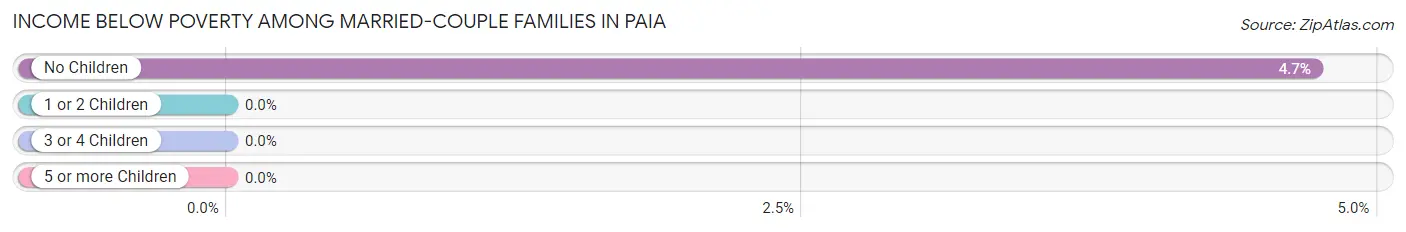
| Children | Above Poverty | Below Poverty |
| No Children | 222 (95.3%) | 11 (4.7%) |
| 1 or 2 Children | 64 (100.0%) | 0 (0.0%) |
| 3 or 4 Children | 69 (100.0%) | 0 (0.0%) |
| 5 or more Children | 0 (0.0%) | 0 (0.0%) |
| Total | 355 (97.0%) | 11 (3.0%) |
Income Below Poverty Among Single-Parent Households in Paia
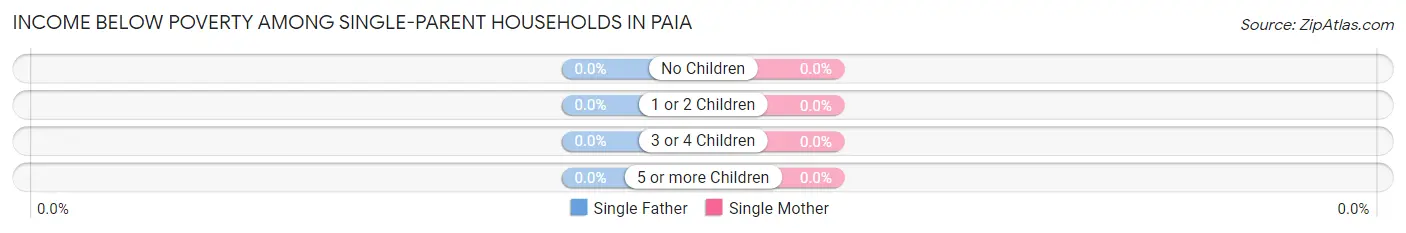
| Children | Single Father | Single Mother |
| No Children | 0 (0.0%) | 0 (0.0%) |
| 1 or 2 Children | 0 (0.0%) | 0 (0.0%) |
| 3 or 4 Children | 0 (0.0%) | 0 (0.0%) |
| 5 or more Children | 0 (0.0%) | 0 (0.0%) |
| Total | 0 (0.0%) | 0 (0.0%) |
Income Below Poverty Among Married-Couple vs Single-Parent Households in Paia
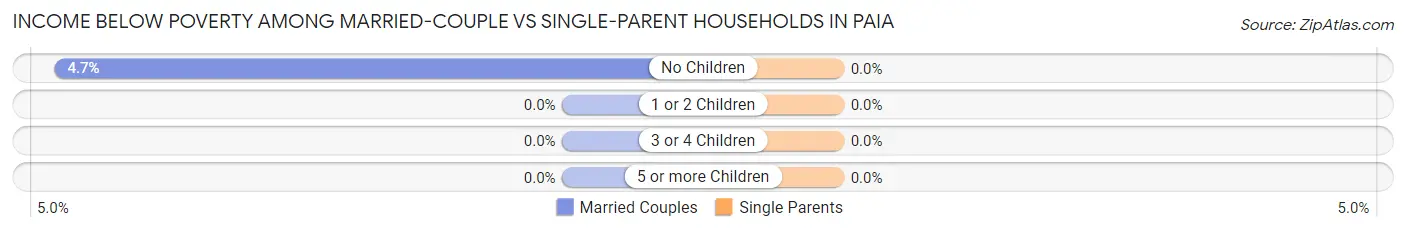
| Children | Married-Couple Families | Single-Parent Households |
| No Children | 11 (4.7%) | 0 (0.0%) |
| 1 or 2 Children | 0 (0.0%) | 0 (0.0%) |
| 3 or 4 Children | 0 (0.0%) | 0 (0.0%) |
| 5 or more Children | 0 (0.0%) | 0 (0.0%) |
| Total | 11 (3.0%) | 0 (0.0%) |
Employment Characteristics in Paia
Employment by Class of Employer in Paia
Among the 1,235 employed individuals in Paia, private company employees (715 | 57.9%), self-employed (incorporated) (173 | 14.0%), and self-employed (not incorporated) (152 | 12.3%) make up the most common classes of employment.
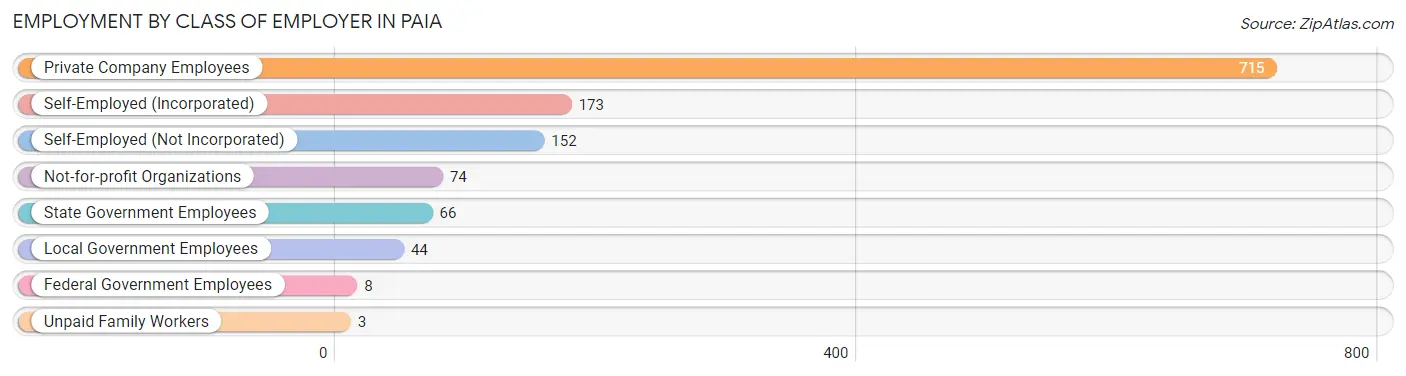
| Employer Class | # Employees | % Employees |
| Private Company Employees | 715 | 57.9% |
| Self-Employed (Incorporated) | 173 | 14.0% |
| Self-Employed (Not Incorporated) | 152 | 12.3% |
| Not-for-profit Organizations | 74 | 6.0% |
| Local Government Employees | 44 | 3.6% |
| State Government Employees | 66 | 5.3% |
| Federal Government Employees | 8 | 0.6% |
| Unpaid Family Workers | 3 | 0.2% |
| Total | 1,235 | 100.0% |
Employment Status by Age in Paia
According to the labor force statistics for Paia, out of the total population over 16 years of age (1,901), 76.0% or 1,445 individuals are in the labor force, with 12.9% or 186 of them unemployed. The age group with the highest labor force participation rate is 20 to 24 years, with 100.0% or 169 individuals in the labor force. Within the labor force, the 16 to 19 years age range has the highest percentage of unemployed individuals, with 53.7% or 36 of them being unemployed.
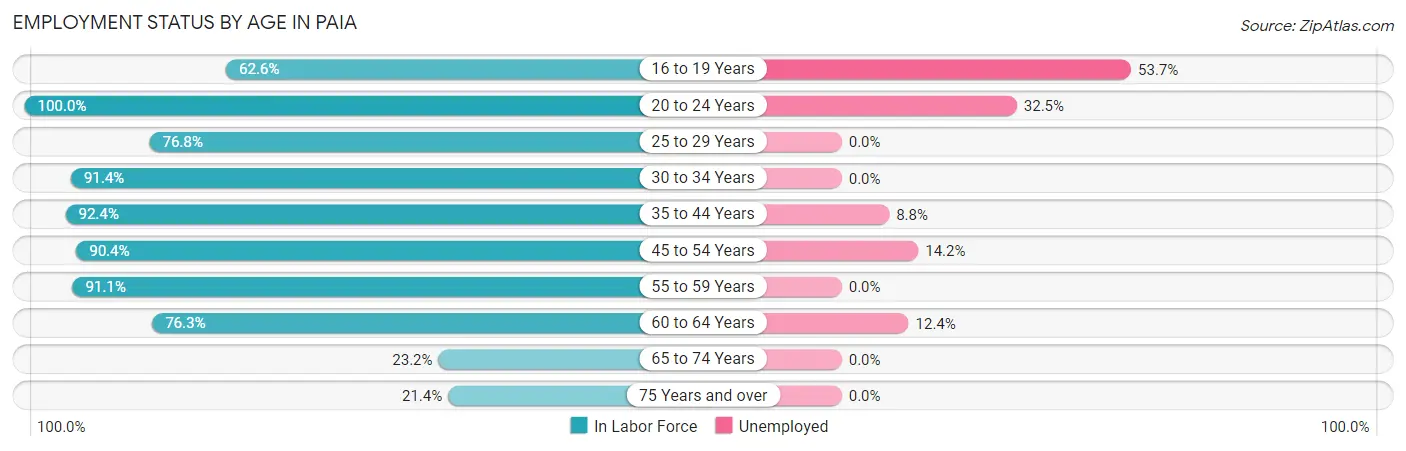
| Age Bracket | In Labor Force | Unemployed |
| 16 to 19 Years | 67 (62.6%) | 36 (53.7%) |
| 20 to 24 Years | 169 (100.0%) | 55 (32.5%) |
| 25 to 29 Years | 63 (76.8%) | 0 (0.0%) |
| 30 to 34 Years | 117 (91.4%) | 0 (0.0%) |
| 35 to 44 Years | 365 (92.4%) | 32 (8.8%) |
| 45 to 54 Years | 331 (90.4%) | 47 (14.2%) |
| 55 to 59 Years | 123 (91.1%) | 0 (0.0%) |
| 60 to 64 Years | 129 (76.3%) | 16 (12.4%) |
| 65 to 74 Years | 65 (23.2%) | 0 (0.0%) |
| 75 Years and over | 15 (21.4%) | 0 (0.0%) |
| Total | 1,445 (76.0%) | 186 (12.9%) |
Employment Status by Educational Attainment in Paia
According to labor force statistics for Paia, 88.5% of individuals (1,128) out of the total population between 25 and 64 years of age (1,275) are in the labor force, with 8.4% or 95 of them being unemployed. The group with the highest labor force participation rate are those with the educational attainment of bachelor's degree or higher, with 91.6% or 406 individuals in the labor force. Within the labor force, individuals with college / associate degree education have the highest percentage of unemployment, with 12.5% or 42 of them being unemployed.
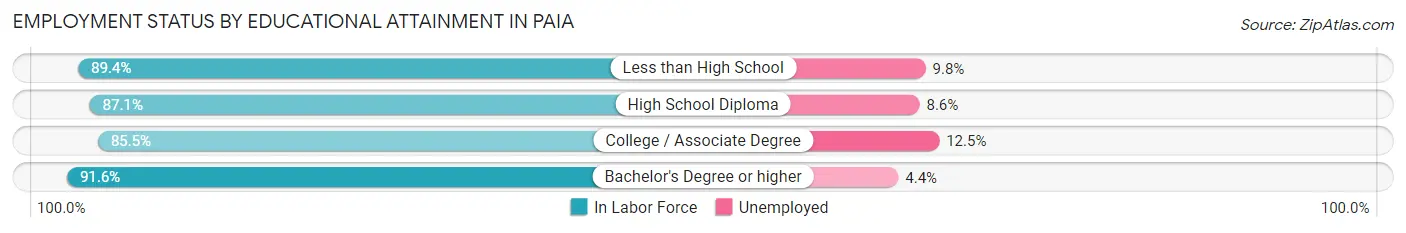
| Educational Attainment | In Labor Force | Unemployed |
| Less than High School | 143 (89.4%) | 16 (9.8%) |
| High School Diploma | 243 (87.1%) | 24 (8.6%) |
| College / Associate Degree | 336 (85.5%) | 49 (12.5%) |
| Bachelor's Degree or higher | 406 (91.6%) | 19 (4.4%) |
| Total | 1,128 (88.5%) | 107 (8.4%) |
Employment Occupations by Sex in Paia
Management, Business, Science and Arts Occupations
The most common Management, Business, Science and Arts occupations in Paia are Management (211 | 16.8%), Community & Social Service (68 | 5.4%), Health Diagnosing & Treating (54 | 4.3%), Education Instruction & Library (47 | 3.7%), and Health Technologists (47 | 3.7%).
Management, Business, Science and Arts Occupations by Sex
Within the Management, Business, Science and Arts occupations in Paia, the most male-oriented occupations are Computers, Engineering & Science (100.0%), Computers & Mathematics (100.0%), and Education, Arts & Media (100.0%), while the most female-oriented occupations are Business & Financial (100.0%), Health Diagnosing & Treating (79.6%), and Health Technologists (76.6%).
| Occupation | Male | Female |
| Management | 123 (58.3%) | 88 (41.7%) |
| Business & Financial | 0 (0.0%) | 11 (100.0%) |
| Computers, Engineering & Science | 8 (100.0%) | 0 (0.0%) |
| Computers & Mathematics | 8 (100.0%) | 0 (0.0%) |
| Architecture & Engineering | 0 (0.0%) | 0 (0.0%) |
| Life, Physical & Social Science | 0 (0.0%) | 0 (0.0%) |
| Community & Social Service | 32 (47.1%) | 36 (52.9%) |
| Education, Arts & Media | 11 (100.0%) | 0 (0.0%) |
| Legal Services & Support | 0 (0.0%) | 0 (0.0%) |
| Education Instruction & Library | 17 (36.2%) | 30 (63.8%) |
| Arts, Media & Entertainment | 4 (40.0%) | 6 (60.0%) |
| Health Diagnosing & Treating | 11 (20.4%) | 43 (79.6%) |
| Health Technologists | 11 (23.4%) | 36 (76.6%) |
| Total (Category) | 174 (49.4%) | 178 (50.6%) |
| Total (Overall) | 660 (52.5%) | 598 (47.5%) |
Services Occupations
The most common Services occupations in Paia are Food Preparation & Serving (86 | 6.8%), Security & Protection (50 | 4.0%), Healthcare Support (46 | 3.7%), Firefighting & Prevention (42 | 3.3%), and Cleaning & Maintenance (33 | 2.6%).
Services Occupations by Sex
Within the Services occupations in Paia, the most male-oriented occupations are Law Enforcement (100.0%), Personal Care & Service (100.0%), and Security & Protection (90.0%), while the most female-oriented occupations are Healthcare Support (100.0%), Food Preparation & Serving (68.6%), and Cleaning & Maintenance (63.6%).
| Occupation | Male | Female |
| Healthcare Support | 0 (0.0%) | 46 (100.0%) |
| Security & Protection | 45 (90.0%) | 5 (10.0%) |
| Firefighting & Prevention | 37 (88.1%) | 5 (11.9%) |
| Law Enforcement | 8 (100.0%) | 0 (0.0%) |
| Food Preparation & Serving | 27 (31.4%) | 59 (68.6%) |
| Cleaning & Maintenance | 12 (36.4%) | 21 (63.6%) |
| Personal Care & Service | 24 (100.0%) | 0 (0.0%) |
| Total (Category) | 108 (45.2%) | 131 (54.8%) |
| Total (Overall) | 660 (52.5%) | 598 (47.5%) |
Sales and Office Occupations
The most common Sales and Office occupations in Paia are Sales & Related (177 | 14.1%), and Office & Administration (159 | 12.6%).
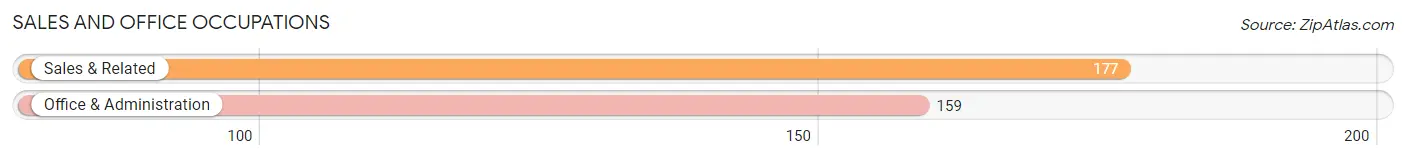
Sales and Office Occupations by Sex
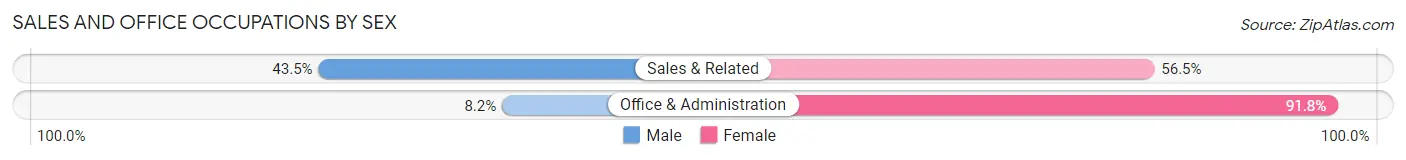
| Occupation | Male | Female |
| Sales & Related | 77 (43.5%) | 100 (56.5%) |
| Office & Administration | 13 (8.2%) | 146 (91.8%) |
| Total (Category) | 90 (26.8%) | 246 (73.2%) |
| Total (Overall) | 660 (52.5%) | 598 (47.5%) |
Natural Resources, Construction and Maintenance Occupations
The most common Natural Resources, Construction and Maintenance occupations in Paia are Construction & Extraction (116 | 9.2%), Installation, Maintenance & Repair (31 | 2.5%), and Farming, Fishing & Forestry (11 | 0.9%).
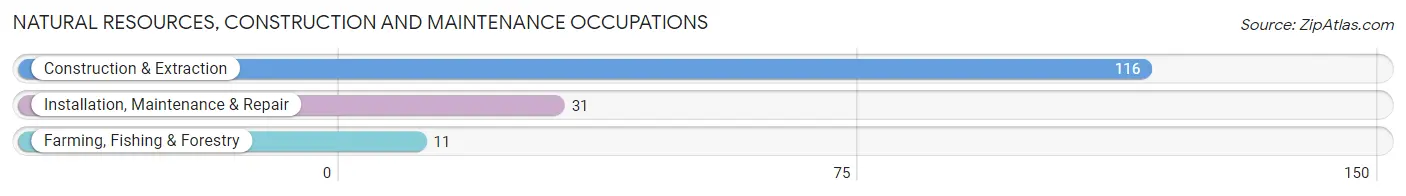
Natural Resources, Construction and Maintenance Occupations by Sex
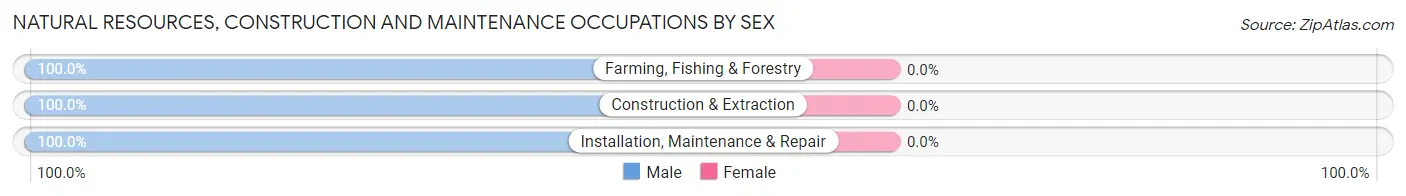
| Occupation | Male | Female |
| Farming, Fishing & Forestry | 11 (100.0%) | 0 (0.0%) |
| Construction & Extraction | 116 (100.0%) | 0 (0.0%) |
| Installation, Maintenance & Repair | 31 (100.0%) | 0 (0.0%) |
| Total (Category) | 158 (100.0%) | 0 (0.0%) |
| Total (Overall) | 660 (52.5%) | 598 (47.5%) |
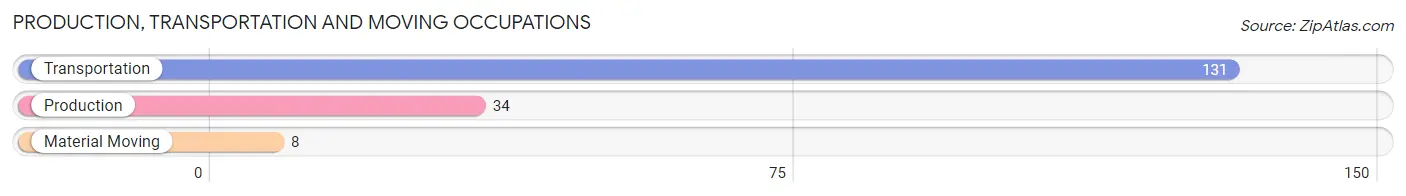
Production, Transportation and Moving Occupations
The most common Production, Transportation and Moving occupations in Paia are Transportation (131 | 10.4%), Production (34 | 2.7%), and Material Moving (8 | 0.6%).
Production, Transportation and Moving Occupations by Sex
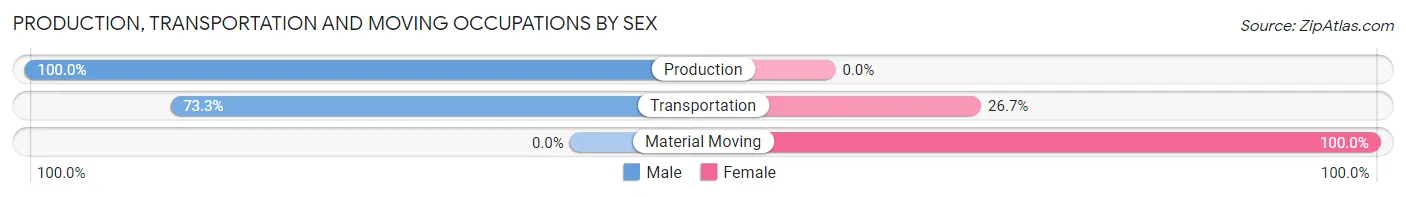
| Occupation | Male | Female |
| Production | 34 (100.0%) | 0 (0.0%) |
| Transportation | 96 (73.3%) | 35 (26.7%) |
| Material Moving | 0 (0.0%) | 8 (100.0%) |
| Total (Category) | 130 (75.1%) | 43 (24.9%) |
| Total (Overall) | 660 (52.5%) | 598 (47.5%) |
Employment Industries by Sex in Paia
Employment Industries in Paia
The major employment industries in Paia include Real Estate, Rental & Leasing (160 | 12.7%), Retail Trade (155 | 12.3%), Accommodation & Food Services (144 | 11.5%), Health Care & Social Assistance (128 | 10.2%), and Construction (120 | 9.5%).
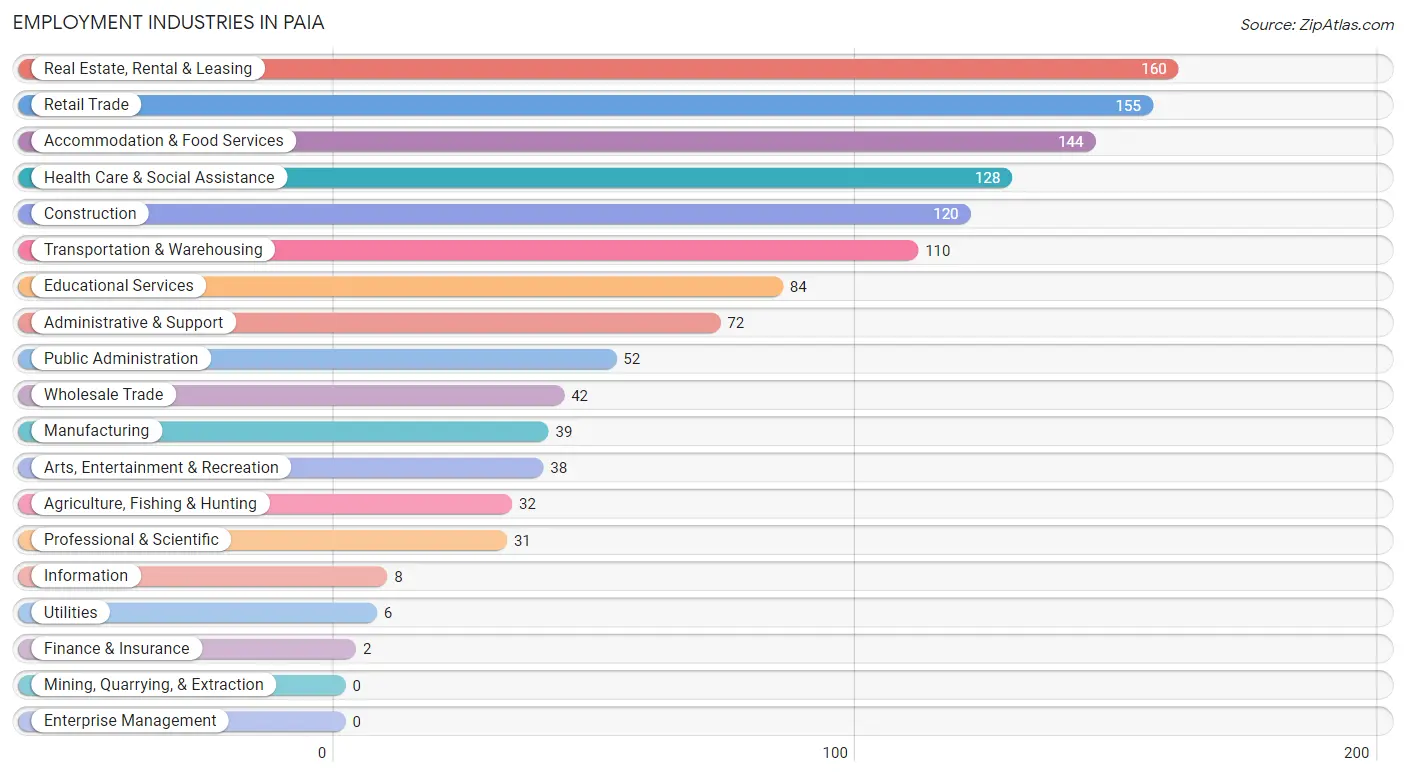
Employment Industries by Sex in Paia
The Paia industries that see more men than women are Agriculture, Fishing & Hunting (100.0%), Manufacturing (100.0%), and Utilities (100.0%), whereas the industries that tend to have a higher number of women are Wholesale Trade (100.0%), Information (100.0%), and Professional & Scientific (100.0%).
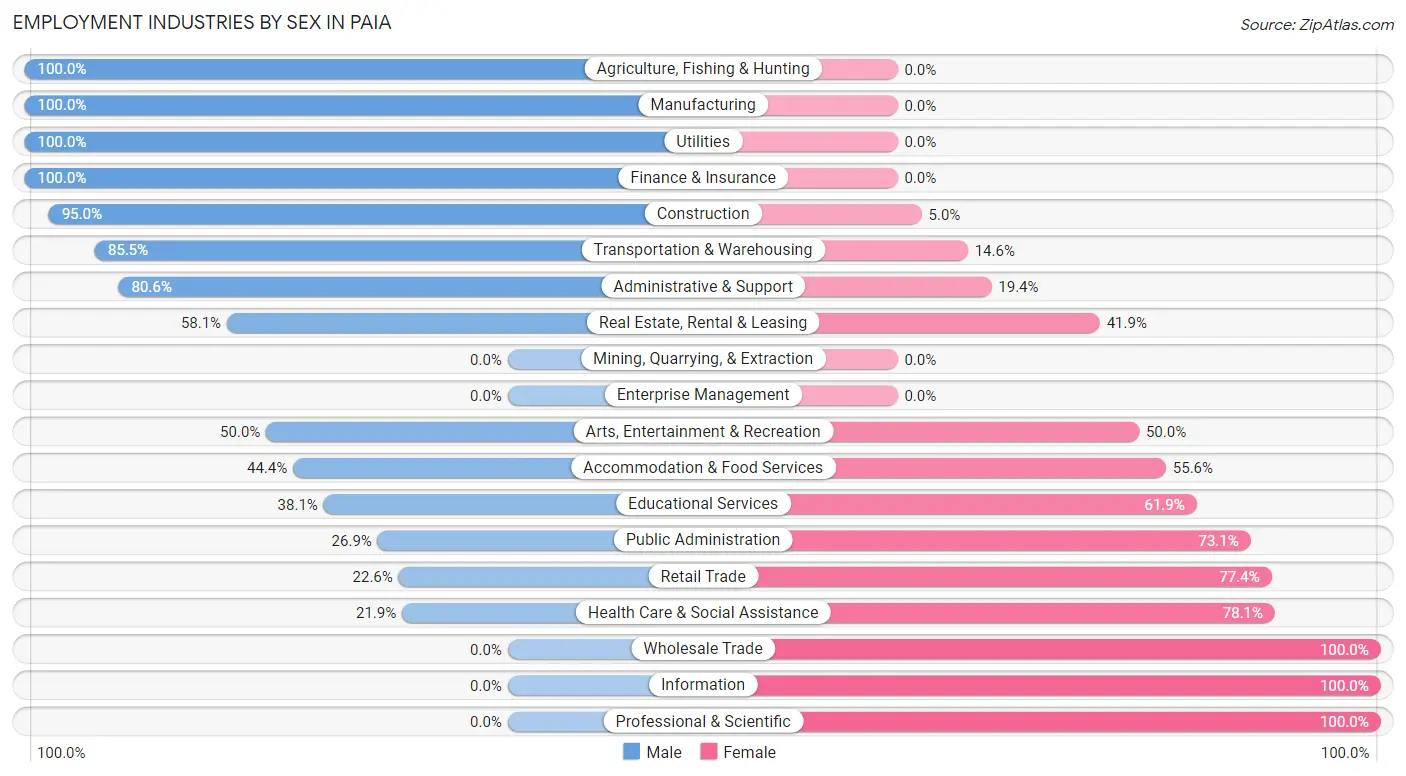
| Industry | Male | Female |
| Agriculture, Fishing & Hunting | 32 (100.0%) | 0 (0.0%) |
| Mining, Quarrying, & Extraction | 0 (0.0%) | 0 (0.0%) |
| Construction | 114 (95.0%) | 6 (5.0%) |
| Manufacturing | 39 (100.0%) | 0 (0.0%) |
| Wholesale Trade | 0 (0.0%) | 42 (100.0%) |
| Retail Trade | 35 (22.6%) | 120 (77.4%) |
| Transportation & Warehousing | 94 (85.5%) | 16 (14.5%) |
| Utilities | 6 (100.0%) | 0 (0.0%) |
| Information | 0 (0.0%) | 8 (100.0%) |
| Finance & Insurance | 2 (100.0%) | 0 (0.0%) |
| Real Estate, Rental & Leasing | 93 (58.1%) | 67 (41.9%) |
| Professional & Scientific | 0 (0.0%) | 31 (100.0%) |
| Enterprise Management | 0 (0.0%) | 0 (0.0%) |
| Administrative & Support | 58 (80.6%) | 14 (19.4%) |
| Educational Services | 32 (38.1%) | 52 (61.9%) |
| Health Care & Social Assistance | 28 (21.9%) | 100 (78.1%) |
| Arts, Entertainment & Recreation | 19 (50.0%) | 19 (50.0%) |
| Accommodation & Food Services | 64 (44.4%) | 80 (55.6%) |
| Public Administration | 14 (26.9%) | 38 (73.1%) |
| Total | 660 (52.5%) | 598 (47.5%) |
Education in Paia
School Enrollment in Paia
The most common levels of schooling among the 309 students in Paia are high school (133 | 43.0%), elementary school (129 | 41.7%), and college / undergraduate (26 | 8.4%).
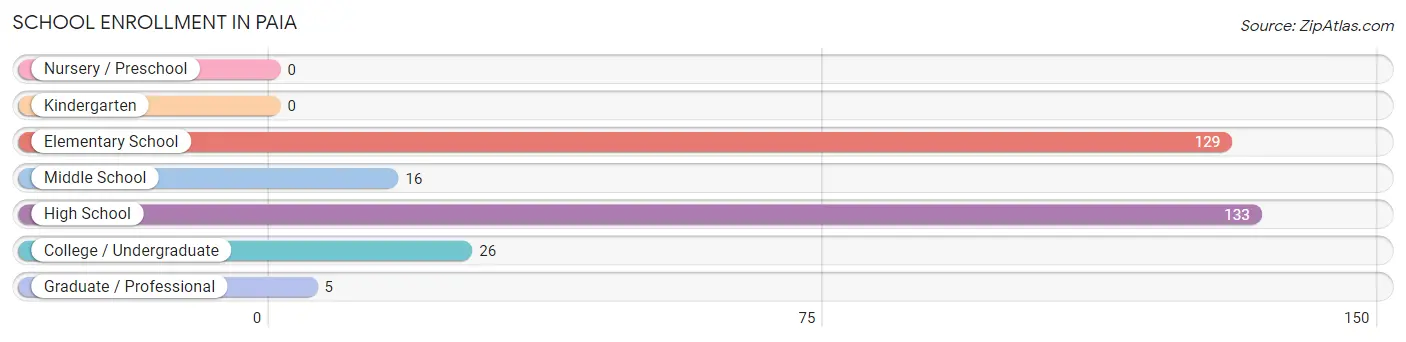
| School Level | # Students | % Students |
| Nursery / Preschool | 0 | 0.0% |
| Kindergarten | 0 | 0.0% |
| Elementary School | 129 | 41.7% |
| Middle School | 16 | 5.2% |
| High School | 133 | 43.0% |
| College / Undergraduate | 26 | 8.4% |
| Graduate / Professional | 5 | 1.6% |
| Total | 309 | 100.0% |
School Enrollment by Age by Funding Source in Paia
Out of a total of 309 students who are enrolled in schools in Paia, 65 (21.0%) attend a private institution, while the remaining 244 (79.0%) are enrolled in public schools. The age group of 18 to 19 year olds has the highest likelihood of being enrolled in private schools, with 19 (48.7% in the age bracket) enrolled. Conversely, the age group of 15 to 17 year olds has the lowest likelihood of being enrolled in a private school, with 107 (100.0% in the age bracket) attending a public institution.
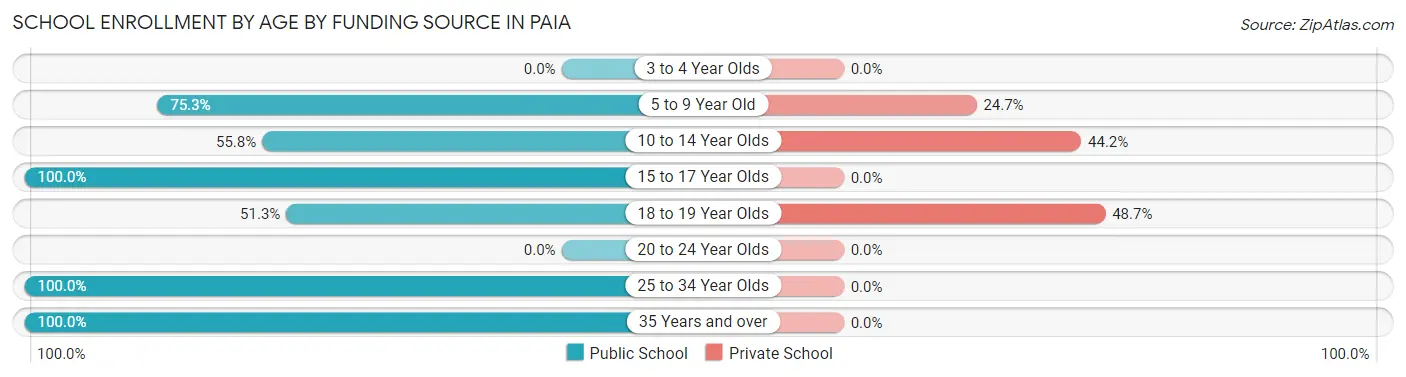
| Age Bracket | Public School | Private School |
| 3 to 4 Year Olds | 0 (0.0%) | 0 (0.0%) |
| 5 to 9 Year Old | 70 (75.3%) | 23 (24.7%) |
| 10 to 14 Year Olds | 29 (55.8%) | 23 (44.2%) |
| 15 to 17 Year Olds | 107 (100.0%) | 0 (0.0%) |
| 18 to 19 Year Olds | 20 (51.3%) | 19 (48.7%) |
| 20 to 24 Year Olds | 0 (0.0%) | 0 (0.0%) |
| 25 to 34 Year Olds | 6 (100.0%) | 0 (0.0%) |
| 35 Years and over | 12 (100.0%) | 0 (0.0%) |
| Total | 244 (79.0%) | 65 (21.0%) |
Educational Attainment by Field of Study in Paia
Social sciences (114 | 18.1%), business (95 | 15.1%), bio, nature & agricultural (76 | 12.0%), education (66 | 10.5%), and psychology (47 | 7.4%) are the most common fields of study among 631 individuals in Paia who have obtained a bachelor's degree or higher.
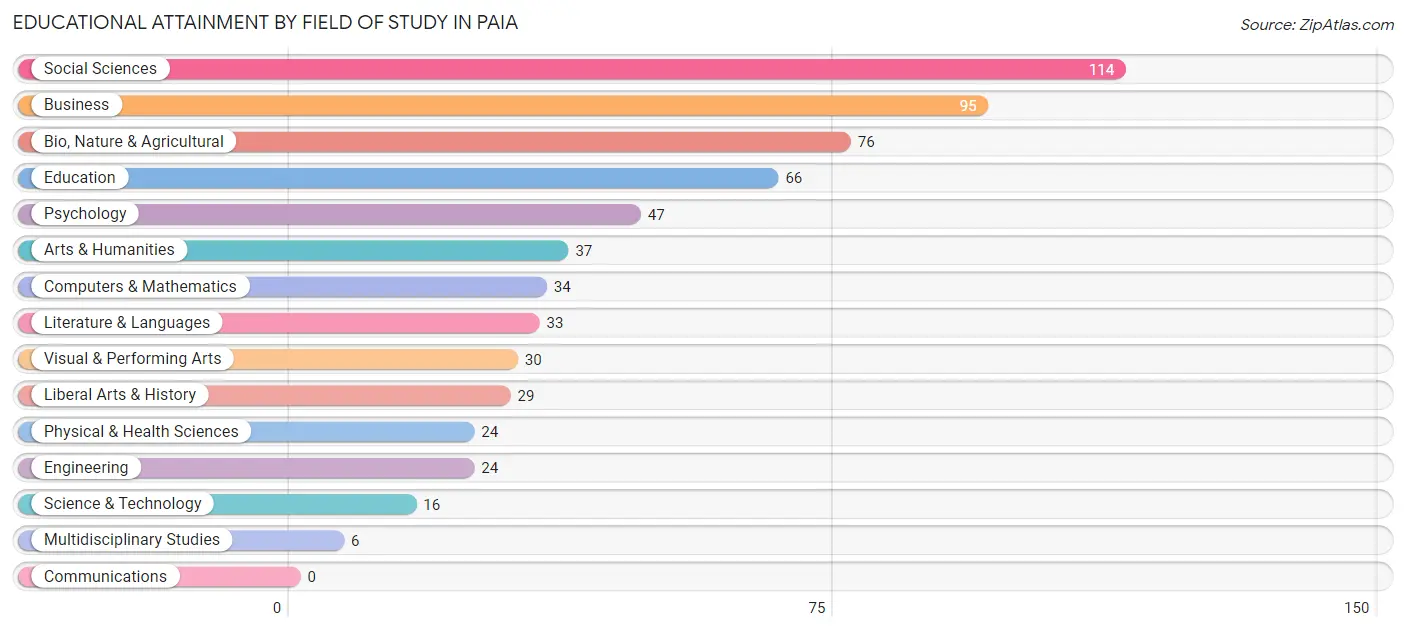
| Field of Study | # Graduates | % Graduates |
| Computers & Mathematics | 34 | 5.4% |
| Bio, Nature & Agricultural | 76 | 12.0% |
| Physical & Health Sciences | 24 | 3.8% |
| Psychology | 47 | 7.4% |
| Social Sciences | 114 | 18.1% |
| Engineering | 24 | 3.8% |
| Multidisciplinary Studies | 6 | 0.9% |
| Science & Technology | 16 | 2.5% |
| Business | 95 | 15.1% |
| Education | 66 | 10.5% |
| Literature & Languages | 33 | 5.2% |
| Liberal Arts & History | 29 | 4.6% |
| Visual & Performing Arts | 30 | 4.8% |
| Communications | 0 | 0.0% |
| Arts & Humanities | 37 | 5.9% |
| Total | 631 | 100.0% |
Transportation & Commute in Paia
Vehicle Availability by Sex in Paia
The most prevalent vehicle ownership categories in Paia are males with 2 vehicles (237, accounting for 37.0%) and females with 2 vehicles (229, making up 40.4%).
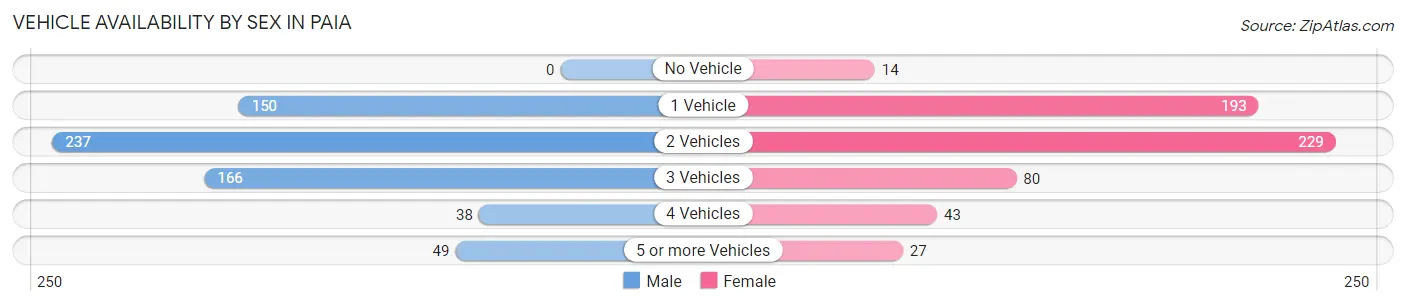
| Vehicles Available | Male | Female |
| No Vehicle | 0 (0.0%) | 14 (2.4%) |
| 1 Vehicle | 150 (23.4%) | 193 (32.9%) |
| 2 Vehicles | 237 (37.0%) | 229 (39.1%) |
| 3 Vehicles | 166 (25.9%) | 80 (13.7%) |
| 4 Vehicles | 38 (5.9%) | 43 (7.3%) |
| 5 or more Vehicles | 49 (7.7%) | 27 (4.6%) |
| Total | 640 (100.0%) | 586 (100.0%) |
Commute Time in Paia
The most frequently occuring commute durations in Paia are 25 to 29 minutes (223 commuters, 22.6%), 20 to 24 minutes (143 commuters, 14.5%), and 45 to 59 minutes (99 commuters, 10.1%).
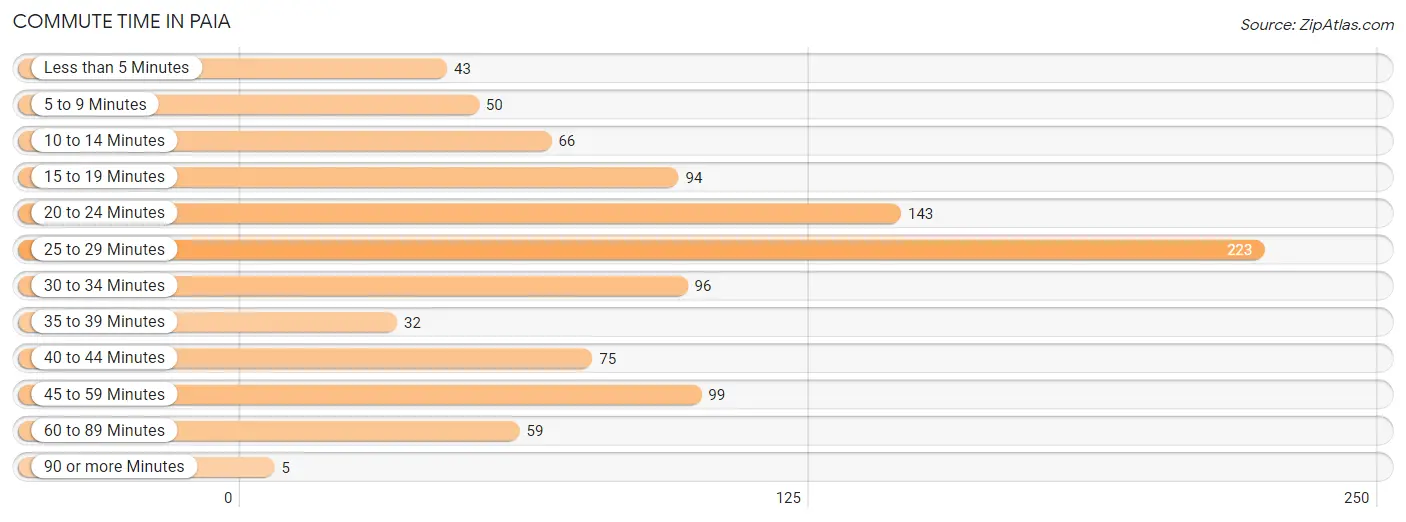
| Commute Time | # Commuters | % Commuters |
| Less than 5 Minutes | 43 | 4.4% |
| 5 to 9 Minutes | 50 | 5.1% |
| 10 to 14 Minutes | 66 | 6.7% |
| 15 to 19 Minutes | 94 | 9.5% |
| 20 to 24 Minutes | 143 | 14.5% |
| 25 to 29 Minutes | 223 | 22.6% |
| 30 to 34 Minutes | 96 | 9.8% |
| 35 to 39 Minutes | 32 | 3.3% |
| 40 to 44 Minutes | 75 | 7.6% |
| 45 to 59 Minutes | 99 | 10.1% |
| 60 to 89 Minutes | 59 | 6.0% |
| 90 or more Minutes | 5 | 0.5% |
Commute Time by Sex in Paia
The most common commute times in Paia are 25 to 29 minutes (146 commuters, 26.7%) for males and 25 to 29 minutes (77 commuters, 17.5%) for females.
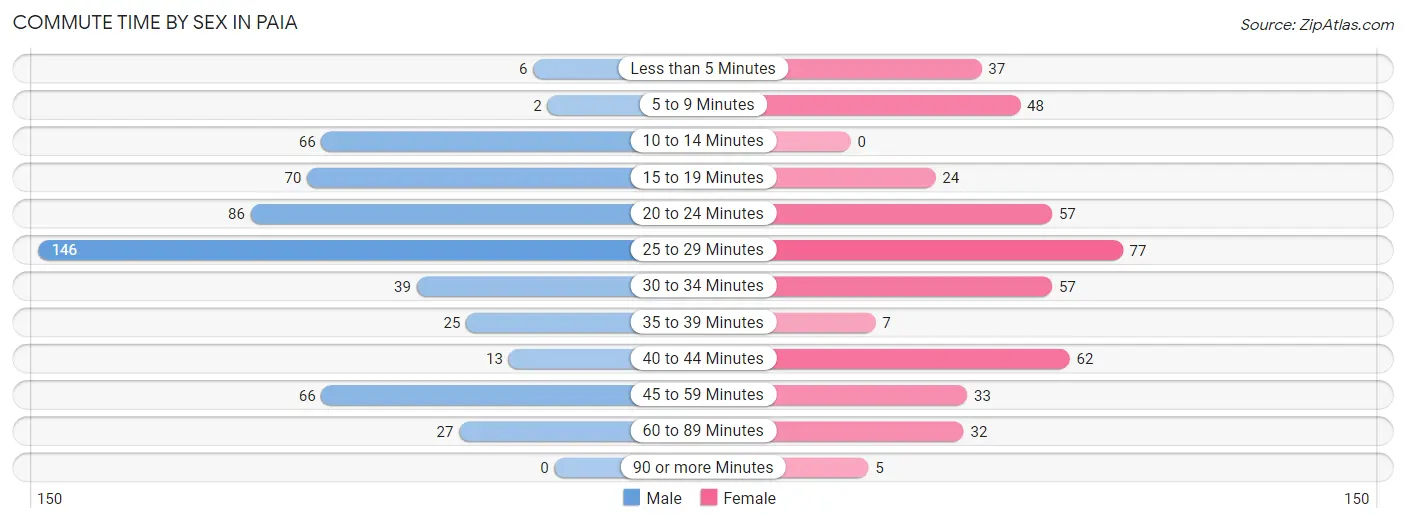
| Commute Time | Male | Female |
| Less than 5 Minutes | 6 (1.1%) | 37 (8.4%) |
| 5 to 9 Minutes | 2 (0.4%) | 48 (10.9%) |
| 10 to 14 Minutes | 66 (12.1%) | 0 (0.0%) |
| 15 to 19 Minutes | 70 (12.8%) | 24 (5.5%) |
| 20 to 24 Minutes | 86 (15.8%) | 57 (13.0%) |
| 25 to 29 Minutes | 146 (26.7%) | 77 (17.5%) |
| 30 to 34 Minutes | 39 (7.1%) | 57 (13.0%) |
| 35 to 39 Minutes | 25 (4.6%) | 7 (1.6%) |
| 40 to 44 Minutes | 13 (2.4%) | 62 (14.1%) |
| 45 to 59 Minutes | 66 (12.1%) | 33 (7.5%) |
| 60 to 89 Minutes | 27 (5.0%) | 32 (7.3%) |
| 90 or more Minutes | 0 (0.0%) | 5 (1.1%) |
Time of Departure to Work by Sex in Paia
The most frequent times of departure to work in Paia are 7:00 AM to 7:29 AM (123, 22.5%) for males and 7:00 AM to 7:29 AM (128, 29.2%) for females.
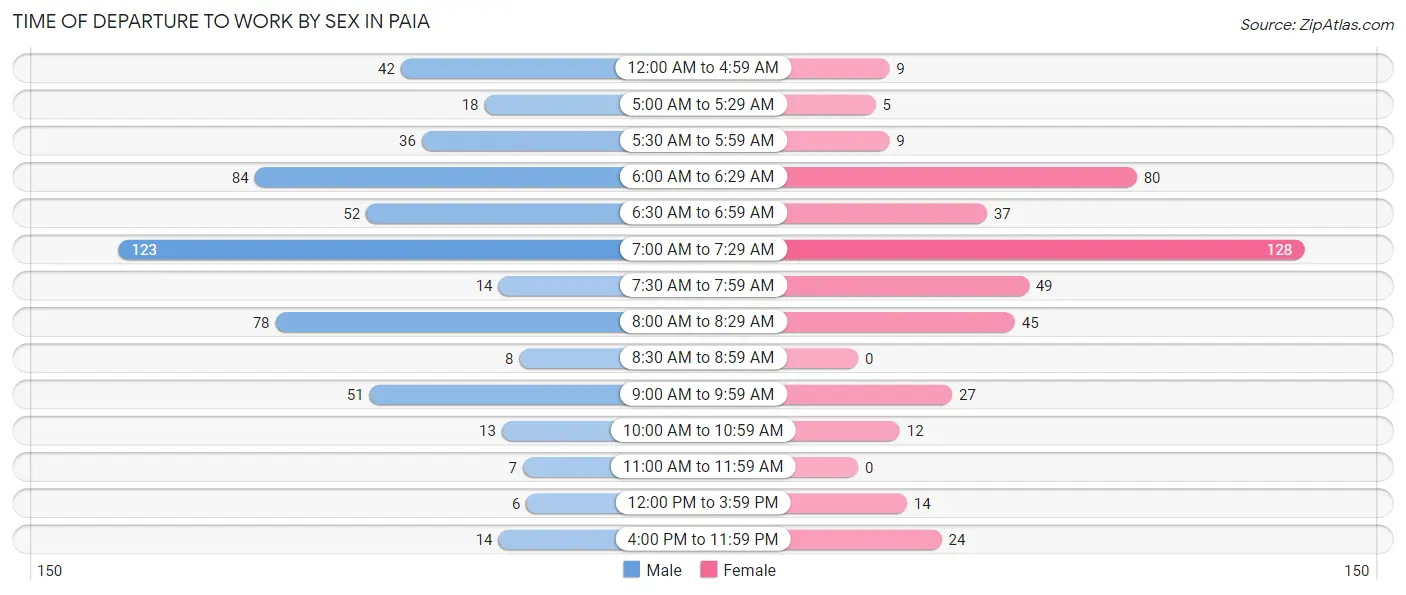
| Time of Departure | Male | Female |
| 12:00 AM to 4:59 AM | 42 (7.7%) | 9 (2.1%) |
| 5:00 AM to 5:29 AM | 18 (3.3%) | 5 (1.1%) |
| 5:30 AM to 5:59 AM | 36 (6.6%) | 9 (2.1%) |
| 6:00 AM to 6:29 AM | 84 (15.4%) | 80 (18.2%) |
| 6:30 AM to 6:59 AM | 52 (9.5%) | 37 (8.4%) |
| 7:00 AM to 7:29 AM | 123 (22.5%) | 128 (29.2%) |
| 7:30 AM to 7:59 AM | 14 (2.6%) | 49 (11.2%) |
| 8:00 AM to 8:29 AM | 78 (14.3%) | 45 (10.2%) |
| 8:30 AM to 8:59 AM | 8 (1.5%) | 0 (0.0%) |
| 9:00 AM to 9:59 AM | 51 (9.3%) | 27 (6.1%) |
| 10:00 AM to 10:59 AM | 13 (2.4%) | 12 (2.7%) |
| 11:00 AM to 11:59 AM | 7 (1.3%) | 0 (0.0%) |
| 12:00 PM to 3:59 PM | 6 (1.1%) | 14 (3.2%) |
| 4:00 PM to 11:59 PM | 14 (2.6%) | 24 (5.5%) |
| Total | 546 (100.0%) | 439 (100.0%) |
Housing Occupancy in Paia
Occupancy by Ownership in Paia
Of the total 800 dwellings in Paia, owner-occupied units account for 510 (63.7%), while renter-occupied units make up 290 (36.2%).
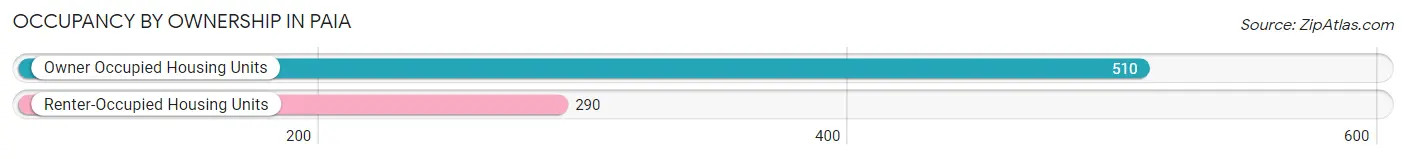
| Occupancy | # Housing Units | % Housing Units |
| Owner Occupied Housing Units | 510 | 63.7% |
| Renter-Occupied Housing Units | 290 | 36.2% |
| Total Occupied Housing Units | 800 | 100.0% |
Occupancy by Household Size in Paia
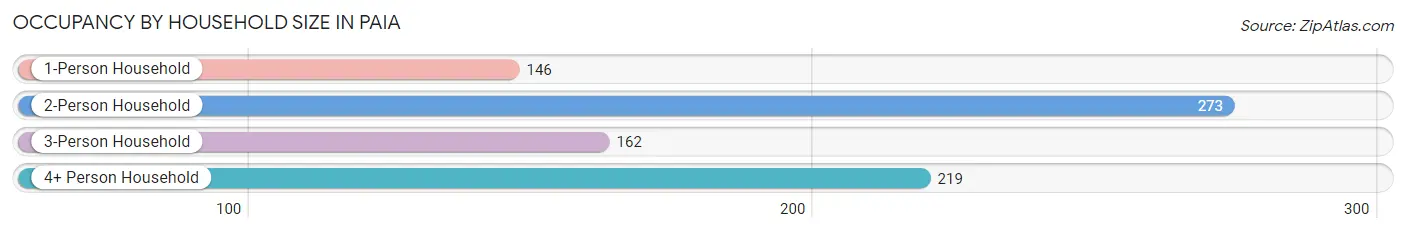
| Household Size | # Housing Units | % Housing Units |
| 1-Person Household | 146 | 18.2% |
| 2-Person Household | 273 | 34.1% |
| 3-Person Household | 162 | 20.3% |
| 4+ Person Household | 219 | 27.4% |
| Total Housing Units | 800 | 100.0% |
Occupancy by Ownership by Household Size in Paia
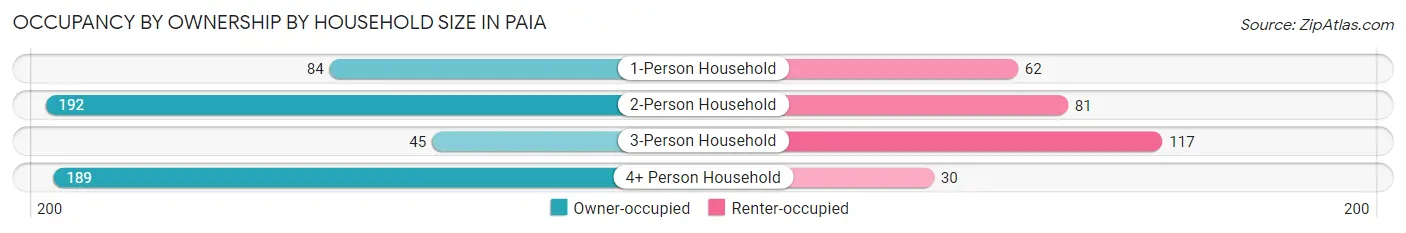
| Household Size | Owner-occupied | Renter-occupied |
| 1-Person Household | 84 (57.5%) | 62 (42.5%) |
| 2-Person Household | 192 (70.3%) | 81 (29.7%) |
| 3-Person Household | 45 (27.8%) | 117 (72.2%) |
| 4+ Person Household | 189 (86.3%) | 30 (13.7%) |
| Total Housing Units | 510 (63.7%) | 290 (36.2%) |
Occupancy by Educational Attainment in Paia
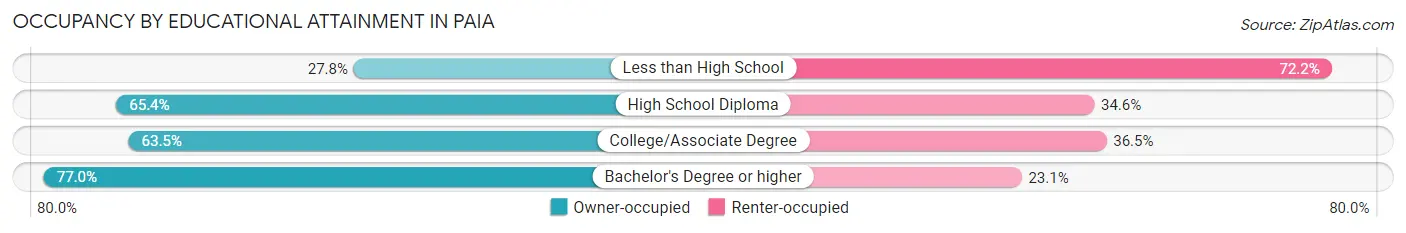
| Household Size | Owner-occupied | Renter-occupied |
| Less than High School | 30 (27.8%) | 78 (72.2%) |
| High School Diploma | 89 (65.4%) | 47 (34.6%) |
| College/Associate Degree | 174 (63.5%) | 100 (36.5%) |
| Bachelor's Degree or higher | 217 (76.9%) | 65 (23.1%) |
Occupancy by Age of Householder in Paia
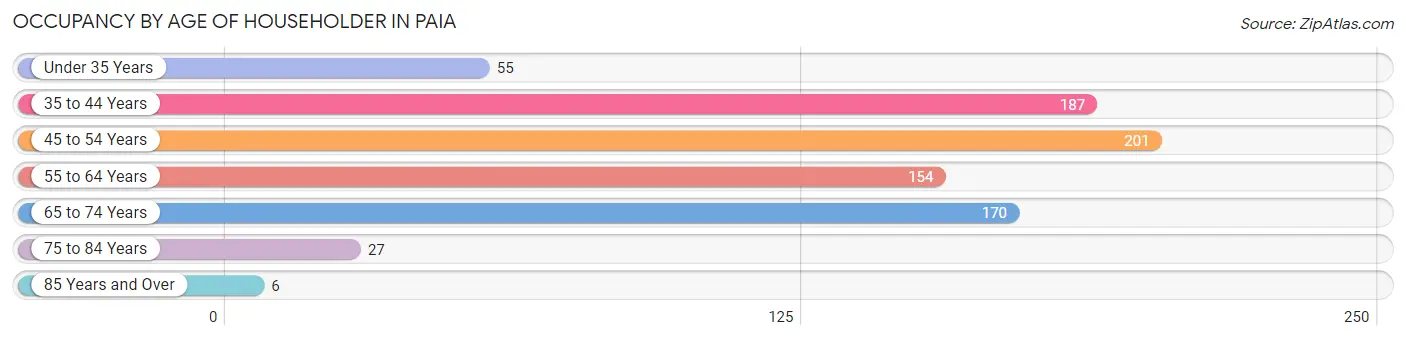
| Age Bracket | # Households | % Households |
| Under 35 Years | 55 | 6.9% |
| 35 to 44 Years | 187 | 23.4% |
| 45 to 54 Years | 201 | 25.1% |
| 55 to 64 Years | 154 | 19.3% |
| 65 to 74 Years | 170 | 21.2% |
| 75 to 84 Years | 27 | 3.4% |
| 85 Years and Over | 6 | 0.7% |
| Total | 800 | 100.0% |
Housing Finances in Paia
Median Income by Occupancy in Paia
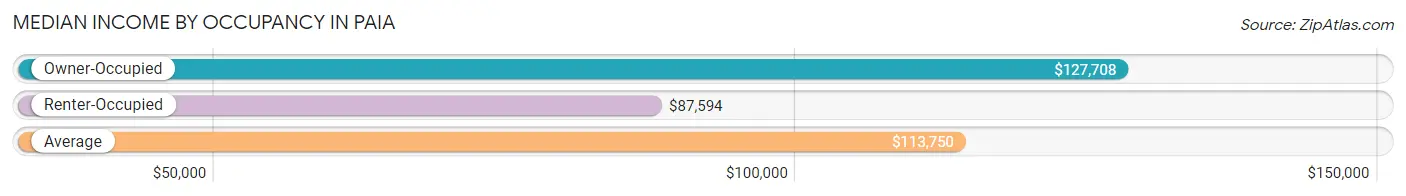
| Occupancy Type | # Households | Median Income |
| Owner-Occupied | 510 (63.7%) | $127,708 |
| Renter-Occupied | 290 (36.2%) | $87,594 |
| Average | 800 (100.0%) | $113,750 |
Occupancy by Householder Income Bracket in Paia
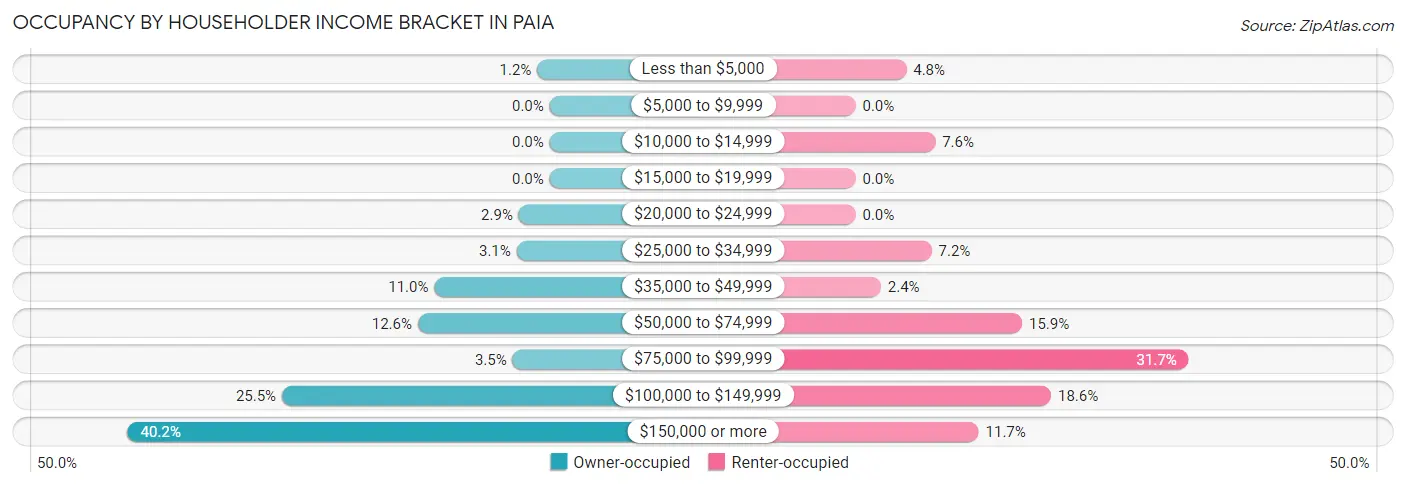
| Income Bracket | Owner-occupied | Renter-occupied |
| Less than $5,000 | 6 (1.2%) | 14 (4.8%) |
| $5,000 to $9,999 | 0 (0.0%) | 0 (0.0%) |
| $10,000 to $14,999 | 0 (0.0%) | 22 (7.6%) |
| $15,000 to $19,999 | 0 (0.0%) | 0 (0.0%) |
| $20,000 to $24,999 | 15 (2.9%) | 0 (0.0%) |
| $25,000 to $34,999 | 16 (3.1%) | 21 (7.2%) |
| $35,000 to $49,999 | 56 (11.0%) | 7 (2.4%) |
| $50,000 to $74,999 | 64 (12.6%) | 46 (15.9%) |
| $75,000 to $99,999 | 18 (3.5%) | 92 (31.7%) |
| $100,000 to $149,999 | 130 (25.5%) | 54 (18.6%) |
| $150,000 or more | 205 (40.2%) | 34 (11.7%) |
| Total | 510 (100.0%) | 290 (100.0%) |
Monthly Housing Cost Tiers in Paia
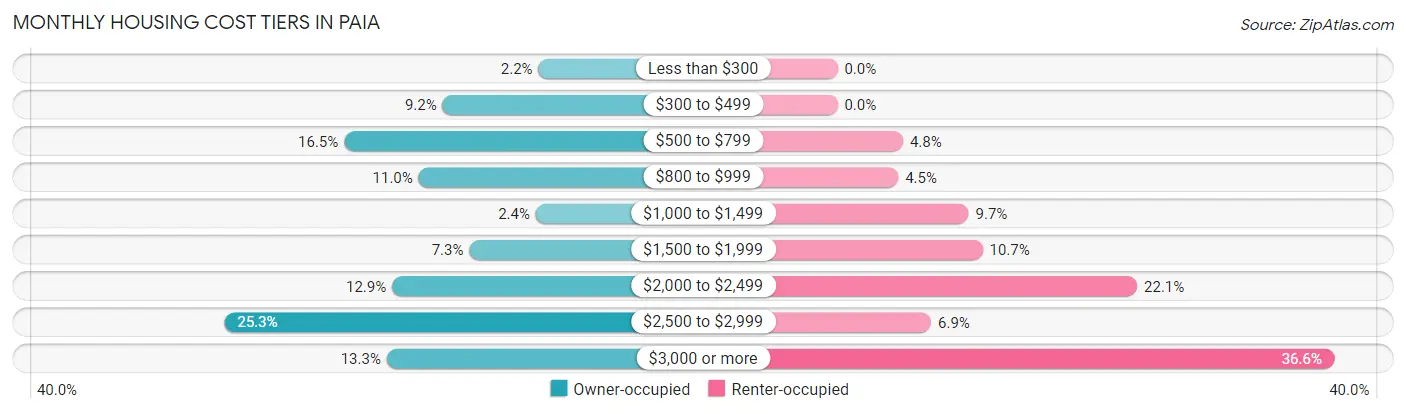
| Monthly Cost | Owner-occupied | Renter-occupied |
| Less than $300 | 11 (2.2%) | 0 (0.0%) |
| $300 to $499 | 47 (9.2%) | 0 (0.0%) |
| $500 to $799 | 84 (16.5%) | 14 (4.8%) |
| $800 to $999 | 56 (11.0%) | 13 (4.5%) |
| $1,000 to $1,499 | 12 (2.4%) | 28 (9.7%) |
| $1,500 to $1,999 | 37 (7.2%) | 31 (10.7%) |
| $2,000 to $2,499 | 66 (12.9%) | 64 (22.1%) |
| $2,500 to $2,999 | 129 (25.3%) | 20 (6.9%) |
| $3,000 or more | 68 (13.3%) | 106 (36.5%) |
| Total | 510 (100.0%) | 290 (100.0%) |
Physical Housing Characteristics in Paia
Housing Structures in Paia
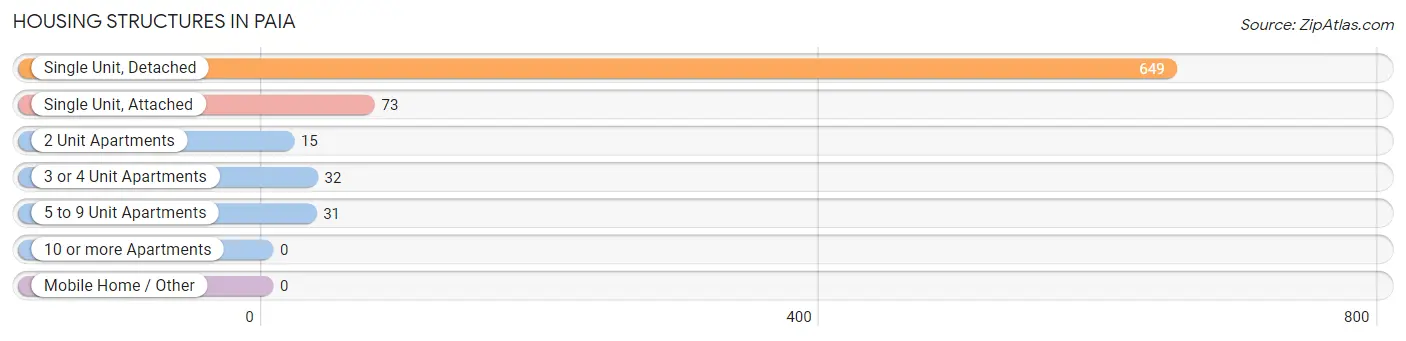
| Structure Type | # Housing Units | % Housing Units |
| Single Unit, Detached | 649 | 81.1% |
| Single Unit, Attached | 73 | 9.1% |
| 2 Unit Apartments | 15 | 1.9% |
| 3 or 4 Unit Apartments | 32 | 4.0% |
| 5 to 9 Unit Apartments | 31 | 3.9% |
| 10 or more Apartments | 0 | 0.0% |
| Mobile Home / Other | 0 | 0.0% |
| Total | 800 | 100.0% |
Housing Structures by Occupancy in Paia
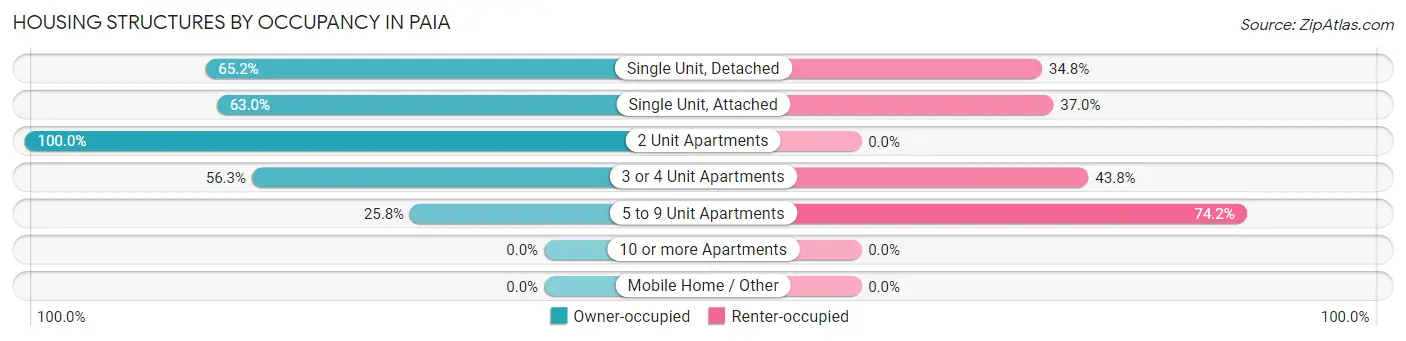
| Structure Type | Owner-occupied | Renter-occupied |
| Single Unit, Detached | 423 (65.2%) | 226 (34.8%) |
| Single Unit, Attached | 46 (63.0%) | 27 (37.0%) |
| 2 Unit Apartments | 15 (100.0%) | 0 (0.0%) |
| 3 or 4 Unit Apartments | 18 (56.2%) | 14 (43.8%) |
| 5 to 9 Unit Apartments | 8 (25.8%) | 23 (74.2%) |
| 10 or more Apartments | 0 (0.0%) | 0 (0.0%) |
| Mobile Home / Other | 0 (0.0%) | 0 (0.0%) |
| Total | 510 (63.7%) | 290 (36.2%) |
Housing Structures by Number of Rooms in Paia
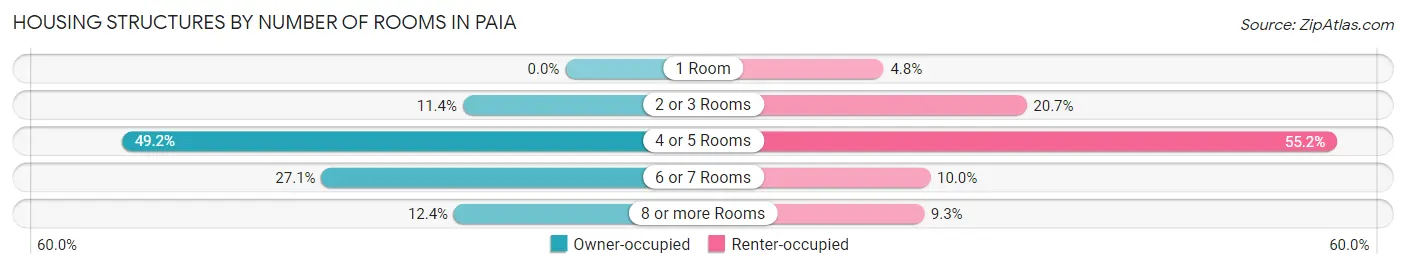
| Number of Rooms | Owner-occupied | Renter-occupied |
| 1 Room | 0 (0.0%) | 14 (4.8%) |
| 2 or 3 Rooms | 58 (11.4%) | 60 (20.7%) |
| 4 or 5 Rooms | 251 (49.2%) | 160 (55.2%) |
| 6 or 7 Rooms | 138 (27.1%) | 29 (10.0%) |
| 8 or more Rooms | 63 (12.3%) | 27 (9.3%) |
| Total | 510 (100.0%) | 290 (100.0%) |
Housing Structure by Heating Type in Paia
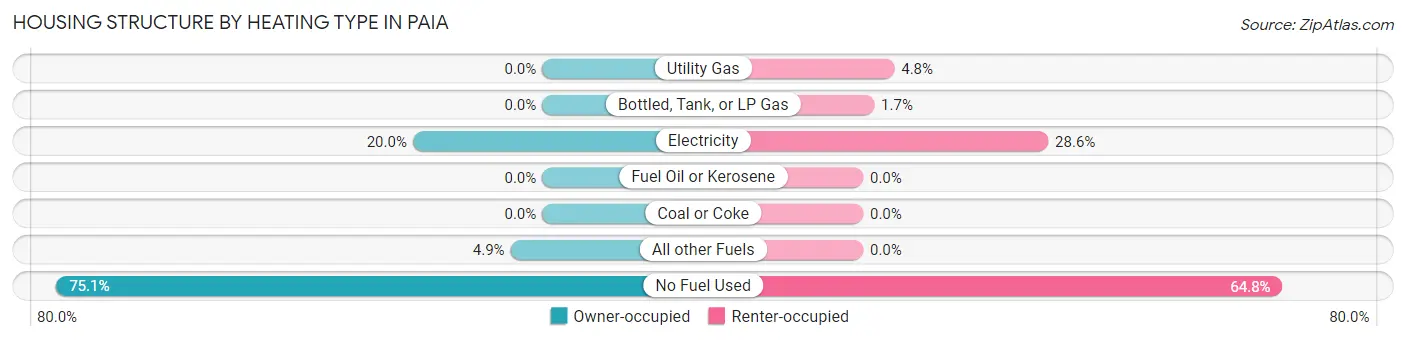
| Heating Type | Owner-occupied | Renter-occupied |
| Utility Gas | 0 (0.0%) | 14 (4.8%) |
| Bottled, Tank, or LP Gas | 0 (0.0%) | 5 (1.7%) |
| Electricity | 102 (20.0%) | 83 (28.6%) |
| Fuel Oil or Kerosene | 0 (0.0%) | 0 (0.0%) |
| Coal or Coke | 0 (0.0%) | 0 (0.0%) |
| All other Fuels | 25 (4.9%) | 0 (0.0%) |
| No Fuel Used | 383 (75.1%) | 188 (64.8%) |
| Total | 510 (100.0%) | 290 (100.0%) |
Household Vehicle Usage in Paia
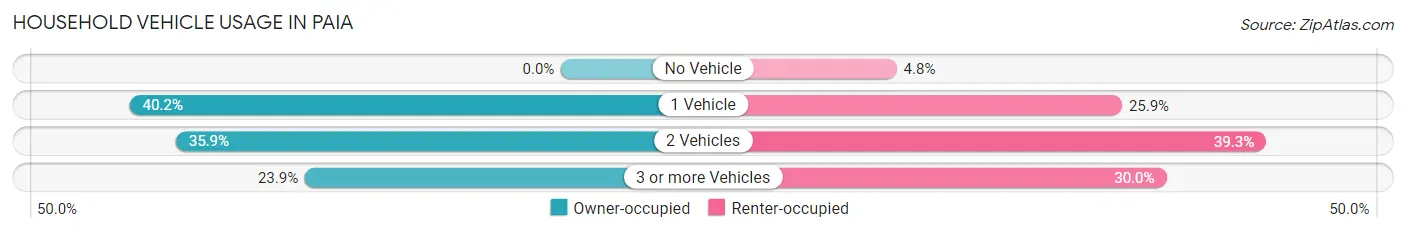
| Vehicles per Household | Owner-occupied | Renter-occupied |
| No Vehicle | 0 (0.0%) | 14 (4.8%) |
| 1 Vehicle | 205 (40.2%) | 75 (25.9%) |
| 2 Vehicles | 183 (35.9%) | 114 (39.3%) |
| 3 or more Vehicles | 122 (23.9%) | 87 (30.0%) |
| Total | 510 (100.0%) | 290 (100.0%) |
Real Estate & Mortgages in Paia
Real Estate and Mortgage Overview in Paia
| Characteristic | Without Mortgage | With Mortgage |
| Housing Units | 211 | 299 |
| Median Property Value | $1,030,400 | $767,100 |
| Median Household Income | - | - |
| Monthly Housing Costs | $706 | $68 |
| Real Estate Taxes | $3,031 | $0 |
Property Value by Mortgage Status in Paia
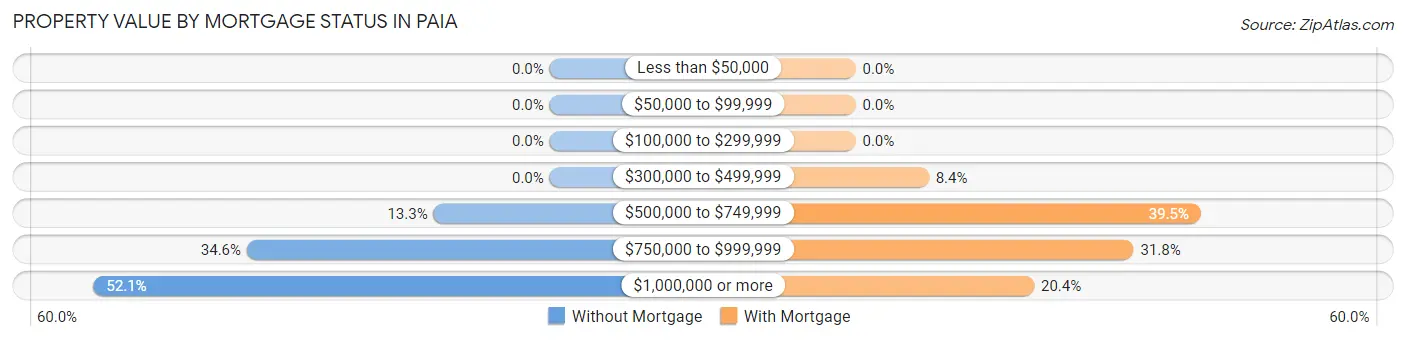
| Property Value | Without Mortgage | With Mortgage |
| Less than $50,000 | 0 (0.0%) | 0 (0.0%) |
| $50,000 to $99,999 | 0 (0.0%) | 0 (0.0%) |
| $100,000 to $299,999 | 0 (0.0%) | 0 (0.0%) |
| $300,000 to $499,999 | 0 (0.0%) | 25 (8.4%) |
| $500,000 to $749,999 | 28 (13.3%) | 118 (39.5%) |
| $750,000 to $999,999 | 73 (34.6%) | 95 (31.8%) |
| $1,000,000 or more | 110 (52.1%) | 61 (20.4%) |
| Total | 211 (100.0%) | 299 (100.0%) |
Household Income by Mortgage Status in Paia
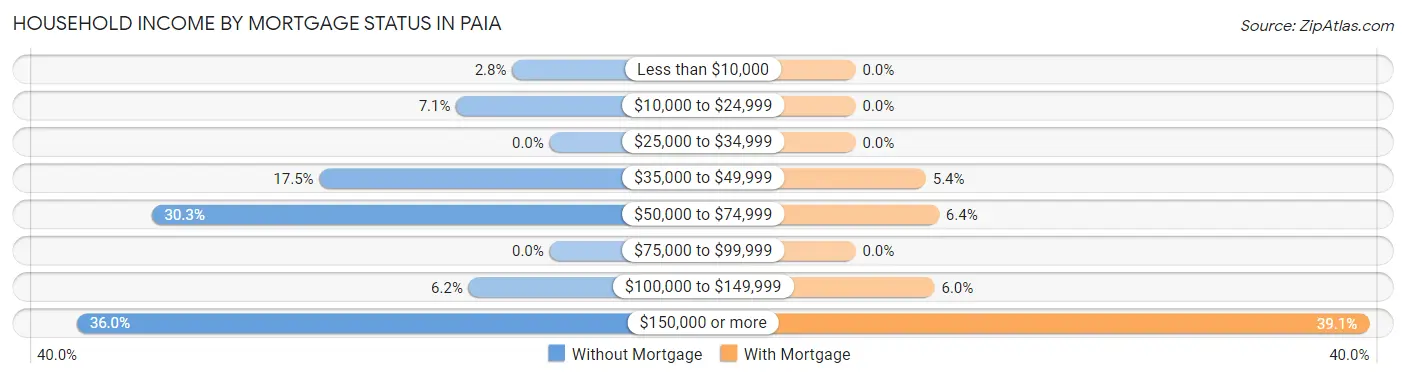
| Household Income | Without Mortgage | With Mortgage |
| Less than $10,000 | 6 (2.8%) | 0 (0.0%) |
| $10,000 to $24,999 | 15 (7.1%) | 0 (0.0%) |
| $25,000 to $34,999 | 0 (0.0%) | 0 (0.0%) |
| $35,000 to $49,999 | 37 (17.5%) | 16 (5.3%) |
| $50,000 to $74,999 | 64 (30.3%) | 19 (6.4%) |
| $75,000 to $99,999 | 0 (0.0%) | 0 (0.0%) |
| $100,000 to $149,999 | 13 (6.2%) | 18 (6.0%) |
| $150,000 or more | 76 (36.0%) | 117 (39.1%) |
| Total | 211 (100.0%) | 299 (100.0%) |
Property Value to Household Income Ratio in Paia
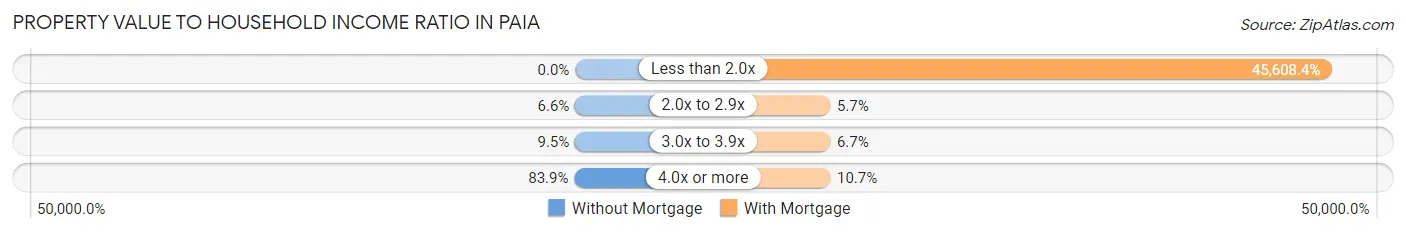
| Value-to-Income Ratio | Without Mortgage | With Mortgage |
| Less than 2.0x | 0 (0.0%) | 136,369 (45,608.4%) |
| 2.0x to 2.9x | 14 (6.6%) | 17 (5.7%) |
| 3.0x to 3.9x | 20 (9.5%) | 20 (6.7%) |
| 4.0x or more | 177 (83.9%) | 32 (10.7%) |
| Total | 211 (100.0%) | 299 (100.0%) |
Real Estate Taxes by Mortgage Status in Paia
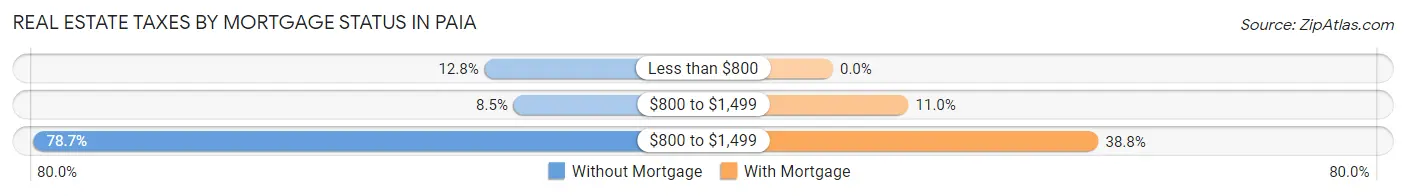
| Property Taxes | Without Mortgage | With Mortgage |
| Less than $800 | 27 (12.8%) | 0 (0.0%) |
| $800 to $1,499 | 18 (8.5%) | 33 (11.0%) |
| $800 to $1,499 | 166 (78.7%) | 116 (38.8%) |
| Total | 211 (100.0%) | 299 (100.0%) |
Health & Disability in Paia
Health Insurance Coverage by Age in Paia
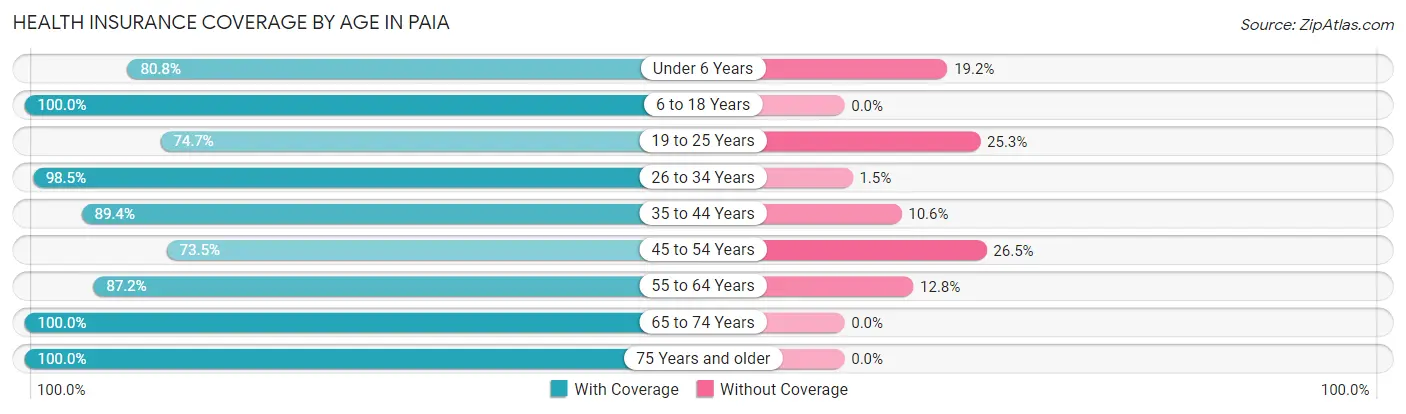
| Age Bracket | With Coverage | Without Coverage |
| Under 6 Years | 80 (80.8%) | 19 (19.2%) |
| 6 to 18 Years | 271 (100.0%) | 0 (0.0%) |
| 19 to 25 Years | 171 (74.7%) | 58 (25.3%) |
| 26 to 34 Years | 194 (98.5%) | 3 (1.5%) |
| 35 to 44 Years | 353 (89.4%) | 42 (10.6%) |
| 45 to 54 Years | 269 (73.5%) | 97 (26.5%) |
| 55 to 64 Years | 265 (87.2%) | 39 (12.8%) |
| 65 to 74 Years | 280 (100.0%) | 0 (0.0%) |
| 75 Years and older | 70 (100.0%) | 0 (0.0%) |
| Total | 1,953 (88.3%) | 258 (11.7%) |
Health Insurance Coverage by Citizenship Status in Paia
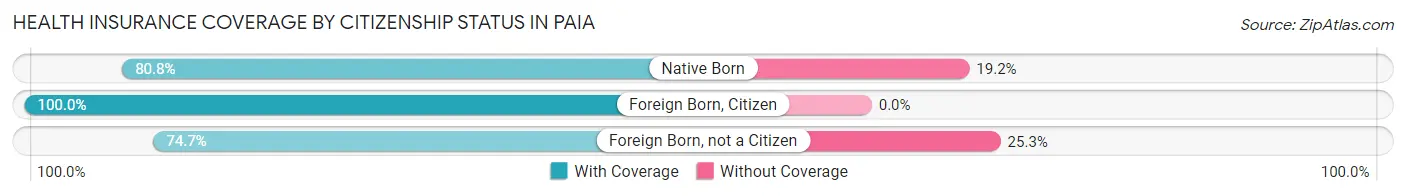
| Citizenship Status | With Coverage | Without Coverage |
| Native Born | 80 (80.8%) | 19 (19.2%) |
| Foreign Born, Citizen | 271 (100.0%) | 0 (0.0%) |
| Foreign Born, not a Citizen | 171 (74.7%) | 58 (25.3%) |
Health Insurance Coverage by Household Income in Paia
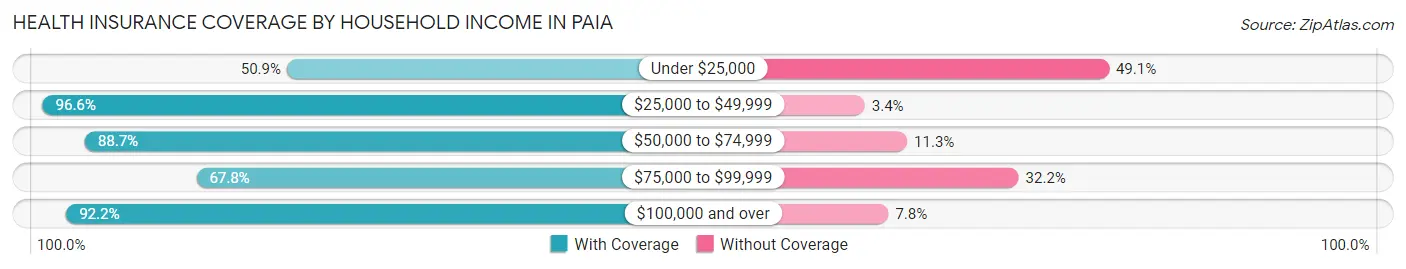
| Household Income | With Coverage | Without Coverage |
| Under $25,000 | 29 (50.9%) | 28 (49.1%) |
| $25,000 to $49,999 | 200 (96.6%) | 7 (3.4%) |
| $50,000 to $74,999 | 196 (88.7%) | 25 (11.3%) |
| $75,000 to $99,999 | 179 (67.8%) | 85 (32.2%) |
| $100,000 and over | 1,333 (92.2%) | 113 (7.8%) |
Public vs Private Health Insurance Coverage by Age in Paia
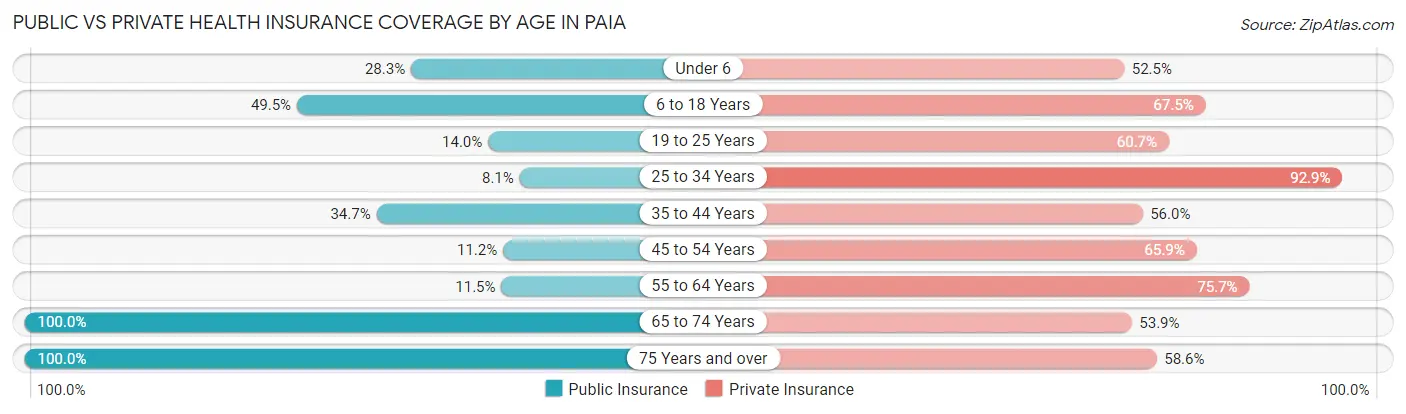
| Age Bracket | Public Insurance | Private Insurance |
| Under 6 | 28 (28.3%) | 52 (52.5%) |
| 6 to 18 Years | 134 (49.4%) | 183 (67.5%) |
| 19 to 25 Years | 32 (14.0%) | 139 (60.7%) |
| 25 to 34 Years | 16 (8.1%) | 183 (92.9%) |
| 35 to 44 Years | 137 (34.7%) | 221 (55.9%) |
| 45 to 54 Years | 41 (11.2%) | 241 (65.8%) |
| 55 to 64 Years | 35 (11.5%) | 230 (75.7%) |
| 65 to 74 Years | 280 (100.0%) | 151 (53.9%) |
| 75 Years and over | 70 (100.0%) | 41 (58.6%) |
| Total | 773 (35.0%) | 1,441 (65.2%) |
Disability Status by Sex by Age in Paia
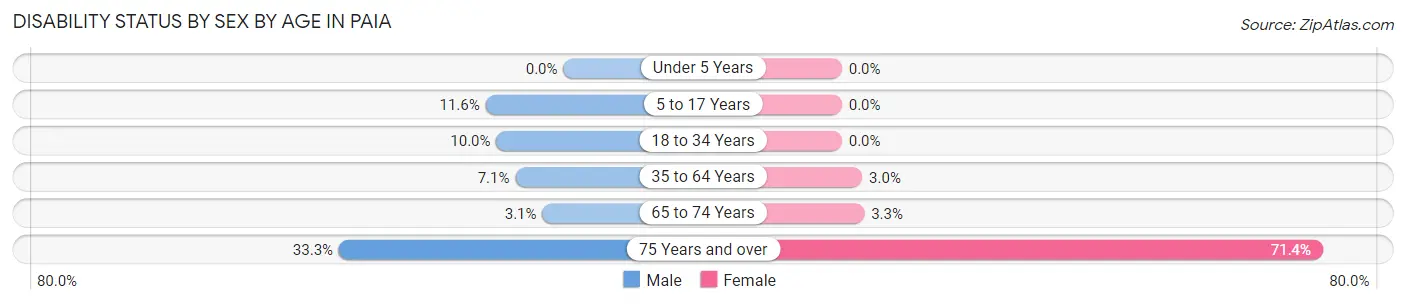
| Age Bracket | Male | Female |
| Under 5 Years | 0 (0.0%) | 0 (0.0%) |
| 5 to 17 Years | 17 (11.6%) | 0 (0.0%) |
| 18 to 34 Years | 20 (10.0%) | 0 (0.0%) |
| 35 to 64 Years | 43 (7.1%) | 14 (3.0%) |
| 65 to 74 Years | 5 (3.1%) | 4 (3.3%) |
| 75 Years and over | 14 (33.3%) | 20 (71.4%) |
Disability Class by Sex by Age in Paia
Disability Class: Hearing Difficulty
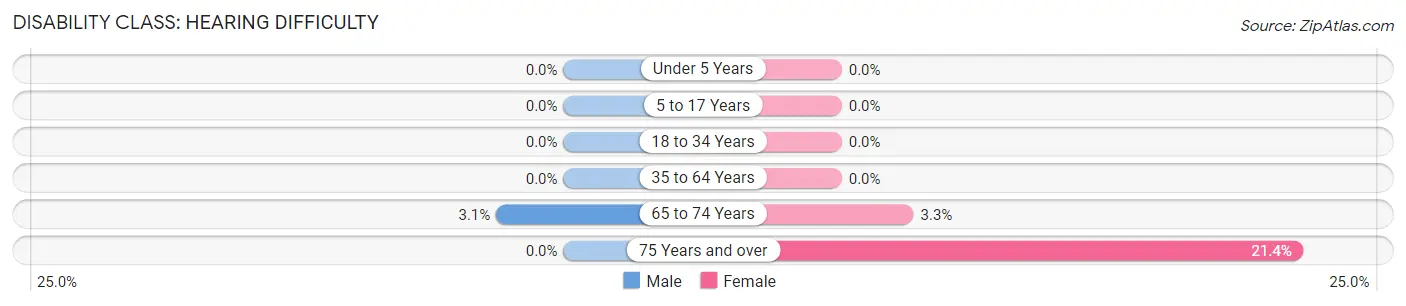
| Age Bracket | Male | Female |
| Under 5 Years | 0 (0.0%) | 0 (0.0%) |
| 5 to 17 Years | 0 (0.0%) | 0 (0.0%) |
| 18 to 34 Years | 0 (0.0%) | 0 (0.0%) |
| 35 to 64 Years | 0 (0.0%) | 0 (0.0%) |
| 65 to 74 Years | 5 (3.1%) | 4 (3.3%) |
| 75 Years and over | 0 (0.0%) | 6 (21.4%) |
Disability Class: Vision Difficulty
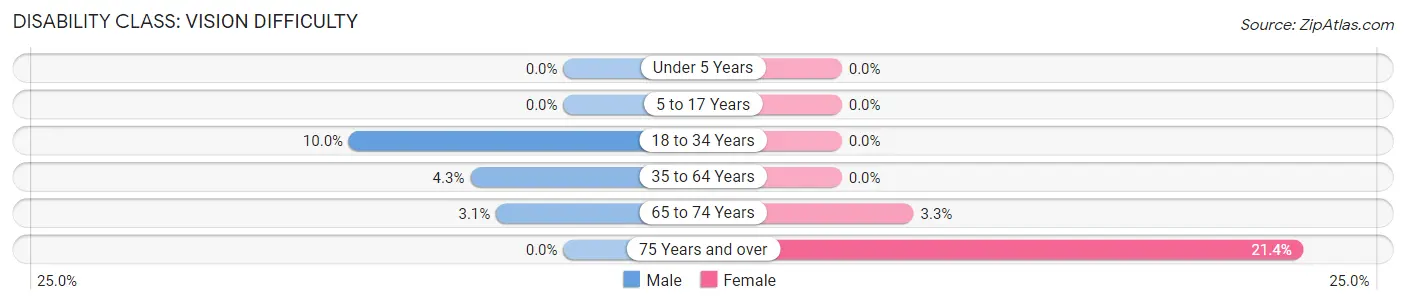
| Age Bracket | Male | Female |
| Under 5 Years | 0 (0.0%) | 0 (0.0%) |
| 5 to 17 Years | 0 (0.0%) | 0 (0.0%) |
| 18 to 34 Years | 20 (10.0%) | 0 (0.0%) |
| 35 to 64 Years | 26 (4.3%) | 0 (0.0%) |
| 65 to 74 Years | 5 (3.1%) | 4 (3.3%) |
| 75 Years and over | 0 (0.0%) | 6 (21.4%) |
Disability Class: Cognitive Difficulty
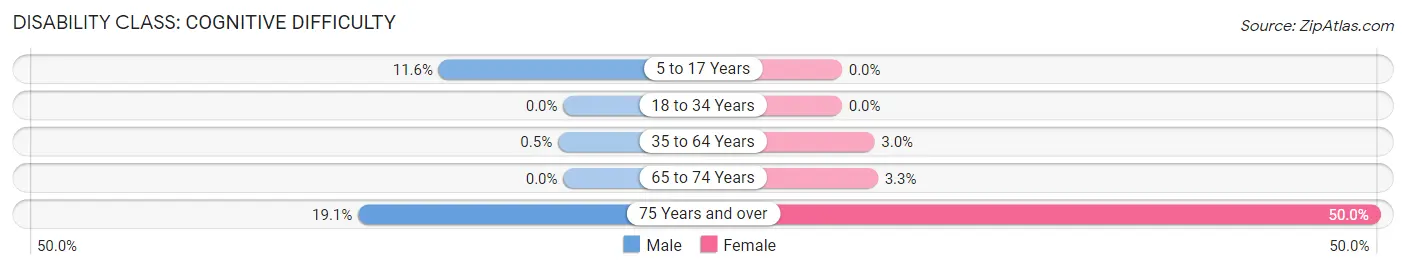
| Age Bracket | Male | Female |
| 5 to 17 Years | 17 (11.6%) | 0 (0.0%) |
| 18 to 34 Years | 0 (0.0%) | 0 (0.0%) |
| 35 to 64 Years | 3 (0.5%) | 14 (3.0%) |
| 65 to 74 Years | 0 (0.0%) | 4 (3.3%) |
| 75 Years and over | 8 (19.1%) | 14 (50.0%) |
Disability Class: Ambulatory Difficulty
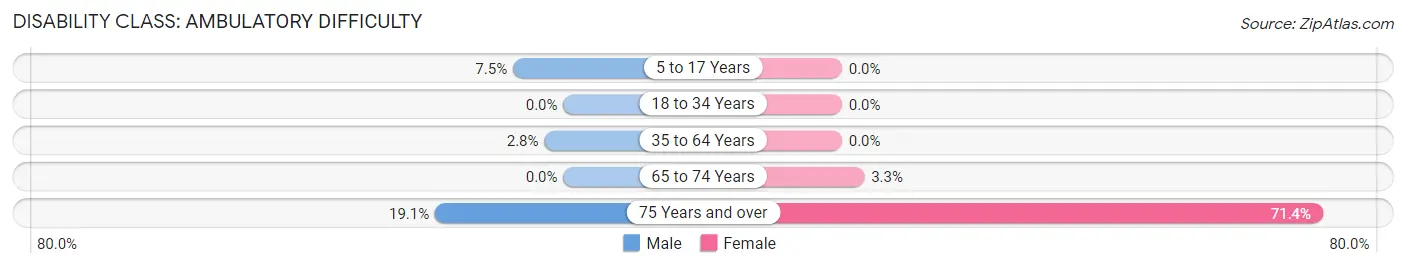
| Age Bracket | Male | Female |
| 5 to 17 Years | 11 (7.5%) | 0 (0.0%) |
| 18 to 34 Years | 0 (0.0%) | 0 (0.0%) |
| 35 to 64 Years | 17 (2.8%) | 0 (0.0%) |
| 65 to 74 Years | 0 (0.0%) | 4 (3.3%) |
| 75 Years and over | 8 (19.1%) | 20 (71.4%) |
Disability Class: Self-Care Difficulty
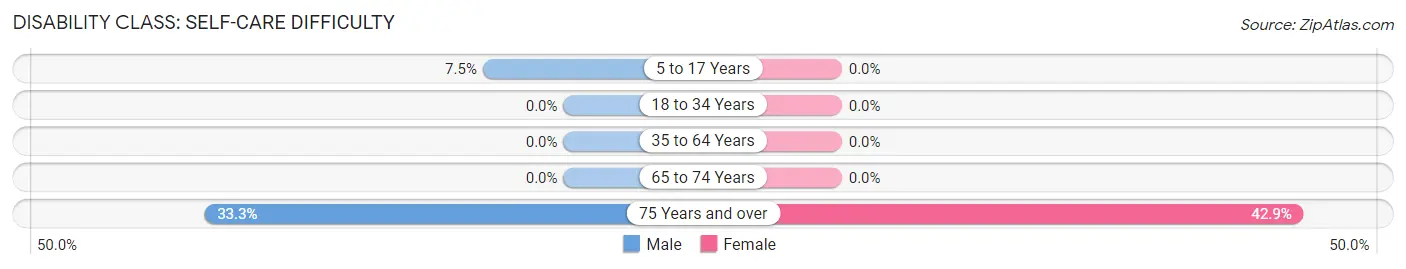
| Age Bracket | Male | Female |
| 5 to 17 Years | 11 (7.5%) | 0 (0.0%) |
| 18 to 34 Years | 0 (0.0%) | 0 (0.0%) |
| 35 to 64 Years | 0 (0.0%) | 0 (0.0%) |
| 65 to 74 Years | 0 (0.0%) | 0 (0.0%) |
| 75 Years and over | 14 (33.3%) | 12 (42.9%) |
Technology Access in Paia
Computing Device Access in Paia
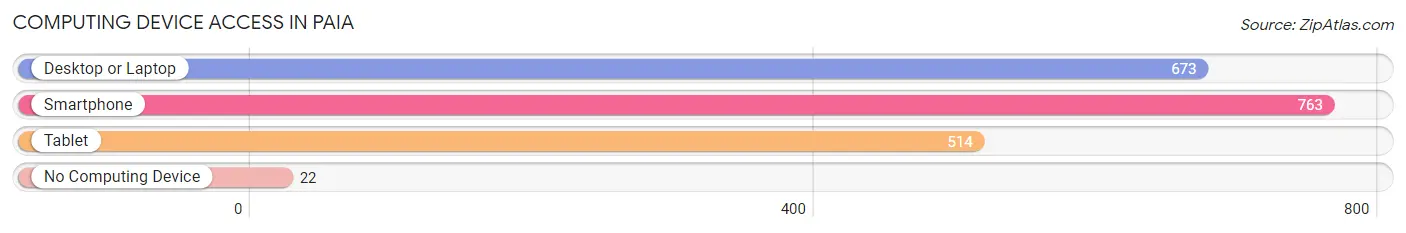
| Device Type | # Households | % Households |
| Desktop or Laptop | 673 | 84.1% |
| Smartphone | 763 | 95.4% |
| Tablet | 514 | 64.2% |
| No Computing Device | 22 | 2.8% |
| Total | 800 | 100.0% |
Internet Access in Paia
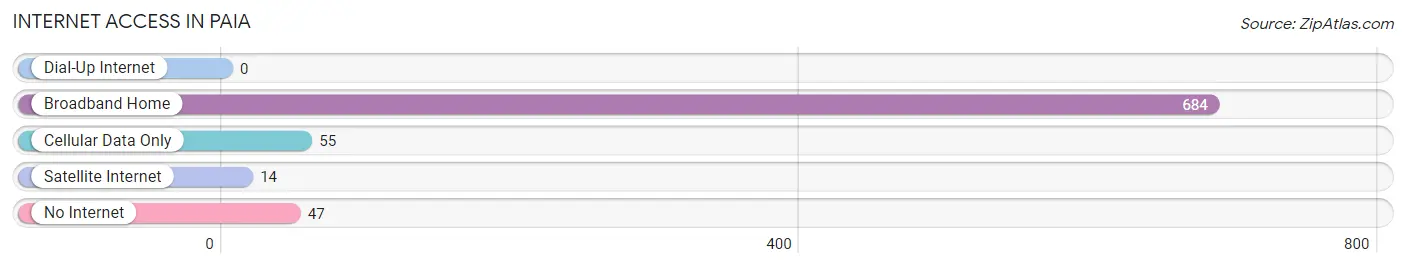
| Internet Type | # Households | % Households |
| Dial-Up Internet | 0 | 0.0% |
| Broadband Home | 684 | 85.5% |
| Cellular Data Only | 55 | 6.9% |
| Satellite Internet | 14 | 1.8% |
| No Internet | 47 | 5.9% |
| Total | 800 | 100.0% |
Paia Summary
Paia is a small town located on the north shore of Maui, Hawaii. It is a popular tourist destination and is known for its laid-back atmosphere and stunning beaches. The town has a population of 2,668 as of the 2010 census.
History
Paia was founded in 1876 by George Freeland, a sugar plantation manager. He named the town after his hometown of Paia, Scotland. The town quickly grew as a center for the sugar industry, and by the early 1900s, it was the largest town on Maui.
In the 1920s, Paia became a popular tourist destination. The town was known for its beautiful beaches and laid-back atmosphere. It was also home to a thriving music scene, with many jazz and blues musicians performing in the town's clubs.
In the 1950s, Paia began to decline as the sugar industry moved away from the area. The town was further impacted by the construction of the Hana Highway, which diverted traffic away from Paia.
Geography
Paia is located on the north shore of Maui, about 10 miles east of Kahului. The town is situated on a narrow strip of land between the Pacific Ocean and the slopes of the Haleakala volcano.
The town has a tropical climate, with warm temperatures year-round. The average high temperature is 82°F (28°C) and the average low temperature is 68°F (20°C).
Economy
Paia's economy is largely based on tourism. The town is home to several hotels, restaurants, and shops catering to visitors. The town is also home to several art galleries and boutiques.
The town is also home to several small businesses, including a surf shop, a yoga studio, and a health food store.
Demographics
As of the 2010 census, Paia had a population of 2,668. The racial makeup of the town was 57.3% White, 0.7% African American, 0.3% Native American, 11.2% Asian, 0.2% Pacific Islander, and 30.5% from other races.
The median household income in Paia was $50,945, and the median family income was $60,945. The per capita income was $25,945.
Conclusion
Paia is a small town located on the north shore of Maui, Hawaii. It is a popular tourist destination and is known for its laid-back atmosphere and stunning beaches. The town has a population of 2,668 as of the 2010 census. Paia's economy is largely based on tourism, and the town is home to several small businesses. The racial makeup of the town is 57.3% White, 0.7% African American, 0.3% Native American, 11.2% Asian, 0.2% Pacific Islander, and 30.5% from other races. The median household income in Paia was $50,945, and the median family income was $60,945. The per capita income was $25,945.
Common Questions
What is the Total Population of Paia?
Total Population of Paia is 2,211.
What is the Total Male Population of Paia?
Total Male Population of Paia is 1,195.
What is the Total Female Population of Paia?
Total Female Population of Paia is 1,016.
What is the Ratio of Males per 100 Females in Paia?
There are 117.62 Males per 100 Females in Paia.
What is the Ratio of Females per 100 Males in Paia?
There are 85.02 Females per 100 Males in Paia.
What is the Median Population Age in Paia?
Median Population Age in Paia is 42.3 Years.
What is the Average Family Size in Paia
Average Family Size in Paia is 3.0 People.
What is the Average Household Size in Paia
Average Household Size in Paia is 2.7 People.
What is Per Capita Income in Paia?
Per Capita income in Paia is $46,999.
What is the Median Family Income in Paia?
Median Family Income in Paia is $122,821.
What is the Median Household income in Paia?
Median Household Income in Paia is $113,750.
What is Income or Wage Gap in Paia?
Income or Wage Gap in Paia is 22.2%.
Women in Paia earn 77.8 cents for every dollar earned by a man.
What is Inequality or Gini Index in Paia?
Inequality or Gini Index in Paia is 0.41.
How Large is the Labor Force in Paia?
There are 1,445 People in the Labor Forcein in Paia.
What is the Percentage of People in the Labor Force in Paia?
76.0% of People are in the Labor Force in Paia.
What is the Unemployment Rate in Paia?
Unemployment Rate in Paia is 12.9%.