Keokea, HI
Keokea Map
Keokea Overview
2,872
TOTAL POPULATION
1,469
MALE POPULATION
1,403
FEMALE POPULATION
104.70
MALES / 100 FEMALES
95.51
FEMALES / 100 MALES
36.7
MEDIAN AGE
4.2
AVG FAMILY SIZE
3.8
AVG HOUSEHOLD SIZE
$44,062
PER CAPITA INCOME
$128,333
AVG FAMILY INCOME
$113,450
AVG HOUSEHOLD INCOME
36.2%
WAGE / INCOME GAP [ % ]
63.8¢/ $1
WAGE / INCOME GAP [ $ ]
0.49
INEQUALITY / GINI INDEX
1,400
LABOR FORCE [ PEOPLE ]
65.7%
PERCENT IN LABOR FORCE
8.7%
UNEMPLOYMENT RATE
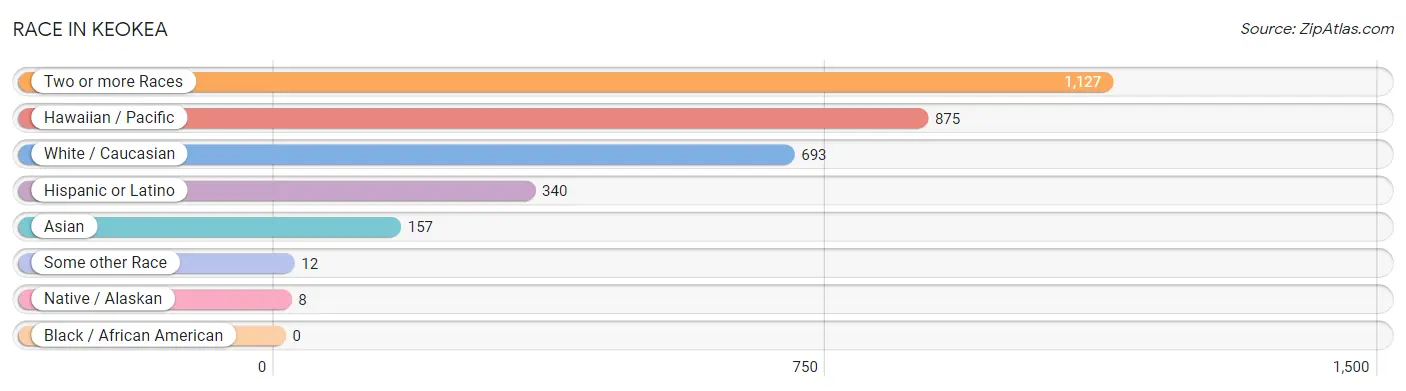
Race in Keokea
The most populous races in Keokea are Two or more Races (1,127 | 39.2%), Hawaiian / Pacific (875 | 30.5%), and White / Caucasian (693 | 24.1%).
| Race | # Population | % Population |
| Asian | 157 | 5.5% |
| Black / African American | 0 | 0.0% |
| Hawaiian / Pacific | 875 | 30.5% |
| Hispanic or Latino | 340 | 11.8% |
| Native / Alaskan | 8 | 0.3% |
| White / Caucasian | 693 | 24.1% |
| Two or more Races | 1,127 | 39.2% |
| Some other Race | 12 | 0.4% |
| Total | 2,872 | 100.0% |
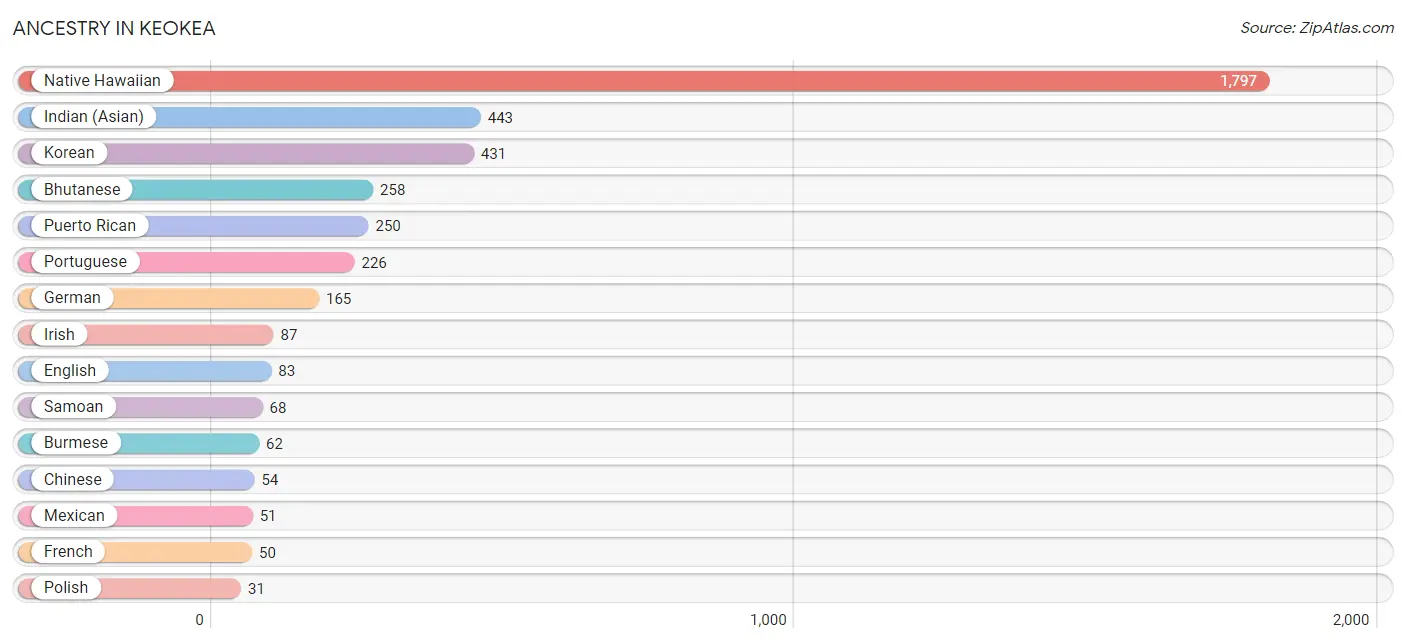
Ancestry in Keokea
The most populous ancestries reported in Keokea are Native Hawaiian (1,797 | 62.6%), Indian (Asian) (443 | 15.4%), Korean (431 | 15.0%), Bhutanese (258 | 9.0%), and Puerto Rican (250 | 8.7%), together accounting for 110.7% of all Keokea residents.
| Ancestry | # Population | % Population |
| American | 26 | 0.9% |
| Arab | 4 | 0.1% |
| Bhutanese | 258 | 9.0% |
| British | 22 | 0.8% |
| Burmese | 62 | 2.2% |
| Canadian | 5 | 0.2% |
| Central American | 1 | 0.0% |
| Cherokee | 7 | 0.2% |
| Chilean | 22 | 0.8% |
| Chinese | 54 | 1.9% |
| Choctaw | 11 | 0.4% |
| Czech | 2 | 0.1% |
| Dutch | 9 | 0.3% |
| English | 83 | 2.9% |
| European | 19 | 0.7% |
| Finnish | 2 | 0.1% |
| French | 50 | 1.7% |
| German | 165 | 5.8% |
| Greek | 3 | 0.1% |
| Guatemalan | 1 | 0.0% |
| Hungarian | 13 | 0.4% |
| Indian (Asian) | 443 | 15.4% |
| Irish | 87 | 3.0% |
| Italian | 25 | 0.9% |
| Korean | 431 | 15.0% |
| Lithuanian | 7 | 0.2% |
| Mexican | 51 | 1.8% |
| Mongolian | 1 | 0.0% |
| Moroccan | 4 | 0.1% |
| Native Hawaiian | 1,797 | 62.6% |
| Norwegian | 14 | 0.5% |
| Polish | 31 | 1.1% |
| Portuguese | 226 | 7.9% |
| Potawatomi | 1 | 0.0% |
| Puerto Rican | 250 | 8.7% |
| Russian | 2 | 0.1% |
| Samoan | 68 | 2.4% |
| Scotch-Irish | 30 | 1.0% |
| Scottish | 24 | 0.8% |
| South American | 22 | 0.8% |
| Spaniard | 15 | 0.5% |
| Spanish | 1 | 0.0% |
| Swedish | 5 | 0.2% |
| Swiss | 12 | 0.4% |
| Tongan | 13 | 0.4% |
| Welsh | 4 | 0.1% | View All 46 Rows |
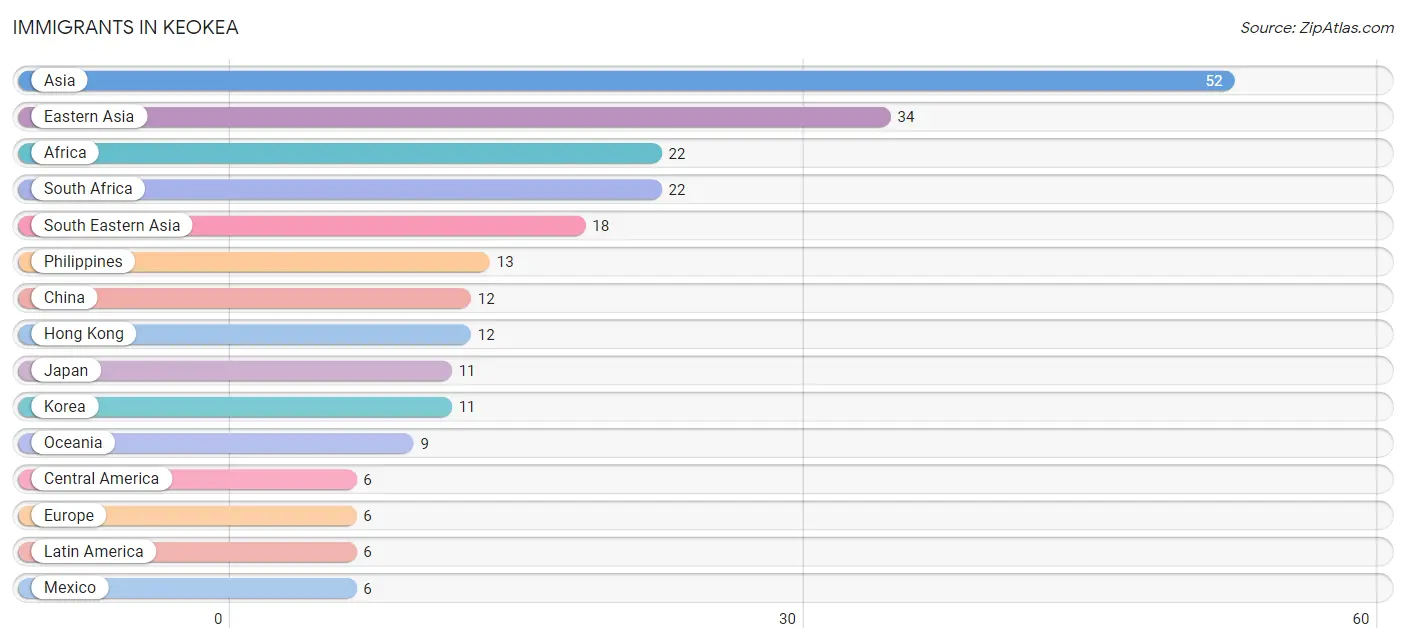
Immigrants in Keokea
The most numerous immigrant groups reported in Keokea came from Asia (52 | 1.8%), Eastern Asia (34 | 1.2%), Africa (22 | 0.8%), South Africa (22 | 0.8%), and South Eastern Asia (18 | 0.6%), together accounting for 5.2% of all Keokea residents.
| Immigration Origin | # Population | % Population |
| Africa | 22 | 0.8% |
| Asia | 52 | 1.8% |
| Canada | 4 | 0.1% |
| Central America | 6 | 0.2% |
| China | 12 | 0.4% |
| Eastern Asia | 34 | 1.2% |
| Europe | 6 | 0.2% |
| Hong Kong | 12 | 0.4% |
| Indonesia | 5 | 0.2% |
| Japan | 11 | 0.4% |
| Korea | 11 | 0.4% |
| Latin America | 6 | 0.2% |
| Mexico | 6 | 0.2% |
| Netherlands | 4 | 0.1% |
| Oceania | 9 | 0.3% |
| Philippines | 13 | 0.4% |
| South Africa | 22 | 0.8% |
| South Eastern Asia | 18 | 0.6% |
| Switzerland | 2 | 0.1% |
| Western Europe | 6 | 0.2% | View All 20 Rows |
Sex and Age in Keokea
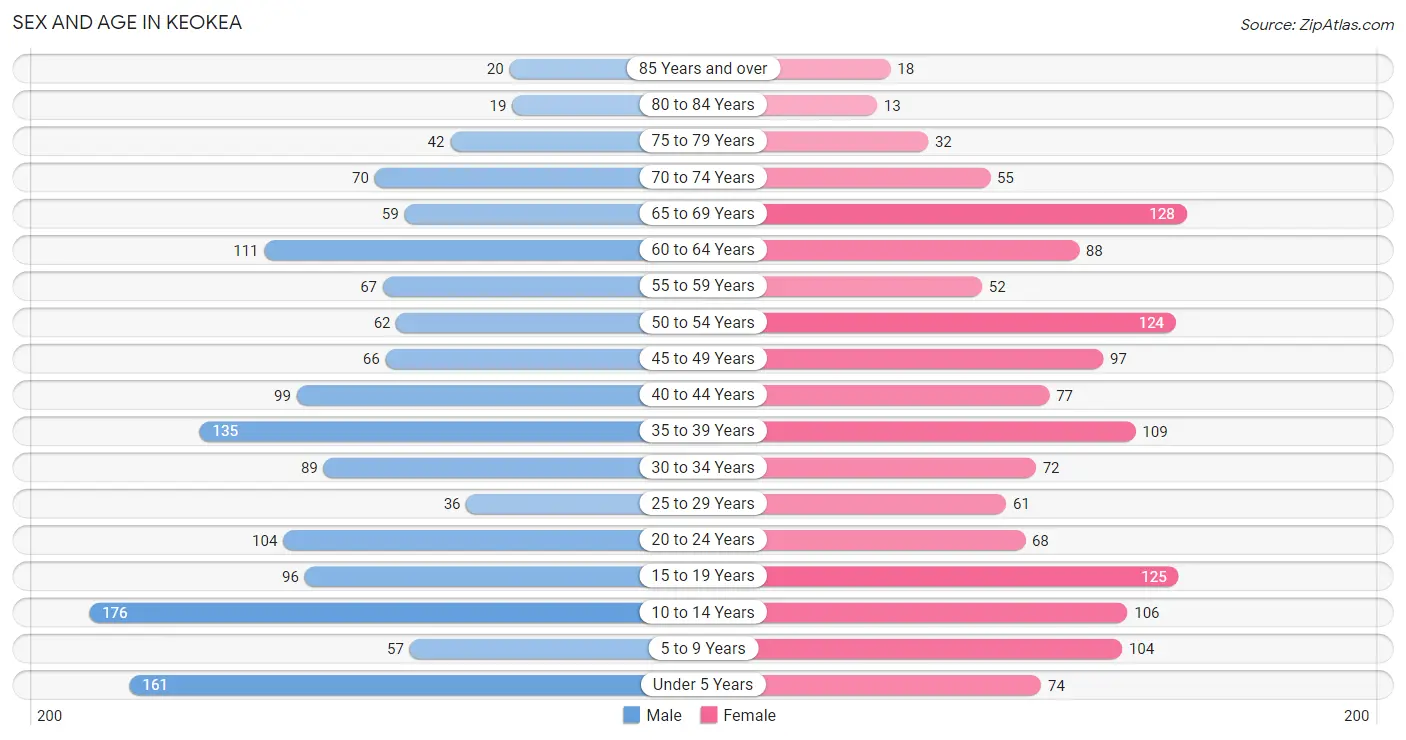
Sex and Age in Keokea
The most populous age groups in Keokea are 10 to 14 Years (176 | 12.0%) for men and 65 to 69 Years (128 | 9.1%) for women.
| Age Bracket | Male | Female |
| Under 5 Years | 161 (11.0%) | 74 (5.3%) |
| 5 to 9 Years | 57 (3.9%) | 104 (7.4%) |
| 10 to 14 Years | 176 (12.0%) | 106 (7.6%) |
| 15 to 19 Years | 96 (6.5%) | 125 (8.9%) |
| 20 to 24 Years | 104 (7.1%) | 68 (4.9%) |
| 25 to 29 Years | 36 (2.5%) | 61 (4.3%) |
| 30 to 34 Years | 89 (6.1%) | 72 (5.1%) |
| 35 to 39 Years | 135 (9.2%) | 109 (7.8%) |
| 40 to 44 Years | 99 (6.7%) | 77 (5.5%) |
| 45 to 49 Years | 66 (4.5%) | 97 (6.9%) |
| 50 to 54 Years | 62 (4.2%) | 124 (8.8%) |
| 55 to 59 Years | 67 (4.6%) | 52 (3.7%) |
| 60 to 64 Years | 111 (7.6%) | 88 (6.3%) |
| 65 to 69 Years | 59 (4.0%) | 128 (9.1%) |
| 70 to 74 Years | 70 (4.8%) | 55 (3.9%) |
| 75 to 79 Years | 42 (2.9%) | 32 (2.3%) |
| 80 to 84 Years | 19 (1.3%) | 13 (0.9%) |
| 85 Years and over | 20 (1.4%) | 18 (1.3%) |
| Total | 1,469 (100.0%) | 1,403 (100.0%) |
Families and Households in Keokea
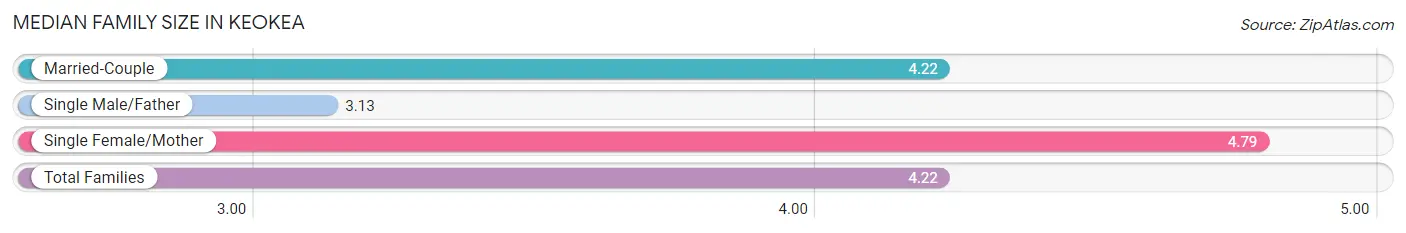
Median Family Size in Keokea
The median family size in Keokea is 4.22 persons per family, with single female/mother families (76 | 12.6%) accounting for the largest median family size of 4.79 persons per family. On the other hand, single male/father families (38 | 6.3%) represent the smallest median family size with 3.13 persons per family.
| Family Type | # Families | Family Size |
| Married-Couple | 488 (81.1%) | 4.22 |
| Single Male/Father | 38 (6.3%) | 3.13 |
| Single Female/Mother | 76 (12.6%) | 4.79 |
| Total Families | 602 (100.0%) | 4.22 |
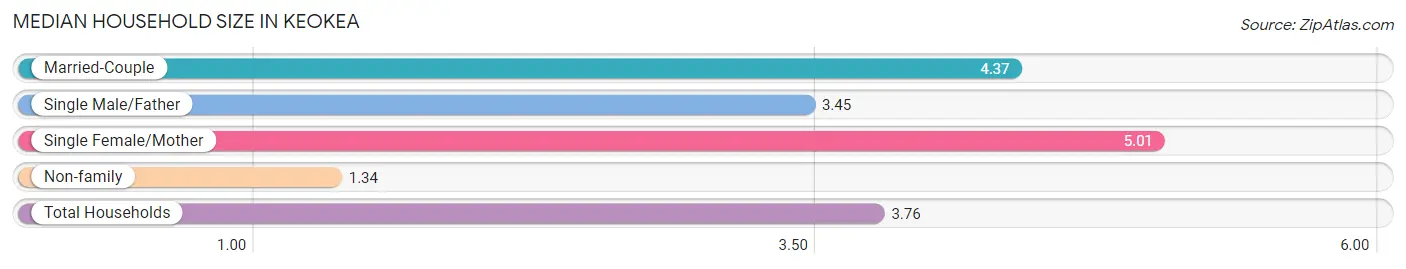
Median Household Size in Keokea
The median household size in Keokea is 3.76 persons per household, with single female/mother households (76 | 10.0%) accounting for the largest median household size of 5.01 persons per household. non-family households (157 | 20.7%) represent the smallest median household size with 1.34 persons per household.
| Household Type | # Households | Household Size |
| Married-Couple | 488 (64.3%) | 4.37 |
| Single Male/Father | 38 (5.0%) | 3.45 |
| Single Female/Mother | 76 (10.0%) | 5.01 |
| Non-family | 157 (20.7%) | 1.34 |
| Total Households | 759 (100.0%) | 3.76 |
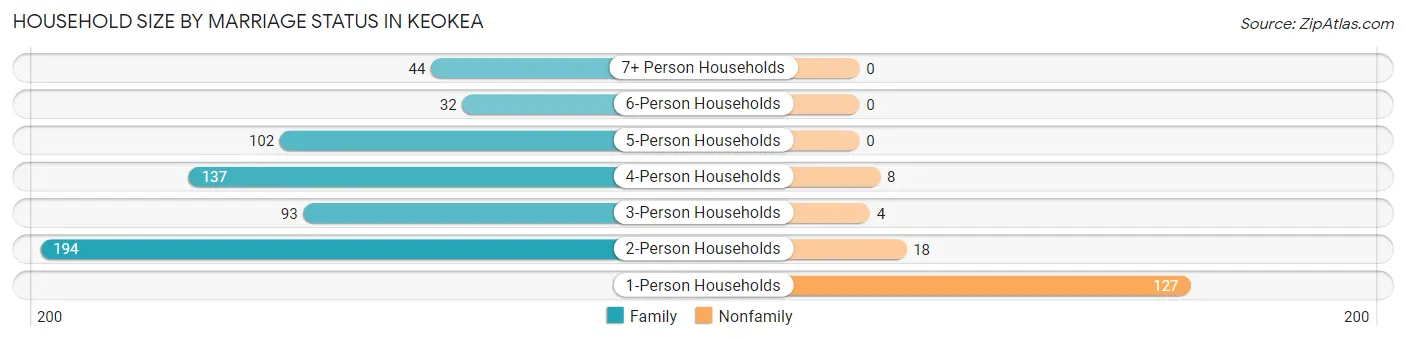
Household Size by Marriage Status in Keokea
Out of a total of 759 households in Keokea, 602 (79.3%) are family households, while 157 (20.7%) are nonfamily households. The most numerous type of family households are 2-person households, comprising 194, and the most common type of nonfamily households are 1-person households, comprising 127.
| Household Size | Family Households | Nonfamily Households |
| 1-Person Households | - | 127 (16.7%) |
| 2-Person Households | 194 (25.6%) | 18 (2.4%) |
| 3-Person Households | 93 (12.2%) | 4 (0.5%) |
| 4-Person Households | 137 (18.0%) | 8 (1.1%) |
| 5-Person Households | 102 (13.4%) | 0 (0.0%) |
| 6-Person Households | 32 (4.2%) | 0 (0.0%) |
| 7+ Person Households | 44 (5.8%) | 0 (0.0%) |
| Total | 602 (79.3%) | 157 (20.7%) |
Female Fertility in Keokea
Fertility by Age in Keokea
Average fertility rate in Keokea is 59.0 births per 1,000 women. Women in the age bracket of 35 to 50 years have the highest fertility rate with 79.0 births per 1,000 women. Women in the age bracket of 35 to 50 years acount for 65.8% of all women with births.
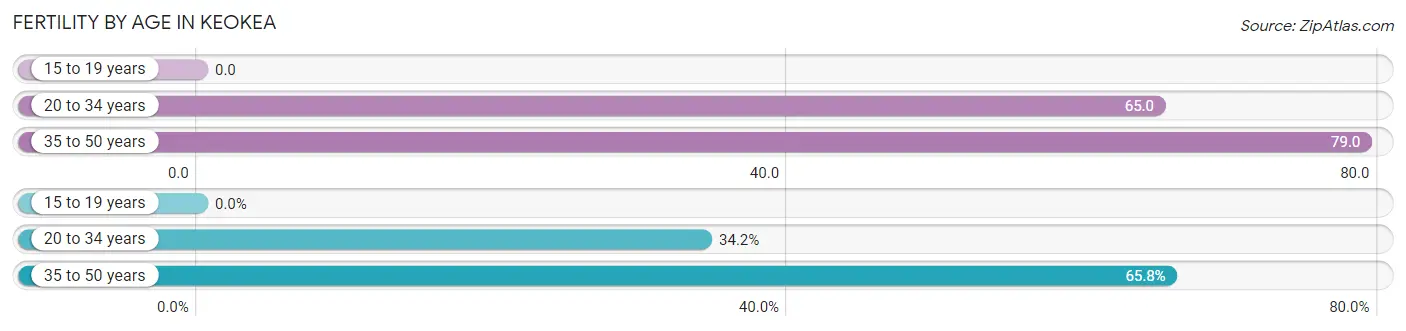
| Age Bracket | Women with Births | Births / 1,000 Women |
| 15 to 19 years | 0 (0.0%) | 0.0 |
| 20 to 34 years | 13 (34.2%) | 65.0 |
| 35 to 50 years | 25 (65.8%) | 79.0 |
| Total | 38 (100.0%) | 59.0 |
Fertility by Age by Marriage Status in Keokea
81.6% of women with births (38) in Keokea are married. The highest percentage of unmarried women with births falls into 35 to 50 years age bracket with 28.0% of them unmarried at the time of birth, while the lowest percentage of unmarried women with births belong to 20 to 34 years age bracket with 0.0% of them unmarried.
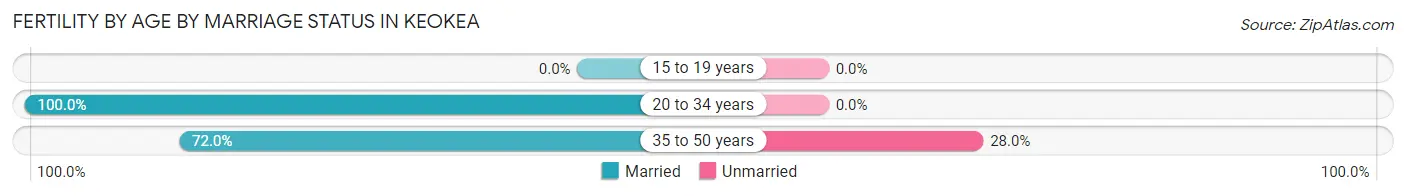
| Age Bracket | Married | Unmarried |
| 15 to 19 years | 0 (0.0%) | 0 (0.0%) |
| 20 to 34 years | 13 (100.0%) | 0 (0.0%) |
| 35 to 50 years | 18 (72.0%) | 7 (28.0%) |
| Total | 31 (81.6%) | 7 (18.4%) |
Fertility by Education in Keokea
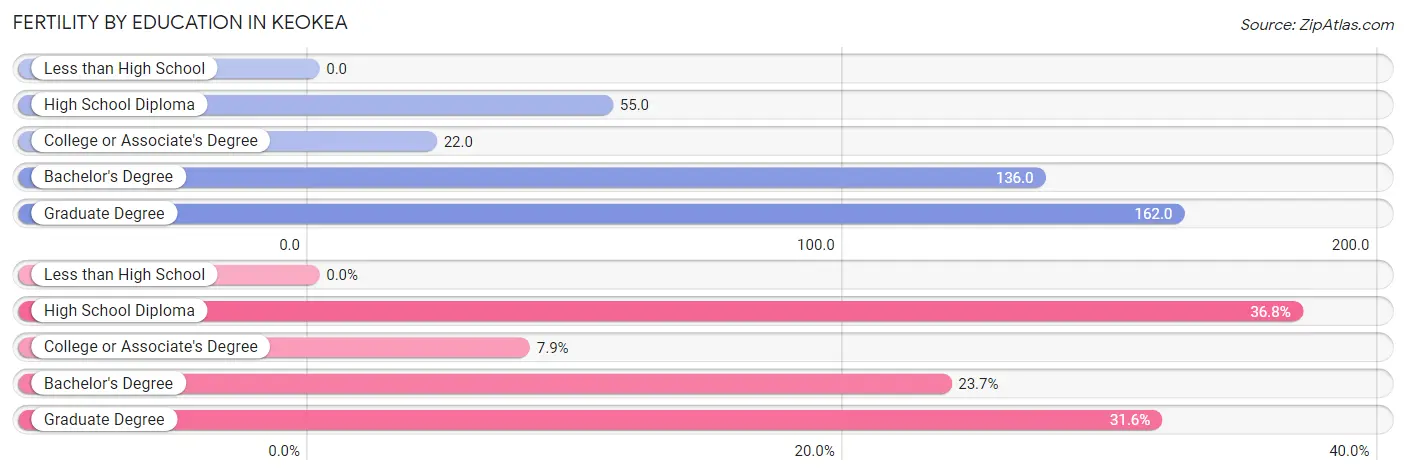
| Educational Attainment | Women with Births | Births / 1,000 Women |
| Less than High School | 0 (0.0%) | 0.0 |
| High School Diploma | 14 (36.8%) | 55.0 |
| College or Associate's Degree | 3 (7.9%) | 22.0 |
| Bachelor's Degree | 9 (23.7%) | 136.0 |
| Graduate Degree | 12 (31.6%) | 162.0 |
| Total | 38 (100.0%) | 59.0 |
Fertility by Education by Marriage Status in Keokea
18.4% of women with births in Keokea are unmarried. Women with the educational attainment of college or associate's degree are most likely to be married with 100.0% of them married at childbirth, while women with the educational attainment of high school diploma are least likely to be married with 50.0% of them unmarried at childbirth.
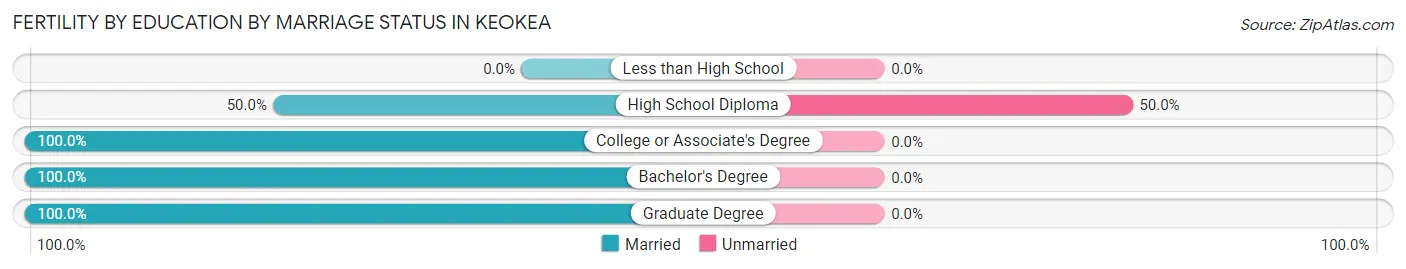
| Educational Attainment | Married | Unmarried |
| Less than High School | 0 (0.0%) | 0 (0.0%) |
| High School Diploma | 7 (50.0%) | 7 (50.0%) |
| College or Associate's Degree | 3 (100.0%) | 0 (0.0%) |
| Bachelor's Degree | 9 (100.0%) | 0 (0.0%) |
| Graduate Degree | 12 (100.0%) | 0 (0.0%) |
| Total | 31 (81.6%) | 7 (18.4%) |
Income in Keokea
Income Overview in Keokea
Per Capita Income in Keokea is $44,062, while median incomes of families and households are $128,333 and $113,450 respectively.
| Characteristic | Number | Measure |
| Per Capita Income | 2,872 | $44,062 |
| Median Family Income | 602 | $128,333 |
| Mean Family Income | 602 | $169,431 |
| Median Household Income | 759 | $113,450 |
| Mean Household Income | 759 | $153,043 |
| Income Deficit | 602 | $0 |
| Wage / Income Gap (%) | 2,872 | 36.22% |
| Wage / Income Gap ($) | 2,872 | 63.78¢ per $1 |
| Gini / Inequality Index | 2,872 | 0.49 |
Earnings by Sex in Keokea
Average Earnings in Keokea are $45,984, $56,279 for men and $35,893 for women, a difference of 36.2%.
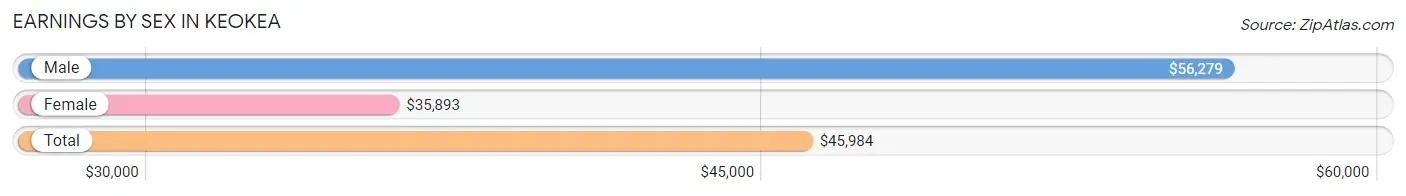
| Sex | Number | Average Earnings |
| Male | 750 (50.6%) | $56,279 |
| Female | 731 (49.4%) | $35,893 |
| Total | 1,481 (100.0%) | $45,984 |
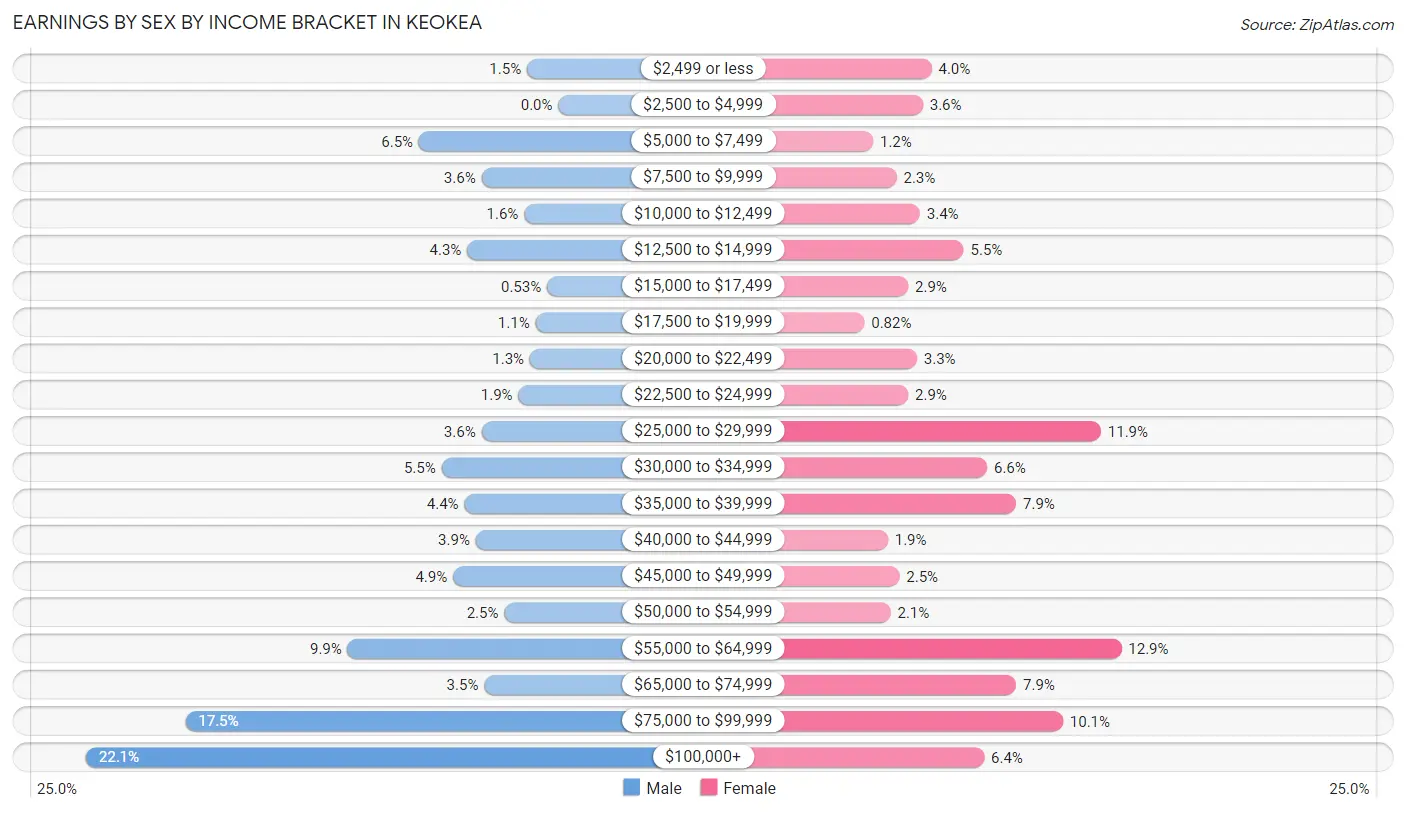
Earnings by Sex by Income Bracket in Keokea
The most common earnings brackets in Keokea are $100,000+ for men (166 | 22.1%) and $55,000 to $64,999 for women (94 | 12.9%).
| Income | Male | Female |
| $2,499 or less | 11 (1.5%) | 29 (4.0%) |
| $2,500 to $4,999 | 0 (0.0%) | 26 (3.6%) |
| $5,000 to $7,499 | 49 (6.5%) | 9 (1.2%) |
| $7,500 to $9,999 | 27 (3.6%) | 17 (2.3%) |
| $10,000 to $12,499 | 12 (1.6%) | 25 (3.4%) |
| $12,500 to $14,999 | 32 (4.3%) | 40 (5.5%) |
| $15,000 to $17,499 | 4 (0.5%) | 21 (2.9%) |
| $17,500 to $19,999 | 8 (1.1%) | 6 (0.8%) |
| $20,000 to $22,499 | 10 (1.3%) | 24 (3.3%) |
| $22,500 to $24,999 | 14 (1.9%) | 21 (2.9%) |
| $25,000 to $29,999 | 27 (3.6%) | 87 (11.9%) |
| $30,000 to $34,999 | 41 (5.5%) | 48 (6.6%) |
| $35,000 to $39,999 | 33 (4.4%) | 58 (7.9%) |
| $40,000 to $44,999 | 29 (3.9%) | 14 (1.9%) |
| $45,000 to $49,999 | 37 (4.9%) | 18 (2.5%) |
| $50,000 to $54,999 | 19 (2.5%) | 15 (2.1%) |
| $55,000 to $64,999 | 74 (9.9%) | 94 (12.9%) |
| $65,000 to $74,999 | 26 (3.5%) | 58 (7.9%) |
| $75,000 to $99,999 | 131 (17.5%) | 74 (10.1%) |
| $100,000+ | 166 (22.1%) | 47 (6.4%) |
| Total | 750 (100.0%) | 731 (100.0%) |
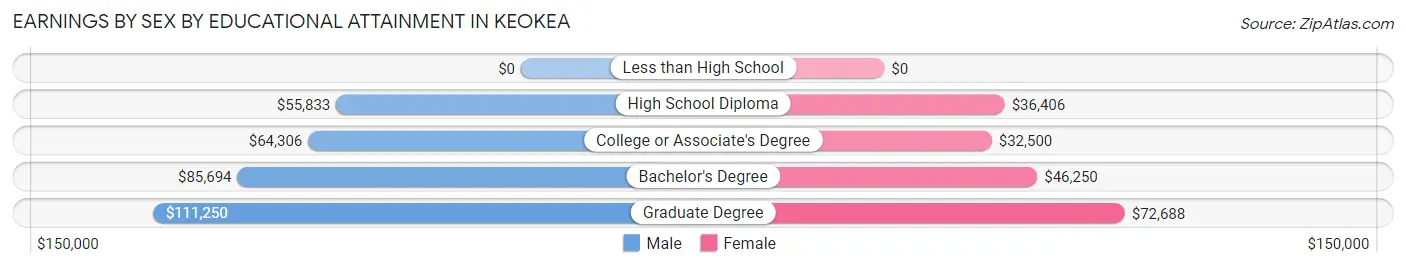
Earnings by Sex by Educational Attainment in Keokea
Average earnings in Keokea are $66,250 for men and $37,366 for women, a difference of 43.6%. Men with an educational attainment of graduate degree enjoy the highest average annual earnings of $111,250, while those with high school diploma education earn the least with $55,833. Women with an educational attainment of graduate degree earn the most with the average annual earnings of $72,688, while those with college or associate's degree education have the smallest earnings of $32,500.
| Educational Attainment | Male Income | Female Income |
| Less than High School | - | - |
| High School Diploma | $55,833 | $36,406 |
| College or Associate's Degree | $64,306 | $32,500 |
| Bachelor's Degree | $85,694 | $46,250 |
| Graduate Degree | $111,250 | $72,688 |
| Total | $66,250 | $37,366 |
Family Income in Keokea
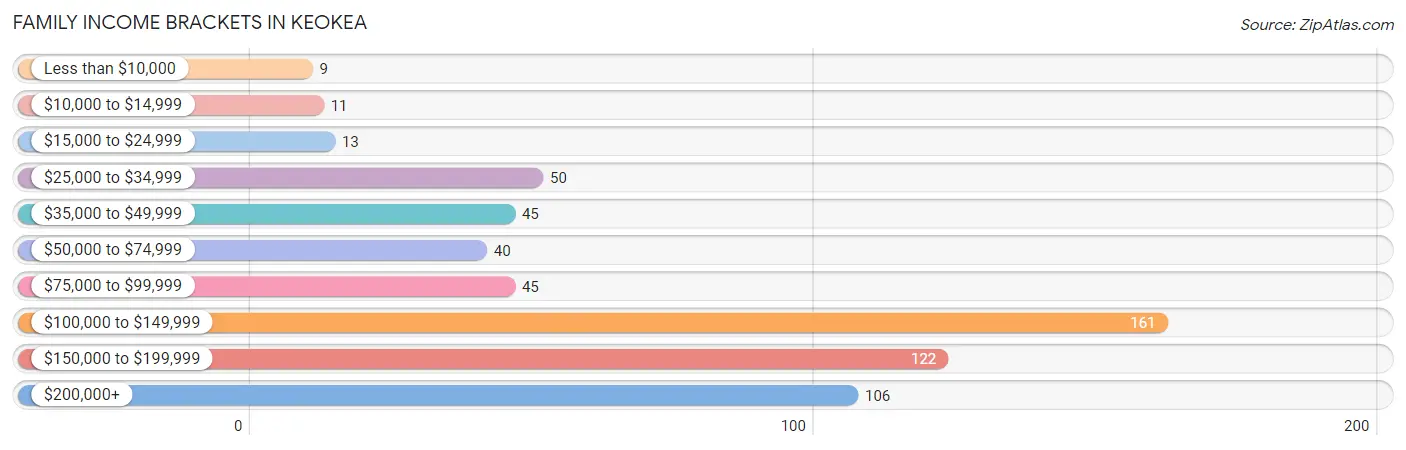
Family Income Brackets in Keokea
According to the Keokea family income data, there are 161 families falling into the $100,000 to $149,999 income range, which is the most common income bracket and makes up 26.7% of all families. Conversely, the less than $10,000 income bracket is the least frequent group with only 9 families (1.5%) belonging to this category.
| Income Bracket | # Families | % Families |
| Less than $10,000 | 9 | 1.5% |
| $10,000 to $14,999 | 11 | 1.8% |
| $15,000 to $24,999 | 13 | 2.2% |
| $25,000 to $34,999 | 50 | 8.3% |
| $35,000 to $49,999 | 45 | 7.5% |
| $50,000 to $74,999 | 40 | 6.6% |
| $75,000 to $99,999 | 45 | 7.5% |
| $100,000 to $149,999 | 161 | 26.7% |
| $150,000 to $199,999 | 122 | 20.3% |
| $200,000+ | 106 | 17.6% |
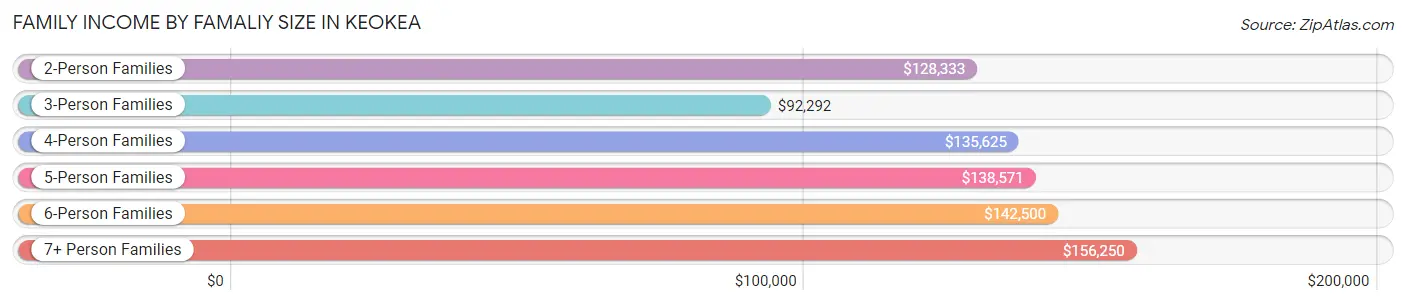
Family Income by Famaliy Size in Keokea
7+ person families (33 | 5.5%) account for the highest median family income in Keokea with $156,250 per family, while 2-person families (208 | 34.5%) have the highest median income of $64,166 per family member.
| Income Bracket | # Families | Median Income |
| 2-Person Families | 208 (34.5%) | $128,333 |
| 3-Person Families | 93 (15.4%) | $92,292 |
| 4-Person Families | 138 (22.9%) | $135,625 |
| 5-Person Families | 92 (15.3%) | $138,571 |
| 6-Person Families | 38 (6.3%) | $142,500 |
| 7+ Person Families | 33 (5.5%) | $156,250 |
| Total | 602 (100.0%) | $128,333 |
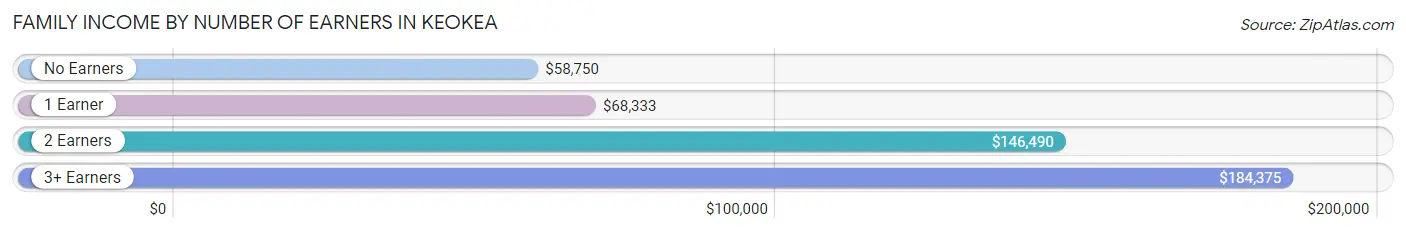
Family Income by Number of Earners in Keokea
The median family income in Keokea is $128,333, with families comprising 3+ earners (101) having the highest median family income of $184,375, while families with no earners (66) have the lowest median family income of $58,750, accounting for 16.8% and 11.0% of families, respectively.
| Number of Earners | # Families | Median Income |
| No Earners | 66 (11.0%) | $58,750 |
| 1 Earner | 164 (27.2%) | $68,333 |
| 2 Earners | 271 (45.0%) | $146,490 |
| 3+ Earners | 101 (16.8%) | $184,375 |
| Total | 602 (100.0%) | $128,333 |
Household Income in Keokea
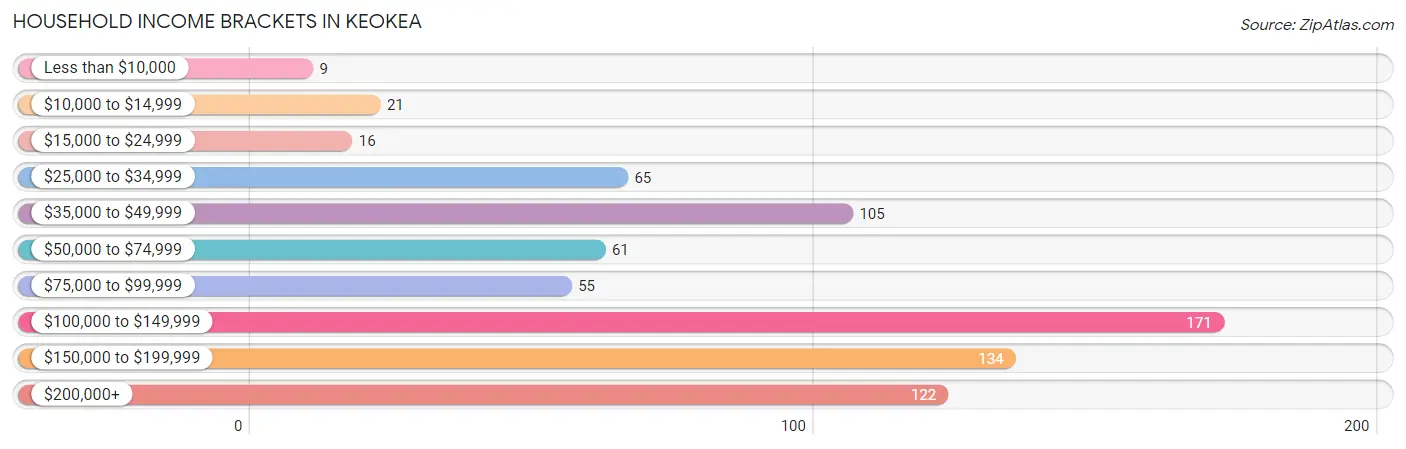
Household Income Brackets in Keokea
With 171 households falling in the category, the $100,000 to $149,999 income range is the most frequent in Keokea, accounting for 22.5% of all households. In contrast, only 9 households (1.2%) fall into the less than $10,000 income bracket, making it the least populous group.
| Income Bracket | # Households | % Households |
| Less than $10,000 | 9 | 1.2% |
| $10,000 to $14,999 | 21 | 2.8% |
| $15,000 to $24,999 | 16 | 2.1% |
| $25,000 to $34,999 | 65 | 8.6% |
| $35,000 to $49,999 | 105 | 13.8% |
| $50,000 to $74,999 | 61 | 8.0% |
| $75,000 to $99,999 | 55 | 7.2% |
| $100,000 to $149,999 | 171 | 22.5% |
| $150,000 to $199,999 | 134 | 17.7% |
| $200,000+ | 122 | 16.1% |
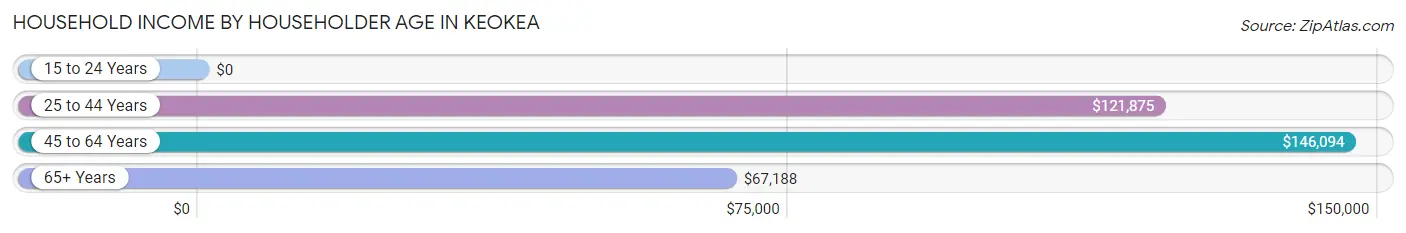
Household Income by Householder Age in Keokea
The median household income in Keokea is $113,450, with the highest median household income of $146,094 found in the 45 to 64 years age bracket for the primary householder. A total of 288 households (37.9%) fall into this category. Meanwhile, the 15 to 24 years age bracket for the primary householder has the lowest median household income of $0, with 1 households (0.1%) in this group.
| Income Bracket | # Households | Median Income |
| 15 to 24 Years | 1 (0.1%) | $0 |
| 25 to 44 Years | 227 (29.9%) | $121,875 |
| 45 to 64 Years | 288 (37.9%) | $146,094 |
| 65+ Years | 243 (32.0%) | $67,188 |
| Total | 759 (100.0%) | $113,450 |
Poverty in Keokea
Income Below Poverty by Sex and Age in Keokea
With 11.8% poverty level for males and 10.6% for females among the residents of Keokea, 15 year old males and under 5 year old females are the most vulnerable to poverty, with 9 males (42.9%) and 25 females (33.8%) in their respective age groups living below the poverty level.
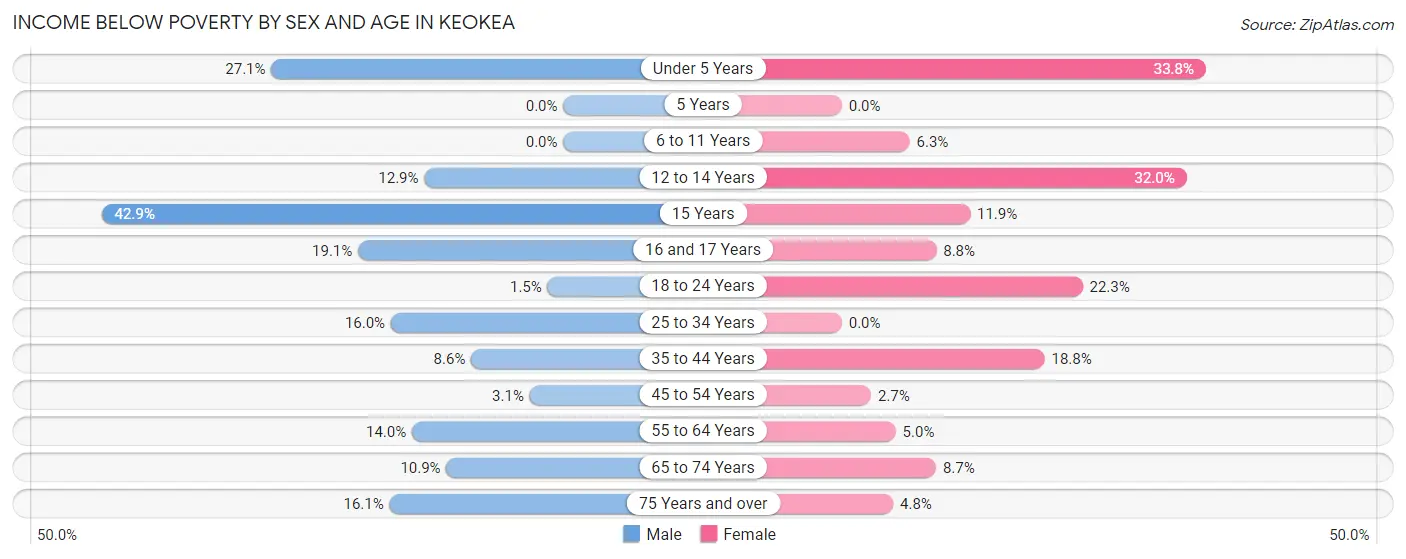
| Age Bracket | Male | Female |
| Under 5 Years | 42 (27.1%) | 25 (33.8%) |
| 5 Years | 0 (0.0%) | 0 (0.0%) |
| 6 to 11 Years | 0 (0.0%) | 9 (6.3%) |
| 12 to 14 Years | 16 (12.9%) | 16 (32.0%) |
| 15 Years | 9 (42.9%) | 5 (11.9%) |
| 16 and 17 Years | 8 (19.1%) | 5 (8.8%) |
| 18 to 24 Years | 2 (1.5%) | 21 (22.3%) |
| 25 to 34 Years | 20 (16.0%) | 0 (0.0%) |
| 35 to 44 Years | 20 (8.6%) | 35 (18.8%) |
| 45 to 54 Years | 4 (3.1%) | 6 (2.7%) |
| 55 to 64 Years | 25 (14.0%) | 7 (5.0%) |
| 65 to 74 Years | 14 (10.8%) | 16 (8.7%) |
| 75 Years and over | 10 (16.1%) | 3 (4.8%) |
| Total | 170 (11.8%) | 148 (10.6%) |
Income Above Poverty by Sex and Age in Keokea
According to the poverty statistics in Keokea, males aged 6 to 11 years and females aged 5 years are the age groups that are most secure financially, with 100.0% of males and 100.0% of females in these age groups living above the poverty line.
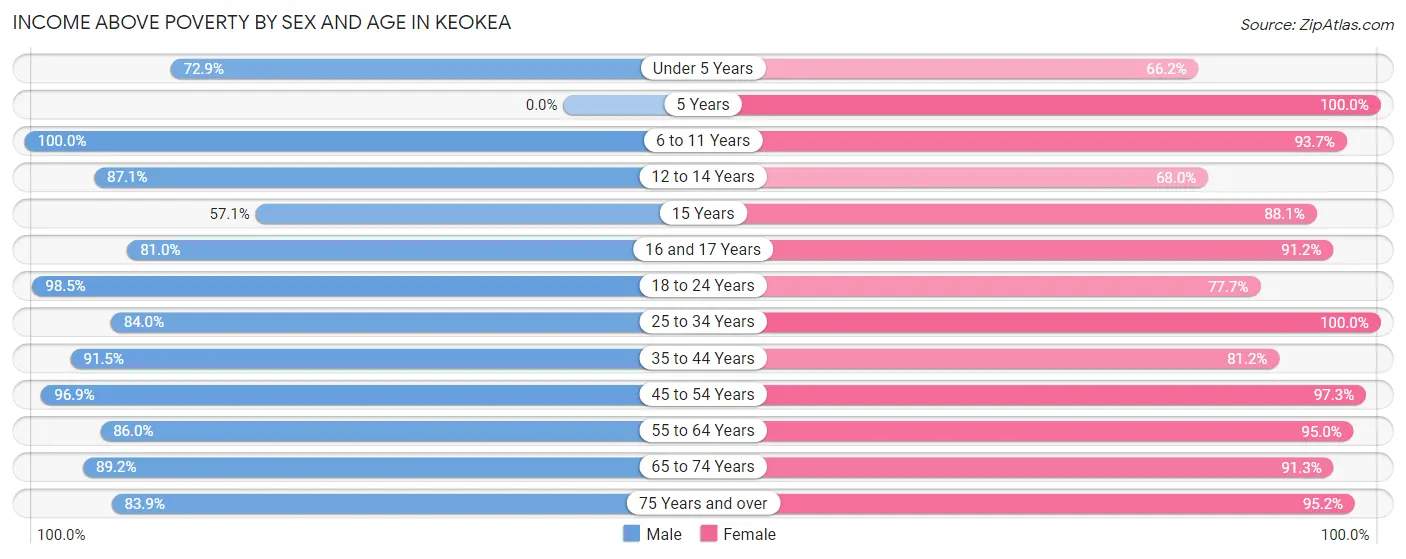
| Age Bracket | Male | Female |
| Under 5 Years | 113 (72.9%) | 49 (66.2%) |
| 5 Years | 0 (0.0%) | 13 (100.0%) |
| 6 to 11 Years | 107 (100.0%) | 134 (93.7%) |
| 12 to 14 Years | 108 (87.1%) | 34 (68.0%) |
| 15 Years | 12 (57.1%) | 37 (88.1%) |
| 16 and 17 Years | 34 (80.9%) | 52 (91.2%) |
| 18 to 24 Years | 135 (98.5%) | 73 (77.7%) |
| 25 to 34 Years | 105 (84.0%) | 133 (100.0%) |
| 35 to 44 Years | 214 (91.4%) | 151 (81.2%) |
| 45 to 54 Years | 124 (96.9%) | 215 (97.3%) |
| 55 to 64 Years | 153 (86.0%) | 133 (95.0%) |
| 65 to 74 Years | 115 (89.1%) | 167 (91.3%) |
| 75 Years and over | 52 (83.9%) | 60 (95.2%) |
| Total | 1,272 (88.2%) | 1,251 (89.4%) |
Income Below Poverty Among Married-Couple Families in Keokea
The poverty statistics for married-couple families in Keokea show that 7.2% or 35 of the total 488 families live below the poverty line. Families with 3 or 4 children have the highest poverty rate of 17.7%, comprising of 11 families. On the other hand, families with 5 or more children have the lowest poverty rate of 0.0%, which includes 0 families.
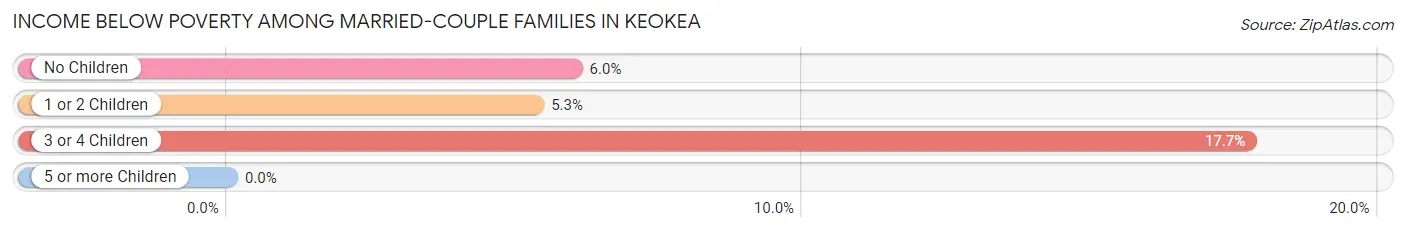
| Children | Above Poverty | Below Poverty |
| No Children | 235 (94.0%) | 15 (6.0%) |
| 1 or 2 Children | 160 (94.7%) | 9 (5.3%) |
| 3 or 4 Children | 51 (82.3%) | 11 (17.7%) |
| 5 or more Children | 7 (100.0%) | 0 (0.0%) |
| Total | 453 (92.8%) | 35 (7.2%) |
Income Below Poverty Among Single-Parent Households in Keokea
According to the poverty data in Keokea, 26.3% or 10 single-father households and 25.0% or 19 single-mother households are living below the poverty line. Among single-father households, those with 1 or 2 children have the highest poverty rate, with 10 households (34.5%) experiencing poverty. Likewise, among single-mother households, those with 3 or 4 children have the highest poverty rate, with 6 households (33.3%) falling below the poverty line.
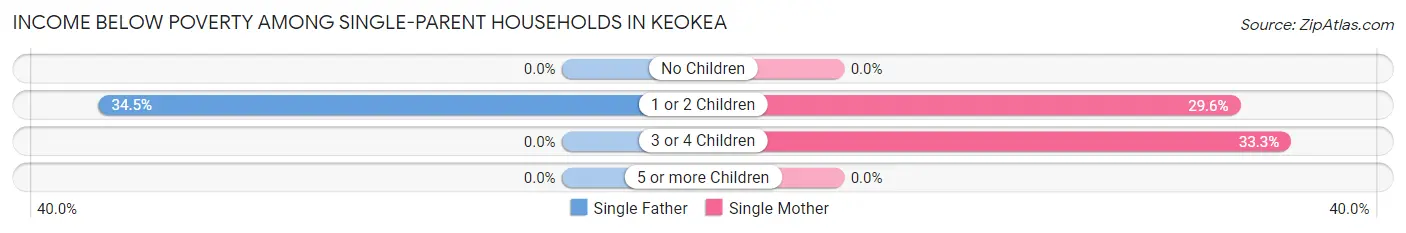
| Children | Single Father | Single Mother |
| No Children | 0 (0.0%) | 0 (0.0%) |
| 1 or 2 Children | 10 (34.5%) | 13 (29.5%) |
| 3 or 4 Children | 0 (0.0%) | 6 (33.3%) |
| 5 or more Children | 0 (0.0%) | 0 (0.0%) |
| Total | 10 (26.3%) | 19 (25.0%) |
Income Below Poverty Among Married-Couple vs Single-Parent Households in Keokea
The poverty data for Keokea shows that 35 of the married-couple family households (7.2%) and 29 of the single-parent households (25.4%) are living below the poverty level. Within the married-couple family households, those with 3 or 4 children have the highest poverty rate, with 11 households (17.7%) falling below the poverty line. Among the single-parent households, those with 3 or 4 children have the highest poverty rate, with 6 household (33.3%) living below poverty.
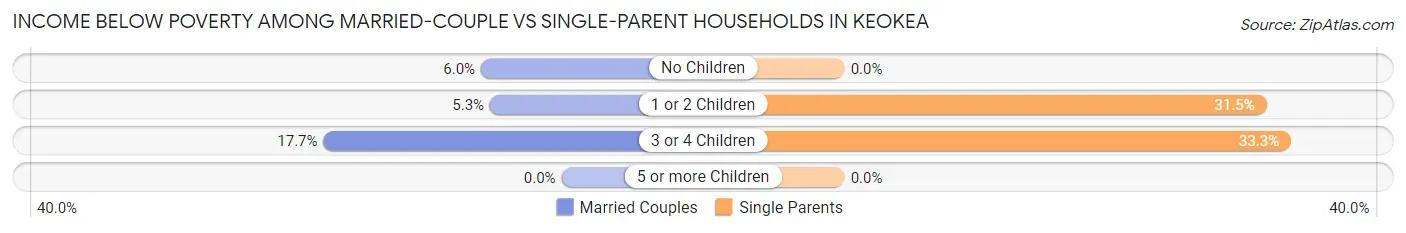
| Children | Married-Couple Families | Single-Parent Households |
| No Children | 15 (6.0%) | 0 (0.0%) |
| 1 or 2 Children | 9 (5.3%) | 23 (31.5%) |
| 3 or 4 Children | 11 (17.7%) | 6 (33.3%) |
| 5 or more Children | 0 (0.0%) | 0 (0.0%) |
| Total | 35 (7.2%) | 29 (25.4%) |
Employment Characteristics in Keokea
Employment by Class of Employer in Keokea
Among the 1,211 employed individuals in Keokea, private company employees (772 | 63.7%), state government employees (119 | 9.8%), and not-for-profit organizations (104 | 8.6%) make up the most common classes of employment.
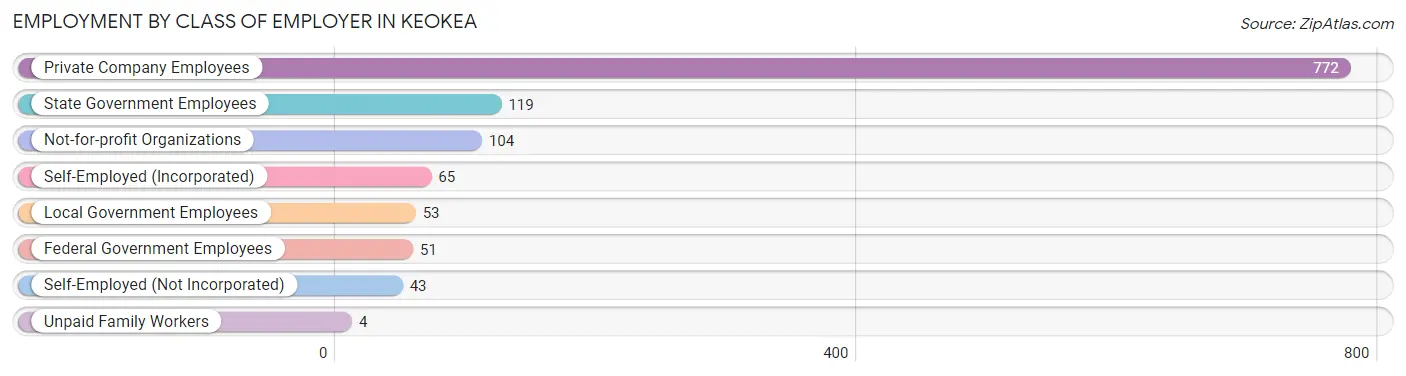
| Employer Class | # Employees | % Employees |
| Private Company Employees | 772 | 63.7% |
| Self-Employed (Incorporated) | 65 | 5.4% |
| Self-Employed (Not Incorporated) | 43 | 3.5% |
| Not-for-profit Organizations | 104 | 8.6% |
| Local Government Employees | 53 | 4.4% |
| State Government Employees | 119 | 9.8% |
| Federal Government Employees | 51 | 4.2% |
| Unpaid Family Workers | 4 | 0.3% |
| Total | 1,211 | 100.0% |
Employment Status by Age in Keokea
According to the labor force statistics for Keokea, out of the total population over 16 years of age (2,131), 65.7% or 1,400 individuals are in the labor force, with 8.7% or 122 of them unemployed. The age group with the highest labor force participation rate is 35 to 44 years, with 89.8% or 377 individuals in the labor force. Within the labor force, the 25 to 29 years age range has the highest percentage of unemployed individuals, with 22.2% or 12 of them being unemployed.
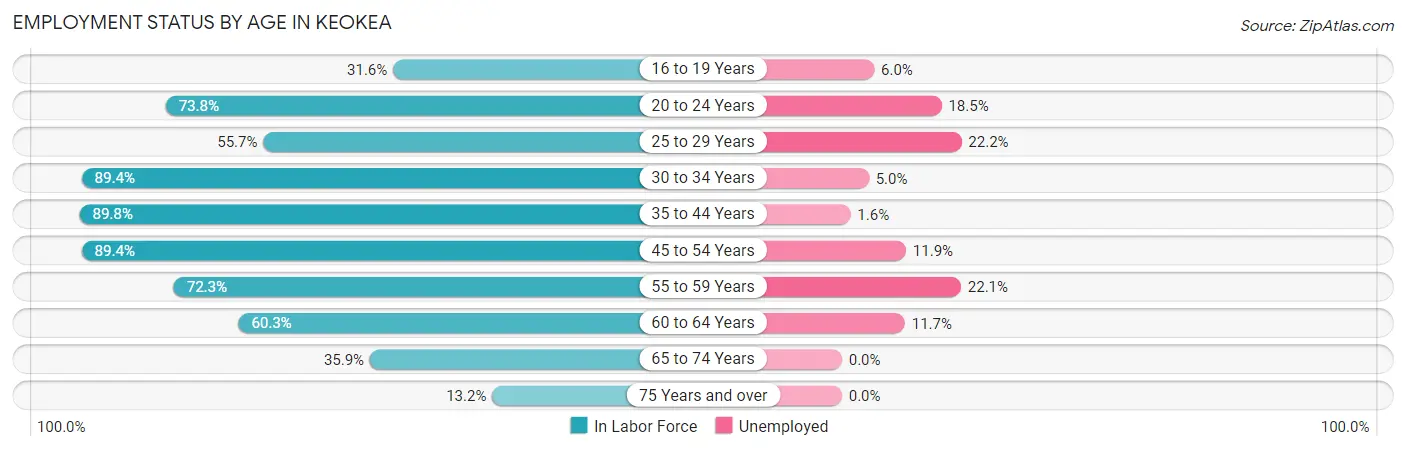
| Age Bracket | In Labor Force | Unemployed |
| 16 to 19 Years | 50 (31.6%) | 3 (6.0%) |
| 20 to 24 Years | 127 (73.8%) | 23 (18.5%) |
| 25 to 29 Years | 54 (55.7%) | 12 (22.2%) |
| 30 to 34 Years | 144 (89.4%) | 7 (5.0%) |
| 35 to 44 Years | 377 (89.8%) | 6 (1.6%) |
| 45 to 54 Years | 312 (89.4%) | 37 (11.9%) |
| 55 to 59 Years | 86 (72.3%) | 19 (22.1%) |
| 60 to 64 Years | 120 (60.3%) | 14 (11.7%) |
| 65 to 74 Years | 112 (35.9%) | 0 (0.0%) |
| 75 Years and over | 19 (13.2%) | 0 (0.0%) |
| Total | 1,400 (65.7%) | 122 (8.7%) |
Employment Status by Educational Attainment in Keokea
According to labor force statistics for Keokea, 81.3% of individuals (1,093) out of the total population between 25 and 64 years of age (1,345) are in the labor force, with 8.8% or 96 of them being unemployed. The group with the highest labor force participation rate are those with the educational attainment of bachelor's degree or higher, with 91.1% or 297 individuals in the labor force. Within the labor force, individuals with less than high school education have the highest percentage of unemployment, with 30.8% or 12 of them being unemployed.
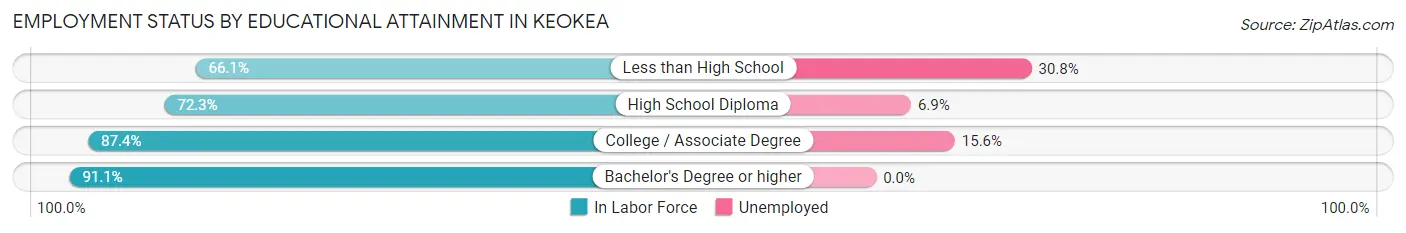
| Educational Attainment | In Labor Force | Unemployed |
| Less than High School | 39 (66.1%) | 18 (30.8%) |
| High School Diploma | 395 (72.3%) | 38 (6.9%) |
| College / Associate Degree | 362 (87.4%) | 65 (15.6%) |
| Bachelor's Degree or higher | 297 (91.1%) | 0 (0.0%) |
| Total | 1,093 (81.3%) | 118 (8.8%) |
Employment Occupations by Sex in Keokea
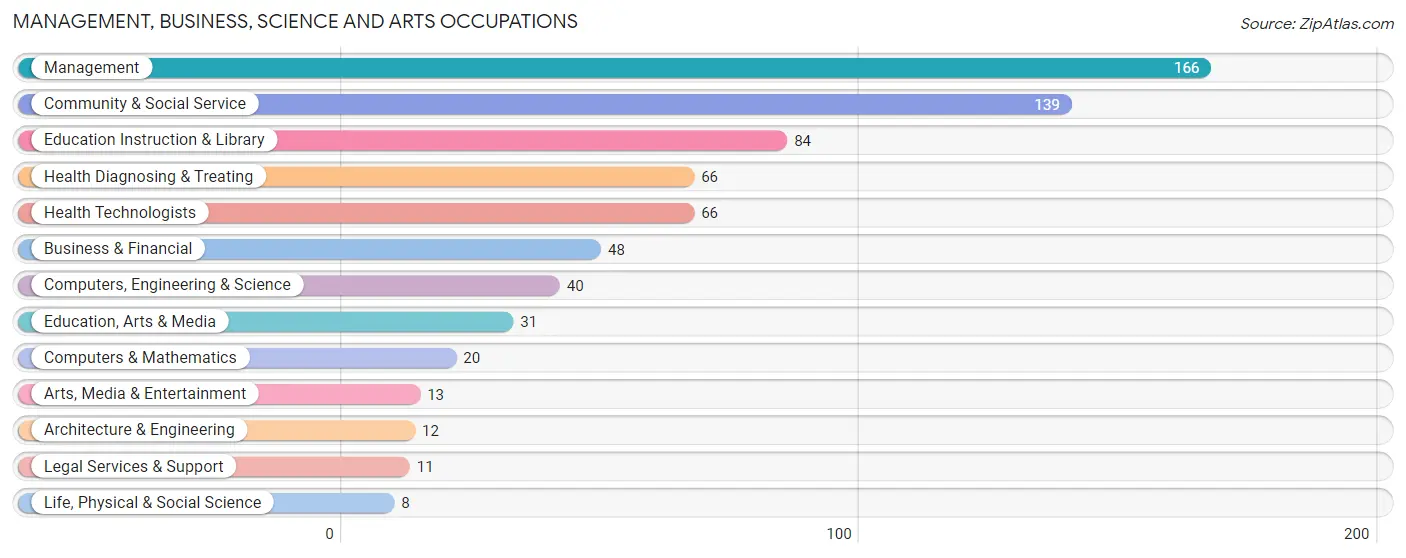
Management, Business, Science and Arts Occupations
The most common Management, Business, Science and Arts occupations in Keokea are Management (166 | 13.1%), Community & Social Service (139 | 11.0%), Education Instruction & Library (84 | 6.6%), Health Diagnosing & Treating (66 | 5.2%), and Health Technologists (66 | 5.2%).
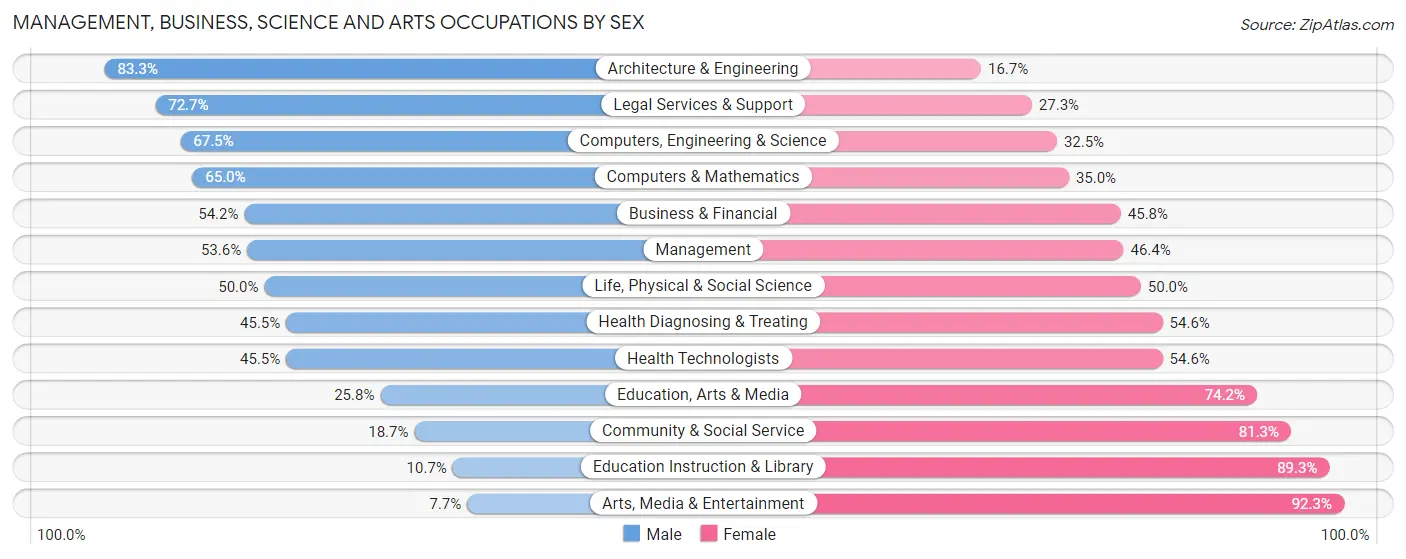
Management, Business, Science and Arts Occupations by Sex
Within the Management, Business, Science and Arts occupations in Keokea, the most male-oriented occupations are Architecture & Engineering (83.3%), Legal Services & Support (72.7%), and Computers, Engineering & Science (67.5%), while the most female-oriented occupations are Arts, Media & Entertainment (92.3%), Education Instruction & Library (89.3%), and Community & Social Service (81.3%).
| Occupation | Male | Female |
| Management | 89 (53.6%) | 77 (46.4%) |
| Business & Financial | 26 (54.2%) | 22 (45.8%) |
| Computers, Engineering & Science | 27 (67.5%) | 13 (32.5%) |
| Computers & Mathematics | 13 (65.0%) | 7 (35.0%) |
| Architecture & Engineering | 10 (83.3%) | 2 (16.7%) |
| Life, Physical & Social Science | 4 (50.0%) | 4 (50.0%) |
| Community & Social Service | 26 (18.7%) | 113 (81.3%) |
| Education, Arts & Media | 8 (25.8%) | 23 (74.2%) |
| Legal Services & Support | 8 (72.7%) | 3 (27.3%) |
| Education Instruction & Library | 9 (10.7%) | 75 (89.3%) |
| Arts, Media & Entertainment | 1 (7.7%) | 12 (92.3%) |
| Health Diagnosing & Treating | 30 (45.5%) | 36 (54.5%) |
| Health Technologists | 30 (45.5%) | 36 (54.5%) |
| Total (Category) | 198 (43.1%) | 261 (56.9%) |
| Total (Overall) | 649 (51.2%) | 619 (48.8%) |
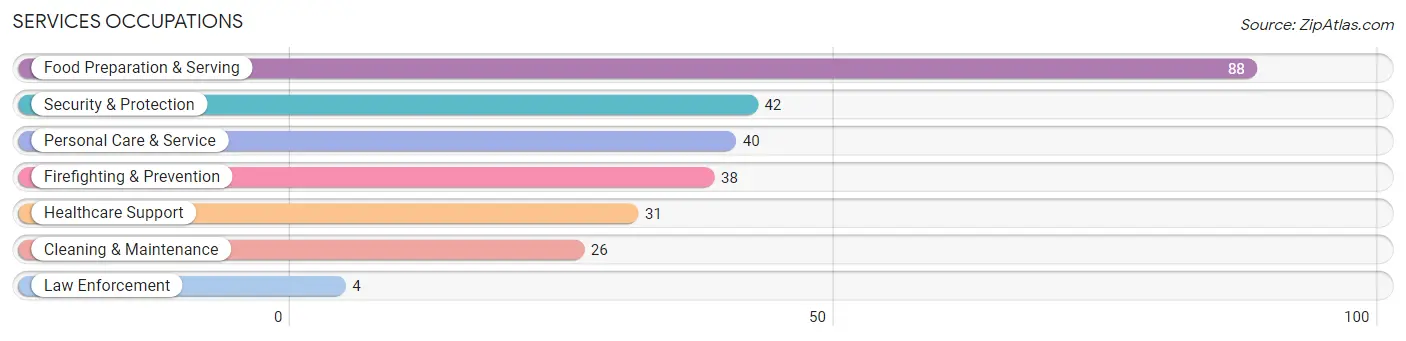
Services Occupations
The most common Services occupations in Keokea are Food Preparation & Serving (88 | 6.9%), Security & Protection (42 | 3.3%), Personal Care & Service (40 | 3.2%), Firefighting & Prevention (38 | 3.0%), and Healthcare Support (31 | 2.4%).
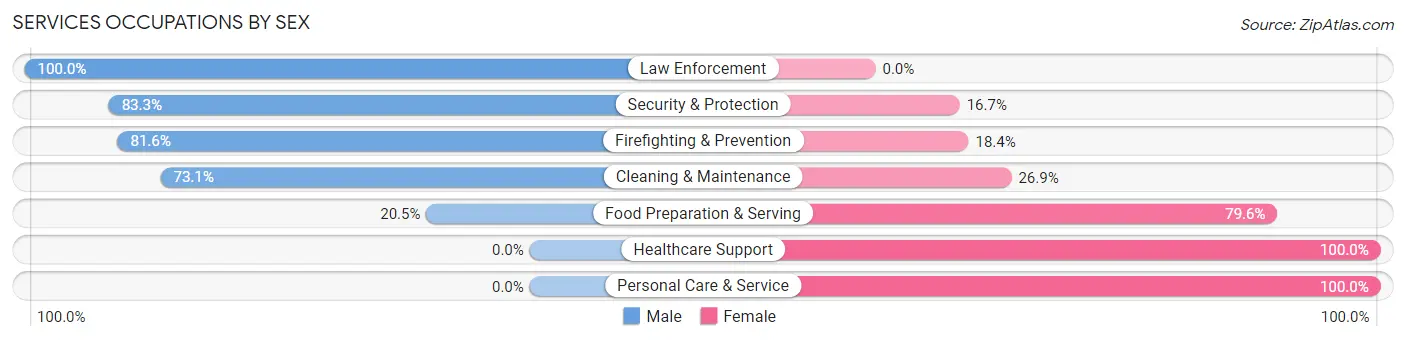
Services Occupations by Sex
Within the Services occupations in Keokea, the most male-oriented occupations are Law Enforcement (100.0%), Security & Protection (83.3%), and Firefighting & Prevention (81.6%), while the most female-oriented occupations are Healthcare Support (100.0%), Personal Care & Service (100.0%), and Food Preparation & Serving (79.5%).
| Occupation | Male | Female |
| Healthcare Support | 0 (0.0%) | 31 (100.0%) |
| Security & Protection | 35 (83.3%) | 7 (16.7%) |
| Firefighting & Prevention | 31 (81.6%) | 7 (18.4%) |
| Law Enforcement | 4 (100.0%) | 0 (0.0%) |
| Food Preparation & Serving | 18 (20.4%) | 70 (79.5%) |
| Cleaning & Maintenance | 19 (73.1%) | 7 (26.9%) |
| Personal Care & Service | 0 (0.0%) | 40 (100.0%) |
| Total (Category) | 72 (31.7%) | 155 (68.3%) |
| Total (Overall) | 649 (51.2%) | 619 (48.8%) |
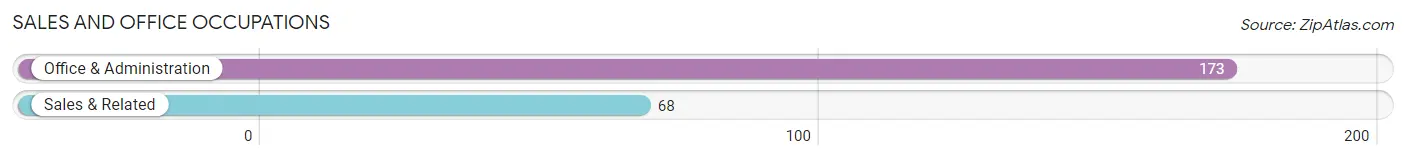
Sales and Office Occupations
The most common Sales and Office occupations in Keokea are Office & Administration (173 | 13.6%), and Sales & Related (68 | 5.4%).
Sales and Office Occupations by Sex
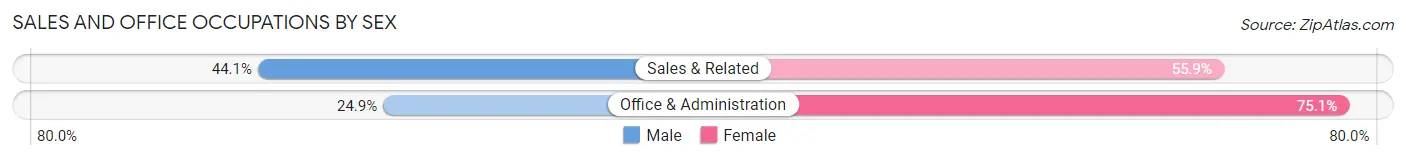
| Occupation | Male | Female |
| Sales & Related | 30 (44.1%) | 38 (55.9%) |
| Office & Administration | 43 (24.9%) | 130 (75.1%) |
| Total (Category) | 73 (30.3%) | 168 (69.7%) |
| Total (Overall) | 649 (51.2%) | 619 (48.8%) |
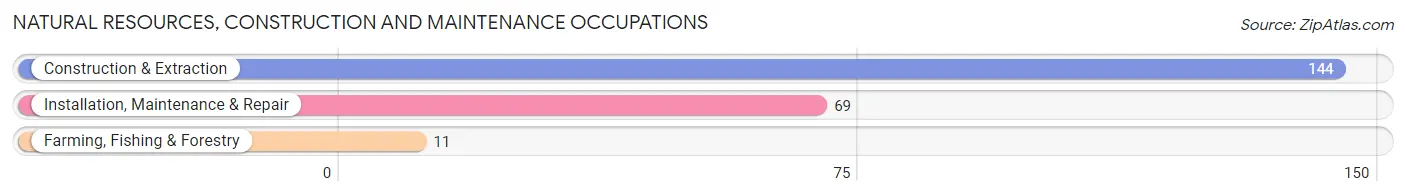
Natural Resources, Construction and Maintenance Occupations
The most common Natural Resources, Construction and Maintenance occupations in Keokea are Construction & Extraction (144 | 11.4%), Installation, Maintenance & Repair (69 | 5.4%), and Farming, Fishing & Forestry (11 | 0.9%).
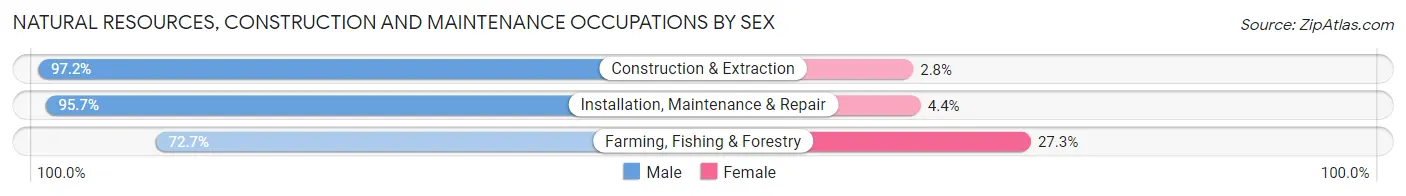
Natural Resources, Construction and Maintenance Occupations by Sex
| Occupation | Male | Female |
| Farming, Fishing & Forestry | 8 (72.7%) | 3 (27.3%) |
| Construction & Extraction | 140 (97.2%) | 4 (2.8%) |
| Installation, Maintenance & Repair | 66 (95.7%) | 3 (4.3%) |
| Total (Category) | 214 (95.5%) | 10 (4.5%) |
| Total (Overall) | 649 (51.2%) | 619 (48.8%) |
Production, Transportation and Moving Occupations
The most common Production, Transportation and Moving occupations in Keokea are Material Moving (63 | 5.0%), Transportation (38 | 3.0%), and Production (16 | 1.3%).
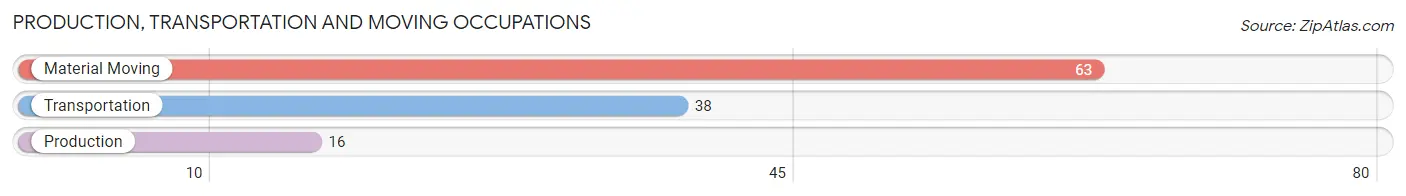
Production, Transportation and Moving Occupations by Sex
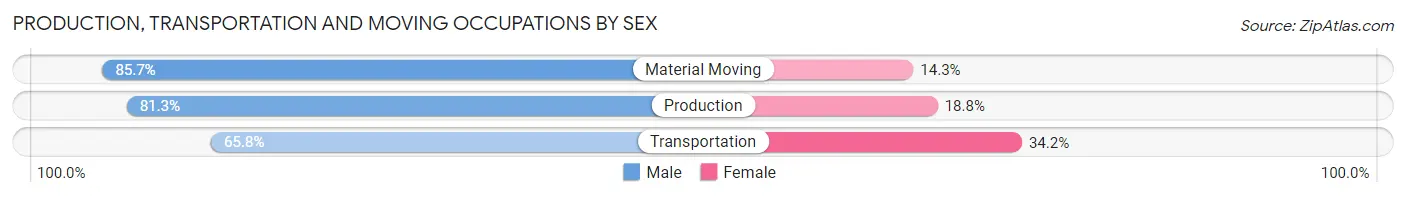
| Occupation | Male | Female |
| Production | 13 (81.2%) | 3 (18.8%) |
| Transportation | 25 (65.8%) | 13 (34.2%) |
| Material Moving | 54 (85.7%) | 9 (14.3%) |
| Total (Category) | 92 (78.6%) | 25 (21.4%) |
| Total (Overall) | 649 (51.2%) | 619 (48.8%) |
Employment Industries by Sex in Keokea
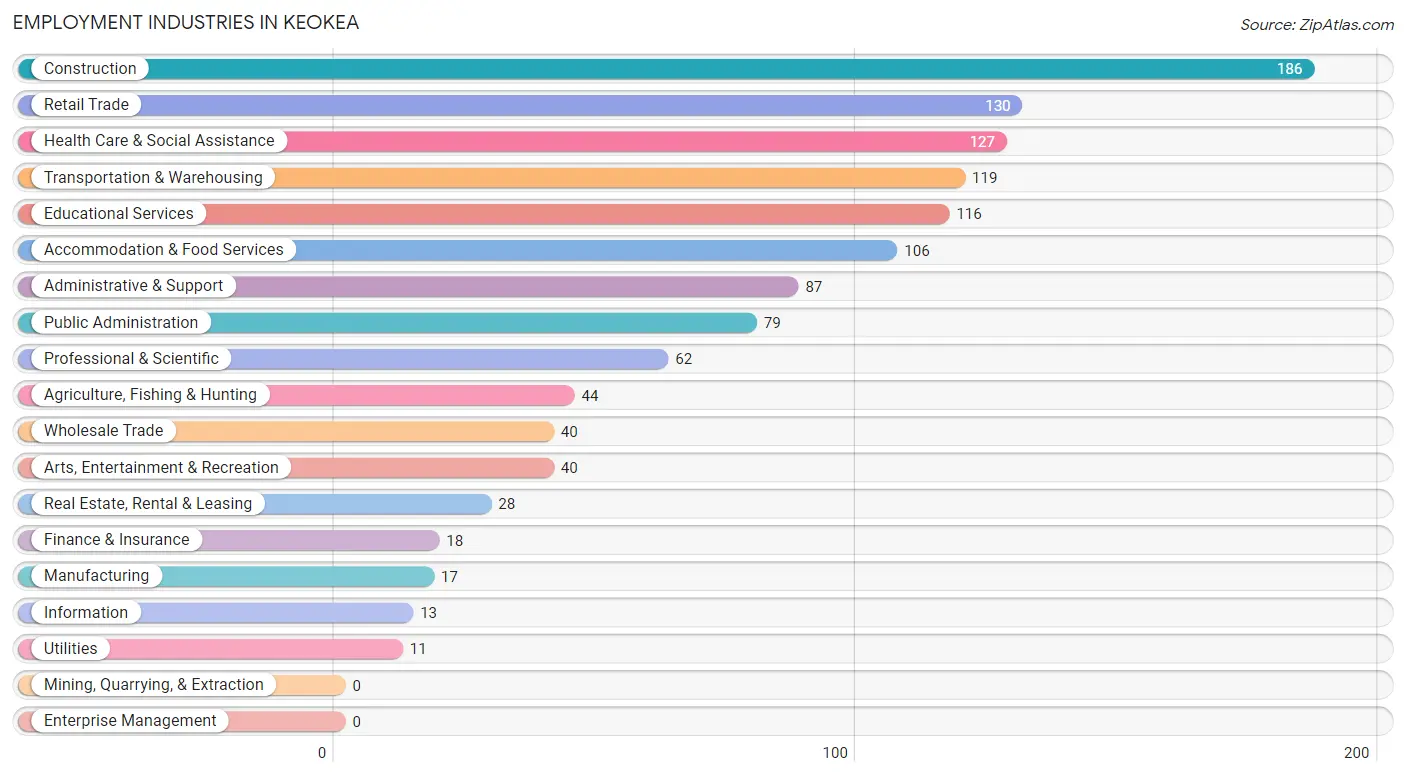
Employment Industries in Keokea
The major employment industries in Keokea include Construction (186 | 14.7%), Retail Trade (130 | 10.2%), Health Care & Social Assistance (127 | 10.0%), Transportation & Warehousing (119 | 9.4%), and Educational Services (116 | 9.1%).
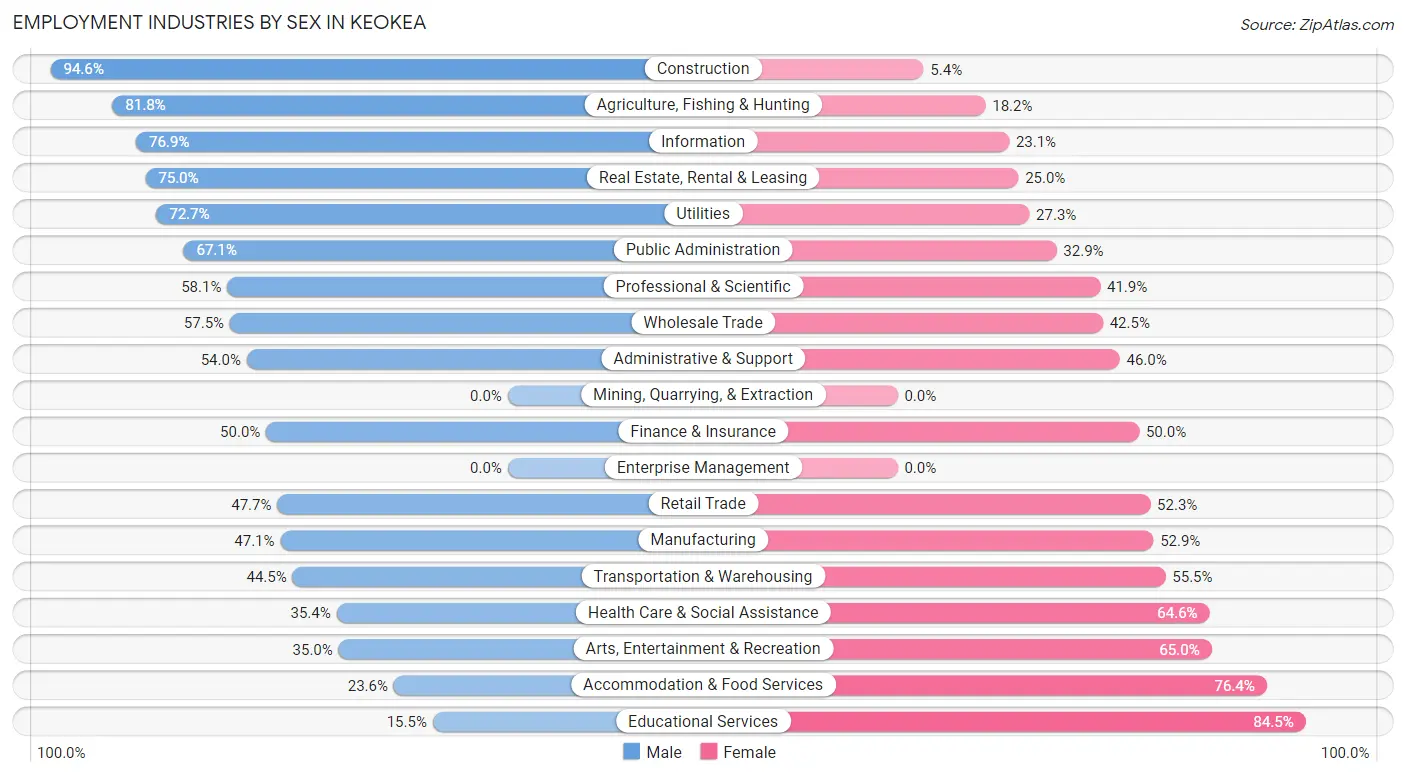
Employment Industries by Sex in Keokea
The Keokea industries that see more men than women are Construction (94.6%), Agriculture, Fishing & Hunting (81.8%), and Information (76.9%), whereas the industries that tend to have a higher number of women are Educational Services (84.5%), Accommodation & Food Services (76.4%), and Arts, Entertainment & Recreation (65.0%).
| Industry | Male | Female |
| Agriculture, Fishing & Hunting | 36 (81.8%) | 8 (18.2%) |
| Mining, Quarrying, & Extraction | 0 (0.0%) | 0 (0.0%) |
| Construction | 176 (94.6%) | 10 (5.4%) |
| Manufacturing | 8 (47.1%) | 9 (52.9%) |
| Wholesale Trade | 23 (57.5%) | 17 (42.5%) |
| Retail Trade | 62 (47.7%) | 68 (52.3%) |
| Transportation & Warehousing | 53 (44.5%) | 66 (55.5%) |
| Utilities | 8 (72.7%) | 3 (27.3%) |
| Information | 10 (76.9%) | 3 (23.1%) |
| Finance & Insurance | 9 (50.0%) | 9 (50.0%) |
| Real Estate, Rental & Leasing | 21 (75.0%) | 7 (25.0%) |
| Professional & Scientific | 36 (58.1%) | 26 (41.9%) |
| Enterprise Management | 0 (0.0%) | 0 (0.0%) |
| Administrative & Support | 47 (54.0%) | 40 (46.0%) |
| Educational Services | 18 (15.5%) | 98 (84.5%) |
| Health Care & Social Assistance | 45 (35.4%) | 82 (64.6%) |
| Arts, Entertainment & Recreation | 14 (35.0%) | 26 (65.0%) |
| Accommodation & Food Services | 25 (23.6%) | 81 (76.4%) |
| Public Administration | 53 (67.1%) | 26 (32.9%) |
| Total | 649 (51.2%) | 619 (48.8%) |
Education in Keokea
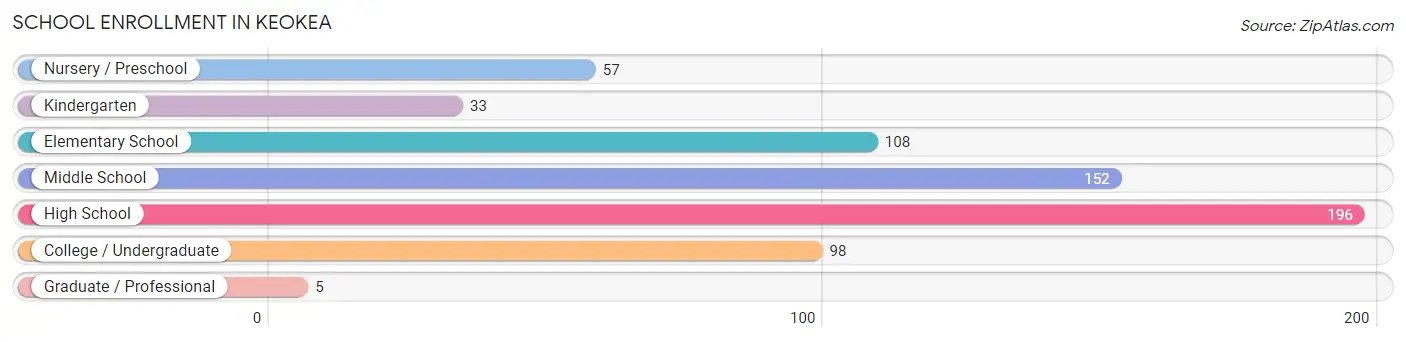
School Enrollment in Keokea
The most common levels of schooling among the 649 students in Keokea are high school (196 | 30.2%), middle school (152 | 23.4%), and elementary school (108 | 16.6%).
| School Level | # Students | % Students |
| Nursery / Preschool | 57 | 8.8% |
| Kindergarten | 33 | 5.1% |
| Elementary School | 108 | 16.6% |
| Middle School | 152 | 23.4% |
| High School | 196 | 30.2% |
| College / Undergraduate | 98 | 15.1% |
| Graduate / Professional | 5 | 0.8% |
| Total | 649 | 100.0% |
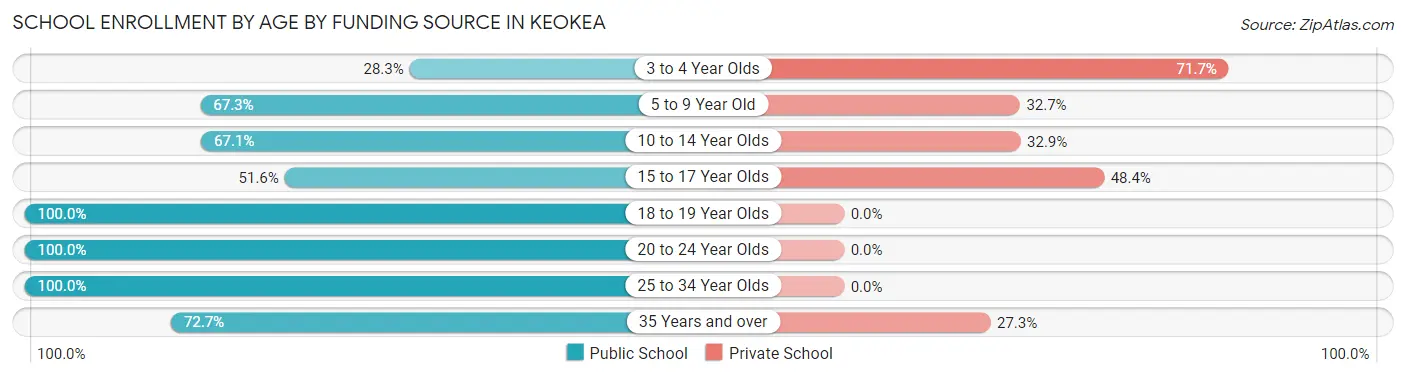
School Enrollment by Age by Funding Source in Keokea
Out of a total of 649 students who are enrolled in schools in Keokea, 228 (35.1%) attend a private institution, while the remaining 421 (64.9%) are enrolled in public schools. The age group of 3 to 4 year olds has the highest likelihood of being enrolled in private schools, with 38 (71.7% in the age bracket) enrolled. Conversely, the age group of 18 to 19 year olds has the lowest likelihood of being enrolled in a private school, with 19 (100.0% in the age bracket) attending a public institution.
| Age Bracket | Public School | Private School |
| 3 to 4 Year Olds | 15 (28.3%) | 38 (71.7%) |
| 5 to 9 Year Old | 76 (67.3%) | 37 (32.7%) |
| 10 to 14 Year Olds | 143 (67.1%) | 70 (32.9%) |
| 15 to 17 Year Olds | 82 (51.6%) | 77 (48.4%) |
| 18 to 19 Year Olds | 19 (100.0%) | 0 (0.0%) |
| 20 to 24 Year Olds | 53 (100.0%) | 0 (0.0%) |
| 25 to 34 Year Olds | 17 (100.0%) | 0 (0.0%) |
| 35 Years and over | 16 (72.7%) | 6 (27.3%) |
| Total | 421 (64.9%) | 228 (35.1%) |
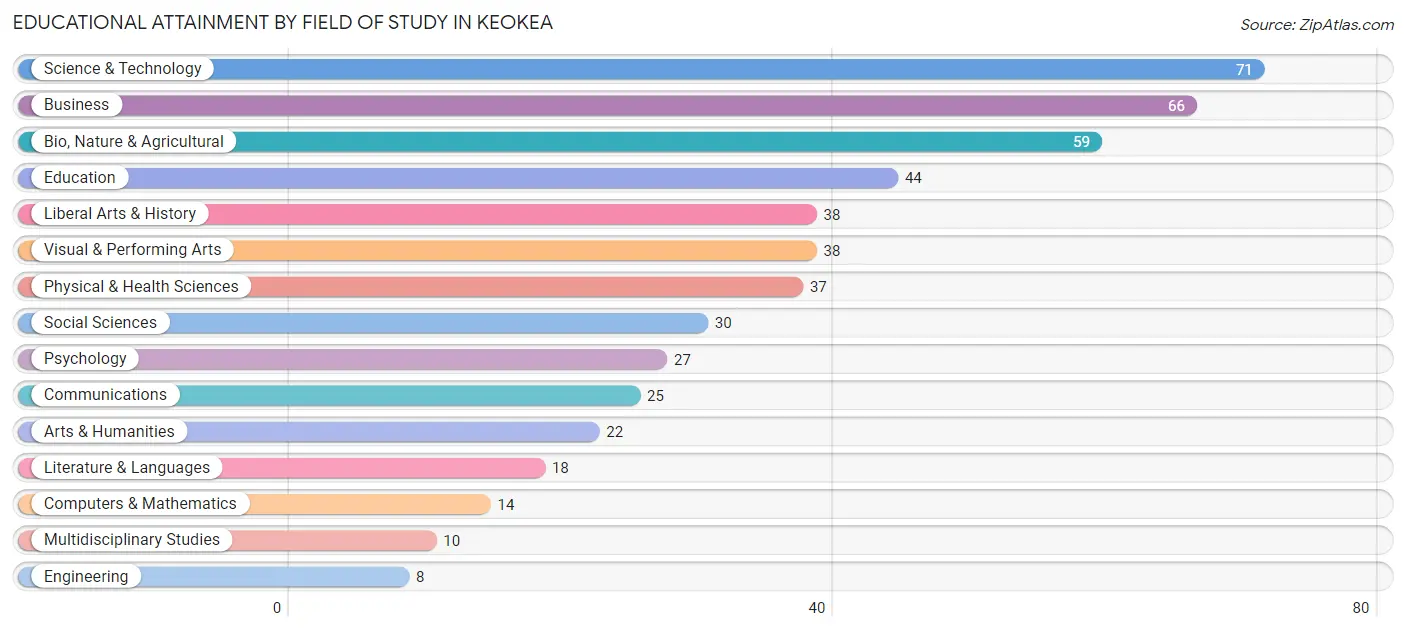
Educational Attainment by Field of Study in Keokea
Science & technology (71 | 14.0%), business (66 | 13.0%), bio, nature & agricultural (59 | 11.6%), education (44 | 8.7%), and liberal arts & history (38 | 7.5%) are the most common fields of study among 507 individuals in Keokea who have obtained a bachelor's degree or higher.
| Field of Study | # Graduates | % Graduates |
| Computers & Mathematics | 14 | 2.8% |
| Bio, Nature & Agricultural | 59 | 11.6% |
| Physical & Health Sciences | 37 | 7.3% |
| Psychology | 27 | 5.3% |
| Social Sciences | 30 | 5.9% |
| Engineering | 8 | 1.6% |
| Multidisciplinary Studies | 10 | 2.0% |
| Science & Technology | 71 | 14.0% |
| Business | 66 | 13.0% |
| Education | 44 | 8.7% |
| Literature & Languages | 18 | 3.5% |
| Liberal Arts & History | 38 | 7.5% |
| Visual & Performing Arts | 38 | 7.5% |
| Communications | 25 | 4.9% |
| Arts & Humanities | 22 | 4.3% |
| Total | 507 | 100.0% |
Transportation & Commute in Keokea
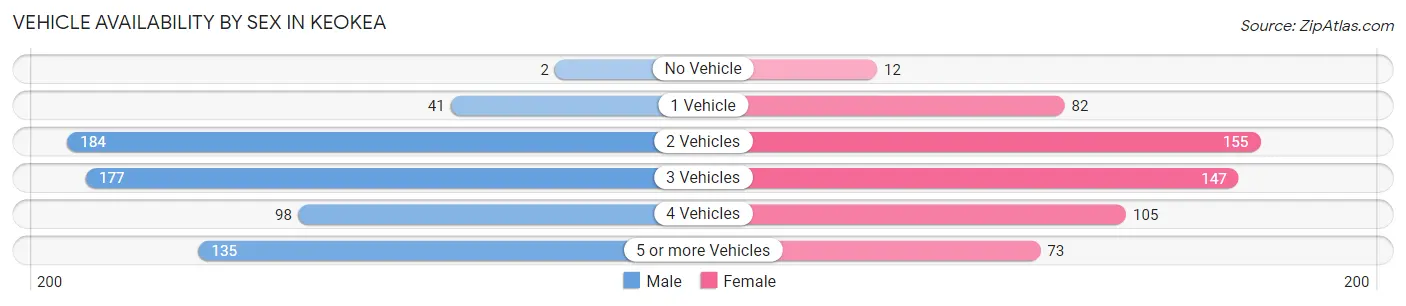
Vehicle Availability by Sex in Keokea
The most prevalent vehicle ownership categories in Keokea are males with 2 vehicles (184, accounting for 28.9%) and females with 2 vehicles (155, making up 32.1%).
| Vehicles Available | Male | Female |
| No Vehicle | 2 (0.3%) | 12 (2.1%) |
| 1 Vehicle | 41 (6.4%) | 82 (14.3%) |
| 2 Vehicles | 184 (28.9%) | 155 (27.0%) |
| 3 Vehicles | 177 (27.8%) | 147 (25.6%) |
| 4 Vehicles | 98 (15.4%) | 105 (18.3%) |
| 5 or more Vehicles | 135 (21.2%) | 73 (12.7%) |
| Total | 637 (100.0%) | 574 (100.0%) |
Commute Time in Keokea
The most frequently occuring commute durations in Keokea are 30 to 34 minutes (288 commuters, 25.2%), 45 to 59 minutes (240 commuters, 21.0%), and 40 to 44 minutes (187 commuters, 16.4%).
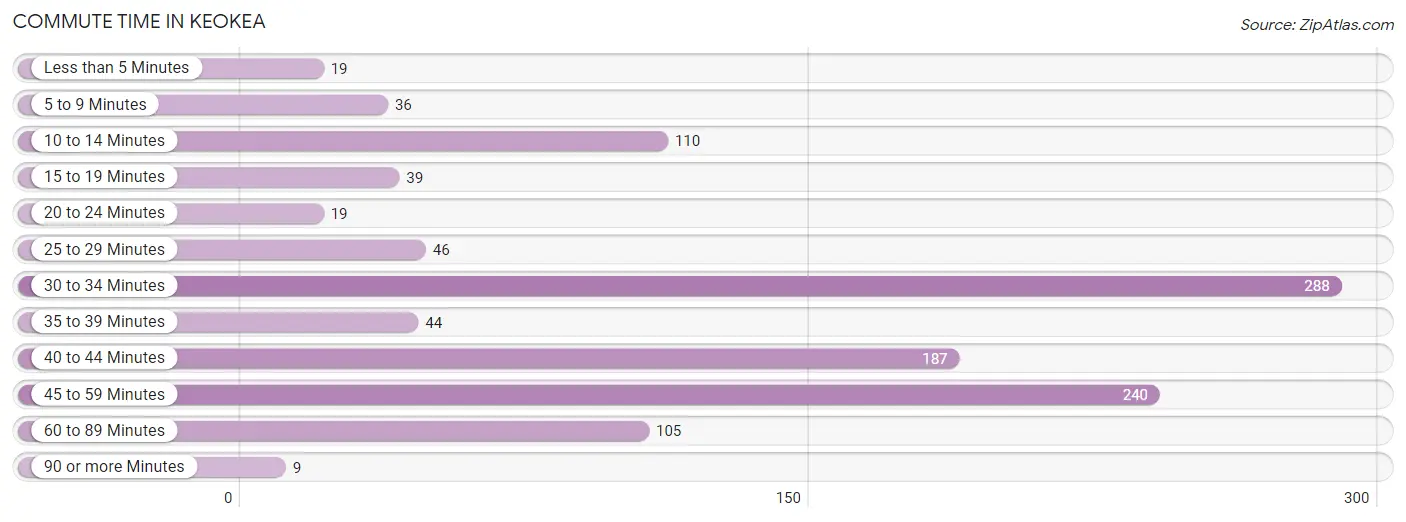
| Commute Time | # Commuters | % Commuters |
| Less than 5 Minutes | 19 | 1.7% |
| 5 to 9 Minutes | 36 | 3.2% |
| 10 to 14 Minutes | 110 | 9.6% |
| 15 to 19 Minutes | 39 | 3.4% |
| 20 to 24 Minutes | 19 | 1.7% |
| 25 to 29 Minutes | 46 | 4.0% |
| 30 to 34 Minutes | 288 | 25.2% |
| 35 to 39 Minutes | 44 | 3.8% |
| 40 to 44 Minutes | 187 | 16.4% |
| 45 to 59 Minutes | 240 | 21.0% |
| 60 to 89 Minutes | 105 | 9.2% |
| 90 or more Minutes | 9 | 0.8% |
Commute Time by Sex in Keokea
The most common commute times in Keokea are 30 to 34 minutes (191 commuters, 32.1%) for males and 45 to 59 minutes (169 commuters, 30.9%) for females.
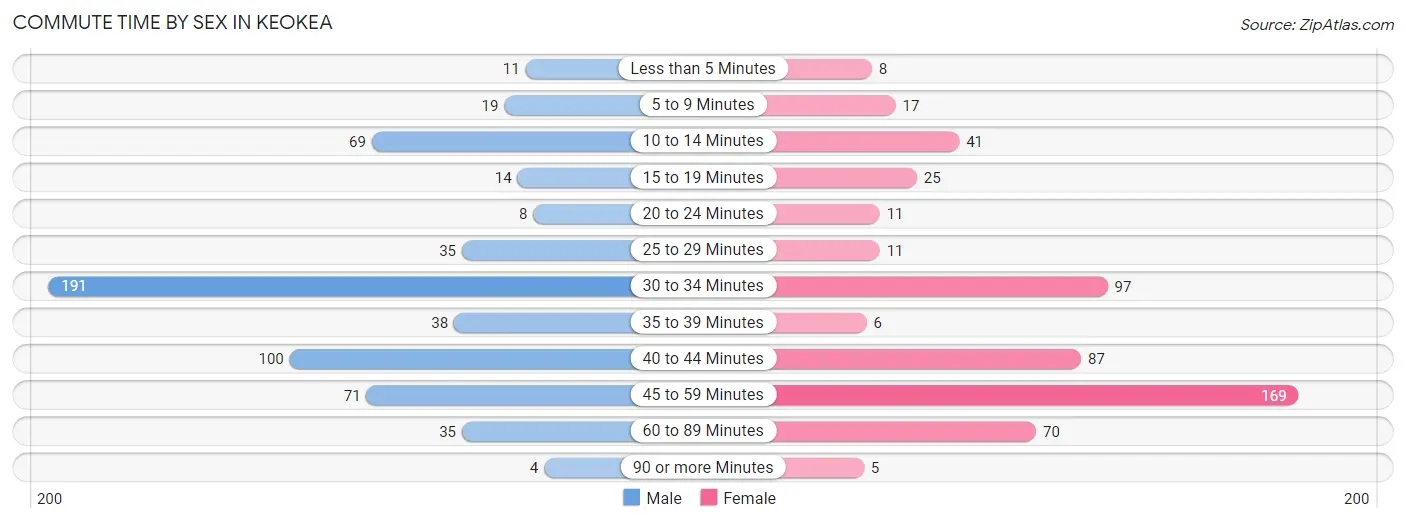
| Commute Time | Male | Female |
| Less than 5 Minutes | 11 (1.8%) | 8 (1.5%) |
| 5 to 9 Minutes | 19 (3.2%) | 17 (3.1%) |
| 10 to 14 Minutes | 69 (11.6%) | 41 (7.5%) |
| 15 to 19 Minutes | 14 (2.4%) | 25 (4.6%) |
| 20 to 24 Minutes | 8 (1.3%) | 11 (2.0%) |
| 25 to 29 Minutes | 35 (5.9%) | 11 (2.0%) |
| 30 to 34 Minutes | 191 (32.1%) | 97 (17.7%) |
| 35 to 39 Minutes | 38 (6.4%) | 6 (1.1%) |
| 40 to 44 Minutes | 100 (16.8%) | 87 (15.9%) |
| 45 to 59 Minutes | 71 (11.9%) | 169 (30.9%) |
| 60 to 89 Minutes | 35 (5.9%) | 70 (12.8%) |
| 90 or more Minutes | 4 (0.7%) | 5 (0.9%) |
Time of Departure to Work by Sex in Keokea
The most frequent times of departure to work in Keokea are 7:00 AM to 7:29 AM (140, 23.5%) for males and 7:00 AM to 7:29 AM (146, 26.7%) for females.
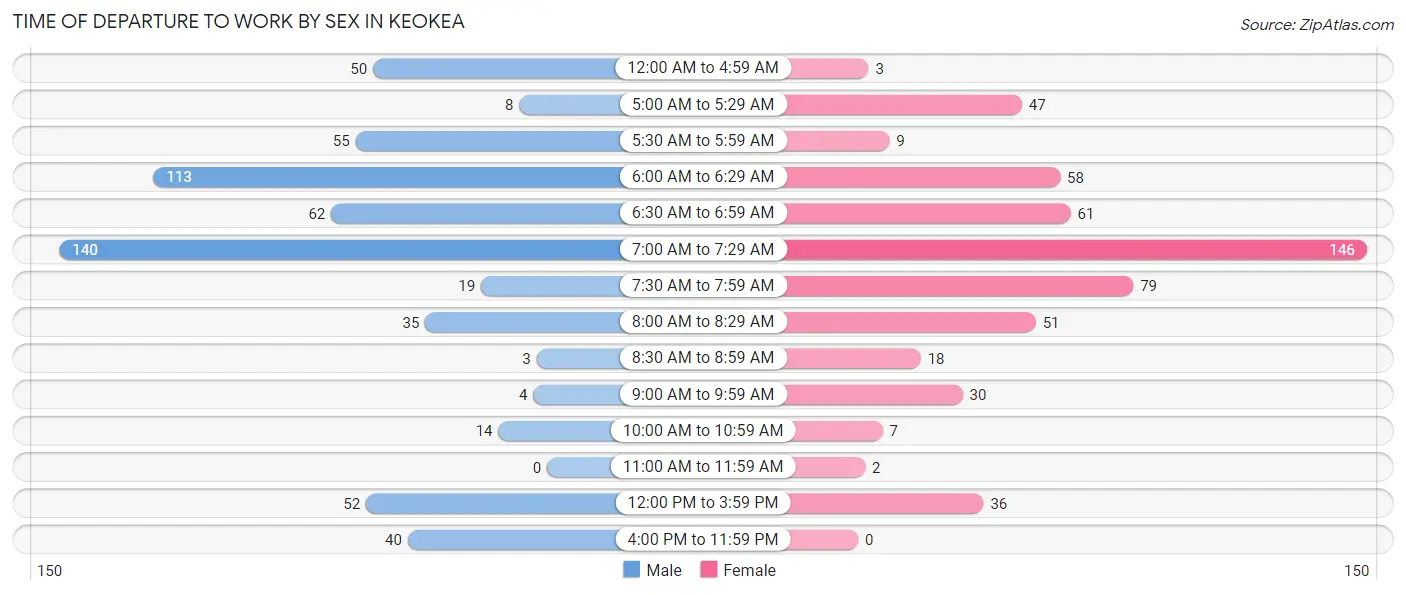
| Time of Departure | Male | Female |
| 12:00 AM to 4:59 AM | 50 (8.4%) | 3 (0.5%) |
| 5:00 AM to 5:29 AM | 8 (1.3%) | 47 (8.6%) |
| 5:30 AM to 5:59 AM | 55 (9.2%) | 9 (1.7%) |
| 6:00 AM to 6:29 AM | 113 (19.0%) | 58 (10.6%) |
| 6:30 AM to 6:59 AM | 62 (10.4%) | 61 (11.2%) |
| 7:00 AM to 7:29 AM | 140 (23.5%) | 146 (26.7%) |
| 7:30 AM to 7:59 AM | 19 (3.2%) | 79 (14.4%) |
| 8:00 AM to 8:29 AM | 35 (5.9%) | 51 (9.3%) |
| 8:30 AM to 8:59 AM | 3 (0.5%) | 18 (3.3%) |
| 9:00 AM to 9:59 AM | 4 (0.7%) | 30 (5.5%) |
| 10:00 AM to 10:59 AM | 14 (2.4%) | 7 (1.3%) |
| 11:00 AM to 11:59 AM | 0 (0.0%) | 2 (0.4%) |
| 12:00 PM to 3:59 PM | 52 (8.7%) | 36 (6.6%) |
| 4:00 PM to 11:59 PM | 40 (6.7%) | 0 (0.0%) |
| Total | 595 (100.0%) | 547 (100.0%) |
Housing Occupancy in Keokea
Occupancy by Ownership in Keokea
Of the total 759 dwellings in Keokea, owner-occupied units account for 632 (83.3%), while renter-occupied units make up 127 (16.7%).
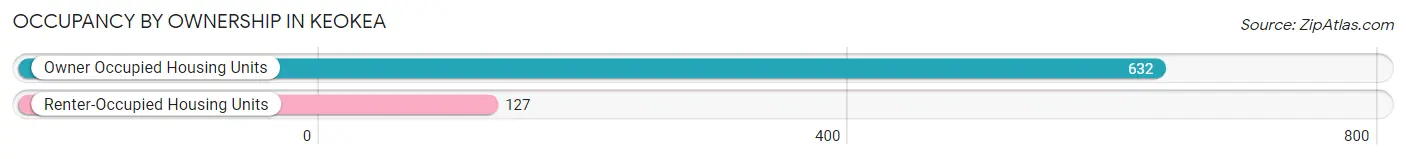
| Occupancy | # Housing Units | % Housing Units |
| Owner Occupied Housing Units | 632 | 83.3% |
| Renter-Occupied Housing Units | 127 | 16.7% |
| Total Occupied Housing Units | 759 | 100.0% |
Occupancy by Household Size in Keokea
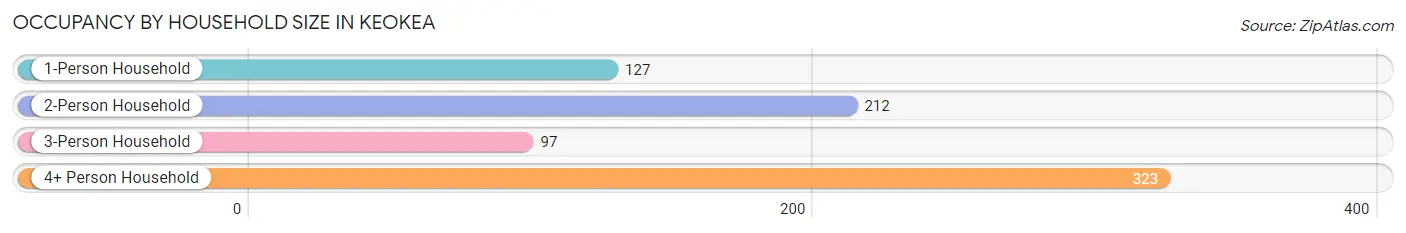
| Household Size | # Housing Units | % Housing Units |
| 1-Person Household | 127 | 16.7% |
| 2-Person Household | 212 | 27.9% |
| 3-Person Household | 97 | 12.8% |
| 4+ Person Household | 323 | 42.6% |
| Total Housing Units | 759 | 100.0% |
Occupancy by Ownership by Household Size in Keokea
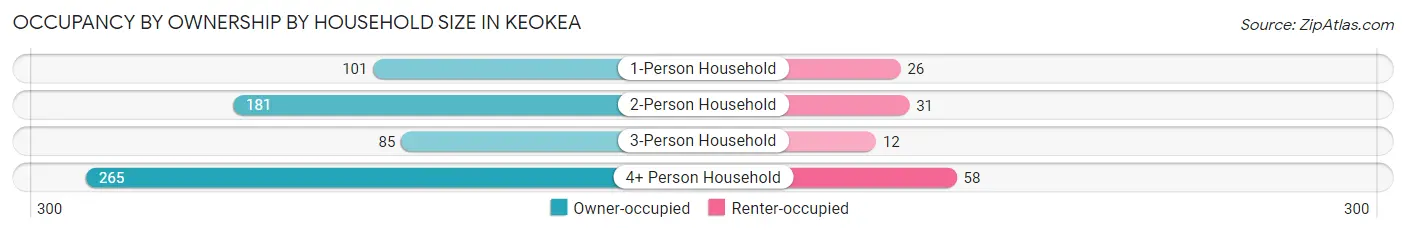
| Household Size | Owner-occupied | Renter-occupied |
| 1-Person Household | 101 (79.5%) | 26 (20.5%) |
| 2-Person Household | 181 (85.4%) | 31 (14.6%) |
| 3-Person Household | 85 (87.6%) | 12 (12.4%) |
| 4+ Person Household | 265 (82.0%) | 58 (18.0%) |
| Total Housing Units | 632 (83.3%) | 127 (16.7%) |
Occupancy by Educational Attainment in Keokea
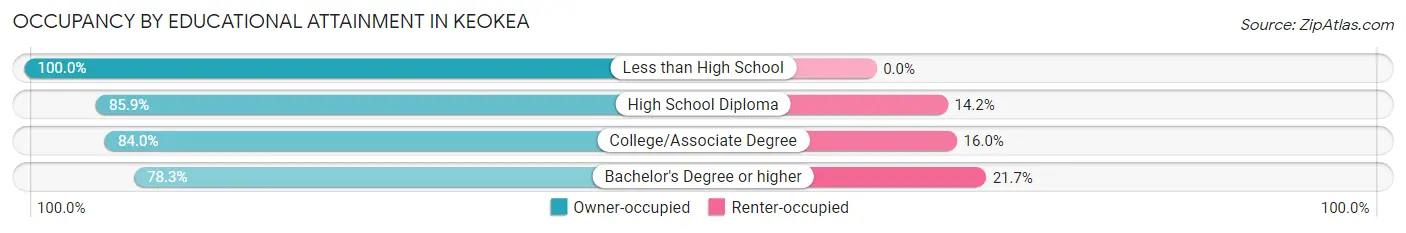
| Household Size | Owner-occupied | Renter-occupied |
| Less than High School | 28 (100.0%) | 0 (0.0%) |
| High School Diploma | 176 (85.9%) | 29 (14.1%) |
| College/Associate Degree | 237 (84.0%) | 45 (16.0%) |
| Bachelor's Degree or higher | 191 (78.3%) | 53 (21.7%) |
Occupancy by Age of Householder in Keokea
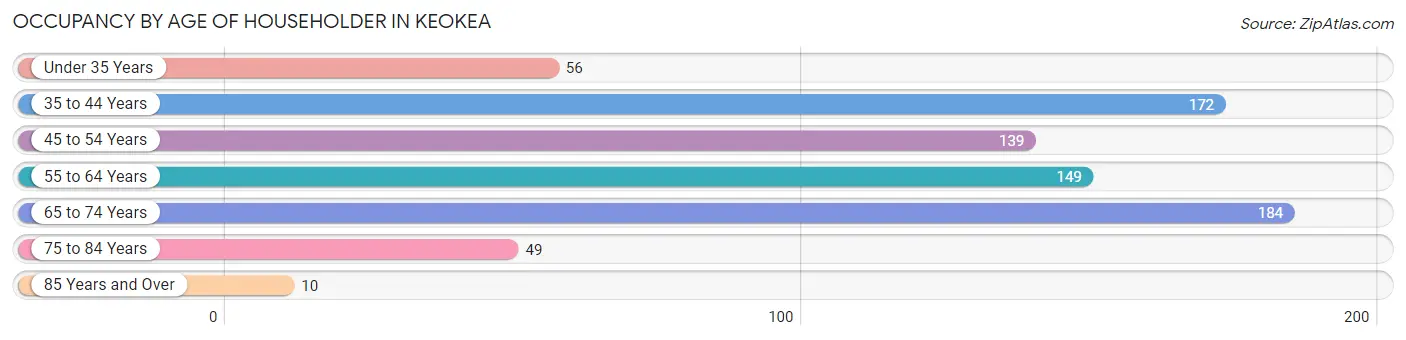
| Age Bracket | # Households | % Households |
| Under 35 Years | 56 | 7.4% |
| 35 to 44 Years | 172 | 22.7% |
| 45 to 54 Years | 139 | 18.3% |
| 55 to 64 Years | 149 | 19.6% |
| 65 to 74 Years | 184 | 24.2% |
| 75 to 84 Years | 49 | 6.5% |
| 85 Years and Over | 10 | 1.3% |
| Total | 759 | 100.0% |
Housing Finances in Keokea
Median Income by Occupancy in Keokea
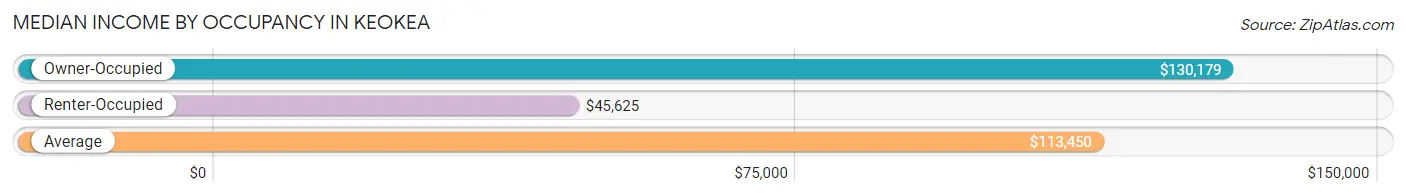
| Occupancy Type | # Households | Median Income |
| Owner-Occupied | 632 (83.3%) | $130,179 |
| Renter-Occupied | 127 (16.7%) | $45,625 |
| Average | 759 (100.0%) | $113,450 |
Occupancy by Householder Income Bracket in Keokea
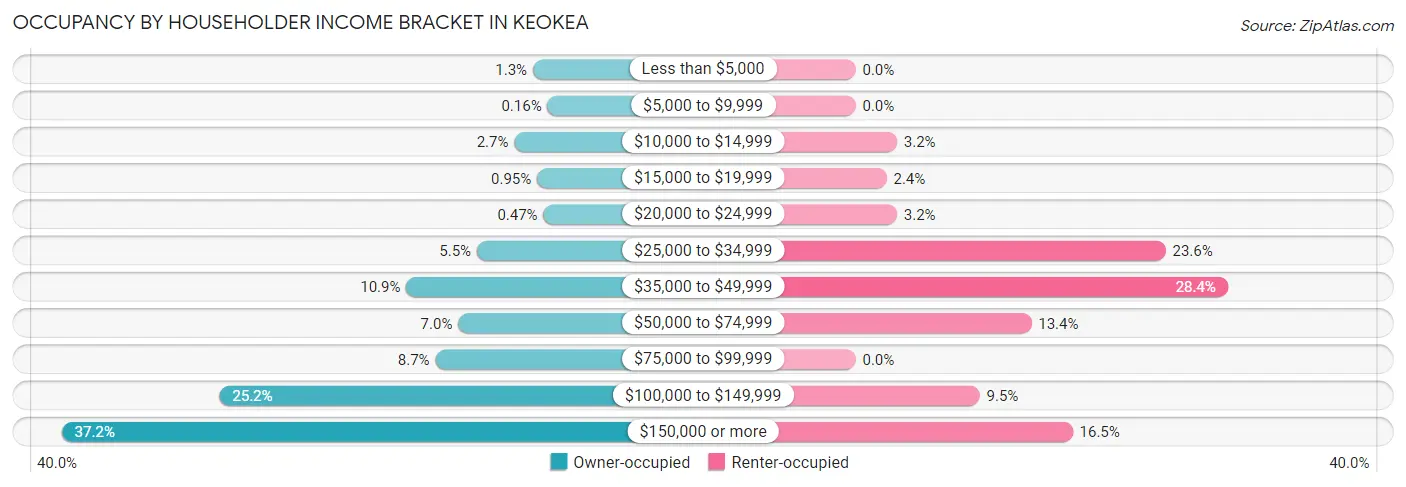
| Income Bracket | Owner-occupied | Renter-occupied |
| Less than $5,000 | 8 (1.3%) | 0 (0.0%) |
| $5,000 to $9,999 | 1 (0.2%) | 0 (0.0%) |
| $10,000 to $14,999 | 17 (2.7%) | 4 (3.2%) |
| $15,000 to $19,999 | 6 (0.9%) | 3 (2.4%) |
| $20,000 to $24,999 | 3 (0.5%) | 4 (3.2%) |
| $25,000 to $34,999 | 35 (5.5%) | 30 (23.6%) |
| $35,000 to $49,999 | 69 (10.9%) | 36 (28.3%) |
| $50,000 to $74,999 | 44 (7.0%) | 17 (13.4%) |
| $75,000 to $99,999 | 55 (8.7%) | 0 (0.0%) |
| $100,000 to $149,999 | 159 (25.2%) | 12 (9.5%) |
| $150,000 or more | 235 (37.2%) | 21 (16.5%) |
| Total | 632 (100.0%) | 127 (100.0%) |
Monthly Housing Cost Tiers in Keokea
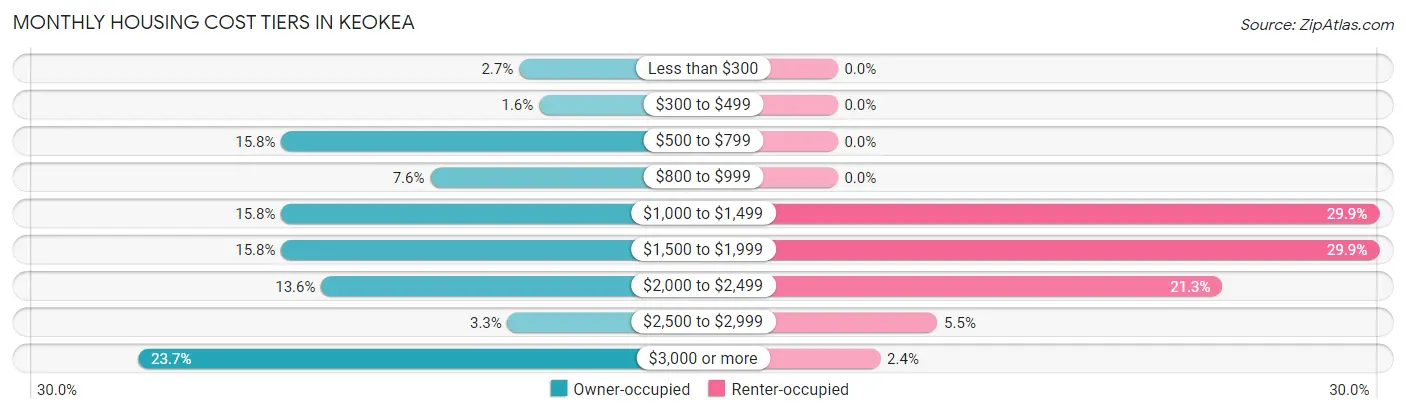
| Monthly Cost | Owner-occupied | Renter-occupied |
| Less than $300 | 17 (2.7%) | 0 (0.0%) |
| $300 to $499 | 10 (1.6%) | 0 (0.0%) |
| $500 to $799 | 100 (15.8%) | 0 (0.0%) |
| $800 to $999 | 48 (7.6%) | 0 (0.0%) |
| $1,000 to $1,499 | 100 (15.8%) | 38 (29.9%) |
| $1,500 to $1,999 | 100 (15.8%) | 38 (29.9%) |
| $2,000 to $2,499 | 86 (13.6%) | 27 (21.3%) |
| $2,500 to $2,999 | 21 (3.3%) | 7 (5.5%) |
| $3,000 or more | 150 (23.7%) | 3 (2.4%) |
| Total | 632 (100.0%) | 127 (100.0%) |
Physical Housing Characteristics in Keokea
Housing Structures in Keokea
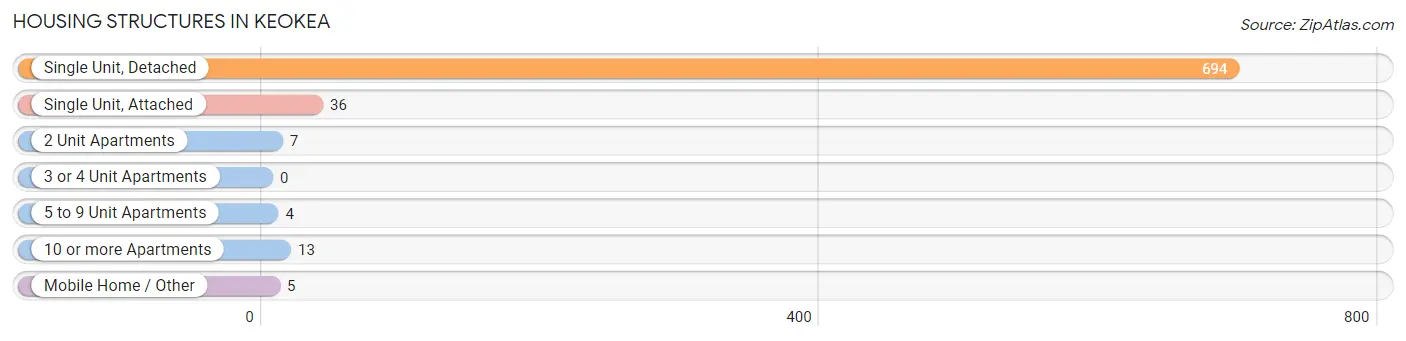
| Structure Type | # Housing Units | % Housing Units |
| Single Unit, Detached | 694 | 91.4% |
| Single Unit, Attached | 36 | 4.7% |
| 2 Unit Apartments | 7 | 0.9% |
| 3 or 4 Unit Apartments | 0 | 0.0% |
| 5 to 9 Unit Apartments | 4 | 0.5% |
| 10 or more Apartments | 13 | 1.7% |
| Mobile Home / Other | 5 | 0.7% |
| Total | 759 | 100.0% |
Housing Structures by Occupancy in Keokea
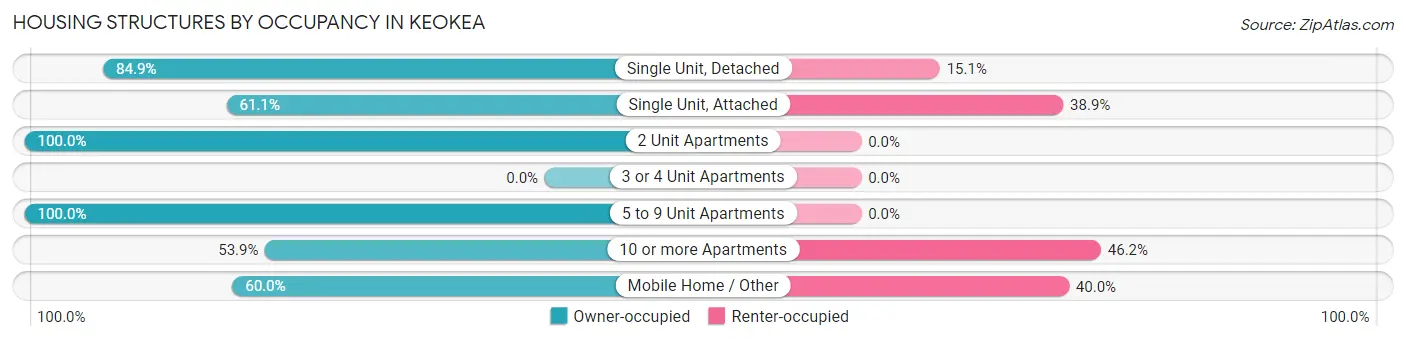
| Structure Type | Owner-occupied | Renter-occupied |
| Single Unit, Detached | 589 (84.9%) | 105 (15.1%) |
| Single Unit, Attached | 22 (61.1%) | 14 (38.9%) |
| 2 Unit Apartments | 7 (100.0%) | 0 (0.0%) |
| 3 or 4 Unit Apartments | 0 (0.0%) | 0 (0.0%) |
| 5 to 9 Unit Apartments | 4 (100.0%) | 0 (0.0%) |
| 10 or more Apartments | 7 (53.8%) | 6 (46.2%) |
| Mobile Home / Other | 3 (60.0%) | 2 (40.0%) |
| Total | 632 (83.3%) | 127 (16.7%) |
Housing Structures by Number of Rooms in Keokea
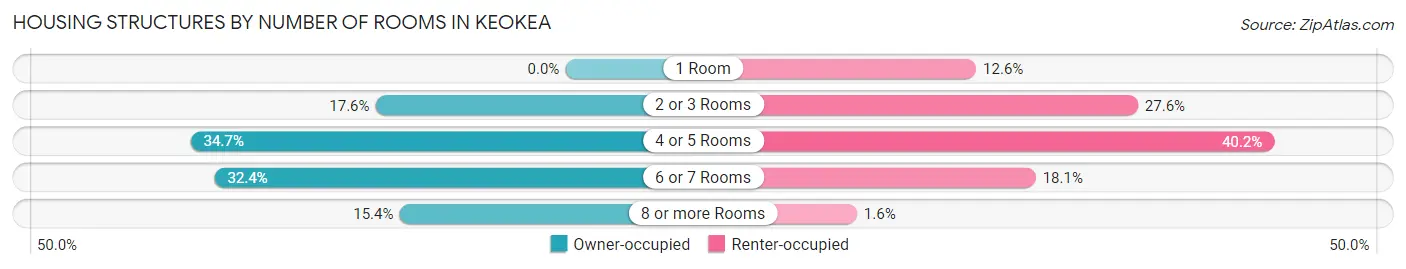
| Number of Rooms | Owner-occupied | Renter-occupied |
| 1 Room | 0 (0.0%) | 16 (12.6%) |
| 2 or 3 Rooms | 111 (17.6%) | 35 (27.6%) |
| 4 or 5 Rooms | 219 (34.6%) | 51 (40.2%) |
| 6 or 7 Rooms | 205 (32.4%) | 23 (18.1%) |
| 8 or more Rooms | 97 (15.3%) | 2 (1.6%) |
| Total | 632 (100.0%) | 127 (100.0%) |
Housing Structure by Heating Type in Keokea
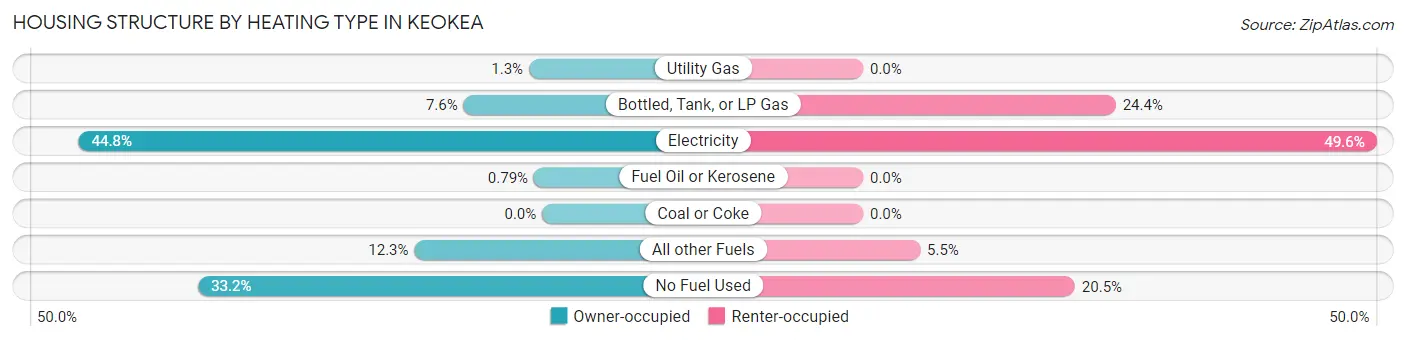
| Heating Type | Owner-occupied | Renter-occupied |
| Utility Gas | 8 (1.3%) | 0 (0.0%) |
| Bottled, Tank, or LP Gas | 48 (7.6%) | 31 (24.4%) |
| Electricity | 283 (44.8%) | 63 (49.6%) |
| Fuel Oil or Kerosene | 5 (0.8%) | 0 (0.0%) |
| Coal or Coke | 0 (0.0%) | 0 (0.0%) |
| All other Fuels | 78 (12.3%) | 7 (5.5%) |
| No Fuel Used | 210 (33.2%) | 26 (20.5%) |
| Total | 632 (100.0%) | 127 (100.0%) |
Household Vehicle Usage in Keokea
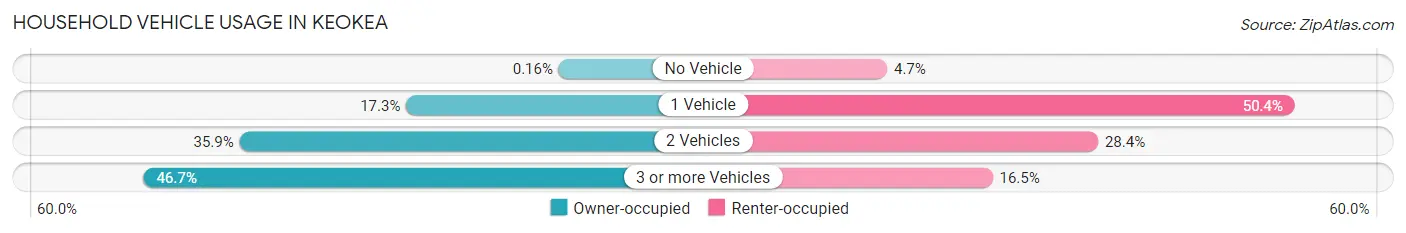
| Vehicles per Household | Owner-occupied | Renter-occupied |
| No Vehicle | 1 (0.2%) | 6 (4.7%) |
| 1 Vehicle | 109 (17.2%) | 64 (50.4%) |
| 2 Vehicles | 227 (35.9%) | 36 (28.3%) |
| 3 or more Vehicles | 295 (46.7%) | 21 (16.5%) |
| Total | 632 (100.0%) | 127 (100.0%) |
Real Estate & Mortgages in Keokea
Real Estate and Mortgage Overview in Keokea
| Characteristic | Without Mortgage | With Mortgage |
| Housing Units | 157 | 475 |
| Median Property Value | $832,000 | $684,200 |
| Median Household Income | $134,583 | $178 |
| Monthly Housing Costs | $738 | $150 |
| Real Estate Taxes | $2,096 | $98 |
Property Value by Mortgage Status in Keokea
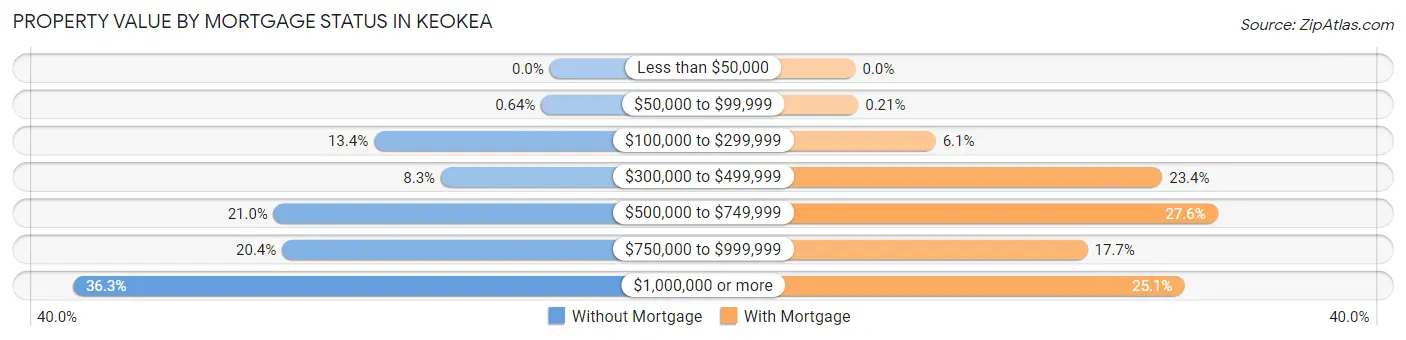
| Property Value | Without Mortgage | With Mortgage |
| Less than $50,000 | 0 (0.0%) | 0 (0.0%) |
| $50,000 to $99,999 | 1 (0.6%) | 1 (0.2%) |
| $100,000 to $299,999 | 21 (13.4%) | 29 (6.1%) |
| $300,000 to $499,999 | 13 (8.3%) | 111 (23.4%) |
| $500,000 to $749,999 | 33 (21.0%) | 131 (27.6%) |
| $750,000 to $999,999 | 32 (20.4%) | 84 (17.7%) |
| $1,000,000 or more | 57 (36.3%) | 119 (25.1%) |
| Total | 157 (100.0%) | 475 (100.0%) |
Household Income by Mortgage Status in Keokea
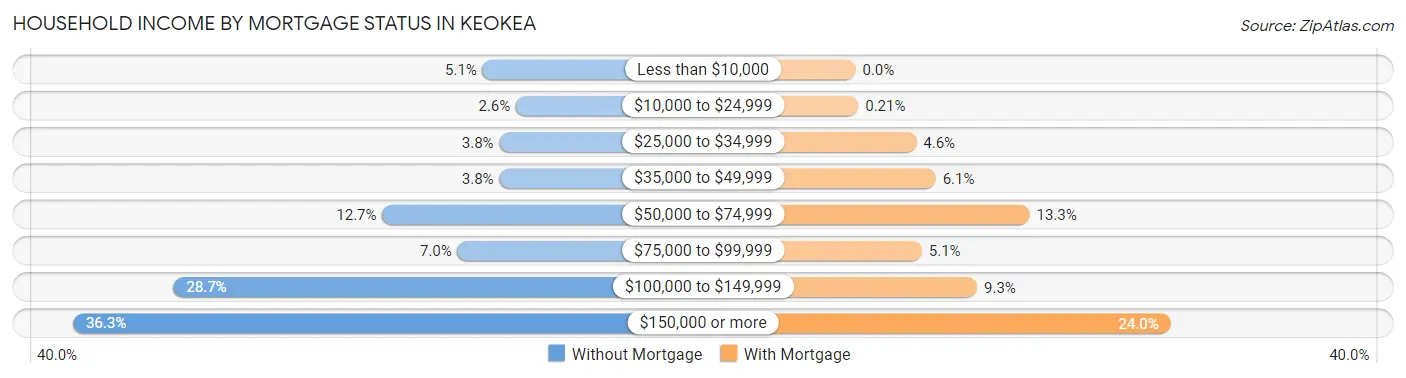
| Household Income | Without Mortgage | With Mortgage |
| Less than $10,000 | 8 (5.1%) | 0 (0.0%) |
| $10,000 to $24,999 | 4 (2.5%) | 1 (0.2%) |
| $25,000 to $34,999 | 6 (3.8%) | 22 (4.6%) |
| $35,000 to $49,999 | 6 (3.8%) | 29 (6.1%) |
| $50,000 to $74,999 | 20 (12.7%) | 63 (13.3%) |
| $75,000 to $99,999 | 11 (7.0%) | 24 (5.1%) |
| $100,000 to $149,999 | 45 (28.7%) | 44 (9.3%) |
| $150,000 or more | 57 (36.3%) | 114 (24.0%) |
| Total | 157 (100.0%) | 475 (100.0%) |
Property Value to Household Income Ratio in Keokea
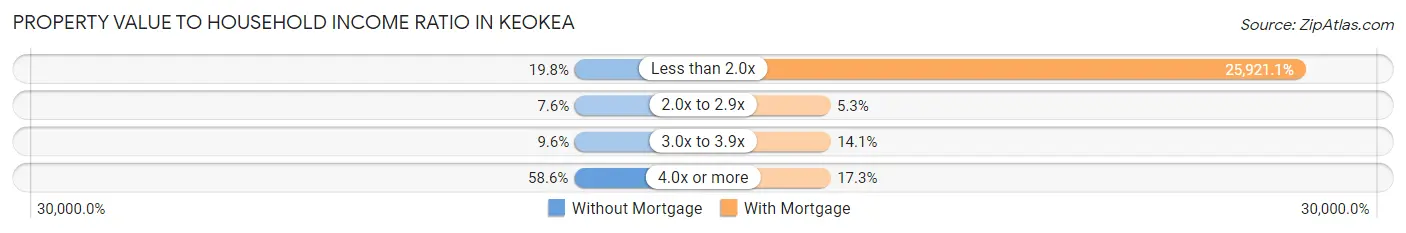
| Value-to-Income Ratio | Without Mortgage | With Mortgage |
| Less than 2.0x | 31 (19.8%) | 123,125 (25,921.1%) |
| 2.0x to 2.9x | 12 (7.6%) | 25 (5.3%) |
| 3.0x to 3.9x | 15 (9.6%) | 67 (14.1%) |
| 4.0x or more | 92 (58.6%) | 82 (17.3%) |
| Total | 157 (100.0%) | 475 (100.0%) |
Real Estate Taxes by Mortgage Status in Keokea
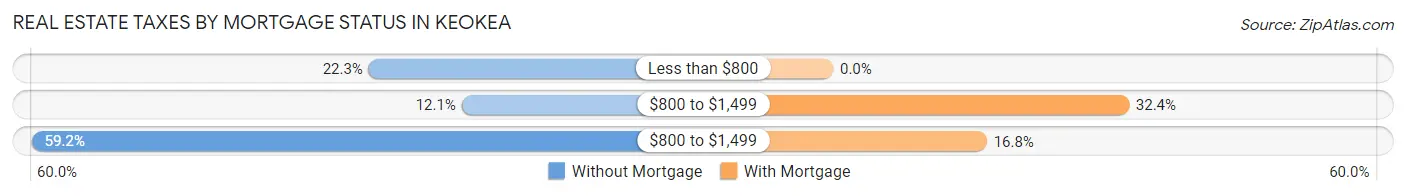
| Property Taxes | Without Mortgage | With Mortgage |
| Less than $800 | 35 (22.3%) | 0 (0.0%) |
| $800 to $1,499 | 19 (12.1%) | 154 (32.4%) |
| $800 to $1,499 | 93 (59.2%) | 80 (16.8%) |
| Total | 157 (100.0%) | 475 (100.0%) |
Health & Disability in Keokea
Health Insurance Coverage by Age in Keokea
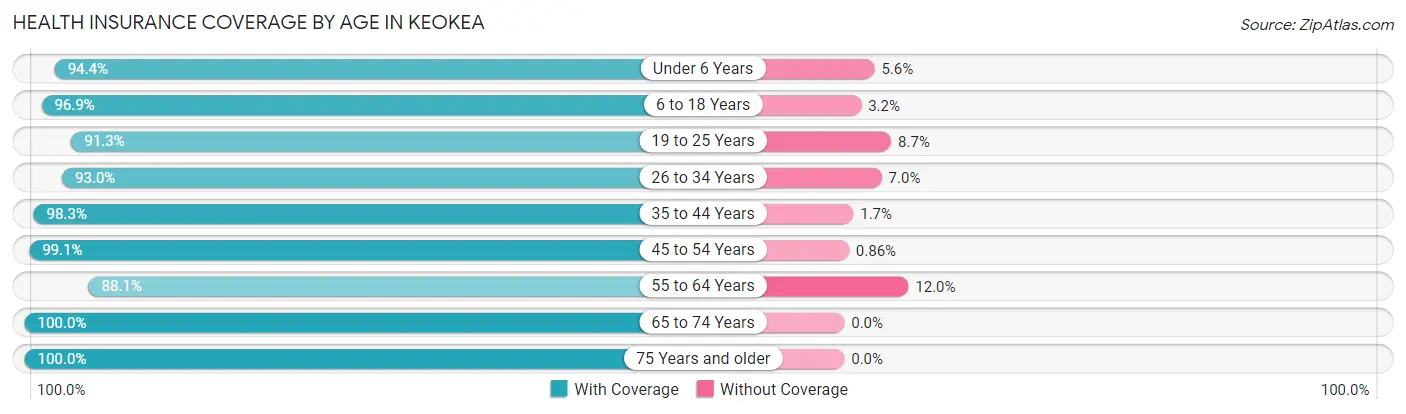
| Age Bracket | With Coverage | Without Coverage |
| Under 6 Years | 235 (94.4%) | 14 (5.6%) |
| 6 to 18 Years | 615 (96.9%) | 20 (3.2%) |
| 19 to 25 Years | 178 (91.3%) | 17 (8.7%) |
| 26 to 34 Years | 227 (93.0%) | 17 (7.0%) |
| 35 to 44 Years | 409 (98.3%) | 7 (1.7%) |
| 45 to 54 Years | 344 (99.1%) | 3 (0.9%) |
| 55 to 64 Years | 280 (88.0%) | 38 (11.9%) |
| 65 to 74 Years | 312 (100.0%) | 0 (0.0%) |
| 75 Years and older | 125 (100.0%) | 0 (0.0%) |
| Total | 2,725 (95.9%) | 116 (4.1%) |
Health Insurance Coverage by Citizenship Status in Keokea
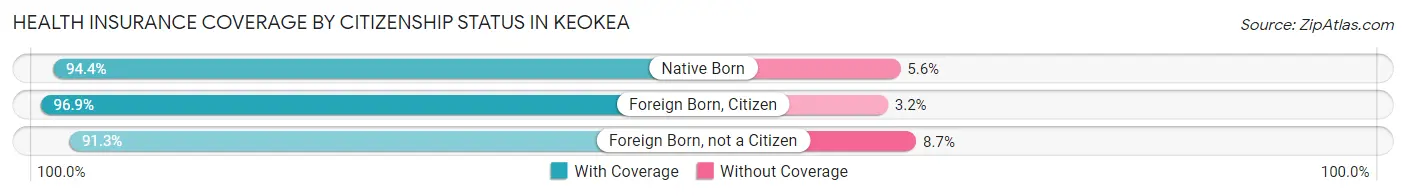
| Citizenship Status | With Coverage | Without Coverage |
| Native Born | 235 (94.4%) | 14 (5.6%) |
| Foreign Born, Citizen | 615 (96.9%) | 20 (3.2%) |
| Foreign Born, not a Citizen | 178 (91.3%) | 17 (8.7%) |
Health Insurance Coverage by Household Income in Keokea
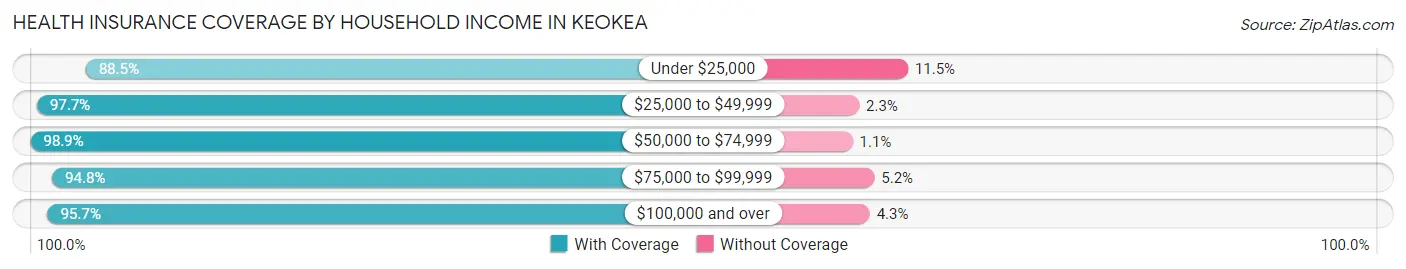
| Household Income | With Coverage | Without Coverage |
| Under $25,000 | 85 (88.5%) | 11 (11.5%) |
| $25,000 to $49,999 | 422 (97.7%) | 10 (2.3%) |
| $50,000 to $74,999 | 181 (98.9%) | 2 (1.1%) |
| $75,000 to $99,999 | 165 (94.8%) | 9 (5.2%) |
| $100,000 and over | 1,872 (95.7%) | 84 (4.3%) |
Public vs Private Health Insurance Coverage by Age in Keokea
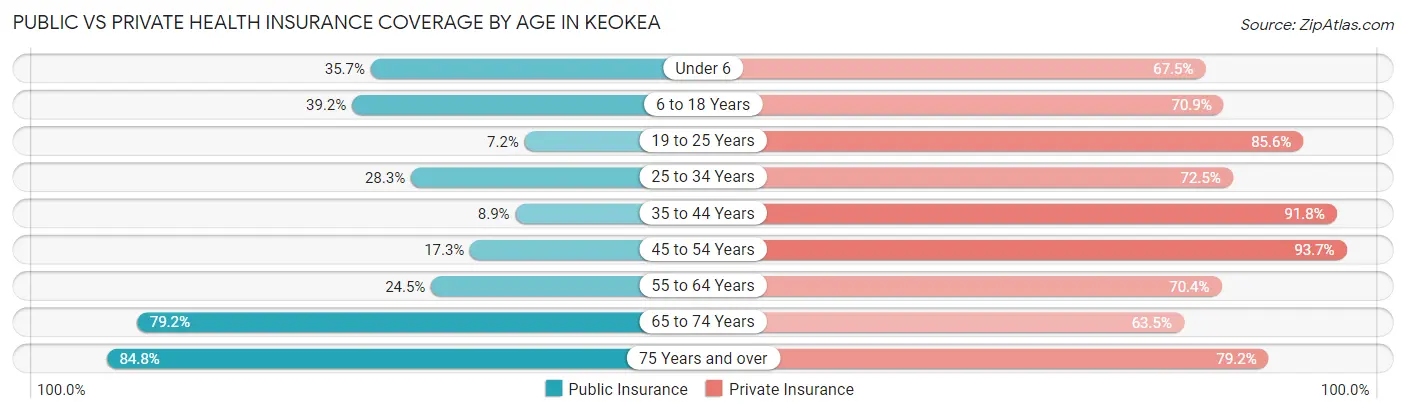
| Age Bracket | Public Insurance | Private Insurance |
| Under 6 | 89 (35.7%) | 168 (67.5%) |
| 6 to 18 Years | 249 (39.2%) | 450 (70.9%) |
| 19 to 25 Years | 14 (7.2%) | 167 (85.6%) |
| 25 to 34 Years | 69 (28.3%) | 177 (72.5%) |
| 35 to 44 Years | 37 (8.9%) | 382 (91.8%) |
| 45 to 54 Years | 60 (17.3%) | 325 (93.7%) |
| 55 to 64 Years | 78 (24.5%) | 224 (70.4%) |
| 65 to 74 Years | 247 (79.2%) | 198 (63.5%) |
| 75 Years and over | 106 (84.8%) | 99 (79.2%) |
| Total | 949 (33.4%) | 2,190 (77.1%) |
Disability Status by Sex by Age in Keokea
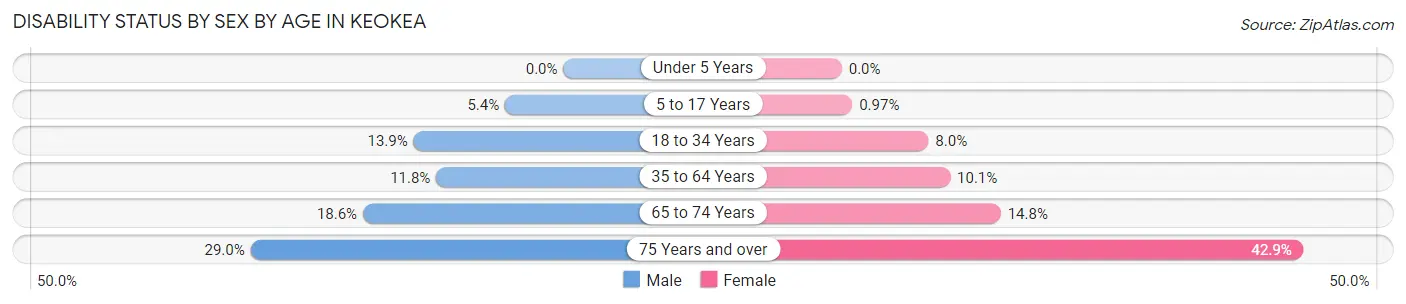
| Age Bracket | Male | Female |
| Under 5 Years | 0 (0.0%) | 0 (0.0%) |
| 5 to 17 Years | 16 (5.4%) | 3 (1.0%) |
| 18 to 34 Years | 36 (13.9%) | 18 (8.0%) |
| 35 to 64 Years | 63 (11.8%) | 55 (10.1%) |
| 65 to 74 Years | 24 (18.6%) | 27 (14.7%) |
| 75 Years and over | 18 (29.0%) | 27 (42.9%) |
Disability Class by Sex by Age in Keokea
Disability Class: Hearing Difficulty
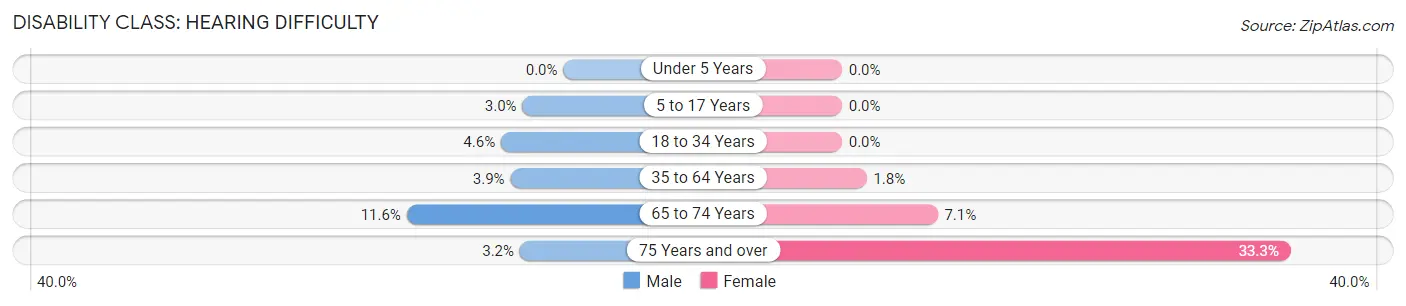
| Age Bracket | Male | Female |
| Under 5 Years | 0 (0.0%) | 0 (0.0%) |
| 5 to 17 Years | 9 (3.0%) | 0 (0.0%) |
| 18 to 34 Years | 12 (4.6%) | 0 (0.0%) |
| 35 to 64 Years | 21 (3.9%) | 10 (1.8%) |
| 65 to 74 Years | 15 (11.6%) | 13 (7.1%) |
| 75 Years and over | 2 (3.2%) | 21 (33.3%) |
Disability Class: Vision Difficulty
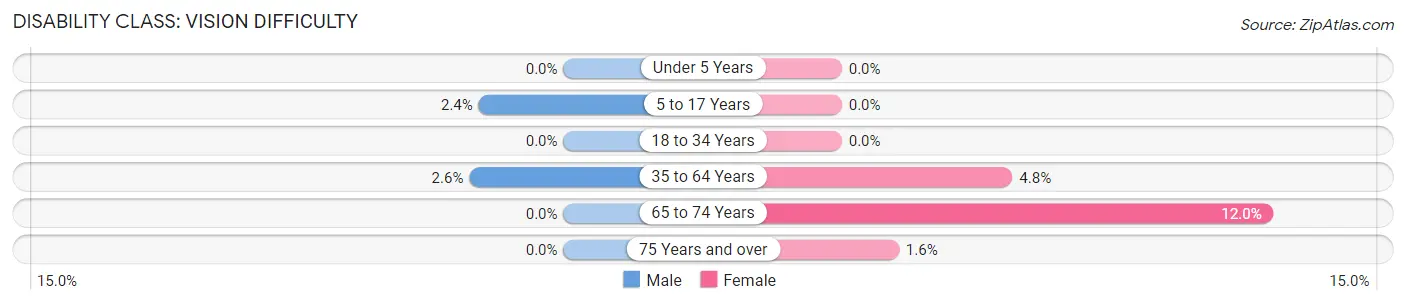
| Age Bracket | Male | Female |
| Under 5 Years | 0 (0.0%) | 0 (0.0%) |
| 5 to 17 Years | 7 (2.4%) | 0 (0.0%) |
| 18 to 34 Years | 0 (0.0%) | 0 (0.0%) |
| 35 to 64 Years | 14 (2.6%) | 26 (4.8%) |
| 65 to 74 Years | 0 (0.0%) | 22 (12.0%) |
| 75 Years and over | 0 (0.0%) | 1 (1.6%) |
Disability Class: Cognitive Difficulty
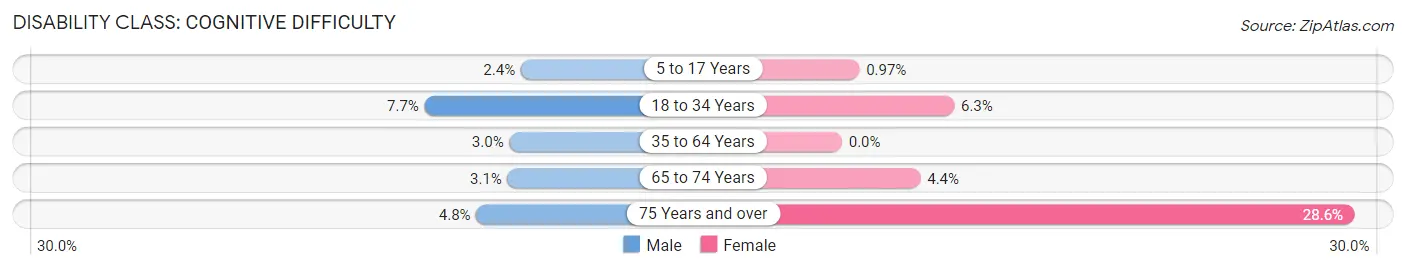
| Age Bracket | Male | Female |
| 5 to 17 Years | 7 (2.4%) | 3 (1.0%) |
| 18 to 34 Years | 20 (7.7%) | 14 (6.2%) |
| 35 to 64 Years | 16 (3.0%) | 0 (0.0%) |
| 65 to 74 Years | 4 (3.1%) | 8 (4.4%) |
| 75 Years and over | 3 (4.8%) | 18 (28.6%) |
Disability Class: Ambulatory Difficulty
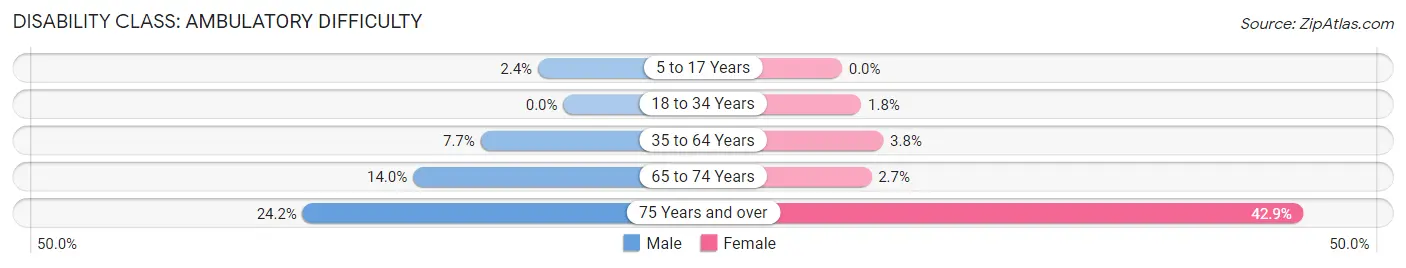
| Age Bracket | Male | Female |
| 5 to 17 Years | 7 (2.4%) | 0 (0.0%) |
| 18 to 34 Years | 0 (0.0%) | 4 (1.8%) |
| 35 to 64 Years | 41 (7.7%) | 21 (3.8%) |
| 65 to 74 Years | 18 (14.0%) | 5 (2.7%) |
| 75 Years and over | 15 (24.2%) | 27 (42.9%) |
Disability Class: Self-Care Difficulty
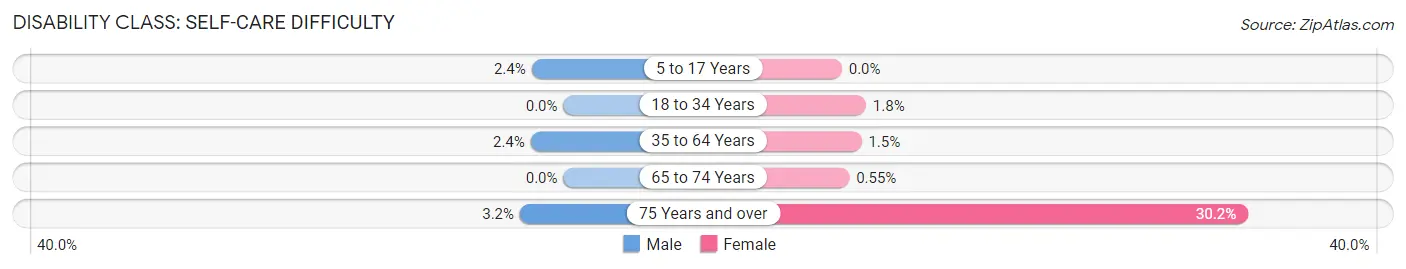
| Age Bracket | Male | Female |
| 5 to 17 Years | 7 (2.4%) | 0 (0.0%) |
| 18 to 34 Years | 0 (0.0%) | 4 (1.8%) |
| 35 to 64 Years | 13 (2.4%) | 8 (1.5%) |
| 65 to 74 Years | 0 (0.0%) | 1 (0.5%) |
| 75 Years and over | 2 (3.2%) | 19 (30.2%) |
Technology Access in Keokea
Computing Device Access in Keokea
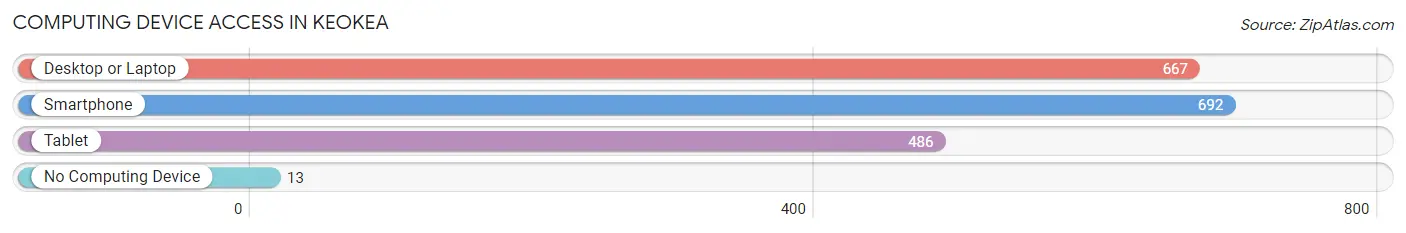
| Device Type | # Households | % Households |
| Desktop or Laptop | 667 | 87.9% |
| Smartphone | 692 | 91.2% |
| Tablet | 486 | 64.0% |
| No Computing Device | 13 | 1.7% |
| Total | 759 | 100.0% |
Internet Access in Keokea
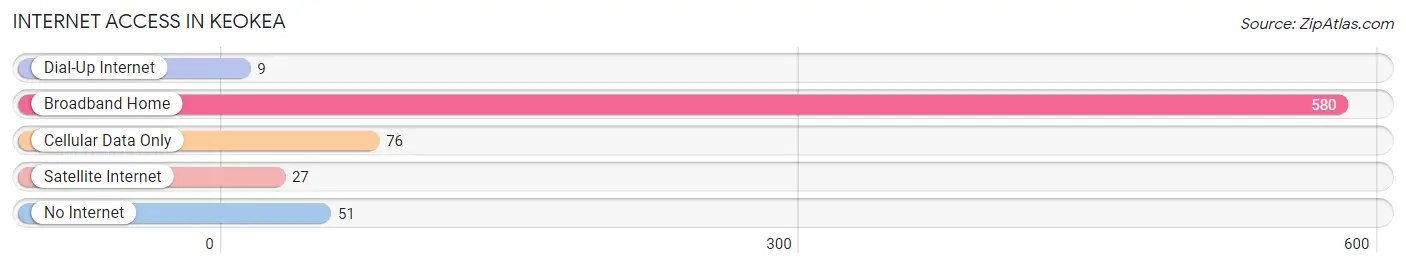
| Internet Type | # Households | % Households |
| Dial-Up Internet | 9 | 1.2% |
| Broadband Home | 580 | 76.4% |
| Cellular Data Only | 76 | 10.0% |
| Satellite Internet | 27 | 3.6% |
| No Internet | 51 | 6.7% |
| Total | 759 | 100.0% |
Keokea Summary
Keokea is a small unincorporated community located in the district of Kula on the island of Maui in the state of Hawaii. It is located at an elevation of 1,400 feet and is part of the Kula-Kahului-Wailuku-Lahaina Metropolitan Statistical Area. The population of Keokea was estimated to be 1,845 in the year 2000.
History
Keokea was originally settled by Native Hawaiians in the late 1700s. The area was used for farming and ranching, and the community was known for its abundance of wild game. In the early 1800s, the area was home to a large population of Chinese immigrants who worked in the sugar cane fields. In the late 1800s, the area was home to a large population of Japanese immigrants who worked in the pineapple fields.
In the early 1900s, the area was home to a large population of Portuguese immigrants who worked in the sugar cane fields. In the late 1900s, the area was home to a large population of Filipino immigrants who worked in the pineapple fields.
Geography
Keokea is located in the district of Kula on the island of Maui in the state of Hawaii. It is located at an elevation of 1,400 feet and is part of the Kula-Kahului-Wailuku-Lahaina Metropolitan Statistical Area. The area is characterized by rolling hills and lush vegetation. The climate is tropical and humid, with temperatures ranging from the mid-70s to the mid-80s.
Economy
The economy of Keokea is largely based on agriculture. The area is home to numerous farms and ranches, and the community is known for its abundance of wild game. The area is also home to a number of small businesses, including restaurants, stores, and services.
Demographics
The population of Keokea was estimated to be 1,845 in the year 2000. The racial makeup of the community was 57.3% White, 0.7% African American, 0.2% Native American, 0.2% Asian, 0.1% Pacific Islander, 37.2% from other races, and 4.5% from two or more races. The median household income was $37,917, and the median family income was $41,917. The per capita income was $17,917. The unemployment rate was 6.2%.
Conclusion
Keokea is a small unincorporated community located in the district of Kula on the island of Maui in the state of Hawaii. It is characterized by rolling hills and lush vegetation, and the economy is largely based on agriculture. The population of Keokea was estimated to be 1,845 in the year 2000, and the racial makeup of the community was 57.3% White, 0.7% African American, 0.2% Native American, 0.2% Asian, 0.1% Pacific Islander, 37.2% from other races, and 4.5% from two or more races. The median household income was $37,917, and the median family income was $41,917. The per capita income was $17,917. The unemployment rate was 6.2%.
Common Questions
What is the Total Population of Keokea?
Total Population of Keokea is 2,872.
What is the Total Male Population of Keokea?
Total Male Population of Keokea is 1,469.
What is the Total Female Population of Keokea?
Total Female Population of Keokea is 1,403.
What is the Ratio of Males per 100 Females in Keokea?
There are 104.70 Males per 100 Females in Keokea.
What is the Ratio of Females per 100 Males in Keokea?
There are 95.51 Females per 100 Males in Keokea.
What is the Median Population Age in Keokea?
Median Population Age in Keokea is 36.7 Years.
What is the Average Family Size in Keokea
Average Family Size in Keokea is 4.2 People.
What is the Average Household Size in Keokea
Average Household Size in Keokea is 3.8 People.
What is Per Capita Income in Keokea?
Per Capita income in Keokea is $44,062.
What is the Median Family Income in Keokea?
Median Family Income in Keokea is $128,333.
What is the Median Household income in Keokea?
Median Household Income in Keokea is $113,450.
What is Income or Wage Gap in Keokea?
Income or Wage Gap in Keokea is 36.2%.
Women in Keokea earn 63.8 cents for every dollar earned by a man.
What is Inequality or Gini Index in Keokea?
Inequality or Gini Index in Keokea is 0.49.
How Large is the Labor Force in Keokea?
There are 1,400 People in the Labor Forcein in Keokea.
What is the Percentage of People in the Labor Force in Keokea?
65.7% of People are in the Labor Force in Keokea.
What is the Unemployment Rate in Keokea?
Unemployment Rate in Keokea is 8.7%.