Makaha Valley, HI
Makaha Valley Map
Makaha Valley Overview
158
TOTAL POPULATION
89
MALE POPULATION
69
FEMALE POPULATION
128.99
MALES / 100 FEMALES
77.53
FEMALES / 100 MALES
39.5
MEDIAN AGE
4.2
AVG FAMILY SIZE
3.4
AVG HOUSEHOLD SIZE
$91,479
PER CAPITA INCOME
$248,750
AVG FAMILY INCOME
$250,000
AVG HOUSEHOLD INCOME
0.44
INEQUALITY / GINI INDEX
79
LABOR FORCE [ PEOPLE ]
68.1%
PERCENT IN LABOR FORCE
8.9%
UNEMPLOYMENT RATE
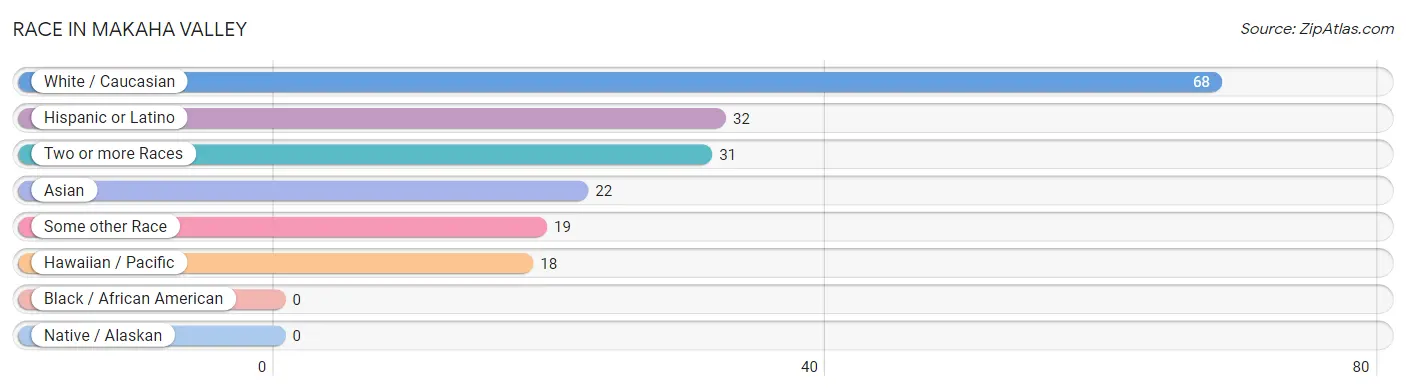
Race in Makaha Valley
The most populous races in Makaha Valley are White / Caucasian (68 | 43.0%), Hispanic or Latino (32 | 20.3%), and Two or more Races (31 | 19.6%).
| Race | # Population | % Population |
| Asian | 22 | 13.9% |
| Black / African American | 0 | 0.0% |
| Hawaiian / Pacific | 18 | 11.4% |
| Hispanic or Latino | 32 | 20.3% |
| Native / Alaskan | 0 | 0.0% |
| White / Caucasian | 68 | 43.0% |
| Two or more Races | 31 | 19.6% |
| Some other Race | 19 | 12.0% |
| Total | 158 | 100.0% |
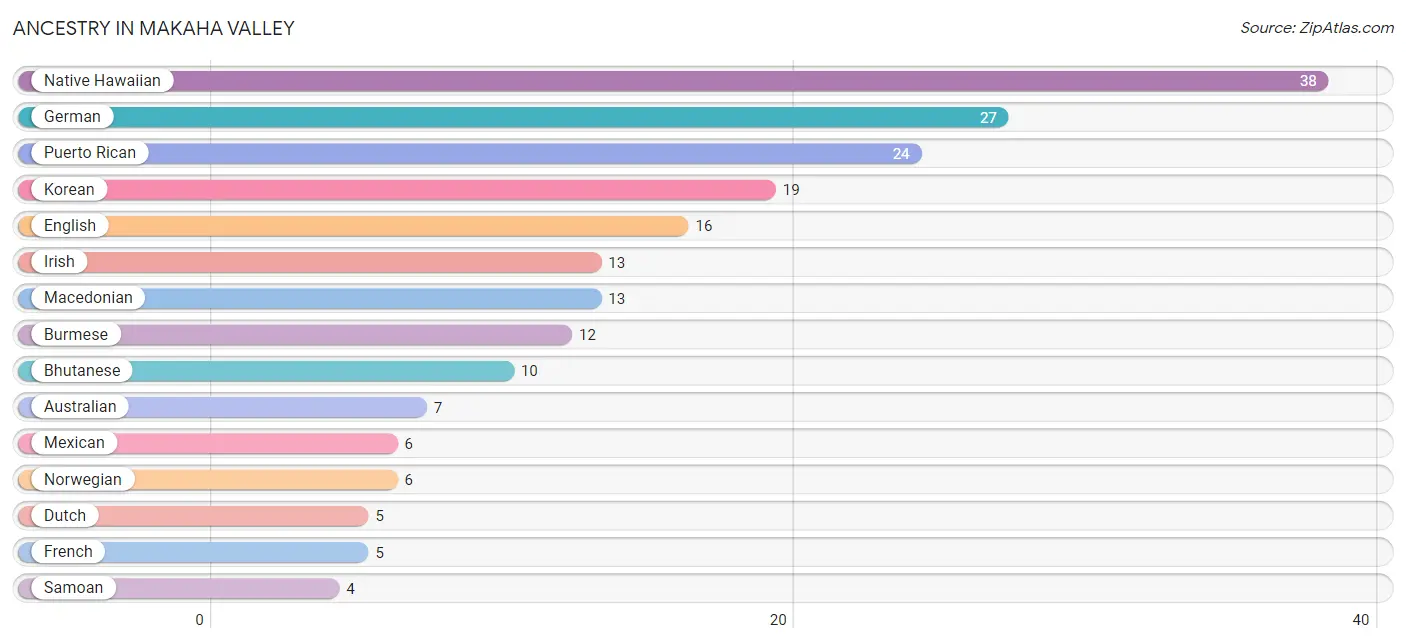
Ancestry in Makaha Valley
The most populous ancestries reported in Makaha Valley are Native Hawaiian (38 | 24.0%), German (27 | 17.1%), Puerto Rican (24 | 15.2%), Korean (19 | 12.0%), and English (16 | 10.1%), together accounting for 78.5% of all Makaha Valley residents.
| Ancestry | # Population | % Population |
| Aleut | 3 | 1.9% |
| Australian | 7 | 4.4% |
| Bhutanese | 10 | 6.3% |
| British | 2 | 1.3% |
| Burmese | 12 | 7.6% |
| Central American | 2 | 1.3% |
| Cherokee | 3 | 1.9% |
| Creek | 3 | 1.9% |
| Dutch | 5 | 3.2% |
| English | 16 | 10.1% |
| Fijian | 3 | 1.9% |
| French | 5 | 3.2% |
| German | 27 | 17.1% |
| Guatemalan | 2 | 1.3% |
| Irish | 13 | 8.2% |
| Italian | 3 | 1.9% |
| Korean | 19 | 12.0% |
| Laotian | 3 | 1.9% |
| Macedonian | 13 | 8.2% |
| Mexican | 6 | 3.8% |
| Native Hawaiian | 38 | 24.0% |
| Norwegian | 6 | 3.8% |
| Puerto Rican | 24 | 15.2% |
| Russian | 2 | 1.3% |
| Samoan | 4 | 2.5% |
| Sri Lankan | 2 | 1.3% |
| Yaqui | 4 | 2.5% |
| Yugoslavian | 3 | 1.9% | View All 28 Rows |
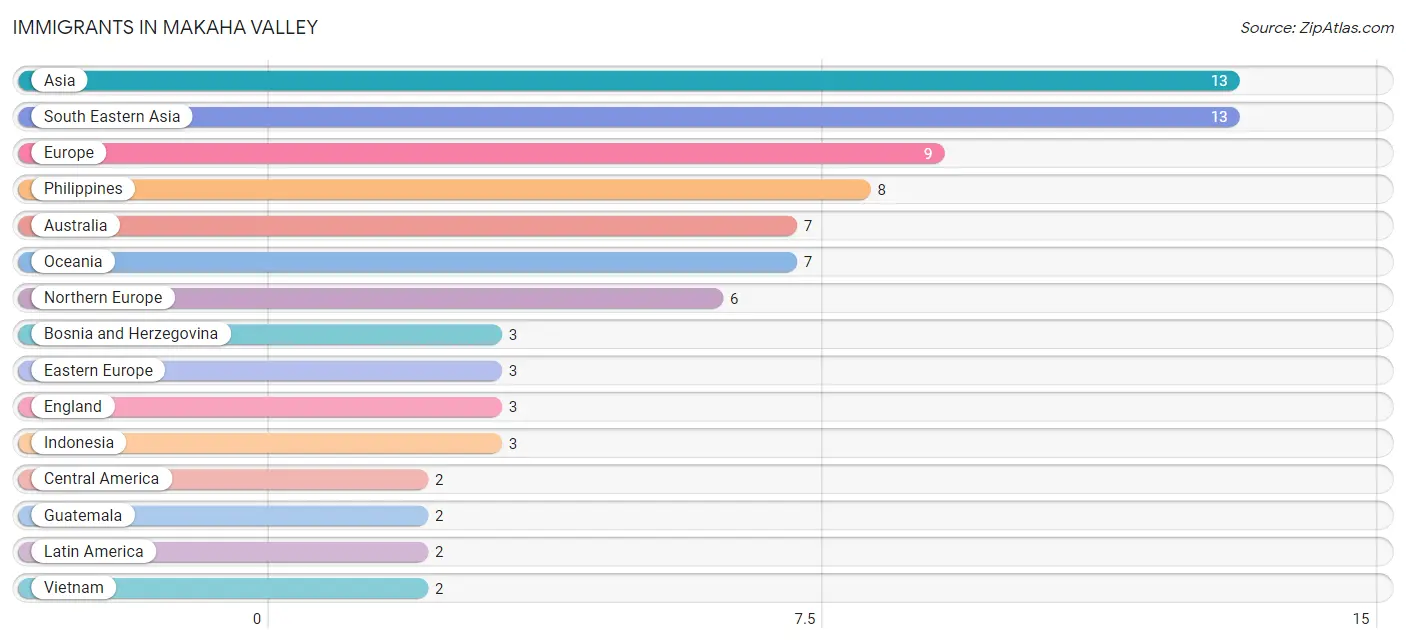
Immigrants in Makaha Valley
The most numerous immigrant groups reported in Makaha Valley came from Asia (13 | 8.2%), South Eastern Asia (13 | 8.2%), Europe (9 | 5.7%), Philippines (8 | 5.1%), and Australia (7 | 4.4%), together accounting for 31.7% of all Makaha Valley residents.
| Immigration Origin | # Population | % Population |
| Asia | 13 | 8.2% |
| Australia | 7 | 4.4% |
| Bosnia and Herzegovina | 3 | 1.9% |
| Central America | 2 | 1.3% |
| Eastern Europe | 3 | 1.9% |
| England | 3 | 1.9% |
| Europe | 9 | 5.7% |
| Guatemala | 2 | 1.3% |
| Indonesia | 3 | 1.9% |
| Latin America | 2 | 1.3% |
| Northern Europe | 6 | 3.8% |
| Oceania | 7 | 4.4% |
| Philippines | 8 | 5.1% |
| South Eastern Asia | 13 | 8.2% |
| Vietnam | 2 | 1.3% | View All 15 Rows |
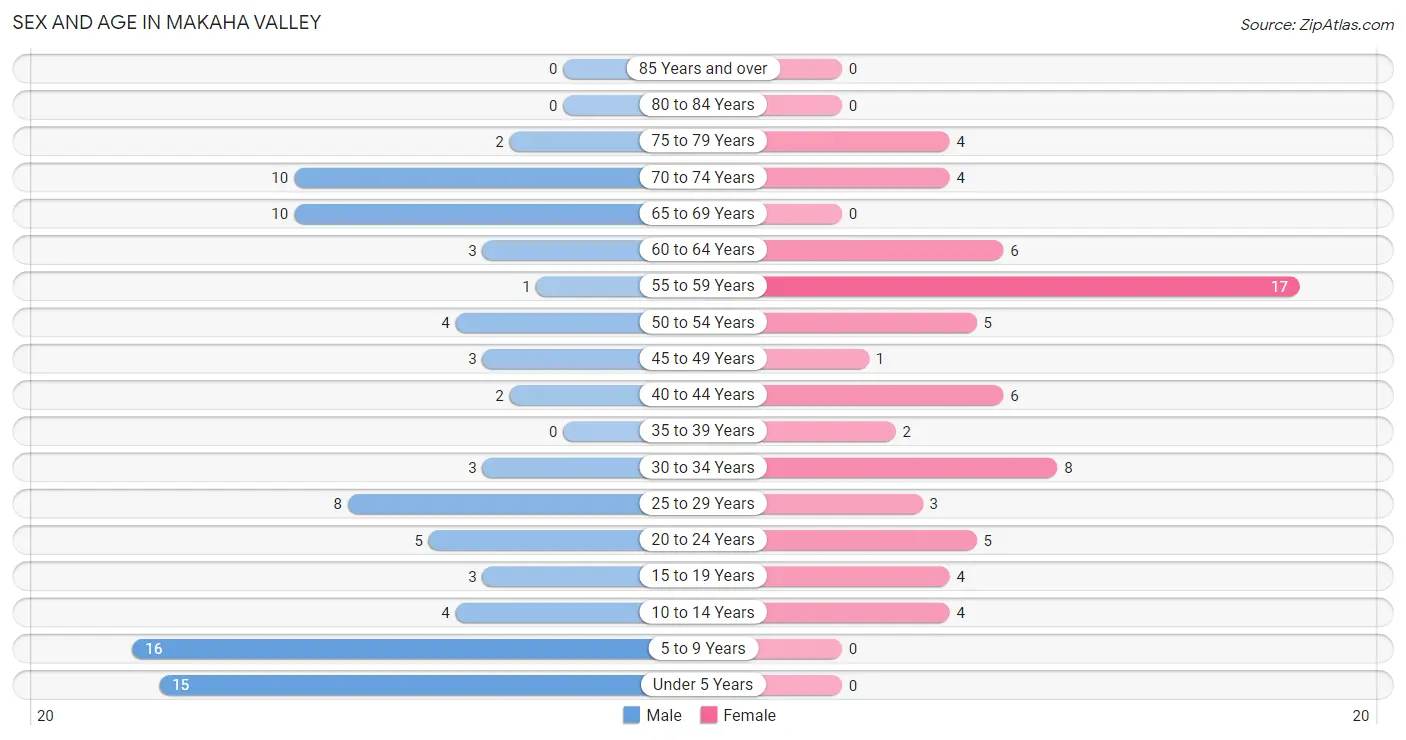
Sex and Age in Makaha Valley
Sex and Age in Makaha Valley
The most populous age groups in Makaha Valley are 5 to 9 Years (16 | 18.0%) for men and 55 to 59 Years (17 | 24.6%) for women.
| Age Bracket | Male | Female |
| Under 5 Years | 15 (16.9%) | 0 (0.0%) |
| 5 to 9 Years | 16 (18.0%) | 0 (0.0%) |
| 10 to 14 Years | 4 (4.5%) | 4 (5.8%) |
| 15 to 19 Years | 3 (3.4%) | 4 (5.8%) |
| 20 to 24 Years | 5 (5.6%) | 5 (7.2%) |
| 25 to 29 Years | 8 (9.0%) | 3 (4.3%) |
| 30 to 34 Years | 3 (3.4%) | 8 (11.6%) |
| 35 to 39 Years | 0 (0.0%) | 2 (2.9%) |
| 40 to 44 Years | 2 (2.2%) | 6 (8.7%) |
| 45 to 49 Years | 3 (3.4%) | 1 (1.5%) |
| 50 to 54 Years | 4 (4.5%) | 5 (7.2%) |
| 55 to 59 Years | 1 (1.1%) | 17 (24.6%) |
| 60 to 64 Years | 3 (3.4%) | 6 (8.7%) |
| 65 to 69 Years | 10 (11.2%) | 0 (0.0%) |
| 70 to 74 Years | 10 (11.2%) | 4 (5.8%) |
| 75 to 79 Years | 2 (2.2%) | 4 (5.8%) |
| 80 to 84 Years | 0 (0.0%) | 0 (0.0%) |
| 85 Years and over | 0 (0.0%) | 0 (0.0%) |
| Total | 89 (100.0%) | 69 (100.0%) |
Families and Households in Makaha Valley
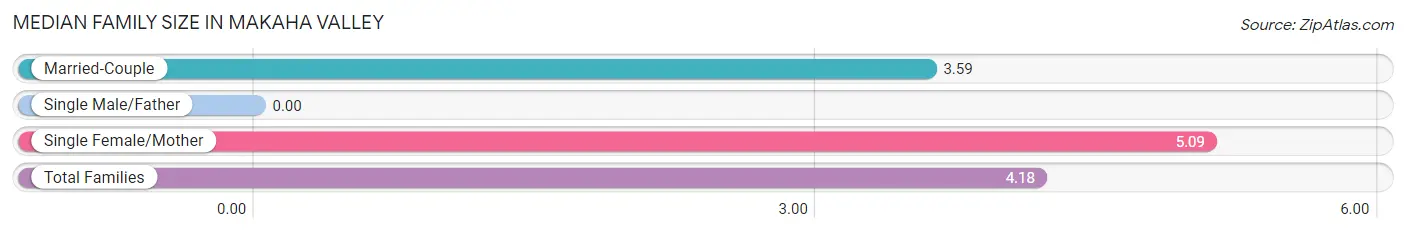
Median Family Size in Makaha Valley
| Family Type | # Families | Family Size |
| Married-Couple | 17 (60.7%) | 3.59 |
| Single Male/Father | 0 (0.0%) | - |
| Single Female/Mother | 11 (39.3%) | 5.09 |
| Total Families | 28 (100.0%) | 4.18 |
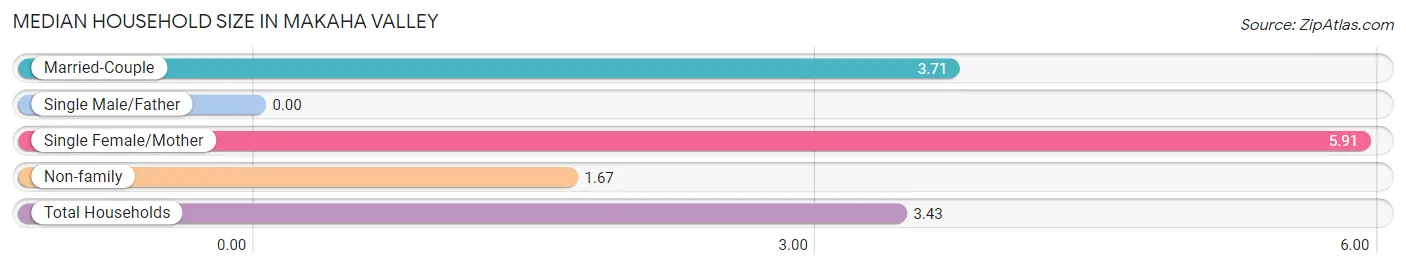
Median Household Size in Makaha Valley
| Household Type | # Households | Household Size |
| Married-Couple | 17 (37.0%) | 3.71 |
| Single Male/Father | 0 (0.0%) | - |
| Single Female/Mother | 11 (23.9%) | 5.91 |
| Non-family | 18 (39.1%) | 1.67 |
| Total Households | 46 (100.0%) | 3.43 |
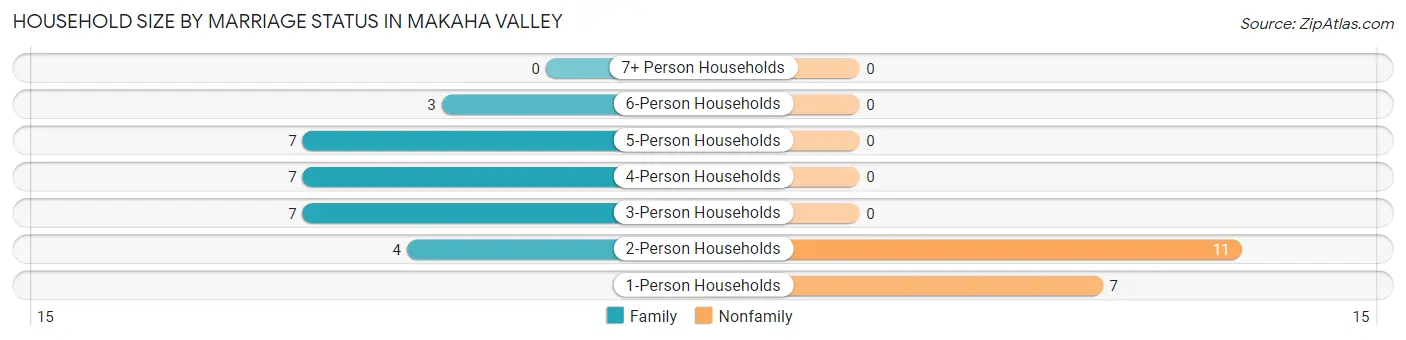
Household Size by Marriage Status in Makaha Valley
Out of a total of 46 households in Makaha Valley, 28 (60.9%) are family households, while 18 (39.1%) are nonfamily households. The most numerous type of family households are 3-person households, comprising 7, and the most common type of nonfamily households are 2-person households, comprising 11.
| Household Size | Family Households | Nonfamily Households |
| 1-Person Households | - | 7 (15.2%) |
| 2-Person Households | 4 (8.7%) | 11 (23.9%) |
| 3-Person Households | 7 (15.2%) | 0 (0.0%) |
| 4-Person Households | 7 (15.2%) | 0 (0.0%) |
| 5-Person Households | 7 (15.2%) | 0 (0.0%) |
| 6-Person Households | 3 (6.5%) | 0 (0.0%) |
| 7+ Person Households | 0 (0.0%) | 0 (0.0%) |
| Total | 28 (60.9%) | 18 (39.1%) |
Female Fertility in Makaha Valley
Fertility by Age in Makaha Valley
| Age Bracket | Women with Births | Births / 1,000 Women |
| 15 to 19 years | 0 (0.0%) | 0.0 |
| 20 to 34 years | 0 (0.0%) | 0.0 |
| 35 to 50 years | 0 (0.0%) | 0.0 |
| Total | 0 (0.0%) | 0.0 |
Fertility by Age by Marriage Status in Makaha Valley
| Age Bracket | Married | Unmarried |
| 15 to 19 years | 0 (0.0%) | 0 (0.0%) |
| 20 to 34 years | 0 (0.0%) | 0 (0.0%) |
| 35 to 50 years | 0 (0.0%) | 0 (0.0%) |
| Total | 0 (0.0%) | 0 (0.0%) |
Fertility by Education in Makaha Valley
| Educational Attainment | Women with Births | Births / 1,000 Women |
| Less than High School | 0 (0.0%) | 0.0 |
| High School Diploma | 0 (0.0%) | 0.0 |
| College or Associate's Degree | 0 (0.0%) | 0.0 |
| Bachelor's Degree | 0 (0.0%) | 0.0 |
| Graduate Degree | 0 (0.0%) | 0.0 |
| Total | 0 (0.0%) | 0.0 |
Fertility by Education by Marriage Status in Makaha Valley
| Educational Attainment | Married | Unmarried |
| Less than High School | 0 (0.0%) | 0 (0.0%) |
| High School Diploma | 0 (0.0%) | 0 (0.0%) |
| College or Associate's Degree | 0 (0.0%) | 0 (0.0%) |
| Bachelor's Degree | 0 (0.0%) | 0 (0.0%) |
| Graduate Degree | 0 (0.0%) | 0 (0.0%) |
| Total | 0 (0.0%) | 0 (0.0%) |
Income in Makaha Valley
Income Overview in Makaha Valley
Per Capita Income in Makaha Valley is $91,479, while median incomes of families and households are $248,750 and $250,000 respectively.
| Characteristic | Number | Measure |
| Per Capita Income | 158 | $91,479 |
| Median Family Income | 28 | $248,750 |
| Mean Family Income | 28 | $264,300 |
| Median Household Income | 46 | $250,000 |
| Mean Household Income | 46 | $312,548 |
| Income Deficit | 28 | $0 |
| Wage / Income Gap (%) | 158 | 0.00% |
| Wage / Income Gap ($) | 158 | 100.00¢ per $1 |
| Gini / Inequality Index | 158 | 0.44 |
Earnings by Sex in Makaha Valley
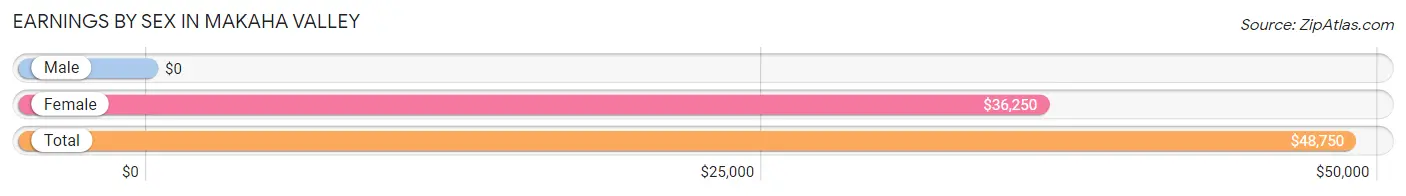
| Sex | Number | Average Earnings |
| Male | 40 (51.3%) | $0 |
| Female | 38 (48.7%) | $36,250 |
| Total | 78 (100.0%) | $48,750 |
Earnings by Sex by Income Bracket in Makaha Valley
The most common earnings brackets in Makaha Valley are $100,000+ for men (20 | 50.0%) and $100,000+ for women (10 | 26.3%).
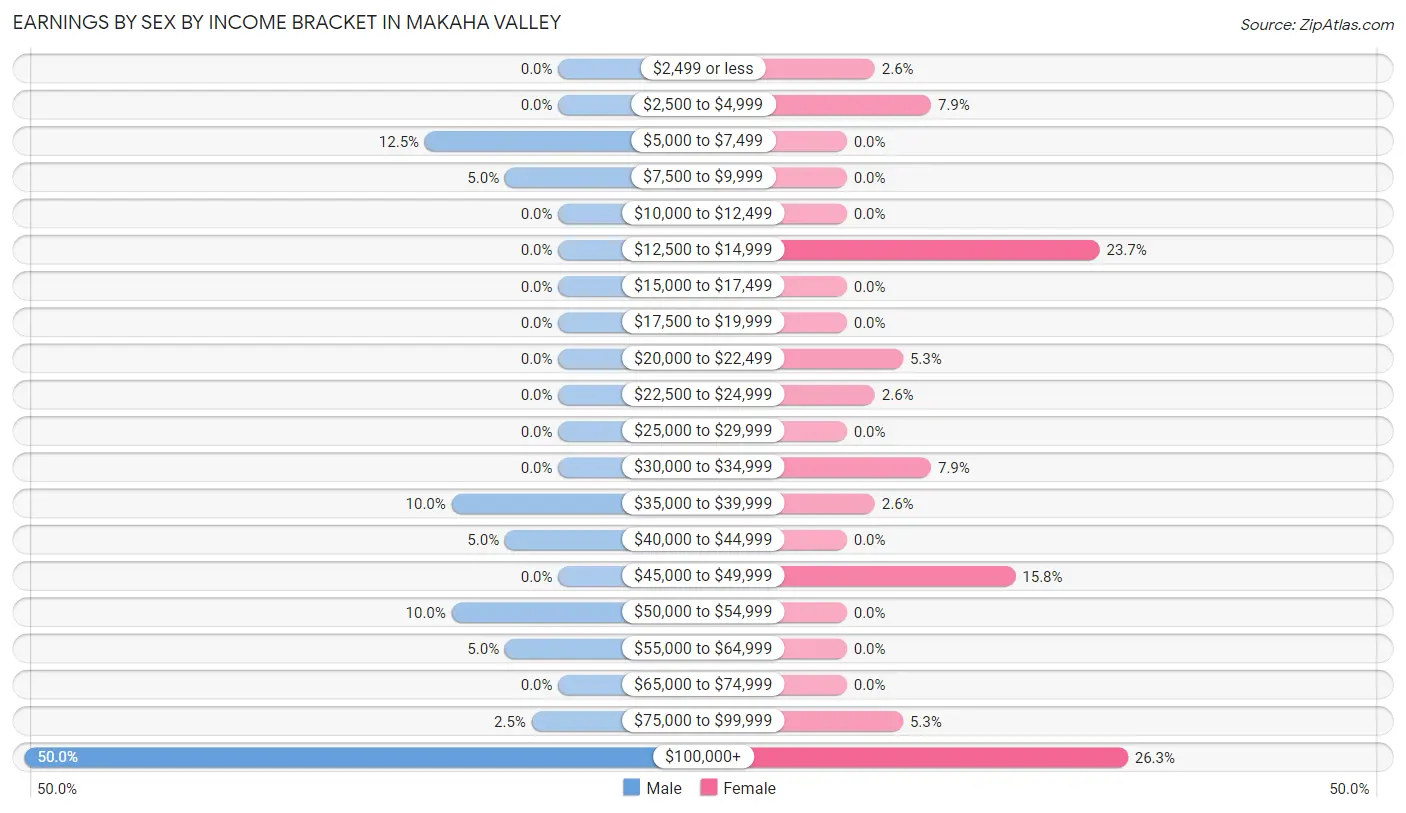
| Income | Male | Female |
| $2,499 or less | 0 (0.0%) | 1 (2.6%) |
| $2,500 to $4,999 | 0 (0.0%) | 3 (7.9%) |
| $5,000 to $7,499 | 5 (12.5%) | 0 (0.0%) |
| $7,500 to $9,999 | 2 (5.0%) | 0 (0.0%) |
| $10,000 to $12,499 | 0 (0.0%) | 0 (0.0%) |
| $12,500 to $14,999 | 0 (0.0%) | 9 (23.7%) |
| $15,000 to $17,499 | 0 (0.0%) | 0 (0.0%) |
| $17,500 to $19,999 | 0 (0.0%) | 0 (0.0%) |
| $20,000 to $22,499 | 0 (0.0%) | 2 (5.3%) |
| $22,500 to $24,999 | 0 (0.0%) | 1 (2.6%) |
| $25,000 to $29,999 | 0 (0.0%) | 0 (0.0%) |
| $30,000 to $34,999 | 0 (0.0%) | 3 (7.9%) |
| $35,000 to $39,999 | 4 (10.0%) | 1 (2.6%) |
| $40,000 to $44,999 | 2 (5.0%) | 0 (0.0%) |
| $45,000 to $49,999 | 0 (0.0%) | 6 (15.8%) |
| $50,000 to $54,999 | 4 (10.0%) | 0 (0.0%) |
| $55,000 to $64,999 | 2 (5.0%) | 0 (0.0%) |
| $65,000 to $74,999 | 0 (0.0%) | 0 (0.0%) |
| $75,000 to $99,999 | 1 (2.5%) | 2 (5.3%) |
| $100,000+ | 20 (50.0%) | 10 (26.3%) |
| Total | 40 (100.0%) | 38 (100.0%) |
Earnings by Sex by Educational Attainment in Makaha Valley
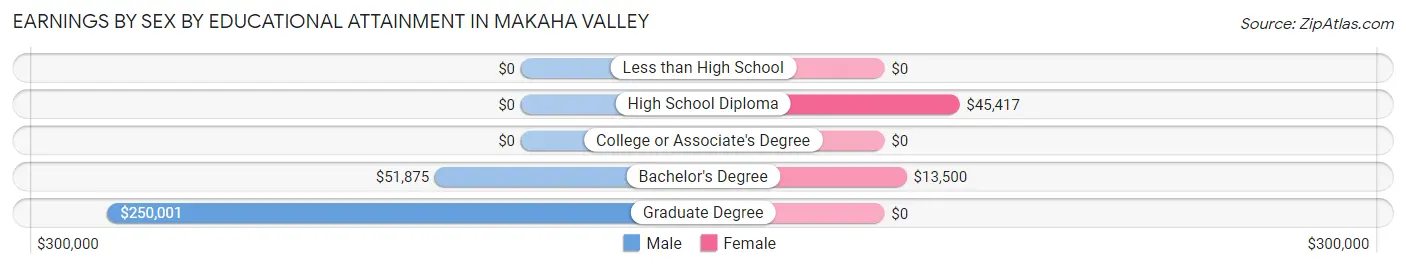
| Educational Attainment | Male Income | Female Income |
| Less than High School | - | - |
| High School Diploma | - | - |
| College or Associate's Degree | - | - |
| Bachelor's Degree | $51,875 | $13,500 |
| Graduate Degree | $250,001 | $0 |
| Total | - | - |
Family Income in Makaha Valley
Family Income Brackets in Makaha Valley
According to the Makaha Valley family income data, there are 17 families falling into the $200,000+ income range, which is the most common income bracket and makes up 60.7% of all families.
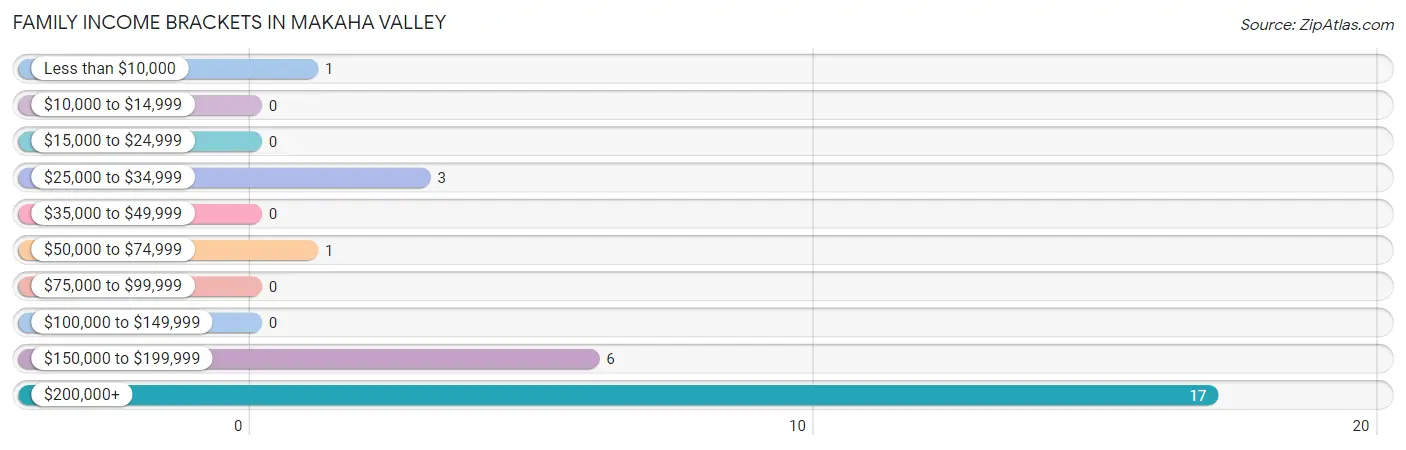
| Income Bracket | # Families | % Families |
| Less than $10,000 | 1 | 3.6% |
| $10,000 to $14,999 | 0 | 0.0% |
| $15,000 to $24,999 | 0 | 0.0% |
| $25,000 to $34,999 | 3 | 10.7% |
| $35,000 to $49,999 | 0 | 0.0% |
| $50,000 to $74,999 | 1 | 3.6% |
| $75,000 to $99,999 | 0 | 0.0% |
| $100,000 to $149,999 | 0 | 0.0% |
| $150,000 to $199,999 | 6 | 21.4% |
| $200,000+ | 17 | 60.7% |
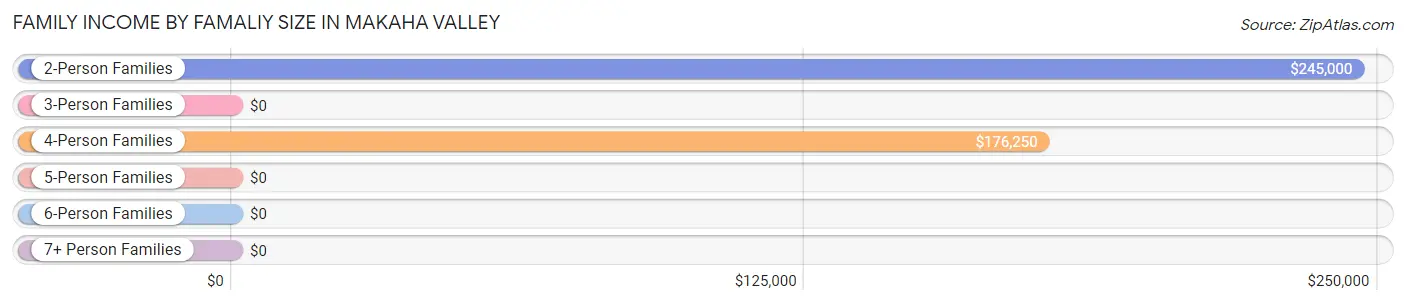
Family Income by Famaliy Size in Makaha Valley
2-person families (4 | 14.3%) account for the highest median family income in Makaha Valley with $245,000 per family, while 2-person families (4 | 14.3%) have the highest median income of $122,500 per family member.
| Income Bracket | # Families | Median Income |
| 2-Person Families | 4 (14.3%) | $245,000 |
| 3-Person Families | 10 (35.7%) | $0 |
| 4-Person Families | 9 (32.1%) | $176,250 |
| 5-Person Families | 5 (17.9%) | $0 |
| 6-Person Families | 0 (0.0%) | $0 |
| 7+ Person Families | 0 (0.0%) | $0 |
| Total | 28 (100.0%) | $248,750 |
Family Income by Number of Earners in Makaha Valley
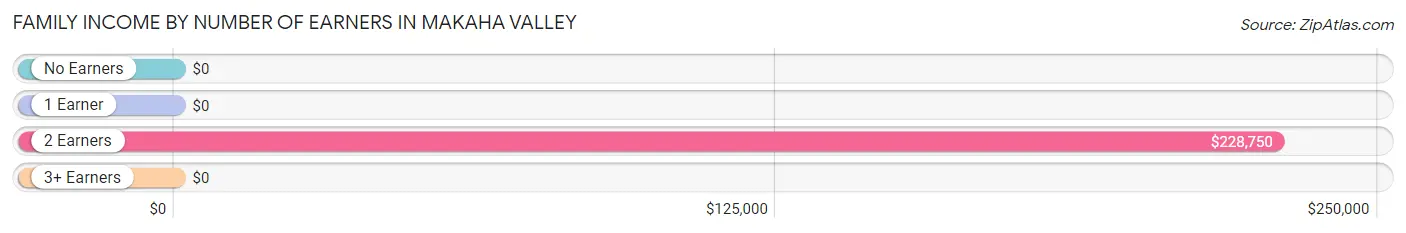
| Number of Earners | # Families | Median Income |
| No Earners | 1 (3.6%) | $0 |
| 1 Earner | 13 (46.4%) | $0 |
| 2 Earners | 9 (32.1%) | $228,750 |
| 3+ Earners | 5 (17.9%) | $0 |
| Total | 28 (100.0%) | $248,750 |
Household Income in Makaha Valley
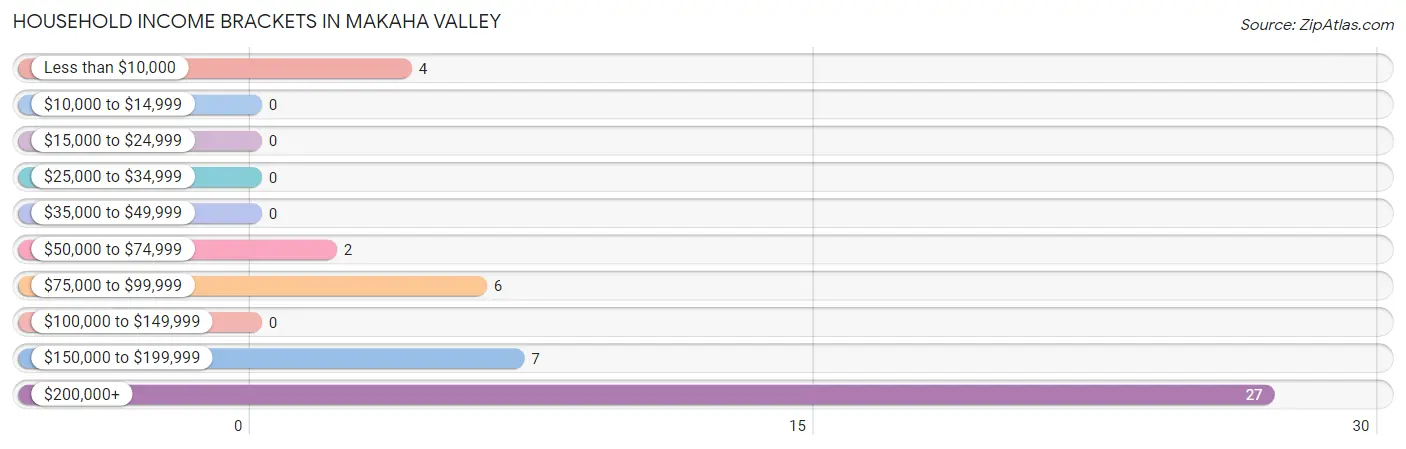
Household Income Brackets in Makaha Valley
With 27 households falling in the category, the $200,000+ income range is the most frequent in Makaha Valley, accounting for 58.7% of all households.
| Income Bracket | # Households | % Households |
| Less than $10,000 | 4 | 8.7% |
| $10,000 to $14,999 | 0 | 0.0% |
| $15,000 to $24,999 | 0 | 0.0% |
| $25,000 to $34,999 | 0 | 0.0% |
| $35,000 to $49,999 | 0 | 0.0% |
| $50,000 to $74,999 | 2 | 4.3% |
| $75,000 to $99,999 | 6 | 13.0% |
| $100,000 to $149,999 | 0 | 0.0% |
| $150,000 to $199,999 | 7 | 15.2% |
| $200,000+ | 27 | 58.7% |
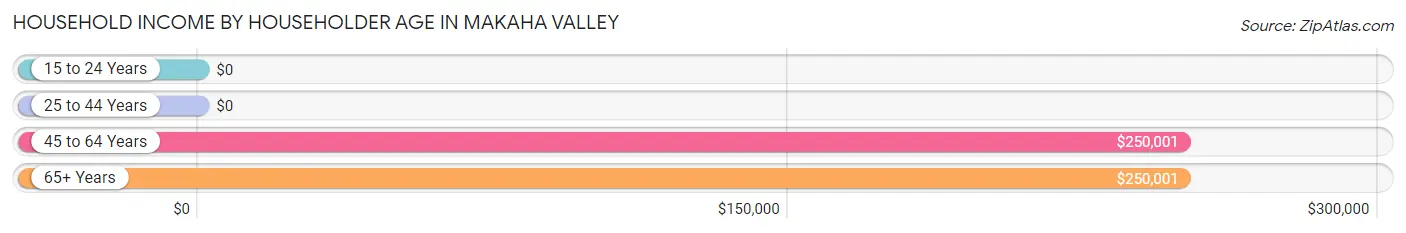
Household Income by Householder Age in Makaha Valley
The median household income in Makaha Valley is $250,000, with the highest median household income of $250,001 found in the 45 to 64 years age bracket for the primary householder. A total of 13 households (28.3%) fall into this category. Meanwhile, the 15 to 24 years age bracket for the primary householder has the lowest median household income of $0, with 3 households (6.5%) in this group.
| Income Bracket | # Households | Median Income |
| 15 to 24 Years | 3 (6.5%) | $0 |
| 25 to 44 Years | 11 (23.9%) | $0 |
| 45 to 64 Years | 13 (28.3%) | $250,001 |
| 65+ Years | 19 (41.3%) | $250,001 |
| Total | 46 (100.0%) | $250,000 |
Poverty in Makaha Valley
Income Below Poverty by Sex and Age in Makaha Valley
With 5.6% poverty level for males and 10.1% for females among the residents of Makaha Valley, 18 to 24 year old males and 25 to 34 year old females are the most vulnerable to poverty, with 2 males (40.0%) and 3 females (27.3%) in their respective age groups living below the poverty level.
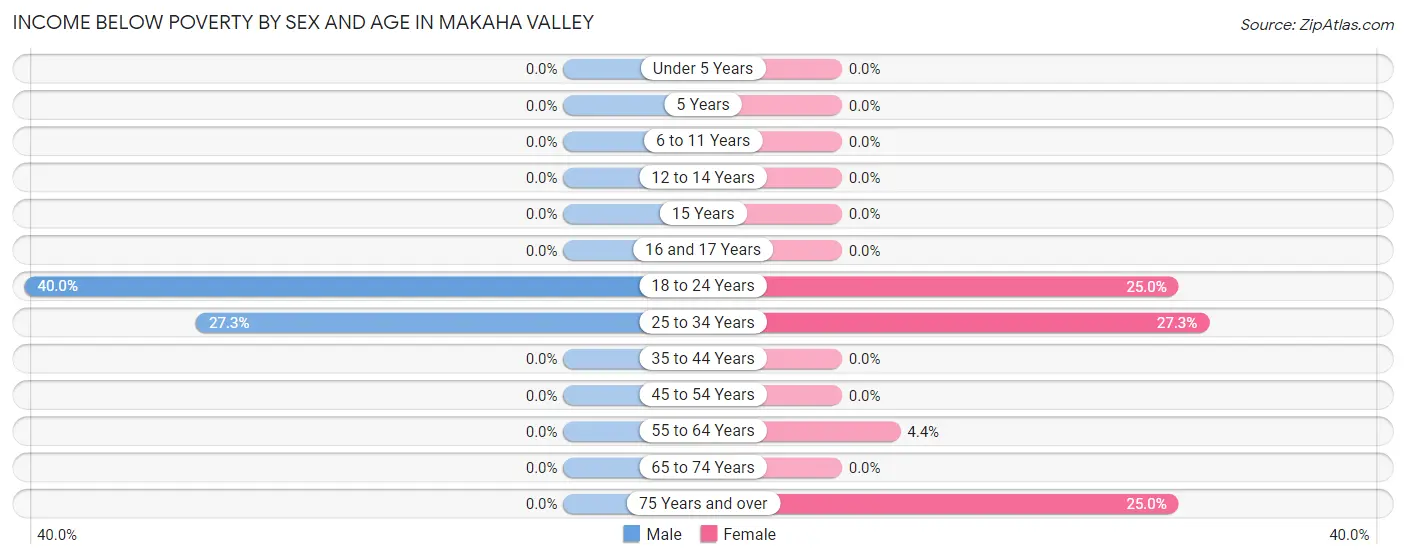
| Age Bracket | Male | Female |
| Under 5 Years | 0 (0.0%) | 0 (0.0%) |
| 5 Years | 0 (0.0%) | 0 (0.0%) |
| 6 to 11 Years | 0 (0.0%) | 0 (0.0%) |
| 12 to 14 Years | 0 (0.0%) | 0 (0.0%) |
| 15 Years | 0 (0.0%) | 0 (0.0%) |
| 16 and 17 Years | 0 (0.0%) | 0 (0.0%) |
| 18 to 24 Years | 2 (40.0%) | 2 (25.0%) |
| 25 to 34 Years | 3 (27.3%) | 3 (27.3%) |
| 35 to 44 Years | 0 (0.0%) | 0 (0.0%) |
| 45 to 54 Years | 0 (0.0%) | 0 (0.0%) |
| 55 to 64 Years | 0 (0.0%) | 1 (4.3%) |
| 65 to 74 Years | 0 (0.0%) | 0 (0.0%) |
| 75 Years and over | 0 (0.0%) | 1 (25.0%) |
| Total | 5 (5.6%) | 7 (10.1%) |
Income Above Poverty by Sex and Age in Makaha Valley
According to the poverty statistics in Makaha Valley, males aged under 5 years and females aged 6 to 11 years are the age groups that are most secure financially, with 100.0% of males and 100.0% of females in these age groups living above the poverty line.
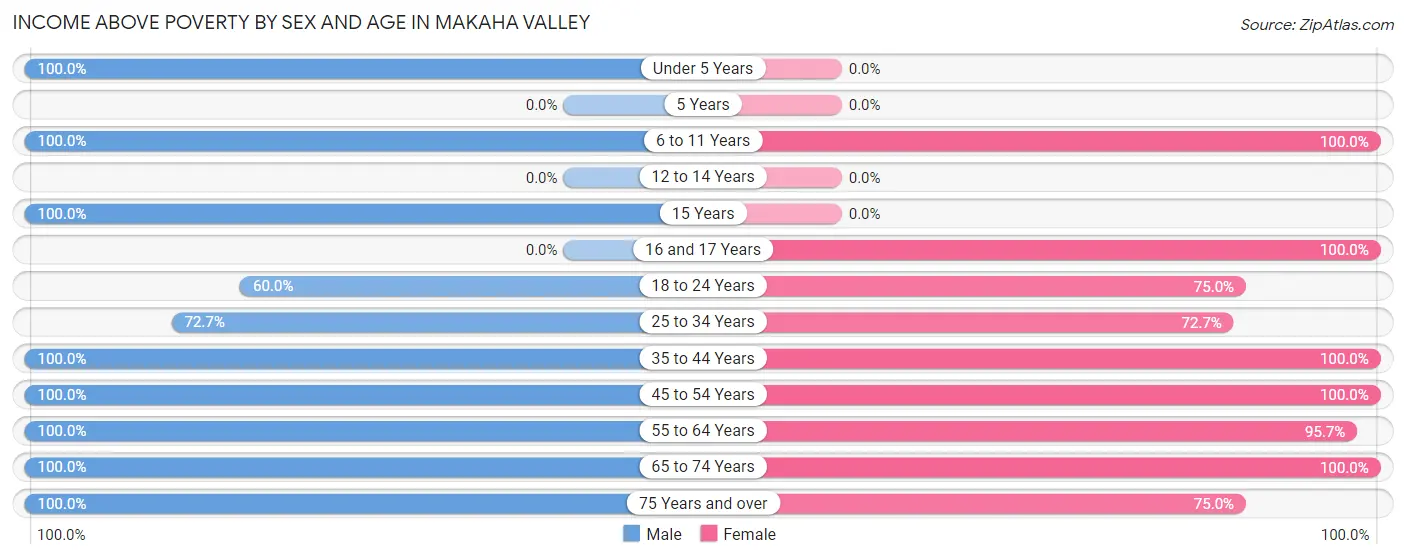
| Age Bracket | Male | Female |
| Under 5 Years | 15 (100.0%) | 0 (0.0%) |
| 5 Years | 0 (0.0%) | 0 (0.0%) |
| 6 to 11 Years | 20 (100.0%) | 4 (100.0%) |
| 12 to 14 Years | 0 (0.0%) | 0 (0.0%) |
| 15 Years | 3 (100.0%) | 0 (0.0%) |
| 16 and 17 Years | 0 (0.0%) | 1 (100.0%) |
| 18 to 24 Years | 3 (60.0%) | 6 (75.0%) |
| 25 to 34 Years | 8 (72.7%) | 8 (72.7%) |
| 35 to 44 Years | 2 (100.0%) | 8 (100.0%) |
| 45 to 54 Years | 7 (100.0%) | 6 (100.0%) |
| 55 to 64 Years | 4 (100.0%) | 22 (95.7%) |
| 65 to 74 Years | 20 (100.0%) | 4 (100.0%) |
| 75 Years and over | 2 (100.0%) | 3 (75.0%) |
| Total | 84 (94.4%) | 62 (89.9%) |
Income Below Poverty Among Married-Couple Families in Makaha Valley
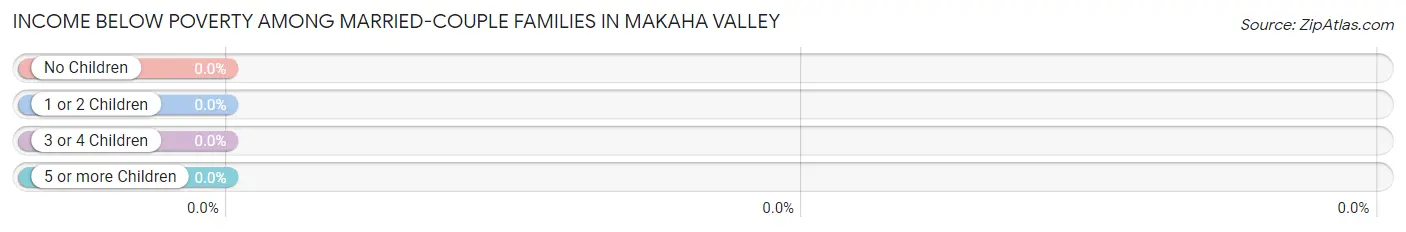
| Children | Above Poverty | Below Poverty |
| No Children | 10 (100.0%) | 0 (0.0%) |
| 1 or 2 Children | 7 (100.0%) | 0 (0.0%) |
| 3 or 4 Children | 0 (0.0%) | 0 (0.0%) |
| 5 or more Children | 0 (0.0%) | 0 (0.0%) |
| Total | 17 (100.0%) | 0 (0.0%) |
Income Below Poverty Among Single-Parent Households in Makaha Valley
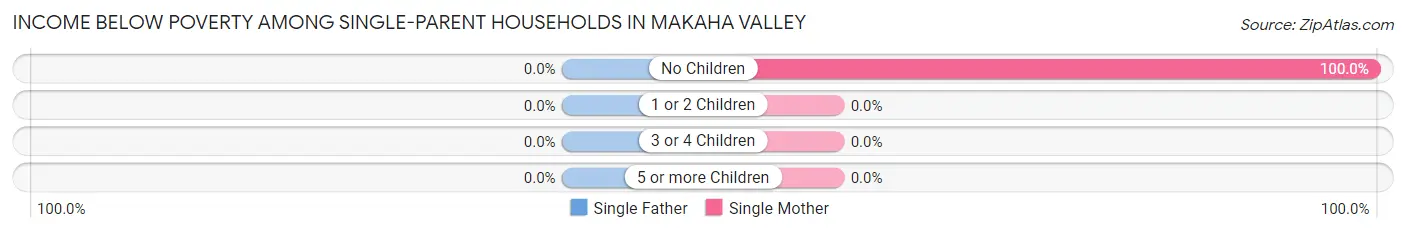
| Children | Single Father | Single Mother |
| No Children | 0 (0.0%) | 1 (100.0%) |
| 1 or 2 Children | 0 (0.0%) | 0 (0.0%) |
| 3 or 4 Children | 0 (0.0%) | 0 (0.0%) |
| 5 or more Children | 0 (0.0%) | 0 (0.0%) |
| Total | 0 (0.0%) | 1 (9.1%) |
Income Below Poverty Among Married-Couple vs Single-Parent Households in Makaha Valley
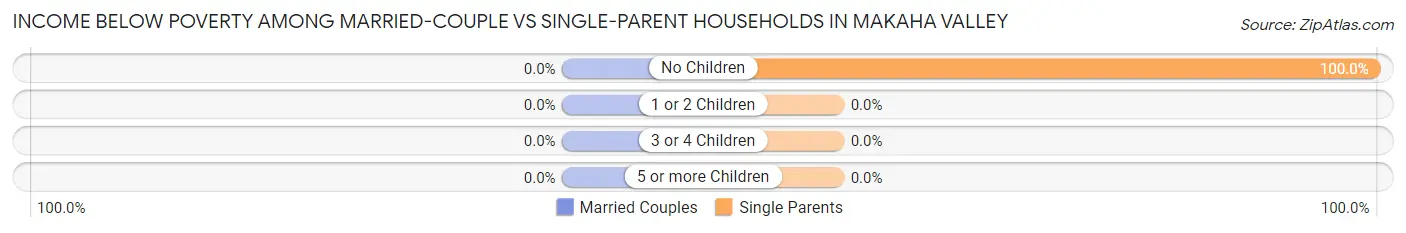
| Children | Married-Couple Families | Single-Parent Households |
| No Children | 0 (0.0%) | 1 (100.0%) |
| 1 or 2 Children | 0 (0.0%) | 0 (0.0%) |
| 3 or 4 Children | 0 (0.0%) | 0 (0.0%) |
| 5 or more Children | 0 (0.0%) | 0 (0.0%) |
| Total | 0 (0.0%) | 1 (9.1%) |
Employment Characteristics in Makaha Valley
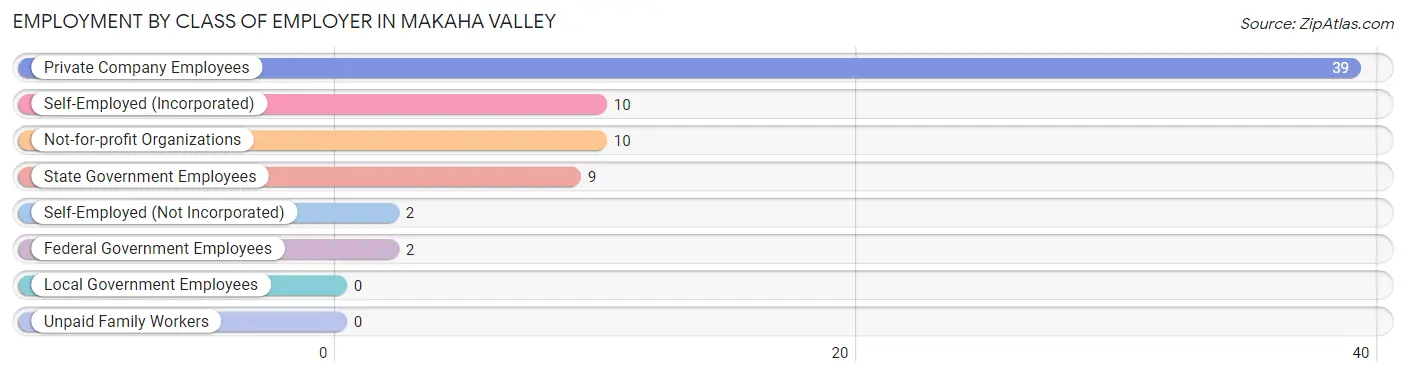
Employment by Class of Employer in Makaha Valley
Among the 72 employed individuals in Makaha Valley, private company employees (39 | 54.2%), self-employed (incorporated) (10 | 13.9%), and not-for-profit organizations (10 | 13.9%) make up the most common classes of employment.
| Employer Class | # Employees | % Employees |
| Private Company Employees | 39 | 54.2% |
| Self-Employed (Incorporated) | 10 | 13.9% |
| Self-Employed (Not Incorporated) | 2 | 2.8% |
| Not-for-profit Organizations | 10 | 13.9% |
| Local Government Employees | 0 | 0.0% |
| State Government Employees | 9 | 12.5% |
| Federal Government Employees | 2 | 2.8% |
| Unpaid Family Workers | 0 | 0.0% |
| Total | 72 | 100.0% |
Employment Status by Age in Makaha Valley
According to the labor force statistics for Makaha Valley, out of the total population over 16 years of age (116), 68.1% or 79 individuals are in the labor force, with 8.9% or 7 of them unemployed. The age group with the highest labor force participation rate is 20 to 24 years, with 100.0% or 10 individuals in the labor force. Within the labor force, the 16 to 19 years age range has the highest percentage of unemployed individuals, with 100.0% or 2 of them being unemployed.
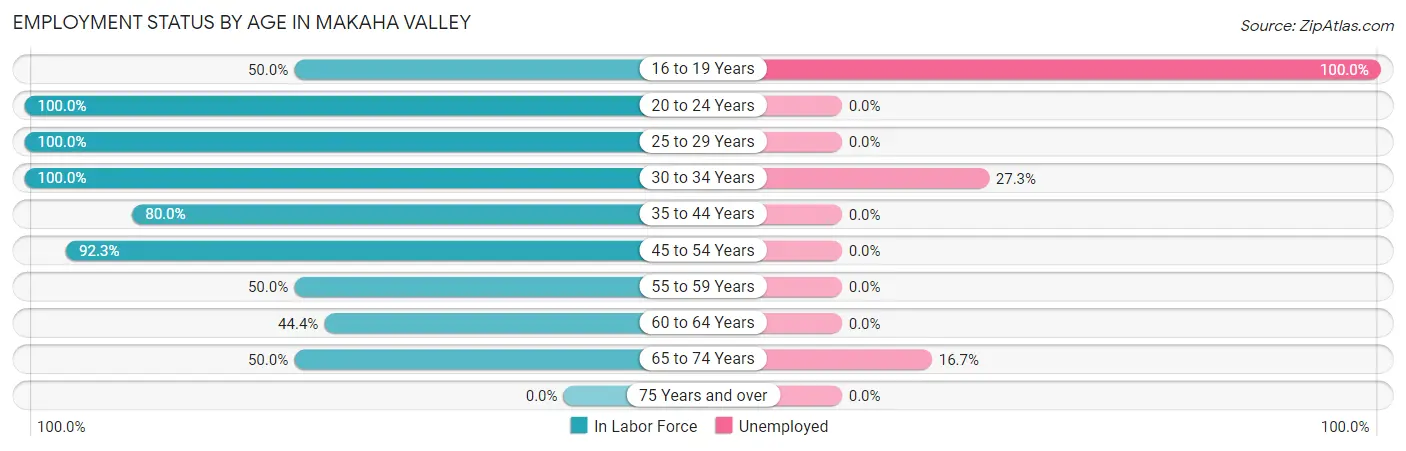
| Age Bracket | In Labor Force | Unemployed |
| 16 to 19 Years | 2 (50.0%) | 2 (100.0%) |
| 20 to 24 Years | 10 (100.0%) | 0 (0.0%) |
| 25 to 29 Years | 11 (100.0%) | 0 (0.0%) |
| 30 to 34 Years | 11 (100.0%) | 3 (27.3%) |
| 35 to 44 Years | 8 (80.0%) | 0 (0.0%) |
| 45 to 54 Years | 12 (92.3%) | 0 (0.0%) |
| 55 to 59 Years | 9 (50.0%) | 0 (0.0%) |
| 60 to 64 Years | 4 (44.4%) | 0 (0.0%) |
| 65 to 74 Years | 12 (50.0%) | 2 (16.7%) |
| 75 Years and over | 0 (0.0%) | 0 (0.0%) |
| Total | 79 (68.1%) | 7 (8.9%) |
Employment Status by Educational Attainment in Makaha Valley
According to labor force statistics for Makaha Valley, 76.4% of individuals (55) out of the total population between 25 and 64 years of age (72) are in the labor force, with 5.5% or 3 of them being unemployed. The group with the highest labor force participation rate are those with the educational attainment of high school diploma, with 100.0% or 7 individuals in the labor force. Within the labor force, individuals with bachelor's degree or higher education have the highest percentage of unemployment, with 8.6% or 3 of them being unemployed.
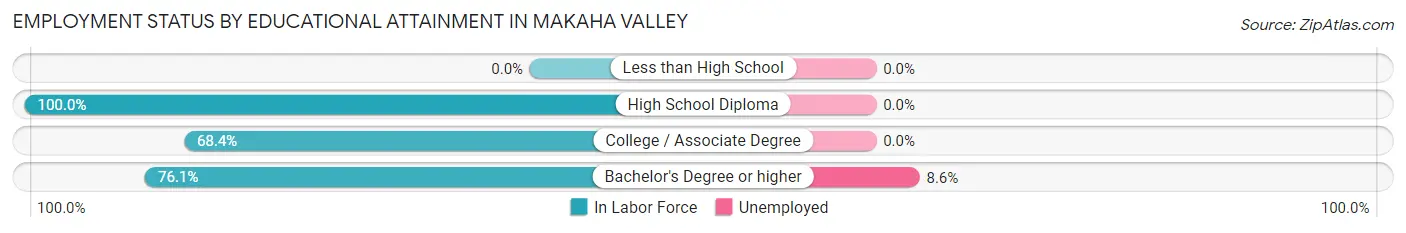
| Educational Attainment | In Labor Force | Unemployed |
| Less than High School | 0 (0.0%) | 0 (0.0%) |
| High School Diploma | 7 (100.0%) | 0 (0.0%) |
| College / Associate Degree | 13 (68.4%) | 0 (0.0%) |
| Bachelor's Degree or higher | 35 (76.1%) | 4 (8.6%) |
| Total | 55 (76.4%) | 4 (5.5%) |
Employment Occupations by Sex in Makaha Valley
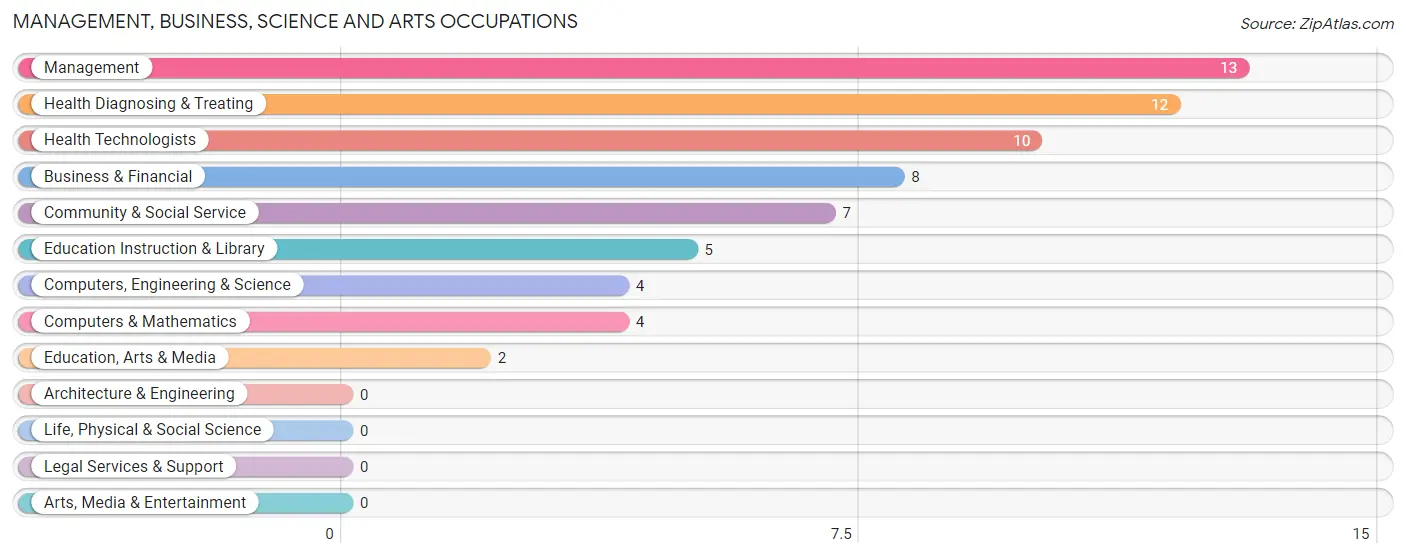
Management, Business, Science and Arts Occupations
The most common Management, Business, Science and Arts occupations in Makaha Valley are Management (13 | 18.1%), Health Diagnosing & Treating (12 | 16.7%), Health Technologists (10 | 13.9%), Business & Financial (8 | 11.1%), and Community & Social Service (7 | 9.7%).
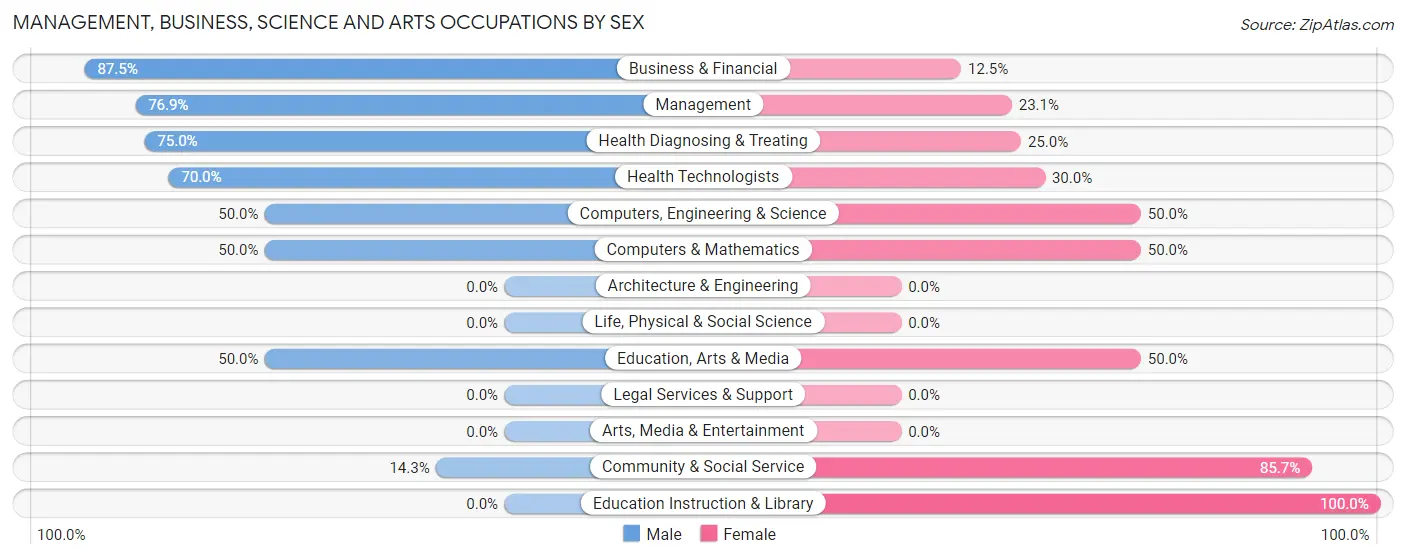
Management, Business, Science and Arts Occupations by Sex
Within the Management, Business, Science and Arts occupations in Makaha Valley, the most male-oriented occupations are Business & Financial (87.5%), Management (76.9%), and Health Diagnosing & Treating (75.0%), while the most female-oriented occupations are Education Instruction & Library (100.0%), Community & Social Service (85.7%), and Computers, Engineering & Science (50.0%).
| Occupation | Male | Female |
| Management | 10 (76.9%) | 3 (23.1%) |
| Business & Financial | 7 (87.5%) | 1 (12.5%) |
| Computers, Engineering & Science | 2 (50.0%) | 2 (50.0%) |
| Computers & Mathematics | 2 (50.0%) | 2 (50.0%) |
| Architecture & Engineering | 0 (0.0%) | 0 (0.0%) |
| Life, Physical & Social Science | 0 (0.0%) | 0 (0.0%) |
| Community & Social Service | 1 (14.3%) | 6 (85.7%) |
| Education, Arts & Media | 1 (50.0%) | 1 (50.0%) |
| Legal Services & Support | 0 (0.0%) | 0 (0.0%) |
| Education Instruction & Library | 0 (0.0%) | 5 (100.0%) |
| Arts, Media & Entertainment | 0 (0.0%) | 0 (0.0%) |
| Health Diagnosing & Treating | 9 (75.0%) | 3 (25.0%) |
| Health Technologists | 7 (70.0%) | 3 (30.0%) |
| Total (Category) | 29 (65.9%) | 15 (34.1%) |
| Total (Overall) | 38 (52.8%) | 34 (47.2%) |
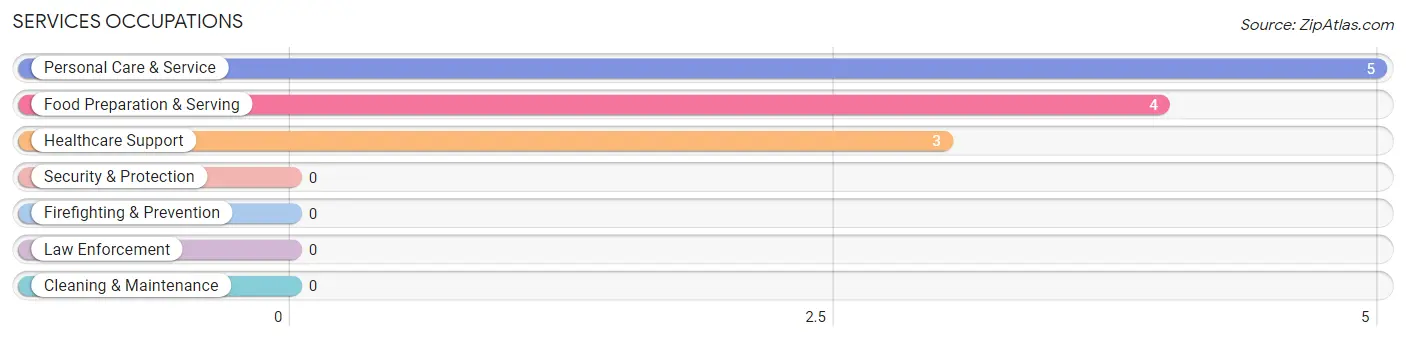
Services Occupations
The most common Services occupations in Makaha Valley are Personal Care & Service (5 | 6.9%), Food Preparation & Serving (4 | 5.6%), and Healthcare Support (3 | 4.2%).
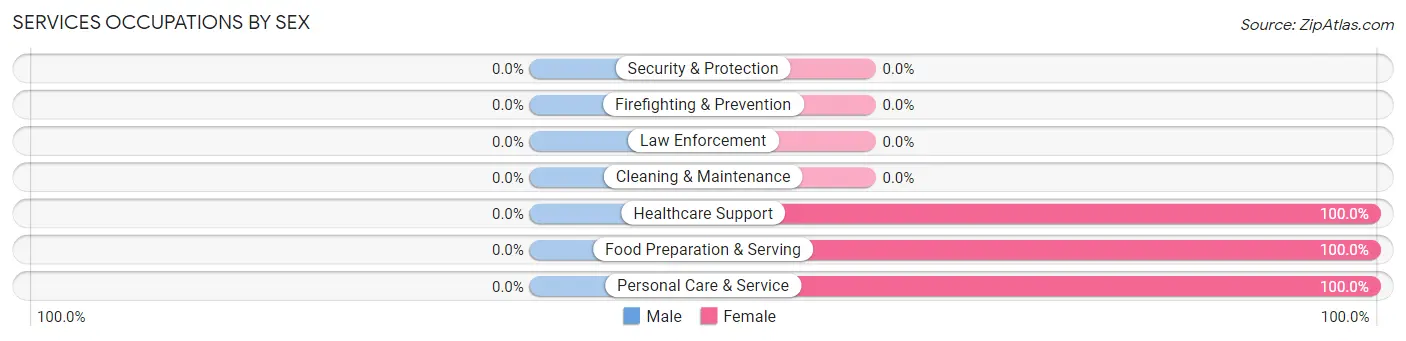
Services Occupations by Sex
| Occupation | Male | Female |
| Healthcare Support | 0 (0.0%) | 3 (100.0%) |
| Security & Protection | 0 (0.0%) | 0 (0.0%) |
| Firefighting & Prevention | 0 (0.0%) | 0 (0.0%) |
| Law Enforcement | 0 (0.0%) | 0 (0.0%) |
| Food Preparation & Serving | 0 (0.0%) | 4 (100.0%) |
| Cleaning & Maintenance | 0 (0.0%) | 0 (0.0%) |
| Personal Care & Service | 0 (0.0%) | 5 (100.0%) |
| Total (Category) | 0 (0.0%) | 12 (100.0%) |
| Total (Overall) | 38 (52.8%) | 34 (47.2%) |
Sales and Office Occupations
The most common Sales and Office occupations in Makaha Valley are , and Sales & Related (9 | 12.5%).
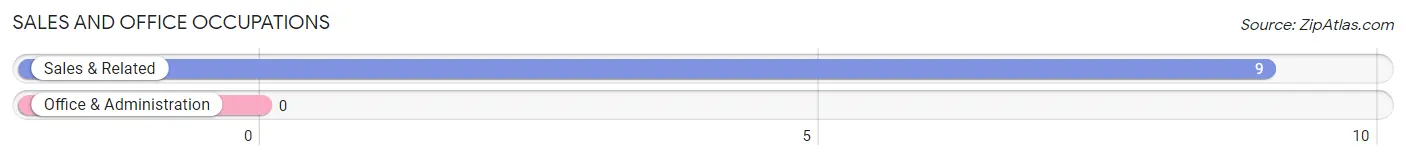
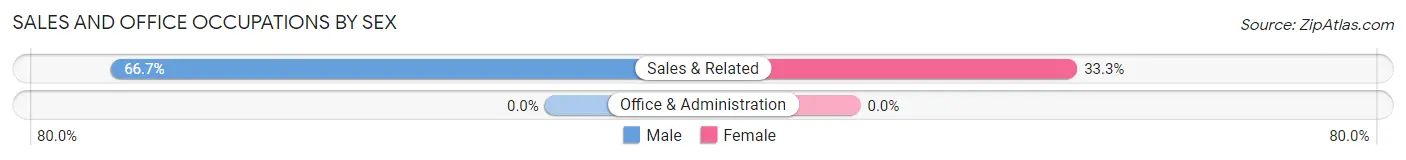
Sales and Office Occupations by Sex
| Occupation | Male | Female |
| Sales & Related | 6 (66.7%) | 3 (33.3%) |
| Office & Administration | 0 (0.0%) | 0 (0.0%) |
| Total (Category) | 6 (66.7%) | 3 (33.3%) |
| Total (Overall) | 38 (52.8%) | 34 (47.2%) |
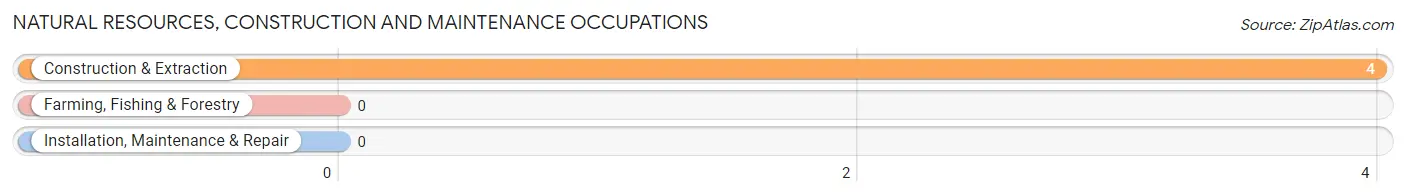
Natural Resources, Construction and Maintenance Occupations
The most common Natural Resources, Construction and Maintenance occupations in Makaha Valley are , and Construction & Extraction (4 | 5.6%).
Natural Resources, Construction and Maintenance Occupations by Sex
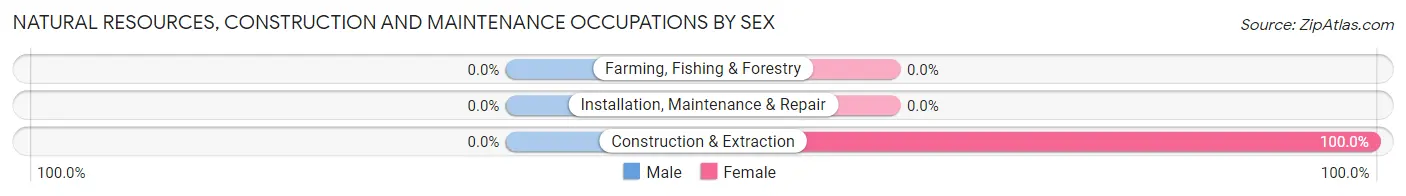
| Occupation | Male | Female |
| Farming, Fishing & Forestry | 0 (0.0%) | 0 (0.0%) |
| Construction & Extraction | 0 (0.0%) | 4 (100.0%) |
| Installation, Maintenance & Repair | 0 (0.0%) | 0 (0.0%) |
| Total (Category) | 0 (0.0%) | 4 (100.0%) |
| Total (Overall) | 38 (52.8%) | 34 (47.2%) |
Production, Transportation and Moving Occupations
The most common Production, Transportation and Moving occupations in Makaha Valley are , and Material Moving (3 | 4.2%).
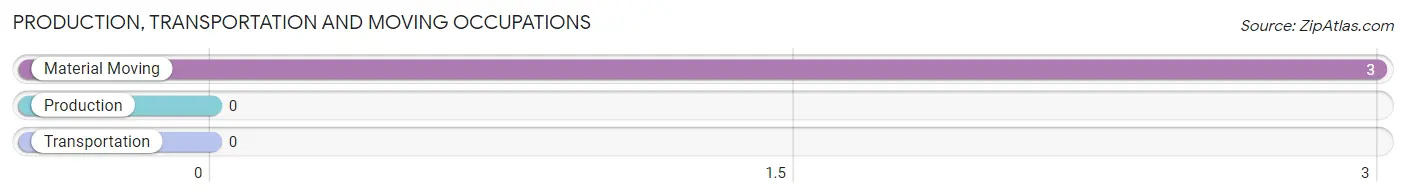
Production, Transportation and Moving Occupations by Sex
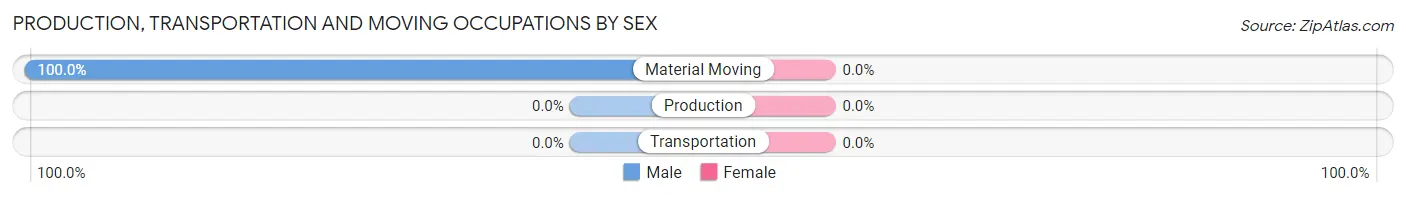
| Occupation | Male | Female |
| Production | 0 (0.0%) | 0 (0.0%) |
| Transportation | 0 (0.0%) | 0 (0.0%) |
| Material Moving | 3 (100.0%) | 0 (0.0%) |
| Total (Category) | 3 (100.0%) | 0 (0.0%) |
| Total (Overall) | 38 (52.8%) | 34 (47.2%) |
Employment Industries by Sex in Makaha Valley
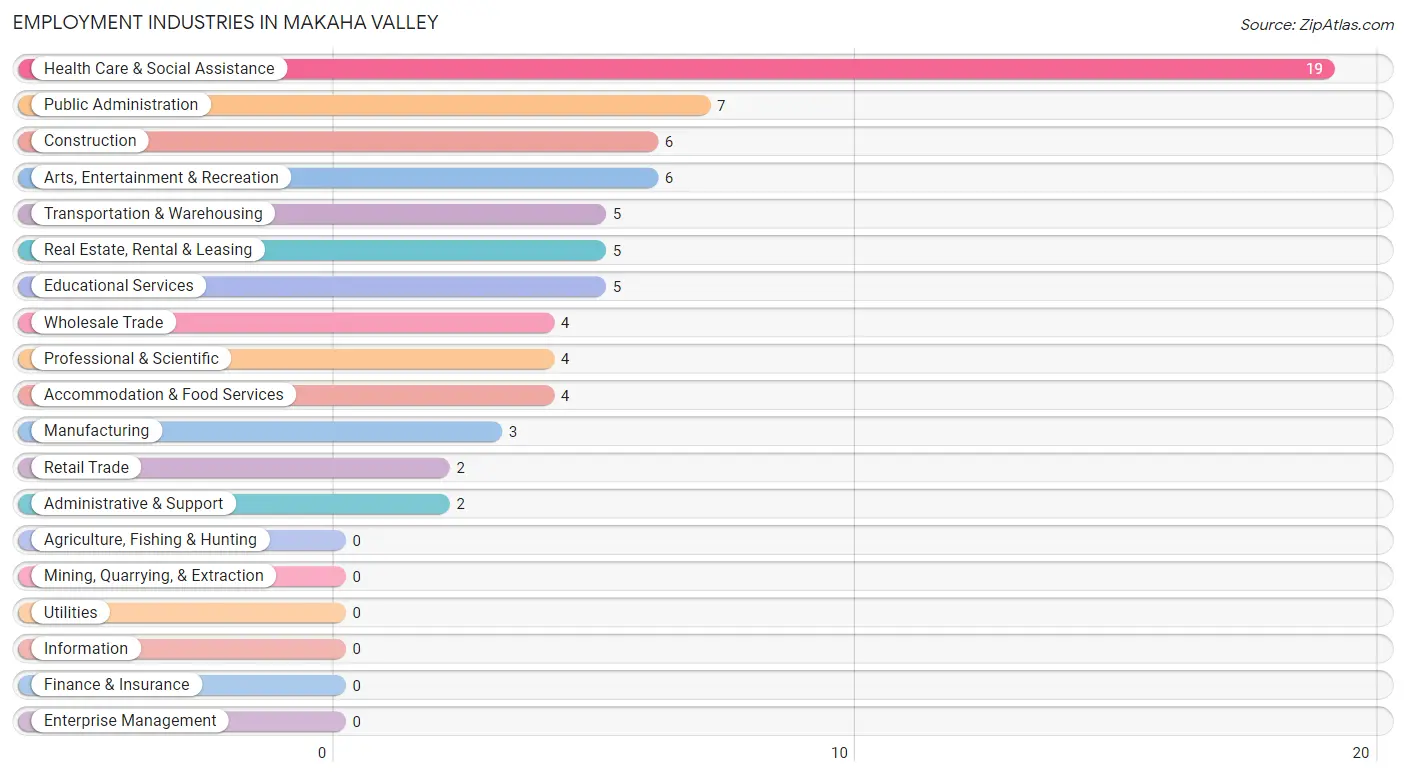
Employment Industries in Makaha Valley
The major employment industries in Makaha Valley include Health Care & Social Assistance (19 | 26.4%), Public Administration (7 | 9.7%), Construction (6 | 8.3%), Arts, Entertainment & Recreation (6 | 8.3%), and Transportation & Warehousing (5 | 6.9%).
Employment Industries by Sex in Makaha Valley
The Makaha Valley industries that see more men than women are Wholesale Trade (100.0%), Real Estate, Rental & Leasing (100.0%), and Administrative & Support (100.0%), whereas the industries that tend to have a higher number of women are Manufacturing (100.0%), Transportation & Warehousing (100.0%), and Professional & Scientific (100.0%).
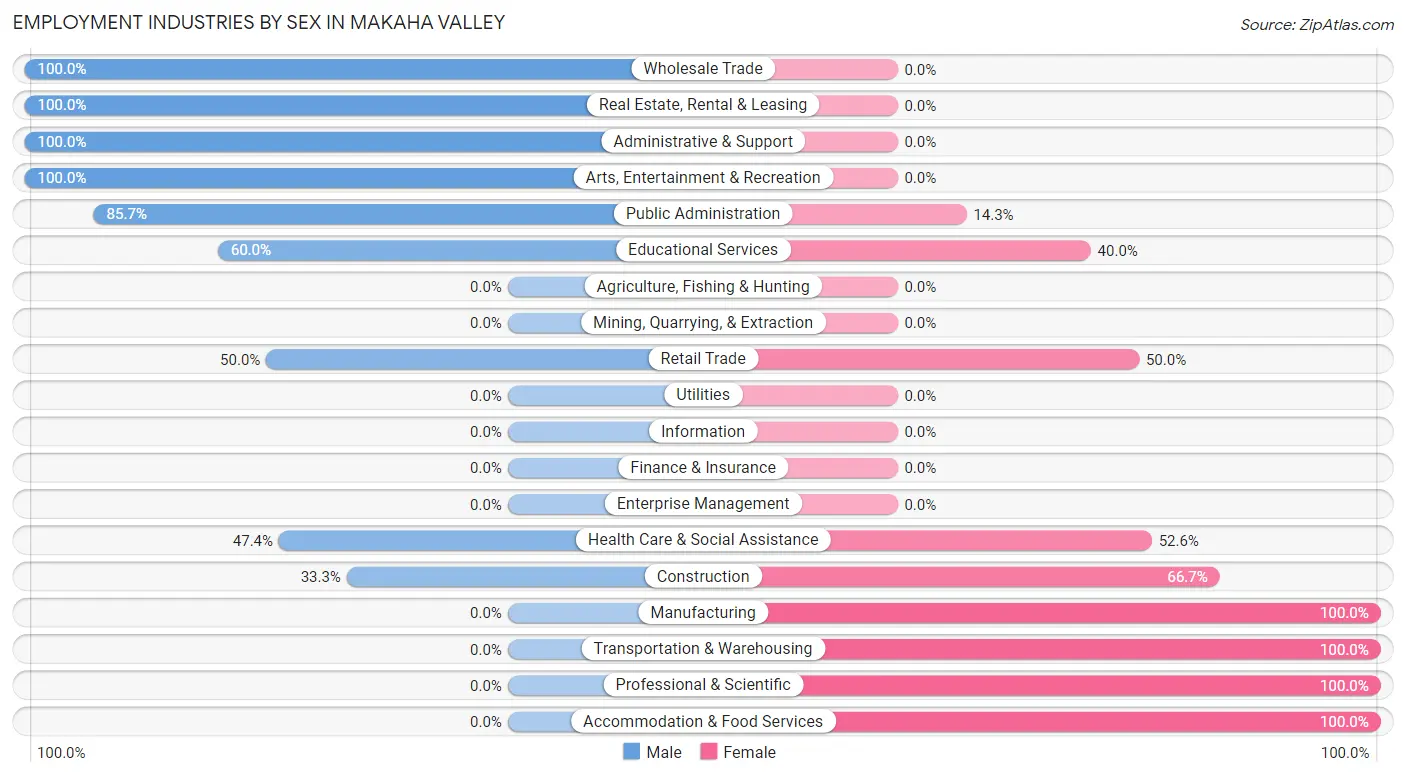
| Industry | Male | Female |
| Agriculture, Fishing & Hunting | 0 (0.0%) | 0 (0.0%) |
| Mining, Quarrying, & Extraction | 0 (0.0%) | 0 (0.0%) |
| Construction | 2 (33.3%) | 4 (66.7%) |
| Manufacturing | 0 (0.0%) | 3 (100.0%) |
| Wholesale Trade | 4 (100.0%) | 0 (0.0%) |
| Retail Trade | 1 (50.0%) | 1 (50.0%) |
| Transportation & Warehousing | 0 (0.0%) | 5 (100.0%) |
| Utilities | 0 (0.0%) | 0 (0.0%) |
| Information | 0 (0.0%) | 0 (0.0%) |
| Finance & Insurance | 0 (0.0%) | 0 (0.0%) |
| Real Estate, Rental & Leasing | 5 (100.0%) | 0 (0.0%) |
| Professional & Scientific | 0 (0.0%) | 4 (100.0%) |
| Enterprise Management | 0 (0.0%) | 0 (0.0%) |
| Administrative & Support | 2 (100.0%) | 0 (0.0%) |
| Educational Services | 3 (60.0%) | 2 (40.0%) |
| Health Care & Social Assistance | 9 (47.4%) | 10 (52.6%) |
| Arts, Entertainment & Recreation | 6 (100.0%) | 0 (0.0%) |
| Accommodation & Food Services | 0 (0.0%) | 4 (100.0%) |
| Public Administration | 6 (85.7%) | 1 (14.3%) |
| Total | 38 (52.8%) | 34 (47.2%) |
Education in Makaha Valley
School Enrollment in Makaha Valley
The most common levels of schooling among the 44 students in Makaha Valley are nursery / preschool (10 | 22.7%), middle school (10 | 22.7%), and kindergarten (8 | 18.2%).
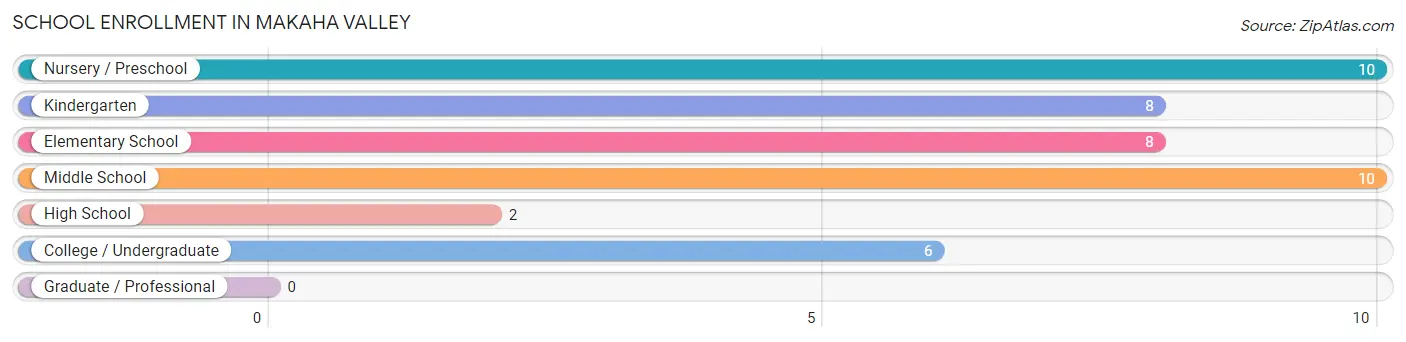
| School Level | # Students | % Students |
| Nursery / Preschool | 10 | 22.7% |
| Kindergarten | 8 | 18.2% |
| Elementary School | 8 | 18.2% |
| Middle School | 10 | 22.7% |
| High School | 2 | 4.5% |
| College / Undergraduate | 6 | 13.6% |
| Graduate / Professional | 0 | 0.0% |
| Total | 44 | 100.0% |
School Enrollment by Age by Funding Source in Makaha Valley
Out of a total of 44 students who are enrolled in schools in Makaha Valley, 12 (27.3%) attend a private institution, while the remaining 32 (72.7%) are enrolled in public schools. The age group of 3 to 4 year olds has the highest likelihood of being enrolled in private schools, with 10 (100.0% in the age bracket) enrolled. Conversely, the age group of 10 to 14 year olds has the lowest likelihood of being enrolled in a private school, with 8 (100.0% in the age bracket) attending a public institution.
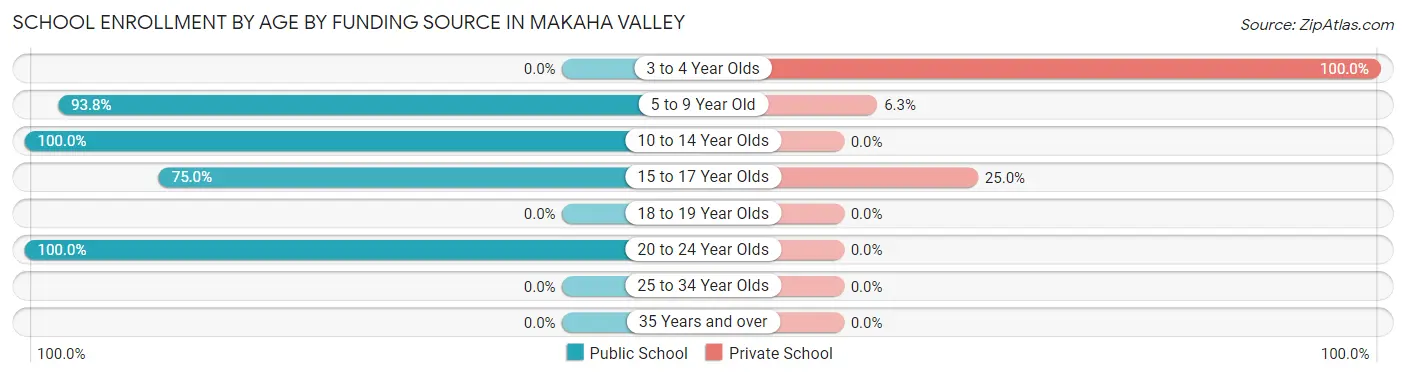
| Age Bracket | Public School | Private School |
| 3 to 4 Year Olds | 0 (0.0%) | 10 (100.0%) |
| 5 to 9 Year Old | 15 (93.8%) | 1 (6.2%) |
| 10 to 14 Year Olds | 8 (100.0%) | 0 (0.0%) |
| 15 to 17 Year Olds | 3 (75.0%) | 1 (25.0%) |
| 18 to 19 Year Olds | 0 (0.0%) | 0 (0.0%) |
| 20 to 24 Year Olds | 6 (100.0%) | 0 (0.0%) |
| 25 to 34 Year Olds | 0 (0.0%) | 0 (0.0%) |
| 35 Years and over | 0 (0.0%) | 0 (0.0%) |
| Total | 32 (72.7%) | 12 (27.3%) |
Educational Attainment by Field of Study in Makaha Valley
Psychology (13 | 17.8%), business (10 | 13.7%), liberal arts & history (10 | 13.7%), literature & languages (8 | 11.0%), and social sciences (6 | 8.2%) are the most common fields of study among 73 individuals in Makaha Valley who have obtained a bachelor's degree or higher.
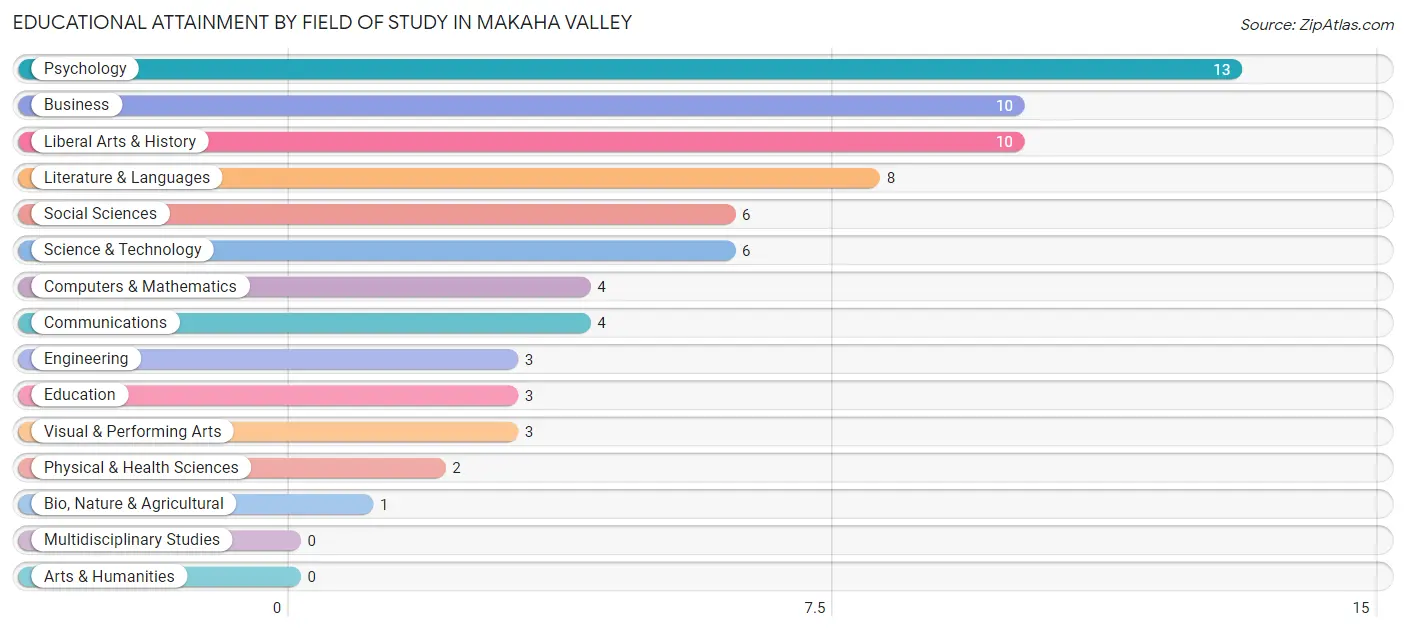
| Field of Study | # Graduates | % Graduates |
| Computers & Mathematics | 4 | 5.5% |
| Bio, Nature & Agricultural | 1 | 1.4% |
| Physical & Health Sciences | 2 | 2.7% |
| Psychology | 13 | 17.8% |
| Social Sciences | 6 | 8.2% |
| Engineering | 3 | 4.1% |
| Multidisciplinary Studies | 0 | 0.0% |
| Science & Technology | 6 | 8.2% |
| Business | 10 | 13.7% |
| Education | 3 | 4.1% |
| Literature & Languages | 8 | 11.0% |
| Liberal Arts & History | 10 | 13.7% |
| Visual & Performing Arts | 3 | 4.1% |
| Communications | 4 | 5.5% |
| Arts & Humanities | 0 | 0.0% |
| Total | 73 | 100.0% |
Transportation & Commute in Makaha Valley
Vehicle Availability by Sex in Makaha Valley
The most prevalent vehicle ownership categories in Makaha Valley are males with 2 vehicles (20, accounting for 52.6%) and females with 2 vehicles (5, making up 58.8%).
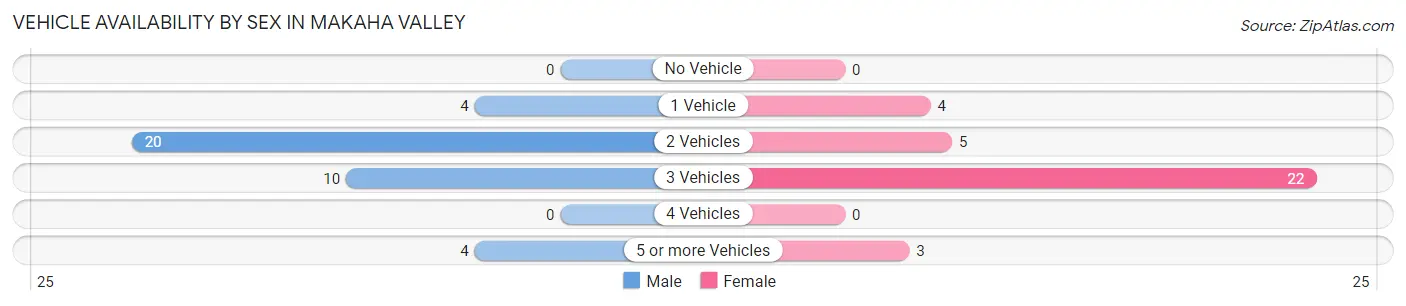
| Vehicles Available | Male | Female |
| No Vehicle | 0 (0.0%) | 0 (0.0%) |
| 1 Vehicle | 4 (10.5%) | 4 (11.8%) |
| 2 Vehicles | 20 (52.6%) | 5 (14.7%) |
| 3 Vehicles | 10 (26.3%) | 22 (64.7%) |
| 4 Vehicles | 0 (0.0%) | 0 (0.0%) |
| 5 or more Vehicles | 4 (10.5%) | 3 (8.8%) |
| Total | 38 (100.0%) | 34 (100.0%) |
Commute Time in Makaha Valley
The most frequently occuring commute durations in Makaha Valley are 90 or more minutes (25 commuters, 39.7%), 15 to 19 minutes (12 commuters, 19.1%), and 30 to 34 minutes (8 commuters, 12.7%).
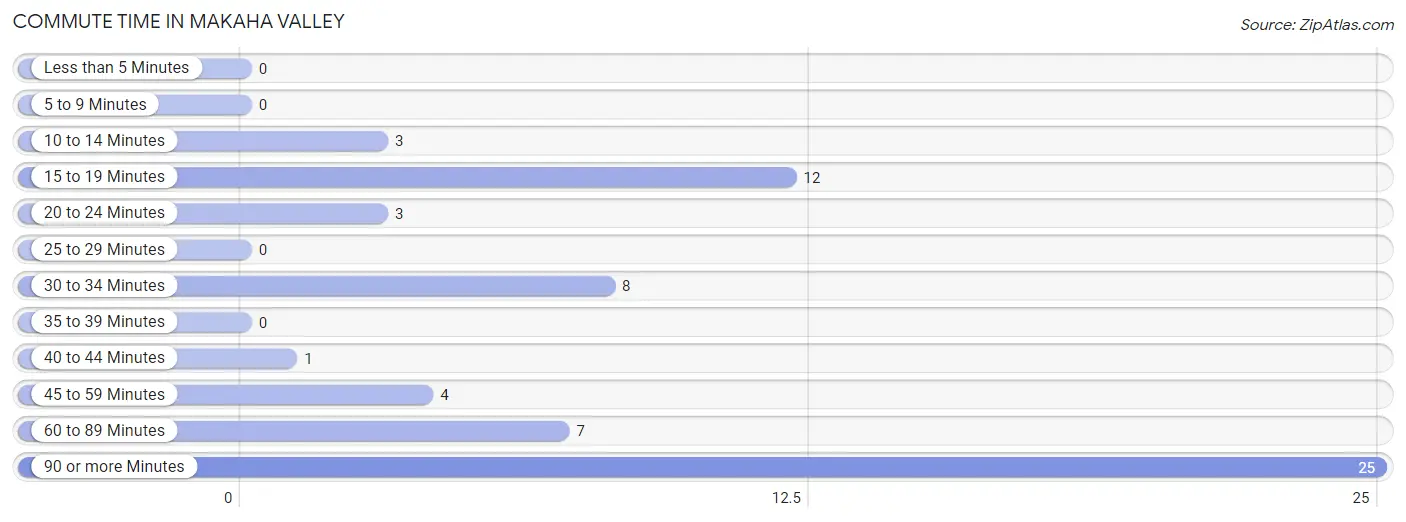
| Commute Time | # Commuters | % Commuters |
| Less than 5 Minutes | 0 | 0.0% |
| 5 to 9 Minutes | 0 | 0.0% |
| 10 to 14 Minutes | 3 | 4.8% |
| 15 to 19 Minutes | 12 | 19.1% |
| 20 to 24 Minutes | 3 | 4.8% |
| 25 to 29 Minutes | 0 | 0.0% |
| 30 to 34 Minutes | 8 | 12.7% |
| 35 to 39 Minutes | 0 | 0.0% |
| 40 to 44 Minutes | 1 | 1.6% |
| 45 to 59 Minutes | 4 | 6.4% |
| 60 to 89 Minutes | 7 | 11.1% |
| 90 or more Minutes | 25 | 39.7% |
Commute Time by Sex in Makaha Valley
The most common commute times in Makaha Valley are 15 to 19 minutes (11 commuters, 35.5%) for males and 90 or more minutes (15 commuters, 46.9%) for females.
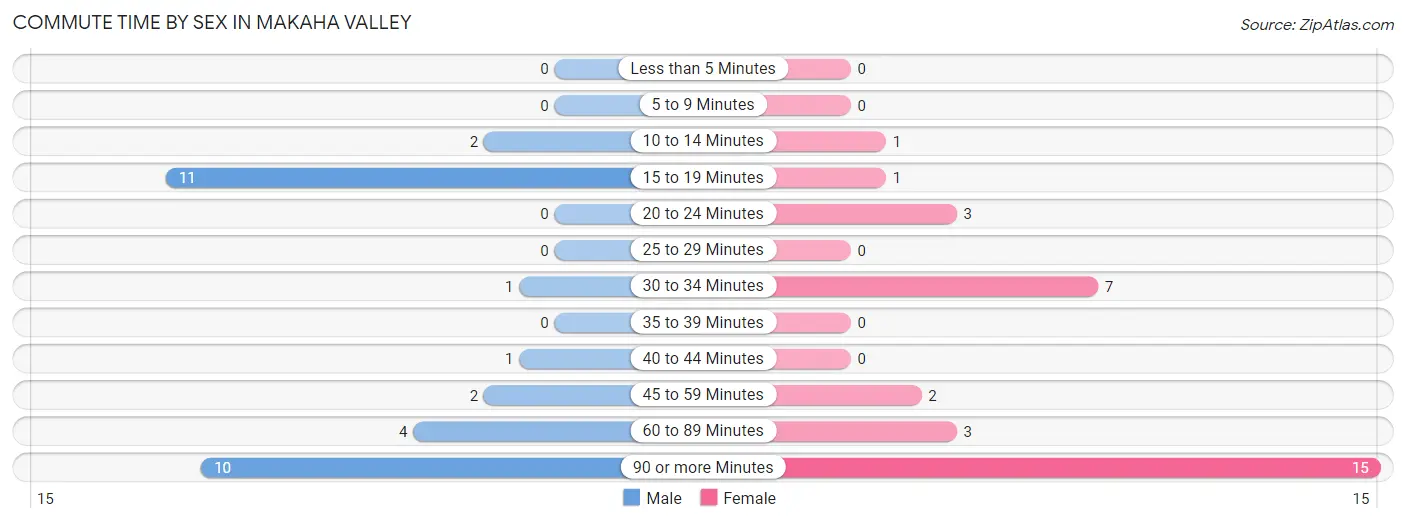
| Commute Time | Male | Female |
| Less than 5 Minutes | 0 (0.0%) | 0 (0.0%) |
| 5 to 9 Minutes | 0 (0.0%) | 0 (0.0%) |
| 10 to 14 Minutes | 2 (6.5%) | 1 (3.1%) |
| 15 to 19 Minutes | 11 (35.5%) | 1 (3.1%) |
| 20 to 24 Minutes | 0 (0.0%) | 3 (9.4%) |
| 25 to 29 Minutes | 0 (0.0%) | 0 (0.0%) |
| 30 to 34 Minutes | 1 (3.2%) | 7 (21.9%) |
| 35 to 39 Minutes | 0 (0.0%) | 0 (0.0%) |
| 40 to 44 Minutes | 1 (3.2%) | 0 (0.0%) |
| 45 to 59 Minutes | 2 (6.5%) | 2 (6.2%) |
| 60 to 89 Minutes | 4 (12.9%) | 3 (9.4%) |
| 90 or more Minutes | 10 (32.3%) | 15 (46.9%) |
Time of Departure to Work by Sex in Makaha Valley
The most frequent times of departure to work in Makaha Valley are 6:00 AM to 6:29 AM (18, 58.1%) for males and 6:30 AM to 6:59 AM (6, 18.8%) for females.
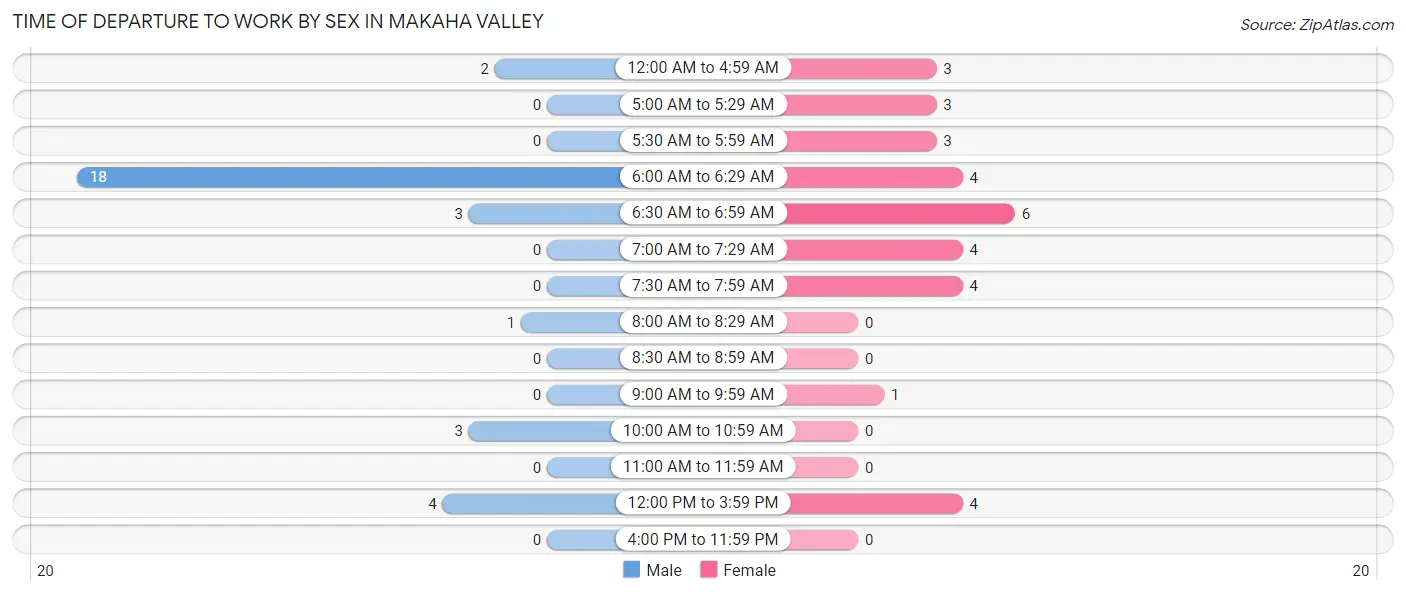
| Time of Departure | Male | Female |
| 12:00 AM to 4:59 AM | 2 (6.5%) | 3 (9.4%) |
| 5:00 AM to 5:29 AM | 0 (0.0%) | 3 (9.4%) |
| 5:30 AM to 5:59 AM | 0 (0.0%) | 3 (9.4%) |
| 6:00 AM to 6:29 AM | 18 (58.1%) | 4 (12.5%) |
| 6:30 AM to 6:59 AM | 3 (9.7%) | 6 (18.8%) |
| 7:00 AM to 7:29 AM | 0 (0.0%) | 4 (12.5%) |
| 7:30 AM to 7:59 AM | 0 (0.0%) | 4 (12.5%) |
| 8:00 AM to 8:29 AM | 1 (3.2%) | 0 (0.0%) |
| 8:30 AM to 8:59 AM | 0 (0.0%) | 0 (0.0%) |
| 9:00 AM to 9:59 AM | 0 (0.0%) | 1 (3.1%) |
| 10:00 AM to 10:59 AM | 3 (9.7%) | 0 (0.0%) |
| 11:00 AM to 11:59 AM | 0 (0.0%) | 0 (0.0%) |
| 12:00 PM to 3:59 PM | 4 (12.9%) | 4 (12.5%) |
| 4:00 PM to 11:59 PM | 0 (0.0%) | 0 (0.0%) |
| Total | 31 (100.0%) | 32 (100.0%) |
Housing Occupancy in Makaha Valley
Occupancy by Ownership in Makaha Valley
Of the total 46 dwellings in Makaha Valley, owner-occupied units account for 43 (93.5%), while renter-occupied units make up 3 (6.5%).
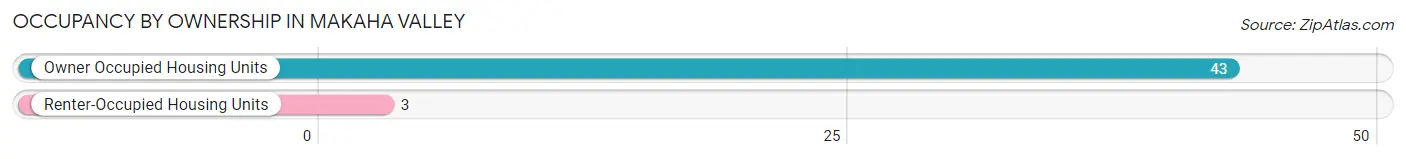
| Occupancy | # Housing Units | % Housing Units |
| Owner Occupied Housing Units | 43 | 93.5% |
| Renter-Occupied Housing Units | 3 | 6.5% |
| Total Occupied Housing Units | 46 | 100.0% |
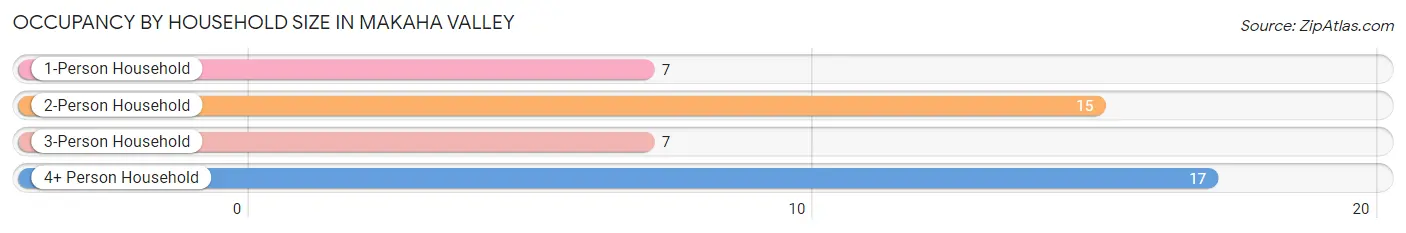
Occupancy by Household Size in Makaha Valley
| Household Size | # Housing Units | % Housing Units |
| 1-Person Household | 7 | 15.2% |
| 2-Person Household | 15 | 32.6% |
| 3-Person Household | 7 | 15.2% |
| 4+ Person Household | 17 | 37.0% |
| Total Housing Units | 46 | 100.0% |
Occupancy by Ownership by Household Size in Makaha Valley
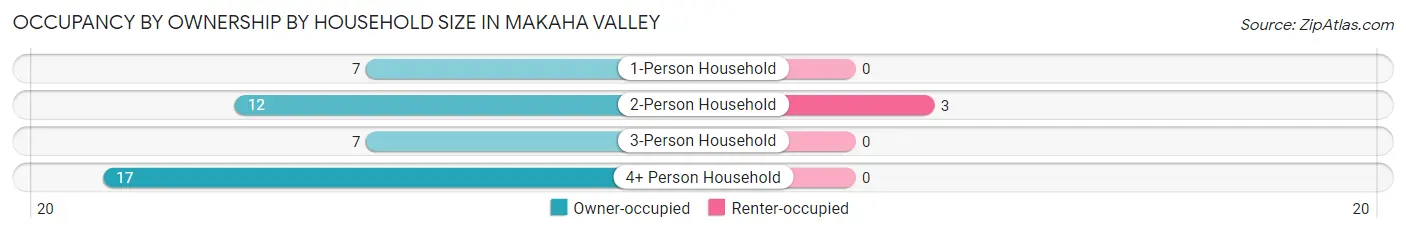
| Household Size | Owner-occupied | Renter-occupied |
| 1-Person Household | 7 (100.0%) | 0 (0.0%) |
| 2-Person Household | 12 (80.0%) | 3 (20.0%) |
| 3-Person Household | 7 (100.0%) | 0 (0.0%) |
| 4+ Person Household | 17 (100.0%) | 0 (0.0%) |
| Total Housing Units | 43 (93.5%) | 3 (6.5%) |
Occupancy by Educational Attainment in Makaha Valley
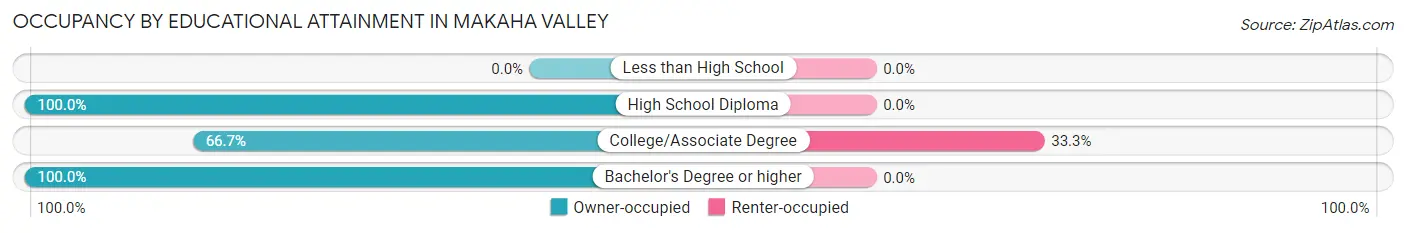
| Household Size | Owner-occupied | Renter-occupied |
| Less than High School | 0 (0.0%) | 0 (0.0%) |
| High School Diploma | 12 (100.0%) | 0 (0.0%) |
| College/Associate Degree | 6 (66.7%) | 3 (33.3%) |
| Bachelor's Degree or higher | 25 (100.0%) | 0 (0.0%) |
Occupancy by Age of Householder in Makaha Valley
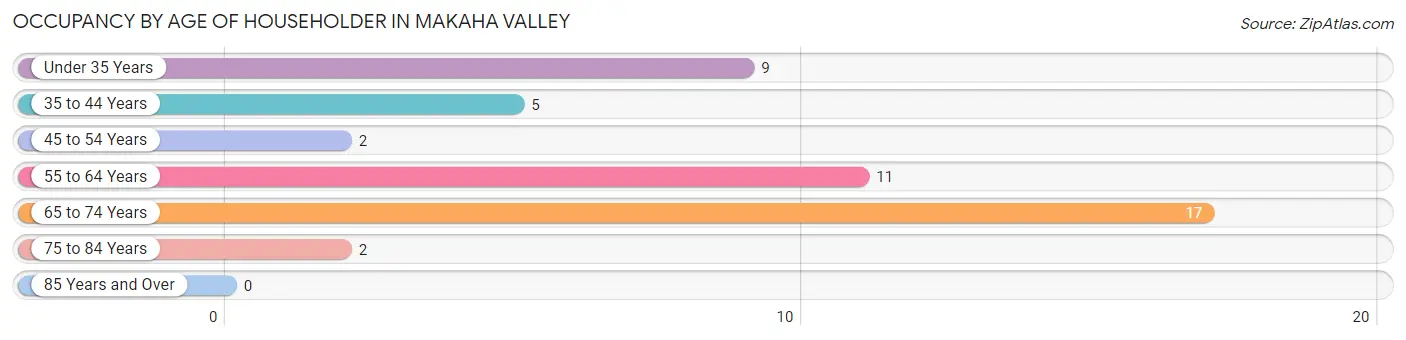
| Age Bracket | # Households | % Households |
| Under 35 Years | 9 | 19.6% |
| 35 to 44 Years | 5 | 10.9% |
| 45 to 54 Years | 2 | 4.3% |
| 55 to 64 Years | 11 | 23.9% |
| 65 to 74 Years | 17 | 37.0% |
| 75 to 84 Years | 2 | 4.3% |
| 85 Years and Over | 0 | 0.0% |
| Total | 46 | 100.0% |
Housing Finances in Makaha Valley
Median Income by Occupancy in Makaha Valley
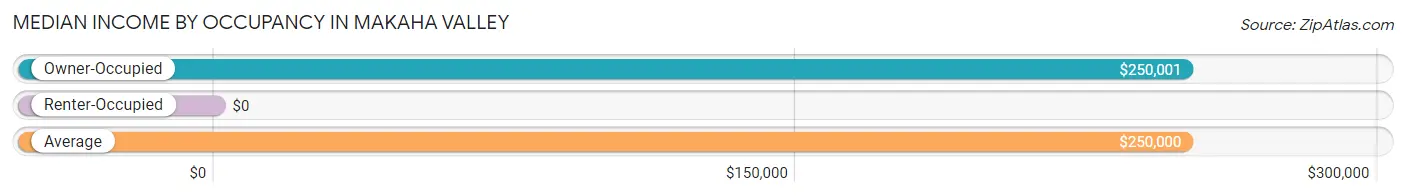
| Occupancy Type | # Households | Median Income |
| Owner-Occupied | 43 (93.5%) | $250,001 |
| Renter-Occupied | 3 (6.5%) | $0 |
| Average | 46 (100.0%) | $250,000 |
Occupancy by Householder Income Bracket in Makaha Valley
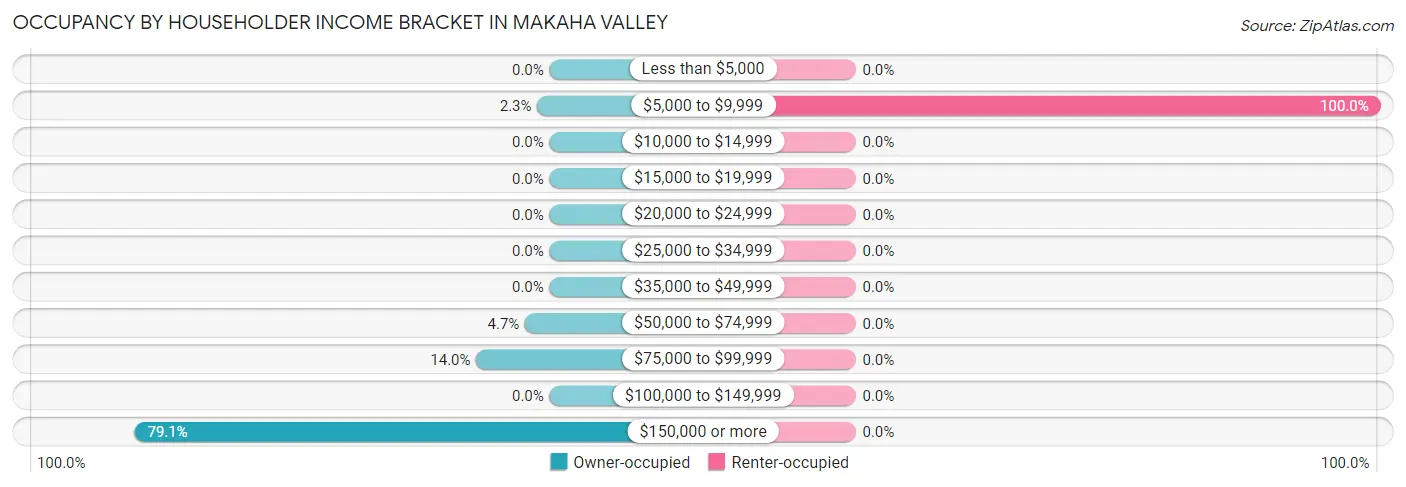
| Income Bracket | Owner-occupied | Renter-occupied |
| Less than $5,000 | 0 (0.0%) | 0 (0.0%) |
| $5,000 to $9,999 | 1 (2.3%) | 3 (100.0%) |
| $10,000 to $14,999 | 0 (0.0%) | 0 (0.0%) |
| $15,000 to $19,999 | 0 (0.0%) | 0 (0.0%) |
| $20,000 to $24,999 | 0 (0.0%) | 0 (0.0%) |
| $25,000 to $34,999 | 0 (0.0%) | 0 (0.0%) |
| $35,000 to $49,999 | 0 (0.0%) | 0 (0.0%) |
| $50,000 to $74,999 | 2 (4.6%) | 0 (0.0%) |
| $75,000 to $99,999 | 6 (14.0%) | 0 (0.0%) |
| $100,000 to $149,999 | 0 (0.0%) | 0 (0.0%) |
| $150,000 or more | 34 (79.1%) | 0 (0.0%) |
| Total | 43 (100.0%) | 3 (100.0%) |
Monthly Housing Cost Tiers in Makaha Valley
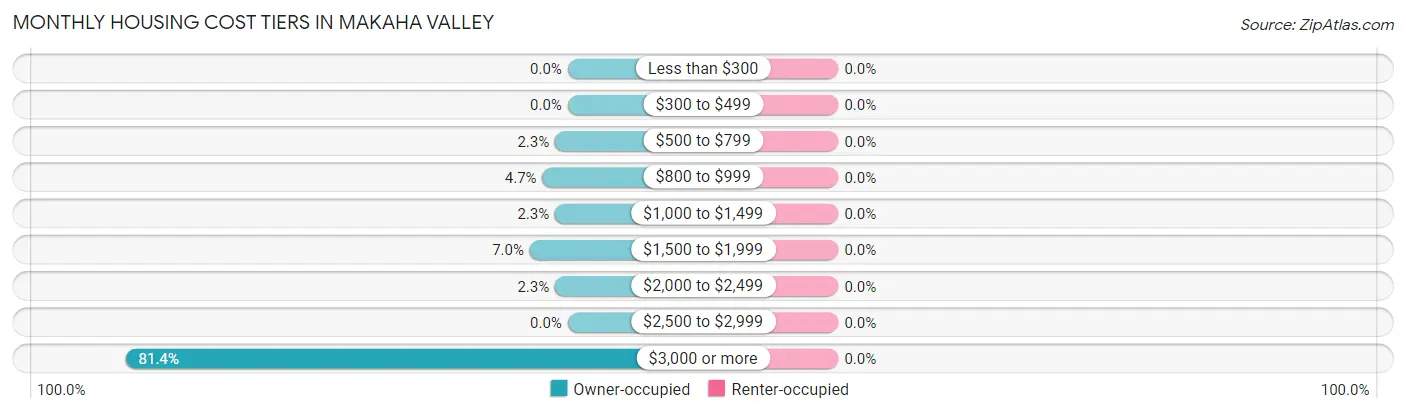
| Monthly Cost | Owner-occupied | Renter-occupied |
| Less than $300 | 0 (0.0%) | 0 (0.0%) |
| $300 to $499 | 0 (0.0%) | 0 (0.0%) |
| $500 to $799 | 1 (2.3%) | 0 (0.0%) |
| $800 to $999 | 2 (4.6%) | 0 (0.0%) |
| $1,000 to $1,499 | 1 (2.3%) | 0 (0.0%) |
| $1,500 to $1,999 | 3 (7.0%) | 0 (0.0%) |
| $2,000 to $2,499 | 1 (2.3%) | 0 (0.0%) |
| $2,500 to $2,999 | 0 (0.0%) | 0 (0.0%) |
| $3,000 or more | 35 (81.4%) | 0 (0.0%) |
| Total | 43 (100.0%) | 3 (100.0%) |
Physical Housing Characteristics in Makaha Valley
Housing Structures in Makaha Valley
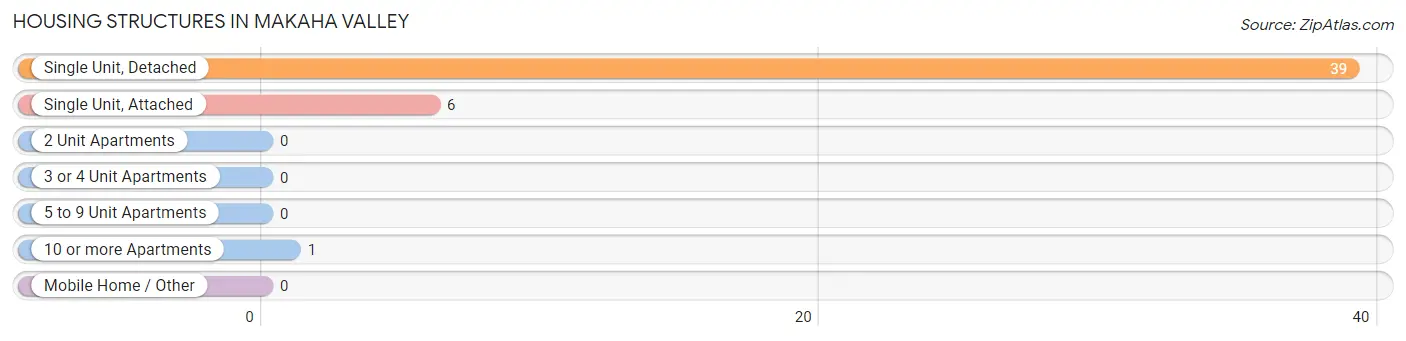
| Structure Type | # Housing Units | % Housing Units |
| Single Unit, Detached | 39 | 84.8% |
| Single Unit, Attached | 6 | 13.0% |
| 2 Unit Apartments | 0 | 0.0% |
| 3 or 4 Unit Apartments | 0 | 0.0% |
| 5 to 9 Unit Apartments | 0 | 0.0% |
| 10 or more Apartments | 1 | 2.2% |
| Mobile Home / Other | 0 | 0.0% |
| Total | 46 | 100.0% |
Housing Structures by Occupancy in Makaha Valley
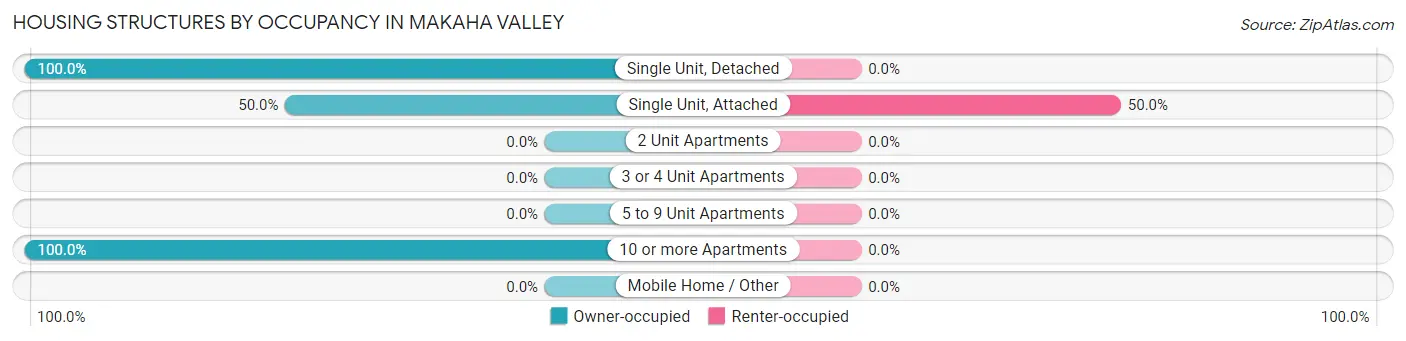
| Structure Type | Owner-occupied | Renter-occupied |
| Single Unit, Detached | 39 (100.0%) | 0 (0.0%) |
| Single Unit, Attached | 3 (50.0%) | 3 (50.0%) |
| 2 Unit Apartments | 0 (0.0%) | 0 (0.0%) |
| 3 or 4 Unit Apartments | 0 (0.0%) | 0 (0.0%) |
| 5 to 9 Unit Apartments | 0 (0.0%) | 0 (0.0%) |
| 10 or more Apartments | 1 (100.0%) | 0 (0.0%) |
| Mobile Home / Other | 0 (0.0%) | 0 (0.0%) |
| Total | 43 (93.5%) | 3 (6.5%) |
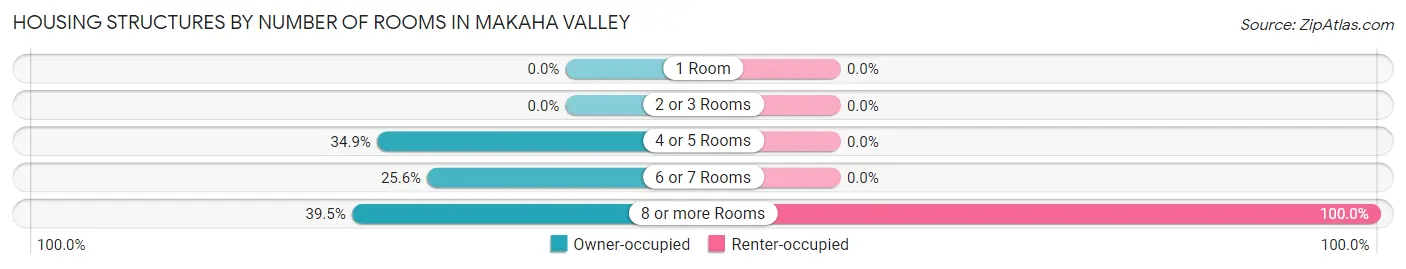
Housing Structures by Number of Rooms in Makaha Valley
| Number of Rooms | Owner-occupied | Renter-occupied |
| 1 Room | 0 (0.0%) | 0 (0.0%) |
| 2 or 3 Rooms | 0 (0.0%) | 0 (0.0%) |
| 4 or 5 Rooms | 15 (34.9%) | 0 (0.0%) |
| 6 or 7 Rooms | 11 (25.6%) | 0 (0.0%) |
| 8 or more Rooms | 17 (39.5%) | 3 (100.0%) |
| Total | 43 (100.0%) | 3 (100.0%) |
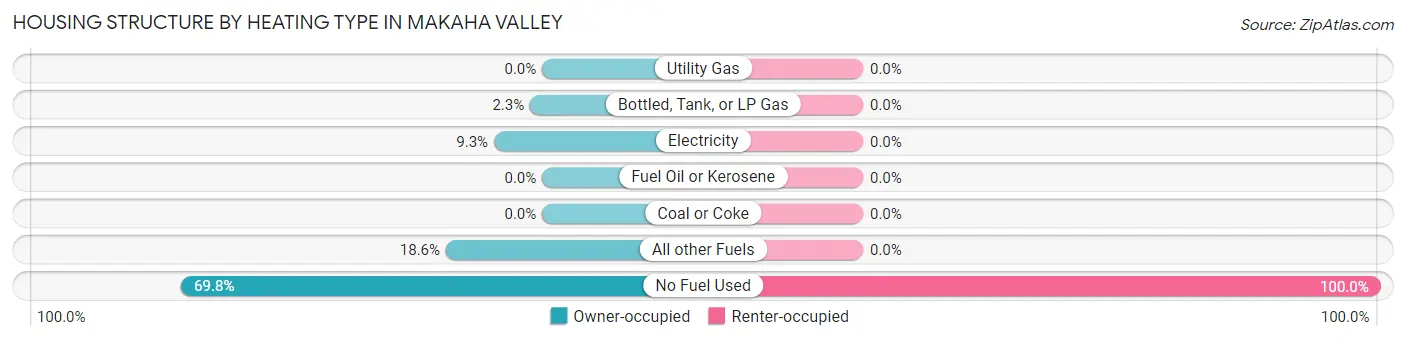
Housing Structure by Heating Type in Makaha Valley
| Heating Type | Owner-occupied | Renter-occupied |
| Utility Gas | 0 (0.0%) | 0 (0.0%) |
| Bottled, Tank, or LP Gas | 1 (2.3%) | 0 (0.0%) |
| Electricity | 4 (9.3%) | 0 (0.0%) |
| Fuel Oil or Kerosene | 0 (0.0%) | 0 (0.0%) |
| Coal or Coke | 0 (0.0%) | 0 (0.0%) |
| All other Fuels | 8 (18.6%) | 0 (0.0%) |
| No Fuel Used | 30 (69.8%) | 3 (100.0%) |
| Total | 43 (100.0%) | 3 (100.0%) |
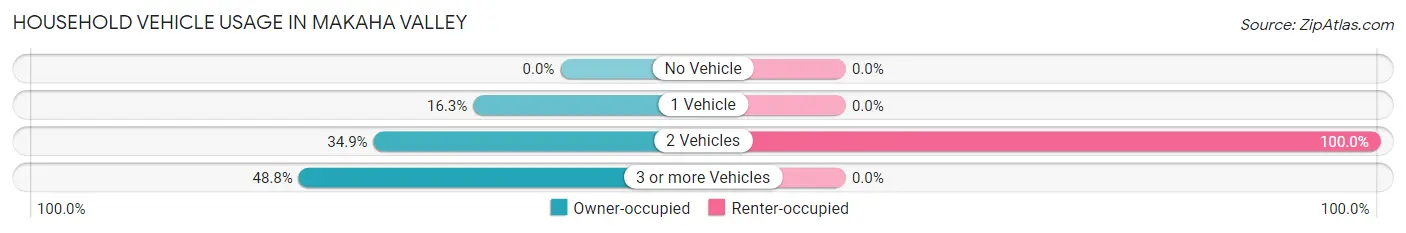
Household Vehicle Usage in Makaha Valley
| Vehicles per Household | Owner-occupied | Renter-occupied |
| No Vehicle | 0 (0.0%) | 0 (0.0%) |
| 1 Vehicle | 7 (16.3%) | 0 (0.0%) |
| 2 Vehicles | 15 (34.9%) | 3 (100.0%) |
| 3 or more Vehicles | 21 (48.8%) | 0 (0.0%) |
| Total | 43 (100.0%) | 3 (100.0%) |
Real Estate & Mortgages in Makaha Valley
Real Estate and Mortgage Overview in Makaha Valley
| Characteristic | Without Mortgage | With Mortgage |
| Housing Units | 3 | 40 |
| Median Property Value | $2,000,001 | $1,500,000 |
| Median Household Income | - | - |
| Monthly Housing Costs | $850 | $35 |
| Real Estate Taxes | $3,500 | $0 |
Property Value by Mortgage Status in Makaha Valley
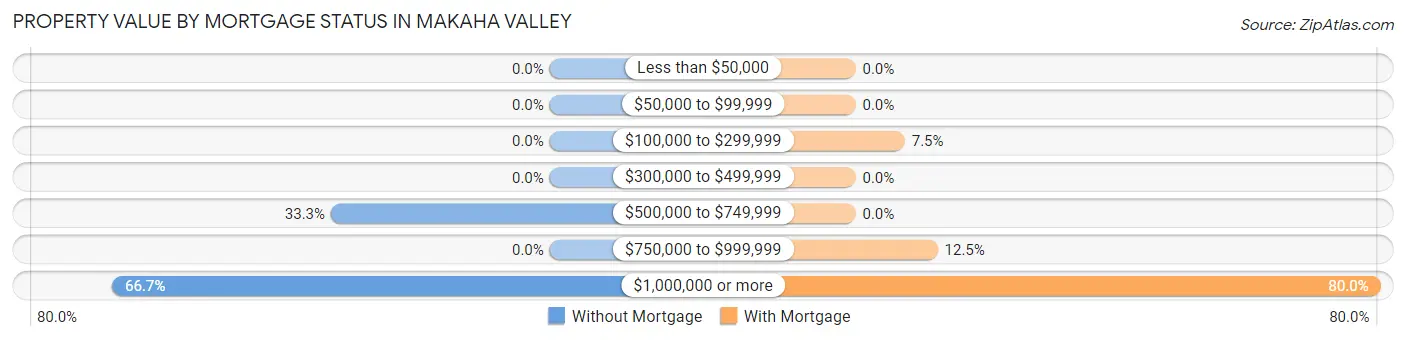
| Property Value | Without Mortgage | With Mortgage |
| Less than $50,000 | 0 (0.0%) | 0 (0.0%) |
| $50,000 to $99,999 | 0 (0.0%) | 0 (0.0%) |
| $100,000 to $299,999 | 0 (0.0%) | 3 (7.5%) |
| $300,000 to $499,999 | 0 (0.0%) | 0 (0.0%) |
| $500,000 to $749,999 | 1 (33.3%) | 0 (0.0%) |
| $750,000 to $999,999 | 0 (0.0%) | 5 (12.5%) |
| $1,000,000 or more | 2 (66.7%) | 32 (80.0%) |
| Total | 3 (100.0%) | 40 (100.0%) |
Household Income by Mortgage Status in Makaha Valley
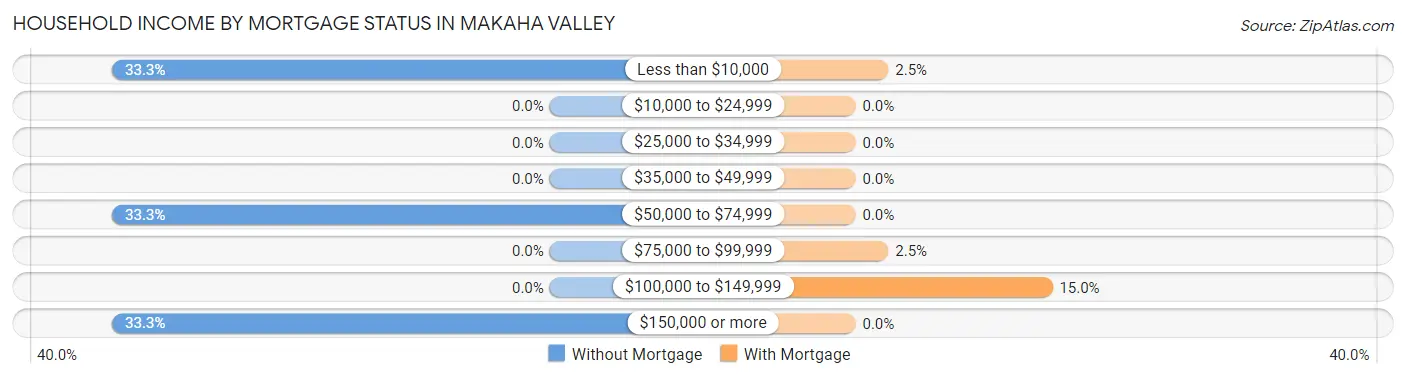
| Household Income | Without Mortgage | With Mortgage |
| Less than $10,000 | 1 (33.3%) | 1 (2.5%) |
| $10,000 to $24,999 | 0 (0.0%) | 0 (0.0%) |
| $25,000 to $34,999 | 0 (0.0%) | 0 (0.0%) |
| $35,000 to $49,999 | 0 (0.0%) | 0 (0.0%) |
| $50,000 to $74,999 | 1 (33.3%) | 0 (0.0%) |
| $75,000 to $99,999 | 0 (0.0%) | 1 (2.5%) |
| $100,000 to $149,999 | 0 (0.0%) | 6 (15.0%) |
| $150,000 or more | 1 (33.3%) | 0 (0.0%) |
| Total | 3 (100.0%) | 40 (100.0%) |
Property Value to Household Income Ratio in Makaha Valley
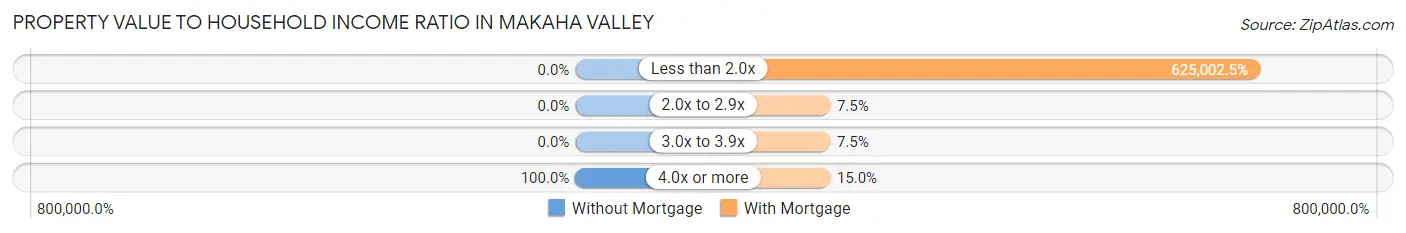
| Value-to-Income Ratio | Without Mortgage | With Mortgage |
| Less than 2.0x | 0 (0.0%) | 250,001 (625,002.5%) |
| 2.0x to 2.9x | 0 (0.0%) | 3 (7.5%) |
| 3.0x to 3.9x | 0 (0.0%) | 3 (7.5%) |
| 4.0x or more | 3 (100.0%) | 6 (15.0%) |
| Total | 3 (100.0%) | 40 (100.0%) |
Real Estate Taxes by Mortgage Status in Makaha Valley
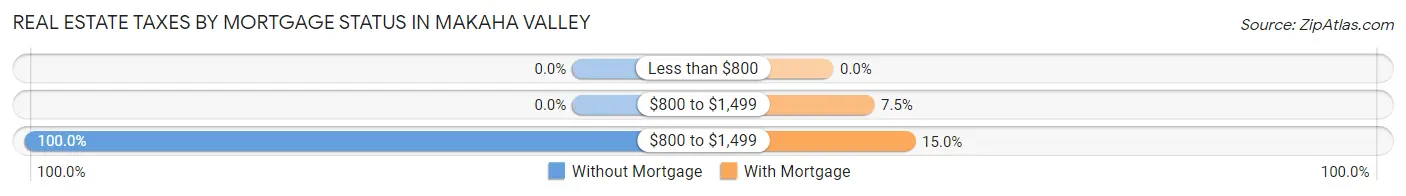
| Property Taxes | Without Mortgage | With Mortgage |
| Less than $800 | 0 (0.0%) | 0 (0.0%) |
| $800 to $1,499 | 0 (0.0%) | 3 (7.5%) |
| $800 to $1,499 | 3 (100.0%) | 6 (15.0%) |
| Total | 3 (100.0%) | 40 (100.0%) |
Health & Disability in Makaha Valley
Health Insurance Coverage by Age in Makaha Valley
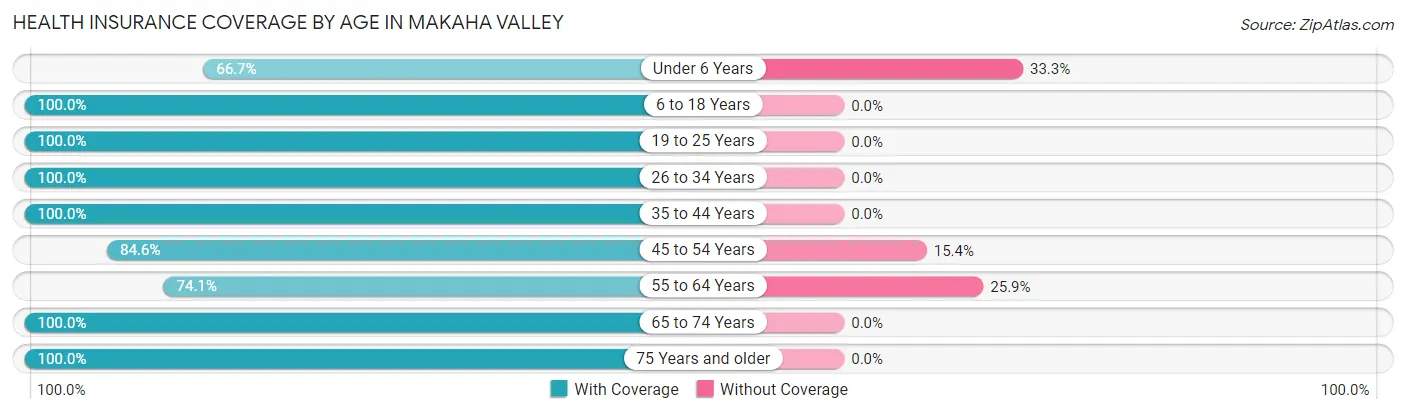
| Age Bracket | With Coverage | Without Coverage |
| Under 6 Years | 10 (66.7%) | 5 (33.3%) |
| 6 to 18 Years | 31 (100.0%) | 0 (0.0%) |
| 19 to 25 Years | 10 (100.0%) | 0 (0.0%) |
| 26 to 34 Years | 22 (100.0%) | 0 (0.0%) |
| 35 to 44 Years | 10 (100.0%) | 0 (0.0%) |
| 45 to 54 Years | 11 (84.6%) | 2 (15.4%) |
| 55 to 64 Years | 20 (74.1%) | 7 (25.9%) |
| 65 to 74 Years | 24 (100.0%) | 0 (0.0%) |
| 75 Years and older | 6 (100.0%) | 0 (0.0%) |
| Total | 144 (91.1%) | 14 (8.9%) |
Health Insurance Coverage by Citizenship Status in Makaha Valley
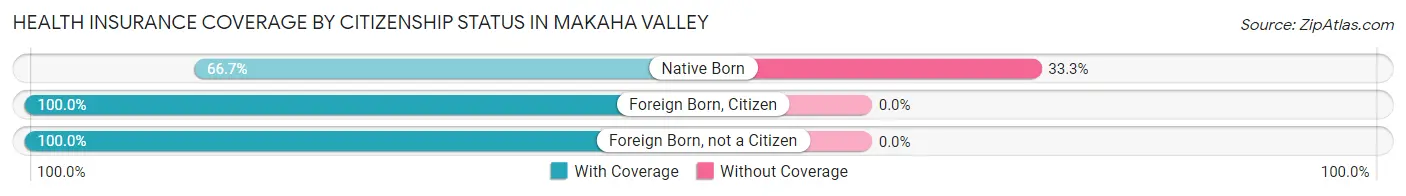
| Citizenship Status | With Coverage | Without Coverage |
| Native Born | 10 (66.7%) | 5 (33.3%) |
| Foreign Born, Citizen | 31 (100.0%) | 0 (0.0%) |
| Foreign Born, not a Citizen | 10 (100.0%) | 0 (0.0%) |
Health Insurance Coverage by Household Income in Makaha Valley
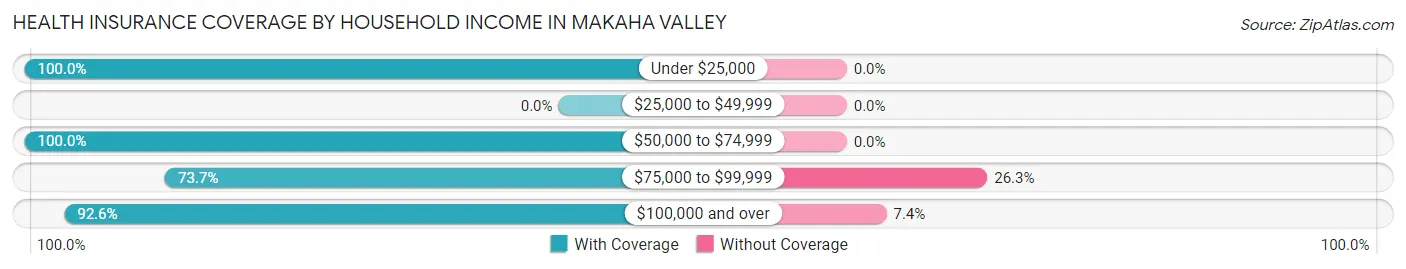
| Household Income | With Coverage | Without Coverage |
| Under $25,000 | 10 (100.0%) | 0 (0.0%) |
| $25,000 to $49,999 | 0 (0.0%) | 0 (0.0%) |
| $50,000 to $74,999 | 8 (100.0%) | 0 (0.0%) |
| $75,000 to $99,999 | 14 (73.7%) | 5 (26.3%) |
| $100,000 and over | 112 (92.6%) | 9 (7.4%) |
Public vs Private Health Insurance Coverage by Age in Makaha Valley
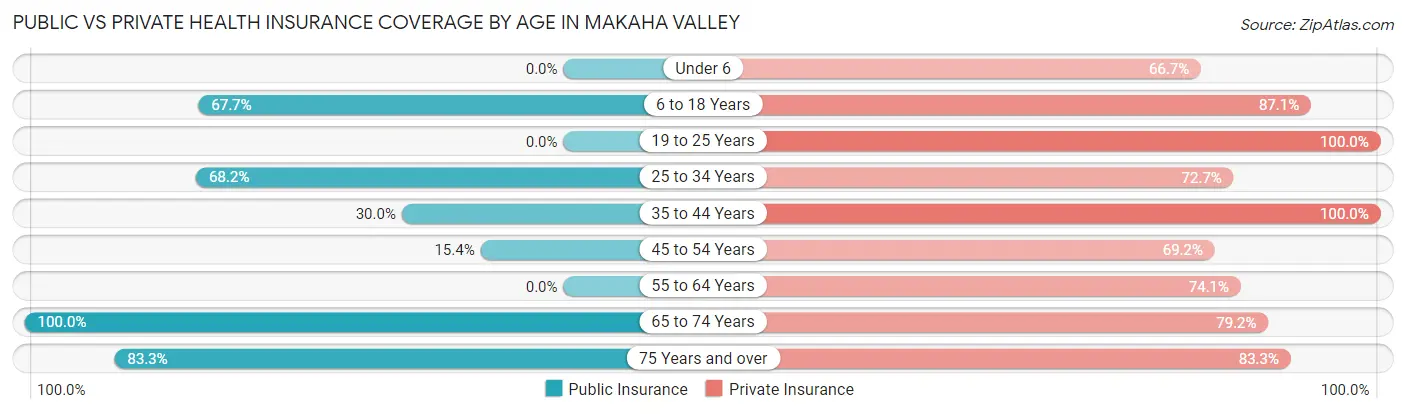
| Age Bracket | Public Insurance | Private Insurance |
| Under 6 | 0 (0.0%) | 10 (66.7%) |
| 6 to 18 Years | 21 (67.7%) | 27 (87.1%) |
| 19 to 25 Years | 0 (0.0%) | 10 (100.0%) |
| 25 to 34 Years | 15 (68.2%) | 16 (72.7%) |
| 35 to 44 Years | 3 (30.0%) | 10 (100.0%) |
| 45 to 54 Years | 2 (15.4%) | 9 (69.2%) |
| 55 to 64 Years | 0 (0.0%) | 20 (74.1%) |
| 65 to 74 Years | 24 (100.0%) | 19 (79.2%) |
| 75 Years and over | 5 (83.3%) | 5 (83.3%) |
| Total | 70 (44.3%) | 126 (79.7%) |
Disability Status by Sex by Age in Makaha Valley
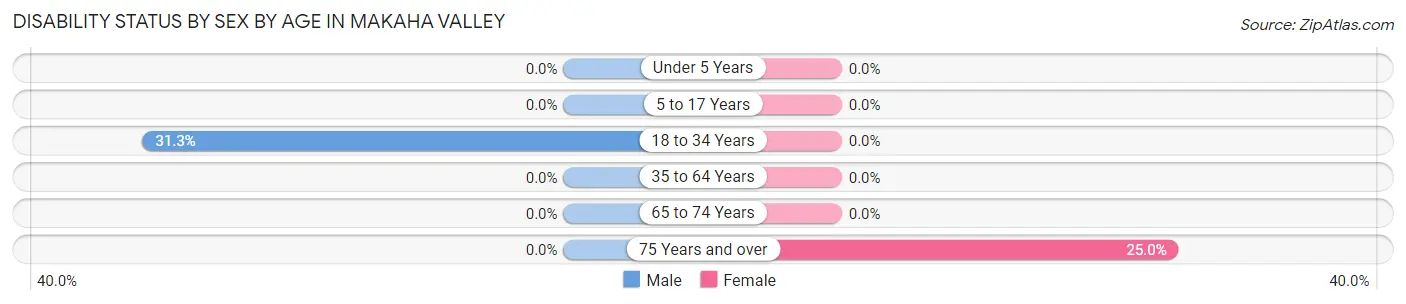
| Age Bracket | Male | Female |
| Under 5 Years | 0 (0.0%) | 0 (0.0%) |
| 5 to 17 Years | 0 (0.0%) | 0 (0.0%) |
| 18 to 34 Years | 5 (31.2%) | 0 (0.0%) |
| 35 to 64 Years | 0 (0.0%) | 0 (0.0%) |
| 65 to 74 Years | 0 (0.0%) | 0 (0.0%) |
| 75 Years and over | 0 (0.0%) | 1 (25.0%) |
Disability Class by Sex by Age in Makaha Valley
Disability Class: Hearing Difficulty
| Age Bracket | Male | Female |
| Under 5 Years | 0 (0.0%) | 0 (0.0%) |
| 5 to 17 Years | 0 (0.0%) | 0 (0.0%) |
| 18 to 34 Years | 0 (0.0%) | 0 (0.0%) |
| 35 to 64 Years | 0 (0.0%) | 0 (0.0%) |
| 65 to 74 Years | 0 (0.0%) | 0 (0.0%) |
| 75 Years and over | 0 (0.0%) | 0 (0.0%) |
Disability Class: Vision Difficulty
| Age Bracket | Male | Female |
| Under 5 Years | 0 (0.0%) | 0 (0.0%) |
| 5 to 17 Years | 0 (0.0%) | 0 (0.0%) |
| 18 to 34 Years | 0 (0.0%) | 0 (0.0%) |
| 35 to 64 Years | 0 (0.0%) | 0 (0.0%) |
| 65 to 74 Years | 0 (0.0%) | 0 (0.0%) |
| 75 Years and over | 0 (0.0%) | 0 (0.0%) |
Disability Class: Cognitive Difficulty
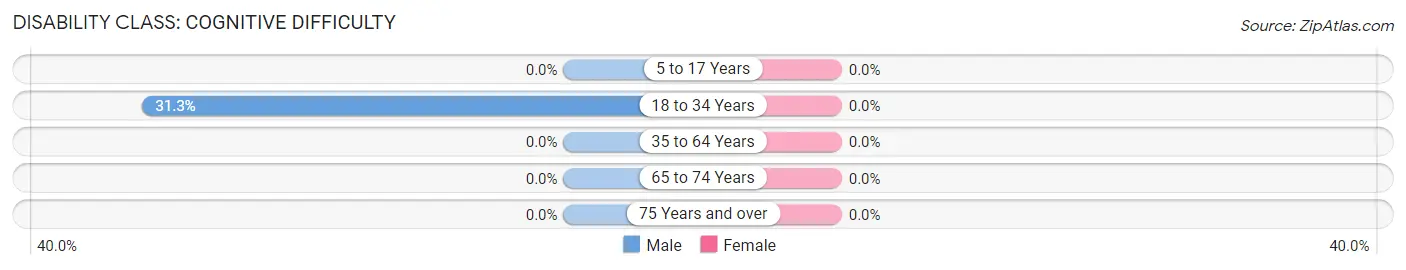
| Age Bracket | Male | Female |
| 5 to 17 Years | 0 (0.0%) | 0 (0.0%) |
| 18 to 34 Years | 5 (31.2%) | 0 (0.0%) |
| 35 to 64 Years | 0 (0.0%) | 0 (0.0%) |
| 65 to 74 Years | 0 (0.0%) | 0 (0.0%) |
| 75 Years and over | 0 (0.0%) | 0 (0.0%) |
Disability Class: Ambulatory Difficulty
| Age Bracket | Male | Female |
| 5 to 17 Years | 0 (0.0%) | 0 (0.0%) |
| 18 to 34 Years | 0 (0.0%) | 0 (0.0%) |
| 35 to 64 Years | 0 (0.0%) | 0 (0.0%) |
| 65 to 74 Years | 0 (0.0%) | 0 (0.0%) |
| 75 Years and over | 0 (0.0%) | 0 (0.0%) |
Disability Class: Self-Care Difficulty
| Age Bracket | Male | Female |
| 5 to 17 Years | 0 (0.0%) | 0 (0.0%) |
| 18 to 34 Years | 0 (0.0%) | 0 (0.0%) |
| 35 to 64 Years | 0 (0.0%) | 0 (0.0%) |
| 65 to 74 Years | 0 (0.0%) | 0 (0.0%) |
| 75 Years and over | 0 (0.0%) | 0 (0.0%) |
Technology Access in Makaha Valley
Computing Device Access in Makaha Valley
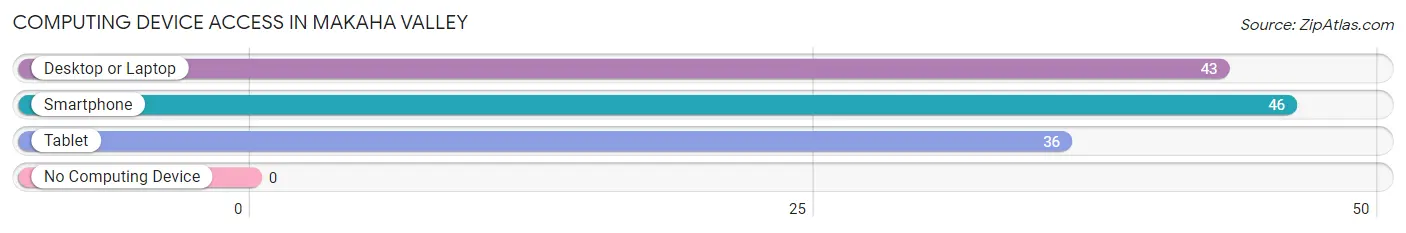
| Device Type | # Households | % Households |
| Desktop or Laptop | 43 | 93.5% |
| Smartphone | 46 | 100.0% |
| Tablet | 36 | 78.3% |
| No Computing Device | 0 | 0.0% |
| Total | 46 | 100.0% |
Internet Access in Makaha Valley
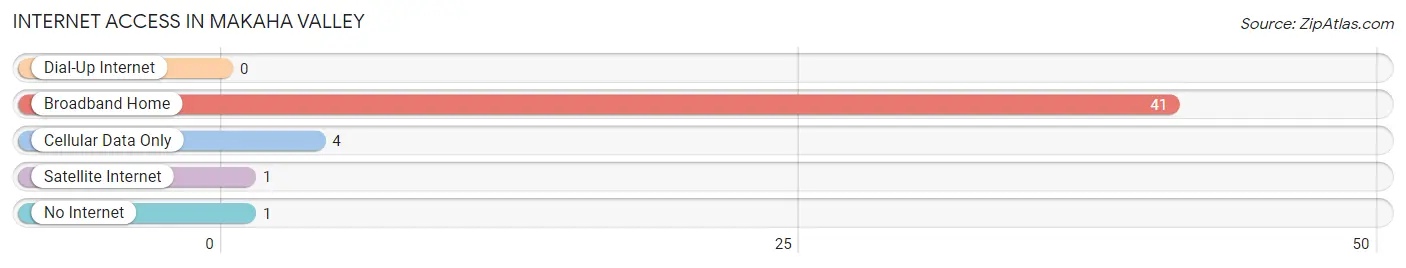
| Internet Type | # Households | % Households |
| Dial-Up Internet | 0 | 0.0% |
| Broadband Home | 41 | 89.1% |
| Cellular Data Only | 4 | 8.7% |
| Satellite Internet | 1 | 2.2% |
| No Internet | 1 | 2.2% |
| Total | 46 | 100.0% |
Makaha Valley Summary
Makaha Valley is a small, rural community located on the western side of the island of Oahu in Hawaii. It is situated between the Waianae Mountains and the Pacific Ocean, and is home to a population of approximately 8,000 people. The valley is known for its beautiful scenery, lush vegetation, and abundant wildlife.
Geography
Makaha Valley is located on the western side of Oahu, approximately 25 miles from Honolulu. It is bordered by the Waianae Mountains to the east and the Pacific Ocean to the west. The valley is approximately 4 miles long and 2 miles wide, and is situated at an elevation of approximately 500 feet. The climate in Makaha Valley is tropical, with temperatures ranging from the mid-70s to the mid-80s year-round.
The valley is home to a variety of flora and fauna, including native plants such as hibiscus, ti, and kukui, as well as a variety of birds, reptiles, and mammals. The area is also home to a variety of fish, including mahi-mahi, ahi, and ono.
History
Makaha Valley has a long and rich history. The area was first settled by Polynesian voyagers in the 13th century, and was later inhabited by Native Hawaiians. The valley was used for agricultural purposes, and was home to a variety of crops, including taro, sweet potatoes, and bananas.
In the late 19th century, the valley was developed as a sugar plantation. The plantation was owned by the Makaha Sugar Company, which operated until the early 20th century. The plantation was eventually abandoned, and the land was sold to developers in the 1950s.
The area was developed as a residential community in the 1960s, and has since become a popular destination for tourists and locals alike.
Economy
Makaha Valley’s economy is largely based on tourism. The area is home to a variety of hotels, resorts, and vacation rentals, as well as restaurants, shops, and other businesses catering to tourists. The valley is also home to a variety of recreational activities, including surfing, fishing, and hiking.
The area is also home to a variety of agricultural businesses, including farms, nurseries, and greenhouses. The valley is also home to a variety of manufacturing businesses, including furniture makers, woodworkers, and metalworkers.
Demographics
As of the 2010 census, the population of Makaha Valley was 8,000. The population is largely Native Hawaiian, with a small percentage of other ethnicities, including Asian, Pacific Islander, and Hispanic. The median age of the population is 38, and the median household income is $50,000.
The area is served by the Waianae-Makaha-Makua Complex Area, which includes the communities of Waianae, Makaha, and Makua. The area is served by the Waianae-Makaha-Makua Complex Area School District, which includes five elementary schools, two middle schools, and one high school.
Conclusion
Makaha Valley is a small, rural community located on the western side of the island of Oahu in Hawaii. It is known for its beautiful scenery, lush vegetation, and abundant wildlife. The area is home to a population of approximately 8,000 people, and is largely Native Hawaiian. The economy of the area is largely based on tourism, and the area is home to a variety of hotels, resorts, restaurants, shops, and other businesses catering to tourists. The area is also home to a variety of agricultural businesses, manufacturing businesses, and recreational activities.
Common Questions
What is the Total Population of Makaha Valley?
Total Population of Makaha Valley is 158.
What is the Total Male Population of Makaha Valley?
Total Male Population of Makaha Valley is 89.
What is the Total Female Population of Makaha Valley?
Total Female Population of Makaha Valley is 69.
What is the Ratio of Males per 100 Females in Makaha Valley?
There are 128.99 Males per 100 Females in Makaha Valley.
What is the Ratio of Females per 100 Males in Makaha Valley?
There are 77.53 Females per 100 Males in Makaha Valley.
What is the Median Population Age in Makaha Valley?
Median Population Age in Makaha Valley is 39.5 Years.
What is the Average Family Size in Makaha Valley
Average Family Size in Makaha Valley is 4.2 People.
What is the Average Household Size in Makaha Valley
Average Household Size in Makaha Valley is 3.4 People.
What is Per Capita Income in Makaha Valley?
Per Capita income in Makaha Valley is $91,479.
What is the Median Family Income in Makaha Valley?
Median Family Income in Makaha Valley is $248,750.
What is the Median Household income in Makaha Valley?
Median Household Income in Makaha Valley is $250,000.
What is Inequality or Gini Index in Makaha Valley?
Inequality or Gini Index in Makaha Valley is 0.44.
How Large is the Labor Force in Makaha Valley?
There are 79 People in the Labor Forcein in Makaha Valley.
What is the Percentage of People in the Labor Force in Makaha Valley?
68.1% of People are in the Labor Force in Makaha Valley.
What is the Unemployment Rate in Makaha Valley?
Unemployment Rate in Makaha Valley is 8.9%.