Laupahoehoe, HI
Laupahoehoe Map
Laupahoehoe Overview
954
TOTAL POPULATION
453
MALE POPULATION
501
FEMALE POPULATION
90.42
MALES / 100 FEMALES
110.60
FEMALES / 100 MALES
57.3
MEDIAN AGE
3.0
AVG FAMILY SIZE
2.3
AVG HOUSEHOLD SIZE
$37,702
PER CAPITA INCOME
$81,389
AVG FAMILY INCOME
$50,956
AVG HOUSEHOLD INCOME
8.2%
WAGE / INCOME GAP [ % ]
91.8¢/ $1
WAGE / INCOME GAP [ $ ]
0.55
INEQUALITY / GINI INDEX
370
LABOR FORCE [ PEOPLE ]
47.4%
PERCENT IN LABOR FORCE
14.6%
UNEMPLOYMENT RATE
Laupahoehoe Zip Codes
Laupahoehoe Area Codes
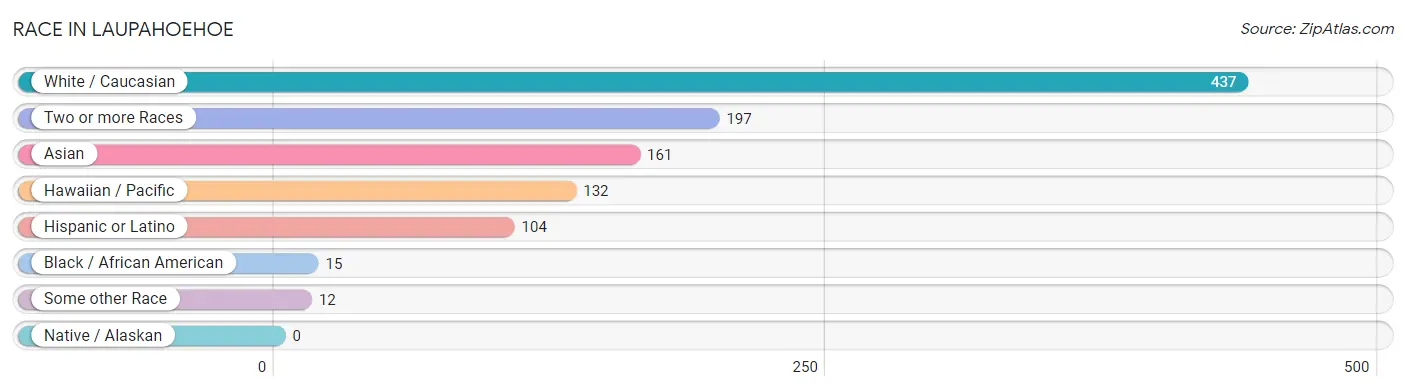
Race in Laupahoehoe
The most populous races in Laupahoehoe are White / Caucasian (437 | 45.8%), Two or more Races (197 | 20.6%), and Asian (161 | 16.9%).
| Race | # Population | % Population |
| Asian | 161 | 16.9% |
| Black / African American | 15 | 1.6% |
| Hawaiian / Pacific | 132 | 13.8% |
| Hispanic or Latino | 104 | 10.9% |
| Native / Alaskan | 0 | 0.0% |
| White / Caucasian | 437 | 45.8% |
| Two or more Races | 197 | 20.6% |
| Some other Race | 12 | 1.3% |
| Total | 954 | 100.0% |
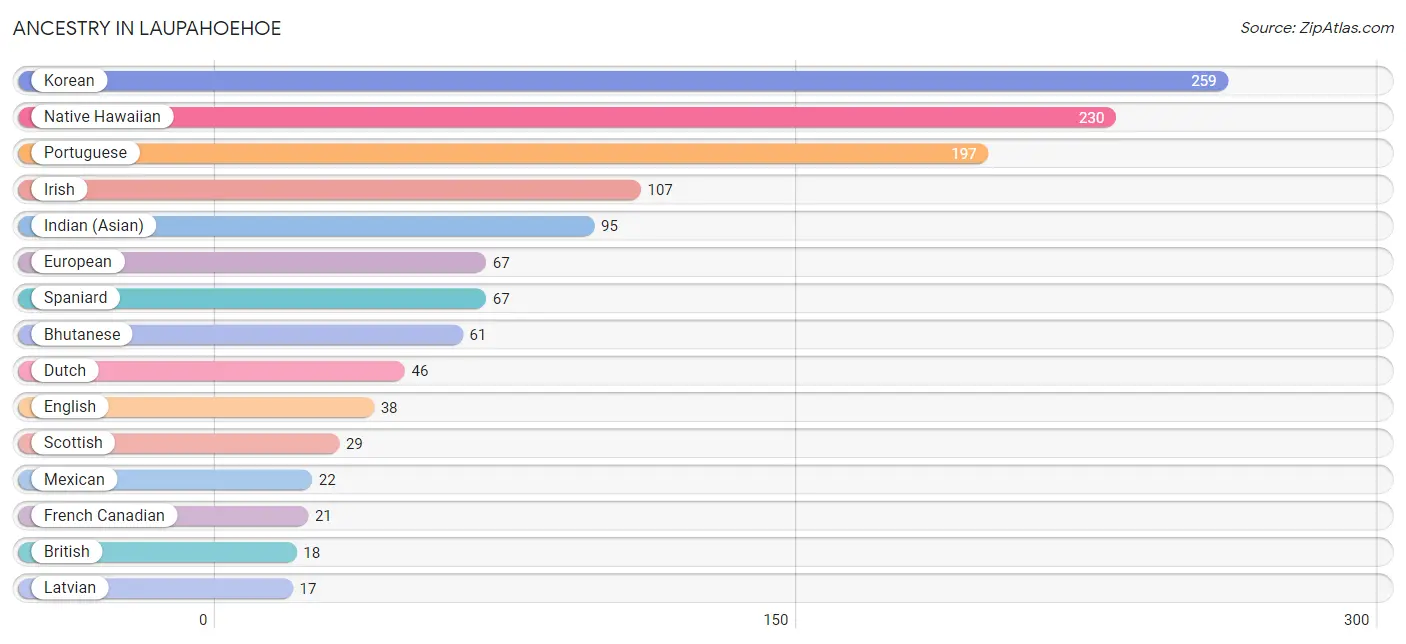
Ancestry in Laupahoehoe
The most populous ancestries reported in Laupahoehoe are Korean (259 | 27.2%), Native Hawaiian (230 | 24.1%), Portuguese (197 | 20.6%), Irish (107 | 11.2%), and Indian (Asian) (95 | 10.0%), together accounting for 93.1% of all Laupahoehoe residents.
| Ancestry | # Population | % Population |
| African | 15 | 1.6% |
| Bhutanese | 61 | 6.4% |
| British | 18 | 1.9% |
| Burmese | 13 | 1.4% |
| Delaware | 5 | 0.5% |
| Dutch | 46 | 4.8% |
| Eastern European | 7 | 0.7% |
| English | 38 | 4.0% |
| European | 67 | 7.0% |
| French Canadian | 21 | 2.2% |
| German | 11 | 1.1% |
| Indian (Asian) | 95 | 10.0% |
| Irish | 107 | 11.2% |
| Jamaican | 15 | 1.6% |
| Japanese | 4 | 0.4% |
| Korean | 259 | 27.2% |
| Latvian | 17 | 1.8% |
| Mexican | 22 | 2.3% |
| Native Hawaiian | 230 | 24.1% |
| Norwegian | 16 | 1.7% |
| Pakistani | 4 | 0.4% |
| Portuguese | 197 | 20.6% |
| Puerto Rican | 15 | 1.6% |
| Samoan | 8 | 0.8% |
| Scotch-Irish | 6 | 0.6% |
| Scottish | 29 | 3.0% |
| Spaniard | 67 | 7.0% |
| Subsaharan African | 15 | 1.6% |
| Thai | 6 | 0.6% | View All 29 Rows |
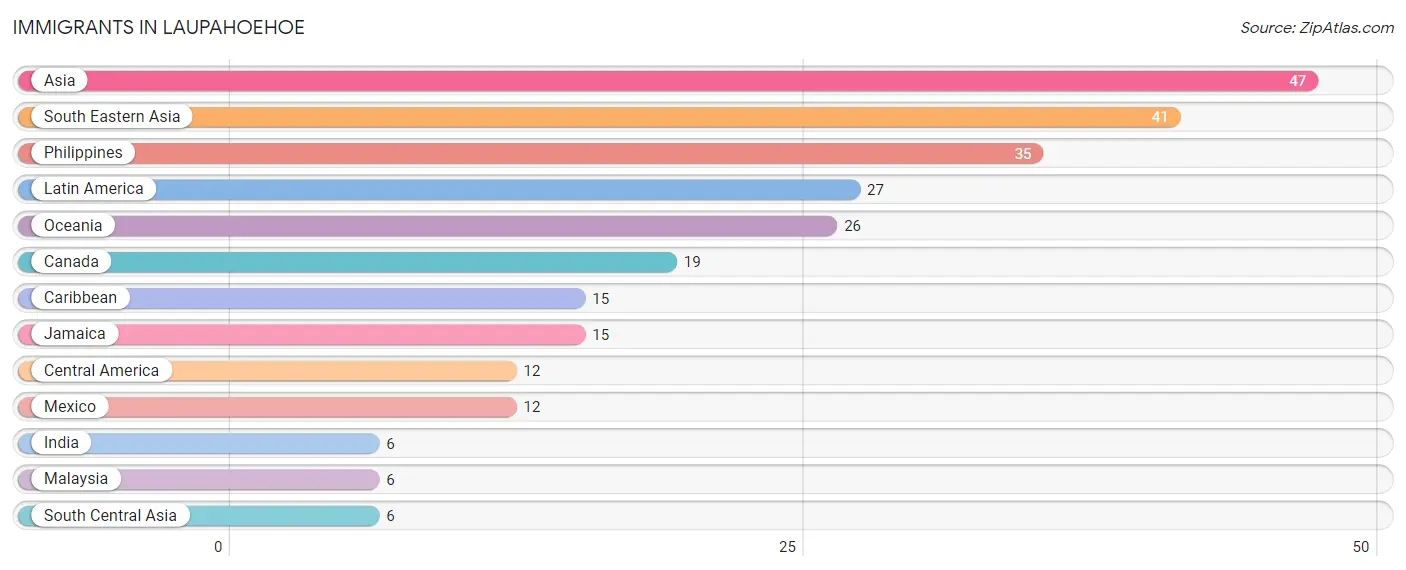
Immigrants in Laupahoehoe
The most numerous immigrant groups reported in Laupahoehoe came from Asia (47 | 4.9%), South Eastern Asia (41 | 4.3%), Philippines (35 | 3.7%), Latin America (27 | 2.8%), and Oceania (26 | 2.7%), together accounting for 18.5% of all Laupahoehoe residents.
| Immigration Origin | # Population | % Population |
| Asia | 47 | 4.9% |
| Canada | 19 | 2.0% |
| Caribbean | 15 | 1.6% |
| Central America | 12 | 1.3% |
| India | 6 | 0.6% |
| Jamaica | 15 | 1.6% |
| Latin America | 27 | 2.8% |
| Malaysia | 6 | 0.6% |
| Mexico | 12 | 1.3% |
| Oceania | 26 | 2.7% |
| Philippines | 35 | 3.7% |
| South Central Asia | 6 | 0.6% |
| South Eastern Asia | 41 | 4.3% | View All 13 Rows |
Sex and Age in Laupahoehoe
Sex and Age in Laupahoehoe
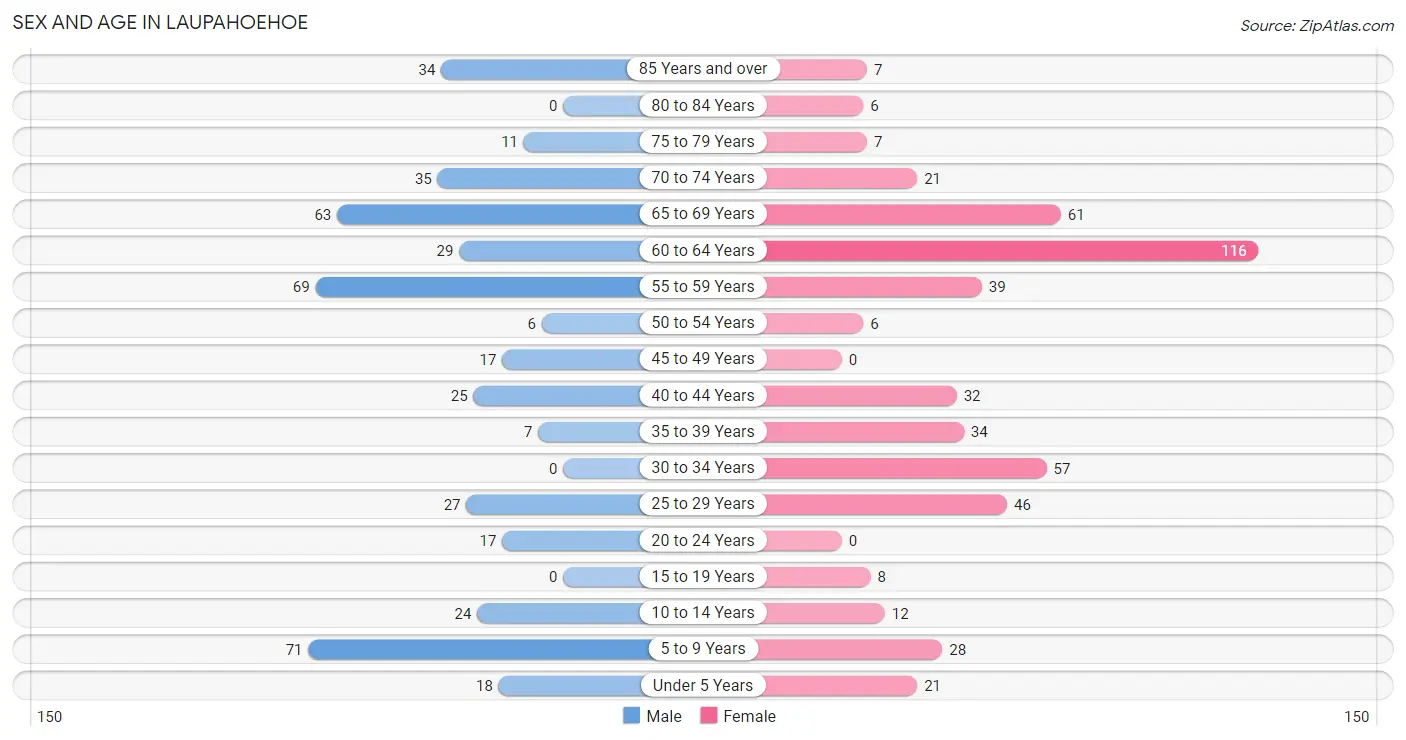
The most populous age groups in Laupahoehoe are 5 to 9 Years (71 | 15.7%) for men and 60 to 64 Years (116 | 23.2%) for women.
| Age Bracket | Male | Female |
| Under 5 Years | 18 (4.0%) | 21 (4.2%) |
| 5 to 9 Years | 71 (15.7%) | 28 (5.6%) |
| 10 to 14 Years | 24 (5.3%) | 12 (2.4%) |
| 15 to 19 Years | 0 (0.0%) | 8 (1.6%) |
| 20 to 24 Years | 17 (3.7%) | 0 (0.0%) |
| 25 to 29 Years | 27 (6.0%) | 46 (9.2%) |
| 30 to 34 Years | 0 (0.0%) | 57 (11.4%) |
| 35 to 39 Years | 7 (1.5%) | 34 (6.8%) |
| 40 to 44 Years | 25 (5.5%) | 32 (6.4%) |
| 45 to 49 Years | 17 (3.7%) | 0 (0.0%) |
| 50 to 54 Years | 6 (1.3%) | 6 (1.2%) |
| 55 to 59 Years | 69 (15.2%) | 39 (7.8%) |
| 60 to 64 Years | 29 (6.4%) | 116 (23.2%) |
| 65 to 69 Years | 63 (13.9%) | 61 (12.2%) |
| 70 to 74 Years | 35 (7.7%) | 21 (4.2%) |
| 75 to 79 Years | 11 (2.4%) | 7 (1.4%) |
| 80 to 84 Years | 0 (0.0%) | 6 (1.2%) |
| 85 Years and over | 34 (7.5%) | 7 (1.4%) |
| Total | 453 (100.0%) | 501 (100.0%) |
Families and Households in Laupahoehoe
Median Family Size in Laupahoehoe
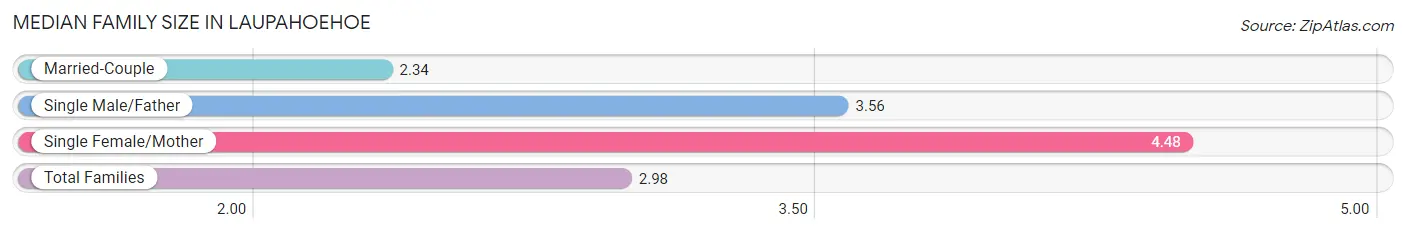
The median family size in Laupahoehoe is 2.98 persons per family, with single female/mother families (66 | 25.8%) accounting for the largest median family size of 4.48 persons per family. On the other hand, married-couple families (172 | 67.2%) represent the smallest median family size with 2.34 persons per family.
| Family Type | # Families | Family Size |
| Married-Couple | 172 (67.2%) | 2.34 |
| Single Male/Father | 18 (7.0%) | 3.56 |
| Single Female/Mother | 66 (25.8%) | 4.48 |
| Total Families | 256 (100.0%) | 2.98 |
Median Household Size in Laupahoehoe
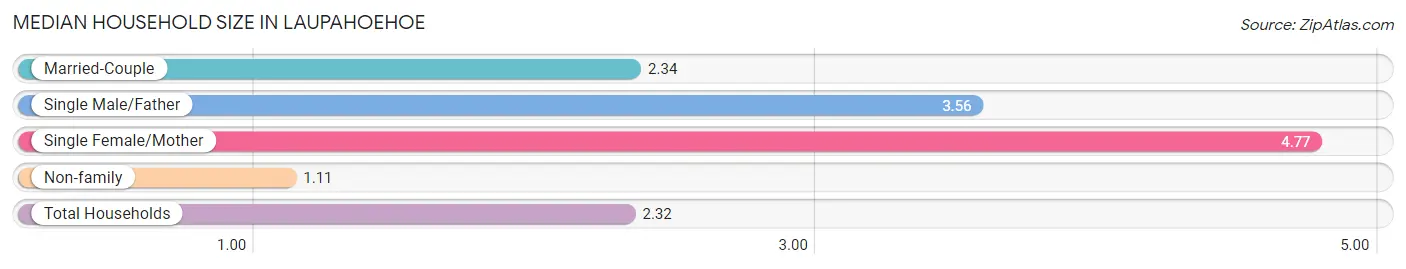
The median household size in Laupahoehoe is 2.32 persons per household, with single female/mother households (66 | 16.1%) accounting for the largest median household size of 4.77 persons per household. non-family households (155 | 37.7%) represent the smallest median household size with 1.11 persons per household.
| Household Type | # Households | Household Size |
| Married-Couple | 172 (41.8%) | 2.34 |
| Single Male/Father | 18 (4.4%) | 3.56 |
| Single Female/Mother | 66 (16.1%) | 4.77 |
| Non-family | 155 (37.7%) | 1.11 |
| Total Households | 411 (100.0%) | 2.32 |
Household Size by Marriage Status in Laupahoehoe
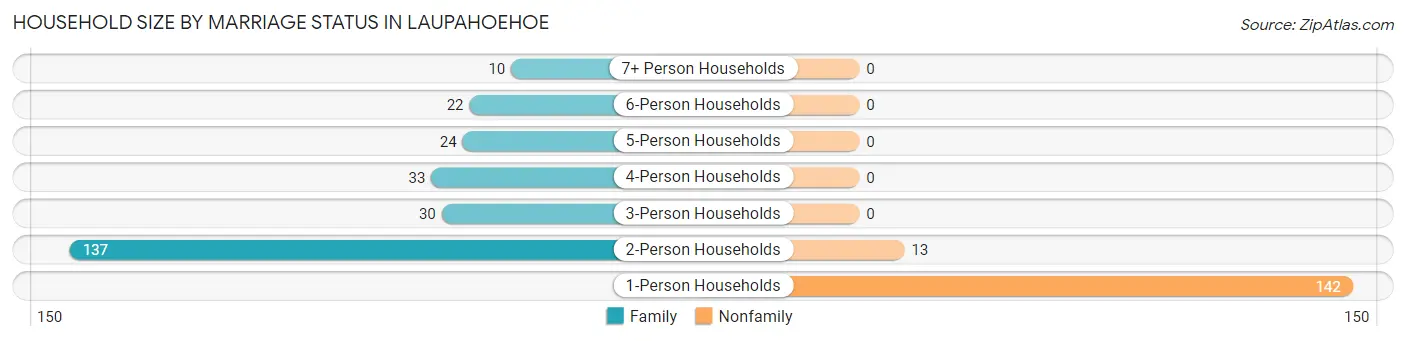
Out of a total of 411 households in Laupahoehoe, 256 (62.3%) are family households, while 155 (37.7%) are nonfamily households. The most numerous type of family households are 2-person households, comprising 137, and the most common type of nonfamily households are 1-person households, comprising 142.
| Household Size | Family Households | Nonfamily Households |
| 1-Person Households | - | 142 (34.5%) |
| 2-Person Households | 137 (33.3%) | 13 (3.2%) |
| 3-Person Households | 30 (7.3%) | 0 (0.0%) |
| 4-Person Households | 33 (8.0%) | 0 (0.0%) |
| 5-Person Households | 24 (5.8%) | 0 (0.0%) |
| 6-Person Households | 22 (5.3%) | 0 (0.0%) |
| 7+ Person Households | 10 (2.4%) | 0 (0.0%) |
| Total | 256 (62.3%) | 155 (37.7%) |
Female Fertility in Laupahoehoe
Fertility by Age in Laupahoehoe
| Age Bracket | Women with Births | Births / 1,000 Women |
| 15 to 19 years | 0 (0.0%) | 0.0 |
| 20 to 34 years | 0 (0.0%) | 0.0 |
| 35 to 50 years | 0 (0.0%) | 0.0 |
| Total | 0 (0.0%) | 0.0 |
Fertility by Age by Marriage Status in Laupahoehoe
| Age Bracket | Married | Unmarried |
| 15 to 19 years | 0 (0.0%) | 0 (0.0%) |
| 20 to 34 years | 0 (0.0%) | 0 (0.0%) |
| 35 to 50 years | 0 (0.0%) | 0 (0.0%) |
| Total | 0 (0.0%) | 0 (0.0%) |
Fertility by Education in Laupahoehoe
| Educational Attainment | Women with Births | Births / 1,000 Women |
| Less than High School | 0 (0.0%) | 0.0 |
| High School Diploma | 0 (0.0%) | 0.0 |
| College or Associate's Degree | 0 (0.0%) | 0.0 |
| Bachelor's Degree | 0 (0.0%) | 0.0 |
| Graduate Degree | 0 (0.0%) | 0.0 |
| Total | 0 (0.0%) | 0.0 |
Fertility by Education by Marriage Status in Laupahoehoe
| Educational Attainment | Married | Unmarried |
| Less than High School | 0 (0.0%) | 0 (0.0%) |
| High School Diploma | 0 (0.0%) | 0 (0.0%) |
| College or Associate's Degree | 0 (0.0%) | 0 (0.0%) |
| Bachelor's Degree | 0 (0.0%) | 0 (0.0%) |
| Graduate Degree | 0 (0.0%) | 0 (0.0%) |
| Total | 0 (0.0%) | 0 (0.0%) |
Income in Laupahoehoe
Income Overview in Laupahoehoe
Per Capita Income in Laupahoehoe is $37,702, while median incomes of families and households are $81,389 and $50,956 respectively.
| Characteristic | Number | Measure |
| Per Capita Income | 954 | $37,702 |
| Median Family Income | 256 | $81,389 |
| Mean Family Income | 256 | $101,427 |
| Median Household Income | 411 | $50,956 |
| Mean Household Income | 411 | $80,049 |
| Income Deficit | 256 | $0 |
| Wage / Income Gap (%) | 954 | 8.16% |
| Wage / Income Gap ($) | 954 | 91.84¢ per $1 |
| Gini / Inequality Index | 954 | 0.55 |
Earnings by Sex in Laupahoehoe
Average Earnings in Laupahoehoe are $46,655, $46,250 for men and $50,357 for women, a difference of 8.2%.
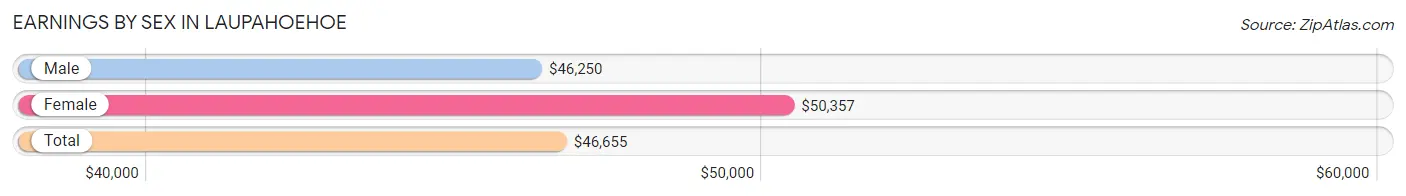
| Sex | Number | Average Earnings |
| Male | 141 (41.8%) | $46,250 |
| Female | 196 (58.2%) | $50,357 |
| Total | 337 (100.0%) | $46,655 |
Earnings by Sex by Income Bracket in Laupahoehoe
The most common earnings brackets in Laupahoehoe are $45,000 to $49,999 for men (27 | 19.2%) and $75,000 to $99,999 for women (34 | 17.3%).
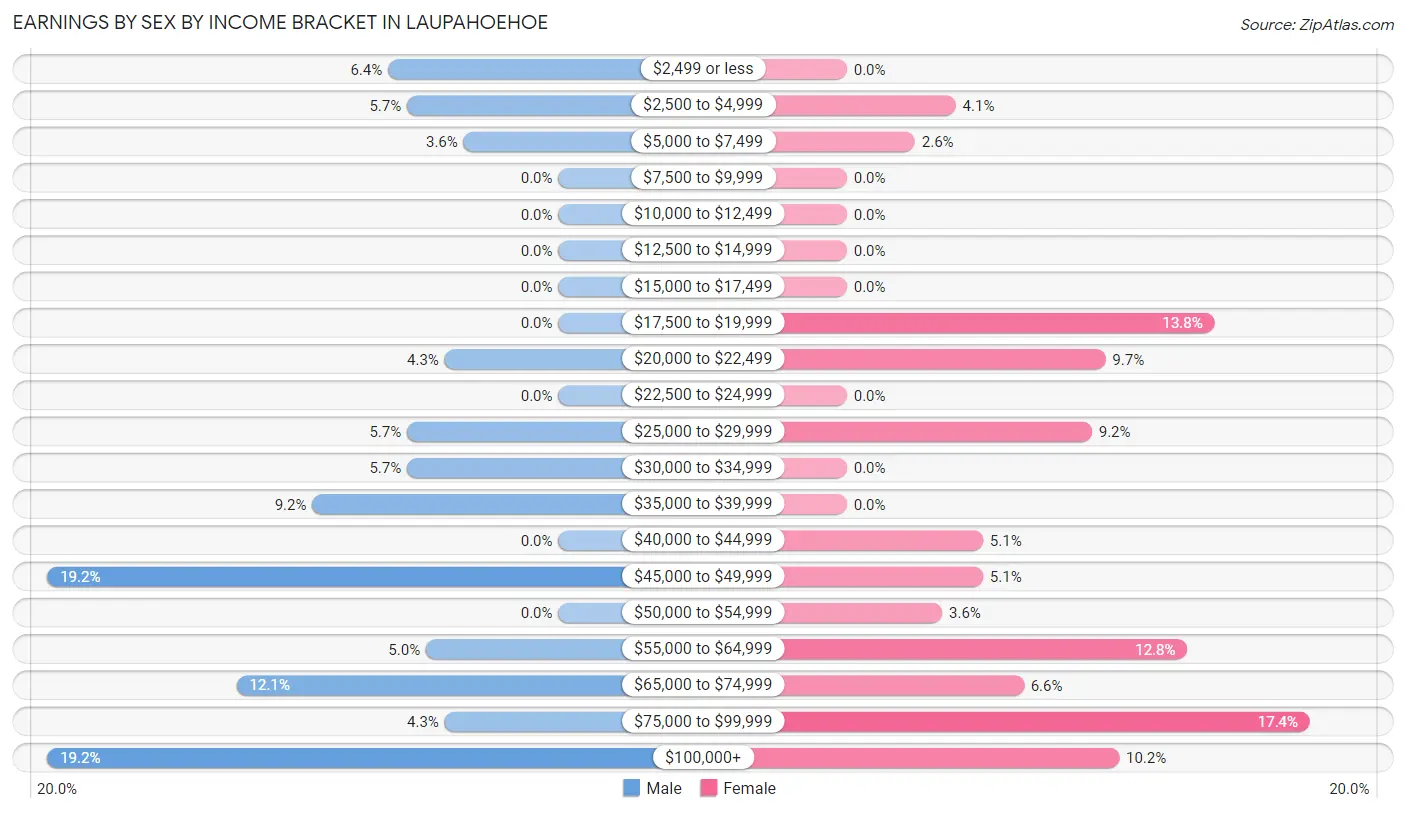
| Income | Male | Female |
| $2,499 or less | 9 (6.4%) | 0 (0.0%) |
| $2,500 to $4,999 | 8 (5.7%) | 8 (4.1%) |
| $5,000 to $7,499 | 5 (3.5%) | 5 (2.5%) |
| $7,500 to $9,999 | 0 (0.0%) | 0 (0.0%) |
| $10,000 to $12,499 | 0 (0.0%) | 0 (0.0%) |
| $12,500 to $14,999 | 0 (0.0%) | 0 (0.0%) |
| $15,000 to $17,499 | 0 (0.0%) | 0 (0.0%) |
| $17,500 to $19,999 | 0 (0.0%) | 27 (13.8%) |
| $20,000 to $22,499 | 6 (4.3%) | 19 (9.7%) |
| $22,500 to $24,999 | 0 (0.0%) | 0 (0.0%) |
| $25,000 to $29,999 | 8 (5.7%) | 18 (9.2%) |
| $30,000 to $34,999 | 8 (5.7%) | 0 (0.0%) |
| $35,000 to $39,999 | 13 (9.2%) | 0 (0.0%) |
| $40,000 to $44,999 | 0 (0.0%) | 10 (5.1%) |
| $45,000 to $49,999 | 27 (19.2%) | 10 (5.1%) |
| $50,000 to $54,999 | 0 (0.0%) | 7 (3.6%) |
| $55,000 to $64,999 | 7 (5.0%) | 25 (12.8%) |
| $65,000 to $74,999 | 17 (12.1%) | 13 (6.6%) |
| $75,000 to $99,999 | 6 (4.3%) | 34 (17.3%) |
| $100,000+ | 27 (19.2%) | 20 (10.2%) |
| Total | 141 (100.0%) | 196 (100.0%) |
Earnings by Sex by Educational Attainment in Laupahoehoe
Average earnings in Laupahoehoe are $47,037 for men and $50,357 for women, a difference of 6.6%. Men with an educational attainment of college or associate's degree enjoy the highest average annual earnings of $58,393, while those with college or associate's degree education earn the least with $58,393. Women with an educational attainment of college or associate's degree earn the most with the average annual earnings of $47,250, while those with college or associate's degree education have the smallest earnings of $47,250.
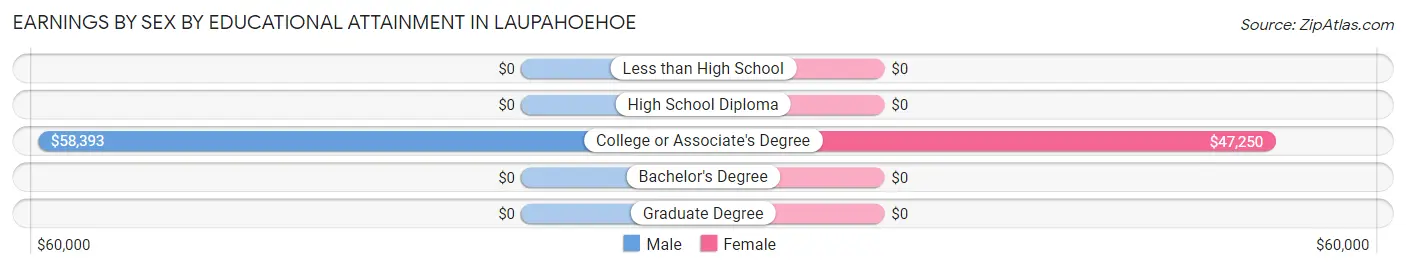
| Educational Attainment | Male Income | Female Income |
| Less than High School | - | - |
| High School Diploma | - | - |
| College or Associate's Degree | $58,393 | $47,250 |
| Bachelor's Degree | - | - |
| Graduate Degree | - | - |
| Total | $47,037 | $50,357 |
Family Income in Laupahoehoe
Family Income Brackets in Laupahoehoe
According to the Laupahoehoe family income data, there are 57 families falling into the less than $10,000 income range, which is the most common income bracket and makes up 22.3% of all families.
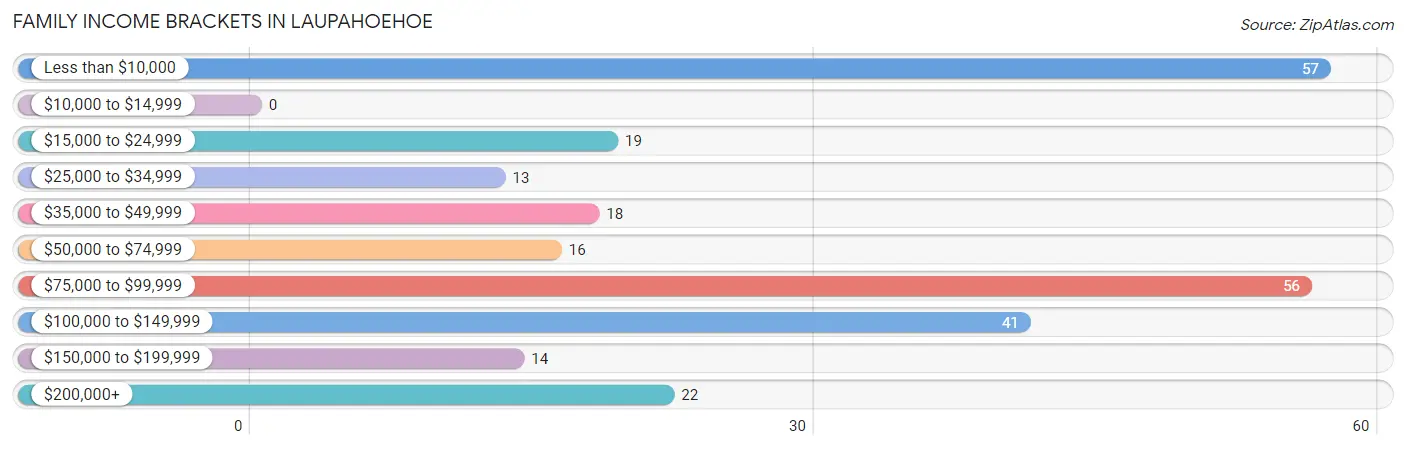
| Income Bracket | # Families | % Families |
| Less than $10,000 | 57 | 22.3% |
| $10,000 to $14,999 | 0 | 0.0% |
| $15,000 to $24,999 | 19 | 7.4% |
| $25,000 to $34,999 | 13 | 5.1% |
| $35,000 to $49,999 | 18 | 7.0% |
| $50,000 to $74,999 | 16 | 6.3% |
| $75,000 to $99,999 | 56 | 21.9% |
| $100,000 to $149,999 | 41 | 16.0% |
| $150,000 to $199,999 | 14 | 5.5% |
| $200,000+ | 22 | 8.6% |
Family Income by Famaliy Size in Laupahoehoe
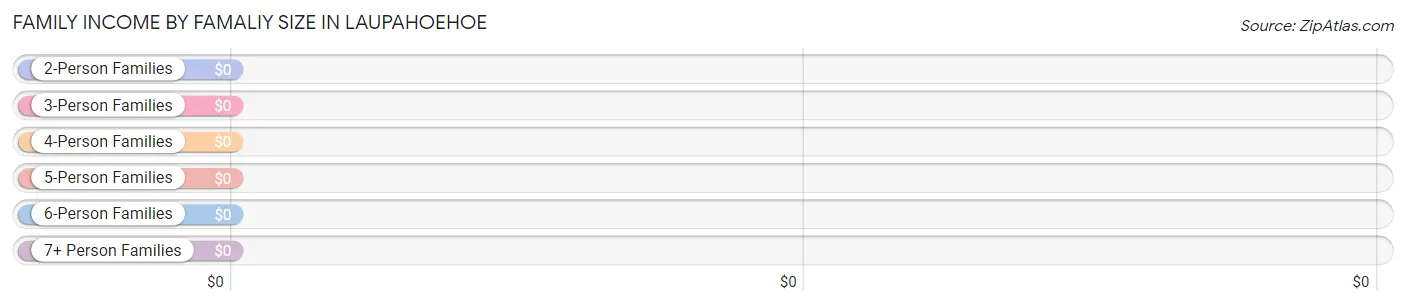
| Income Bracket | # Families | Median Income |
| 2-Person Families | 143 (55.9%) | $0 |
| 3-Person Families | 24 (9.4%) | $0 |
| 4-Person Families | 33 (12.9%) | $0 |
| 5-Person Families | 24 (9.4%) | $0 |
| 6-Person Families | 22 (8.6%) | $0 |
| 7+ Person Families | 10 (3.9%) | $0 |
| Total | 256 (100.0%) | $81,389 |
Family Income by Number of Earners in Laupahoehoe
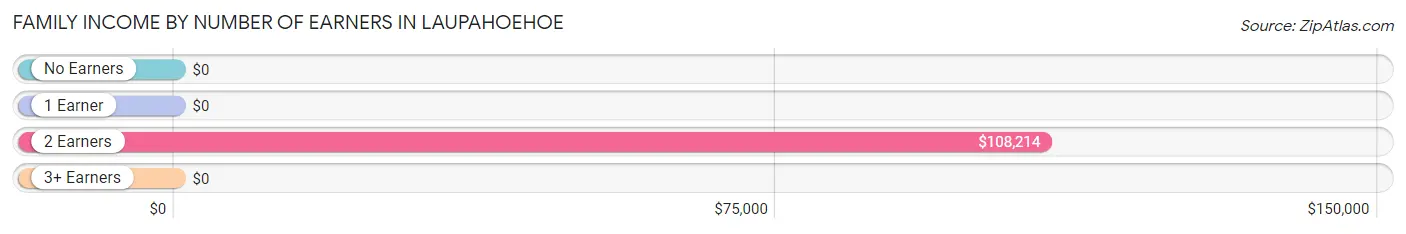
| Number of Earners | # Families | Median Income |
| No Earners | 108 (42.2%) | $0 |
| 1 Earner | 52 (20.3%) | $0 |
| 2 Earners | 96 (37.5%) | $108,214 |
| 3+ Earners | 0 (0.0%) | $0 |
| Total | 256 (100.0%) | $81,389 |
Household Income in Laupahoehoe
Household Income Brackets in Laupahoehoe
With 73 households falling in the category, the $50,000 to $74,999 income range is the most frequent in Laupahoehoe, accounting for 17.8% of all households. In contrast, only 20 households (4.9%) fall into the $150,000 to $199,999 income bracket, making it the least populous group.
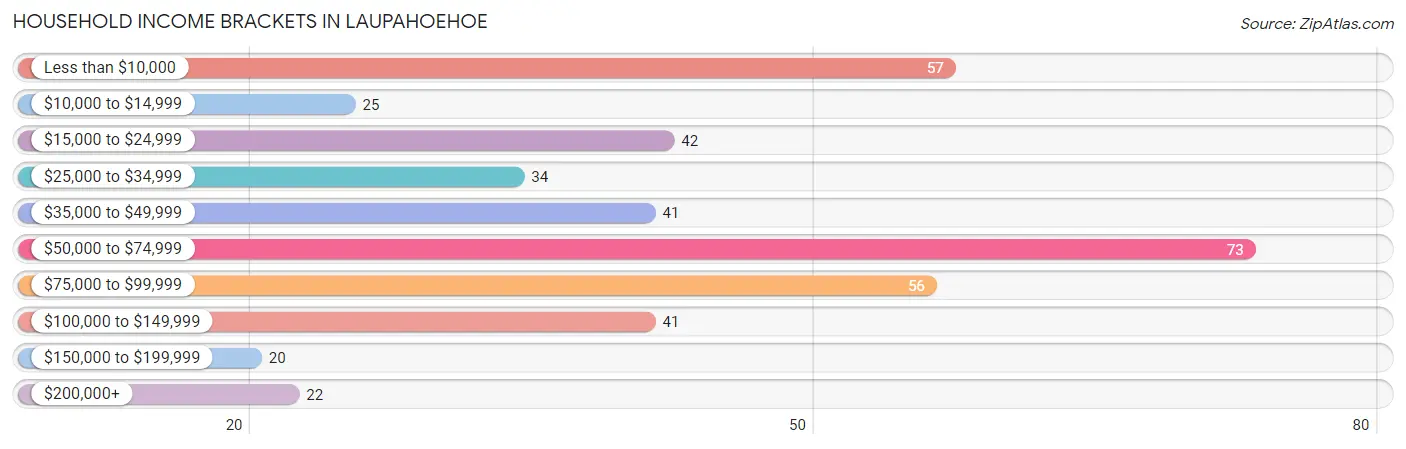
| Income Bracket | # Households | % Households |
| Less than $10,000 | 57 | 13.9% |
| $10,000 to $14,999 | 25 | 6.1% |
| $15,000 to $24,999 | 42 | 10.2% |
| $25,000 to $34,999 | 34 | 8.3% |
| $35,000 to $49,999 | 41 | 10.0% |
| $50,000 to $74,999 | 73 | 17.8% |
| $75,000 to $99,999 | 56 | 13.6% |
| $100,000 to $149,999 | 41 | 10.0% |
| $150,000 to $199,999 | 20 | 4.9% |
| $200,000+ | 22 | 5.4% |
Household Income by Householder Age in Laupahoehoe
The median household income in Laupahoehoe is $50,956, with the highest median household income of $87,569 found in the 65+ years age bracket for the primary householder. A total of 153 households (37.2%) fall into this category.
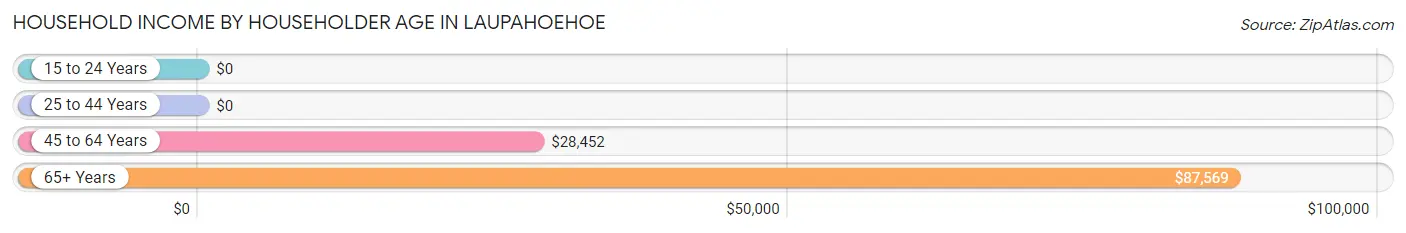
| Income Bracket | # Households | Median Income |
| 15 to 24 Years | 0 (0.0%) | $0 |
| 25 to 44 Years | 56 (13.6%) | $0 |
| 45 to 64 Years | 202 (49.1%) | $28,452 |
| 65+ Years | 153 (37.2%) | $87,569 |
| Total | 411 (100.0%) | $50,956 |
Poverty in Laupahoehoe
Income Below Poverty by Sex and Age in Laupahoehoe
With 13.3% poverty level for males and 28.1% for females among the residents of Laupahoehoe, 5 year old males and 16 and 17 year old females are the most vulnerable to poverty, with 22 males (73.3%) and 8 females (100.0%) in their respective age groups living below the poverty level.
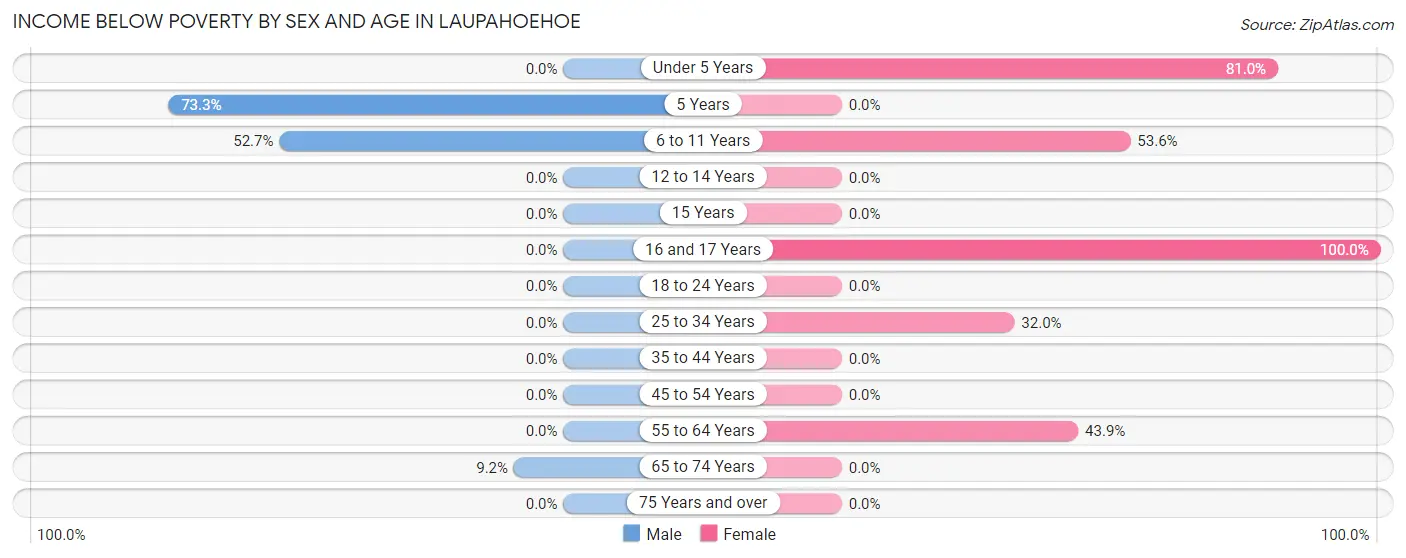
| Age Bracket | Male | Female |
| Under 5 Years | 0 (0.0%) | 17 (80.9%) |
| 5 Years | 22 (73.3%) | 0 (0.0%) |
| 6 to 11 Years | 29 (52.7%) | 15 (53.6%) |
| 12 to 14 Years | 0 (0.0%) | 0 (0.0%) |
| 15 Years | 0 (0.0%) | 0 (0.0%) |
| 16 and 17 Years | 0 (0.0%) | 8 (100.0%) |
| 18 to 24 Years | 0 (0.0%) | 0 (0.0%) |
| 25 to 34 Years | 0 (0.0%) | 33 (32.0%) |
| 35 to 44 Years | 0 (0.0%) | 0 (0.0%) |
| 45 to 54 Years | 0 (0.0%) | 0 (0.0%) |
| 55 to 64 Years | 0 (0.0%) | 68 (43.9%) |
| 65 to 74 Years | 9 (9.2%) | 0 (0.0%) |
| 75 Years and over | 0 (0.0%) | 0 (0.0%) |
| Total | 60 (13.3%) | 141 (28.1%) |
Income Above Poverty by Sex and Age in Laupahoehoe
According to the poverty statistics in Laupahoehoe, males aged under 5 years and females aged 12 to 14 years are the age groups that are most secure financially, with 100.0% of males and 100.0% of females in these age groups living above the poverty line.
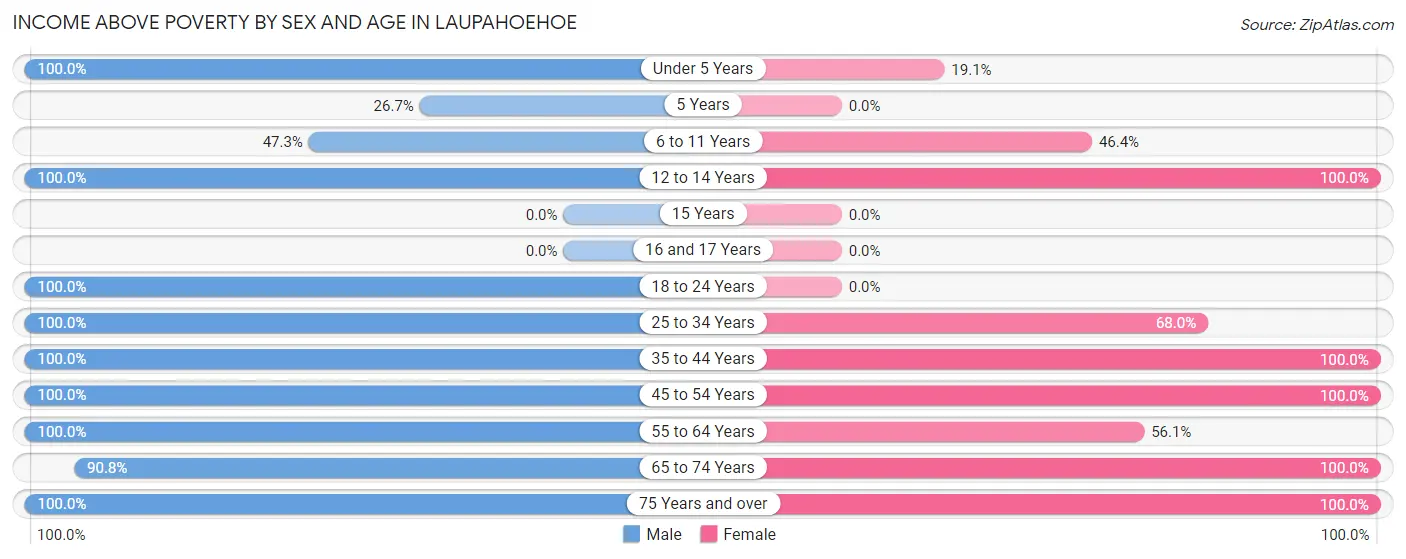
| Age Bracket | Male | Female |
| Under 5 Years | 18 (100.0%) | 4 (19.1%) |
| 5 Years | 8 (26.7%) | 0 (0.0%) |
| 6 to 11 Years | 26 (47.3%) | 13 (46.4%) |
| 12 to 14 Years | 10 (100.0%) | 12 (100.0%) |
| 15 Years | 0 (0.0%) | 0 (0.0%) |
| 16 and 17 Years | 0 (0.0%) | 0 (0.0%) |
| 18 to 24 Years | 17 (100.0%) | 0 (0.0%) |
| 25 to 34 Years | 27 (100.0%) | 70 (68.0%) |
| 35 to 44 Years | 32 (100.0%) | 66 (100.0%) |
| 45 to 54 Years | 23 (100.0%) | 6 (100.0%) |
| 55 to 64 Years | 98 (100.0%) | 87 (56.1%) |
| 65 to 74 Years | 89 (90.8%) | 82 (100.0%) |
| 75 Years and over | 45 (100.0%) | 20 (100.0%) |
| Total | 393 (86.8%) | 360 (71.9%) |
Income Below Poverty Among Married-Couple Families in Laupahoehoe
The poverty statistics for married-couple families in Laupahoehoe show that 25.0% or 43 of the total 172 families live below the poverty line. Families with no children have the highest poverty rate of 29.9%, comprising of 43 families. On the other hand, families with 1 or 2 children have the lowest poverty rate of 0.0%, which includes 0 families.
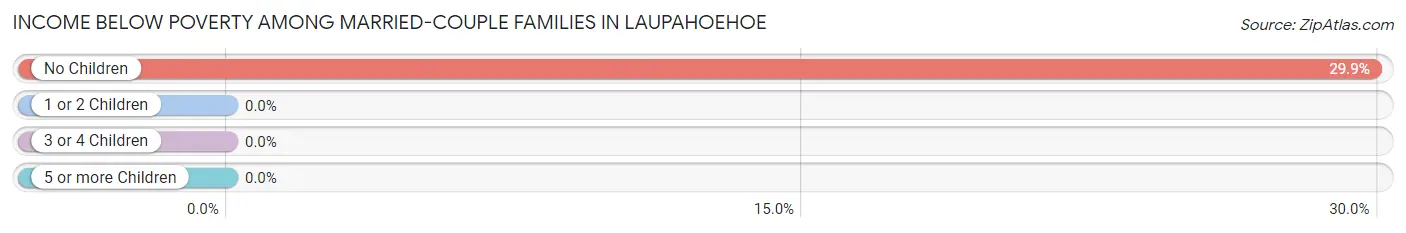
| Children | Above Poverty | Below Poverty |
| No Children | 101 (70.1%) | 43 (29.9%) |
| 1 or 2 Children | 28 (100.0%) | 0 (0.0%) |
| 3 or 4 Children | 0 (0.0%) | 0 (0.0%) |
| 5 or more Children | 0 (0.0%) | 0 (0.0%) |
| Total | 129 (75.0%) | 43 (25.0%) |
Income Below Poverty Among Single-Parent Households in Laupahoehoe
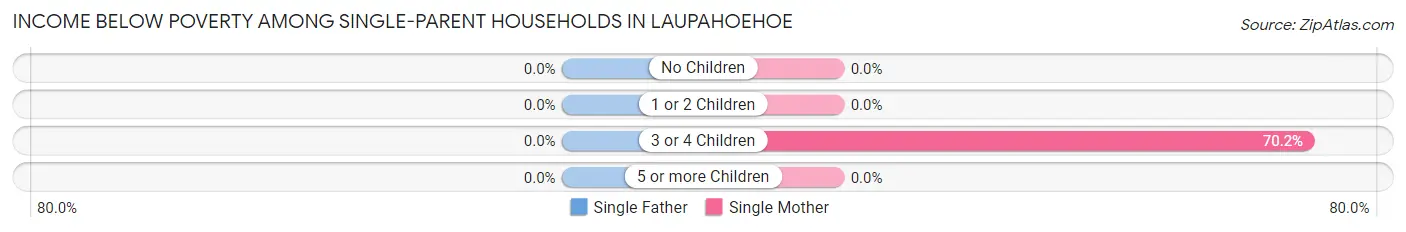
| Children | Single Father | Single Mother |
| No Children | 0 (0.0%) | 0 (0.0%) |
| 1 or 2 Children | 0 (0.0%) | 0 (0.0%) |
| 3 or 4 Children | 0 (0.0%) | 33 (70.2%) |
| 5 or more Children | 0 (0.0%) | 0 (0.0%) |
| Total | 0 (0.0%) | 33 (50.0%) |
Income Below Poverty Among Married-Couple vs Single-Parent Households in Laupahoehoe
The poverty data for Laupahoehoe shows that 43 of the married-couple family households (25.0%) and 33 of the single-parent households (39.3%) are living below the poverty level. Within the married-couple family households, those with no children have the highest poverty rate, with 43 households (29.9%) falling below the poverty line. Among the single-parent households, those with 3 or 4 children have the highest poverty rate, with 33 household (70.2%) living below poverty.
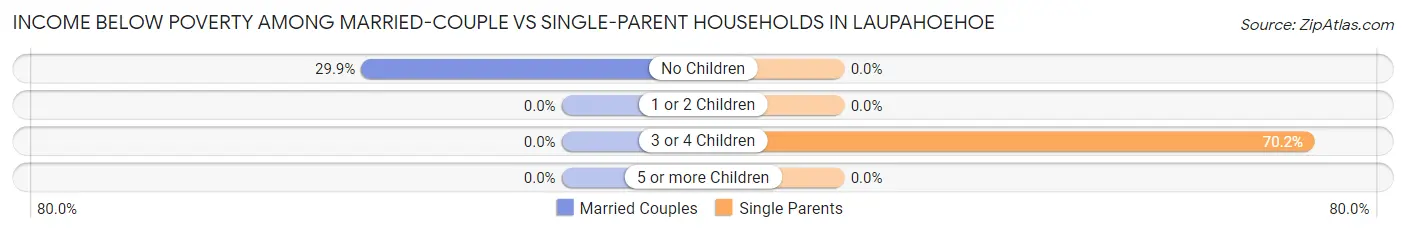
| Children | Married-Couple Families | Single-Parent Households |
| No Children | 43 (29.9%) | 0 (0.0%) |
| 1 or 2 Children | 0 (0.0%) | 0 (0.0%) |
| 3 or 4 Children | 0 (0.0%) | 33 (70.2%) |
| 5 or more Children | 0 (0.0%) | 0 (0.0%) |
| Total | 43 (25.0%) | 33 (39.3%) |
Employment Characteristics in Laupahoehoe
Employment by Class of Employer in Laupahoehoe
Among the 310 employed individuals in Laupahoehoe, private company employees (185 | 59.7%), state government employees (48 | 15.5%), and self-employed (not incorporated) (45 | 14.5%) make up the most common classes of employment.
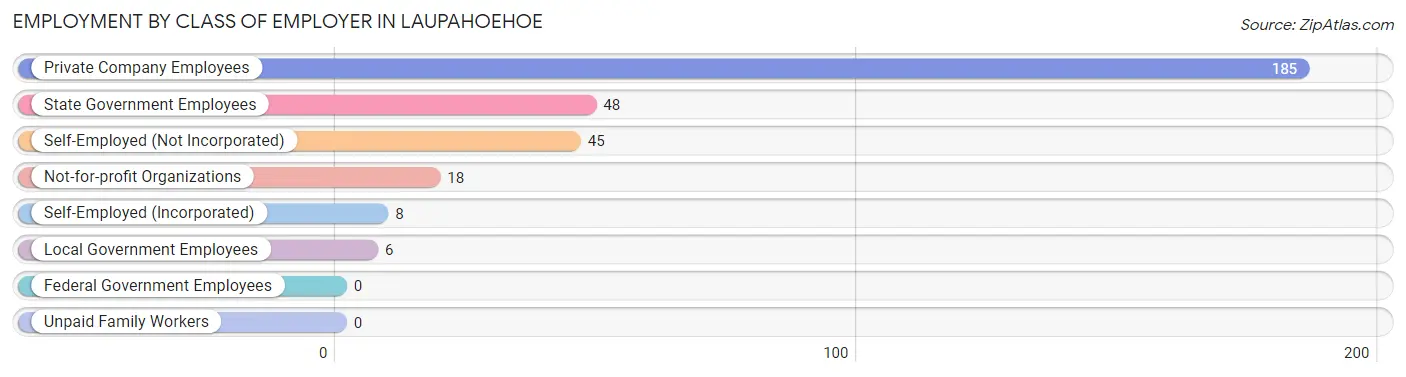
| Employer Class | # Employees | % Employees |
| Private Company Employees | 185 | 59.7% |
| Self-Employed (Incorporated) | 8 | 2.6% |
| Self-Employed (Not Incorporated) | 45 | 14.5% |
| Not-for-profit Organizations | 18 | 5.8% |
| Local Government Employees | 6 | 1.9% |
| State Government Employees | 48 | 15.5% |
| Federal Government Employees | 0 | 0.0% |
| Unpaid Family Workers | 0 | 0.0% |
| Total | 310 | 100.0% |
Employment Status by Age in Laupahoehoe
According to the labor force statistics for Laupahoehoe, out of the total population over 16 years of age (780), 47.4% or 370 individuals are in the labor force, with 14.6% or 54 of them unemployed. The age group with the highest labor force participation rate is 35 to 44 years, with 92.9% or 91 individuals in the labor force. Within the labor force, the 60 to 64 years age range has the highest percentage of unemployed individuals, with 39.1% or 25 of them being unemployed.
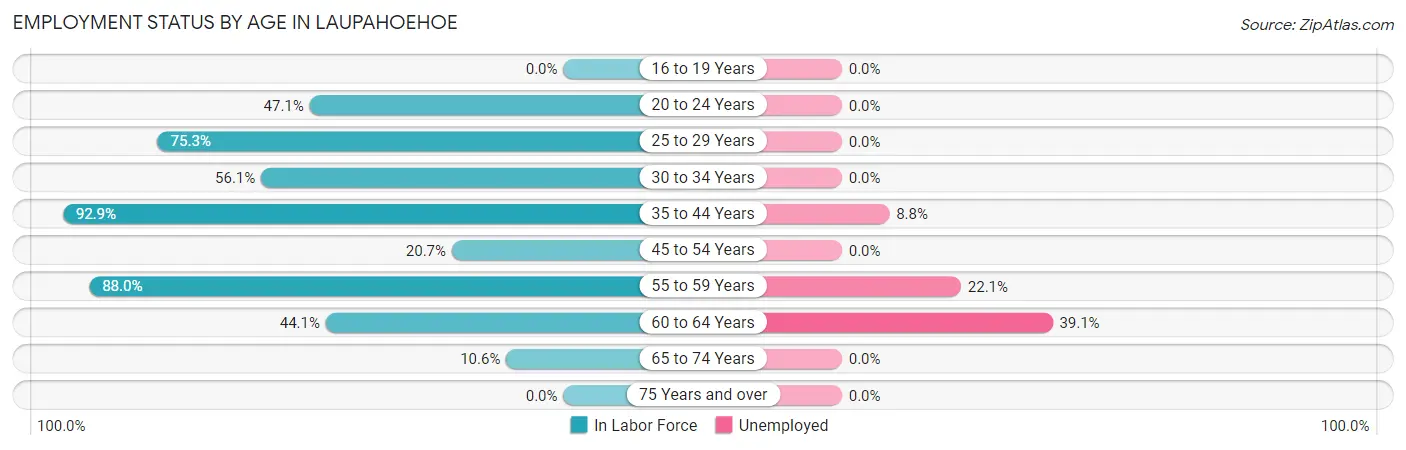
| Age Bracket | In Labor Force | Unemployed |
| 16 to 19 Years | 0 (0.0%) | 0 (0.0%) |
| 20 to 24 Years | 8 (47.1%) | 0 (0.0%) |
| 25 to 29 Years | 55 (75.3%) | 0 (0.0%) |
| 30 to 34 Years | 32 (56.1%) | 0 (0.0%) |
| 35 to 44 Years | 91 (92.9%) | 8 (8.8%) |
| 45 to 54 Years | 6 (20.7%) | 0 (0.0%) |
| 55 to 59 Years | 95 (88.0%) | 21 (22.1%) |
| 60 to 64 Years | 64 (44.1%) | 25 (39.1%) |
| 65 to 74 Years | 19 (10.6%) | 0 (0.0%) |
| 75 Years and over | 0 (0.0%) | 0 (0.0%) |
| Total | 370 (47.4%) | 54 (14.6%) |
Employment Status by Educational Attainment in Laupahoehoe
According to labor force statistics for Laupahoehoe, 67.3% of individuals (343) out of the total population between 25 and 64 years of age (510) are in the labor force, with 15.7% or 54 of them being unemployed. The group with the highest labor force participation rate are those with the educational attainment of bachelor's degree or higher, with 85.4% or 105 individuals in the labor force. Within the labor force, individuals with bachelor's degree or higher education have the highest percentage of unemployment, with 43.8% or 46 of them being unemployed.
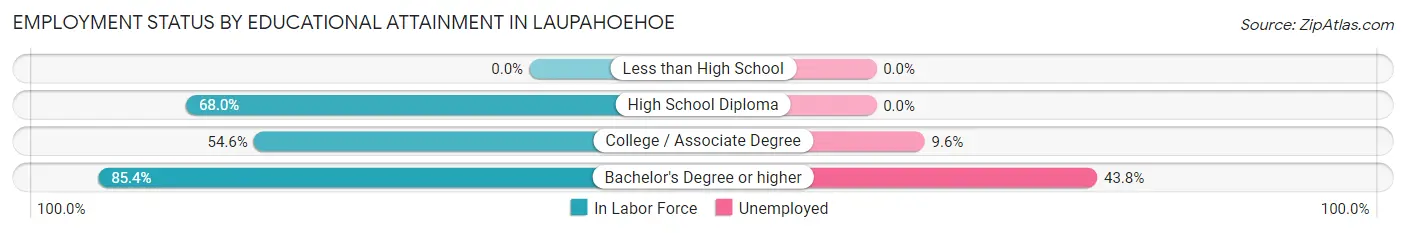
| Educational Attainment | In Labor Force | Unemployed |
| Less than High School | 0 (0.0%) | 0 (0.0%) |
| High School Diploma | 155 (68.0%) | 0 (0.0%) |
| College / Associate Degree | 83 (54.6%) | 15 (9.6%) |
| Bachelor's Degree or higher | 105 (85.4%) | 54 (43.8%) |
| Total | 343 (67.3%) | 80 (15.7%) |
Employment Occupations by Sex in Laupahoehoe
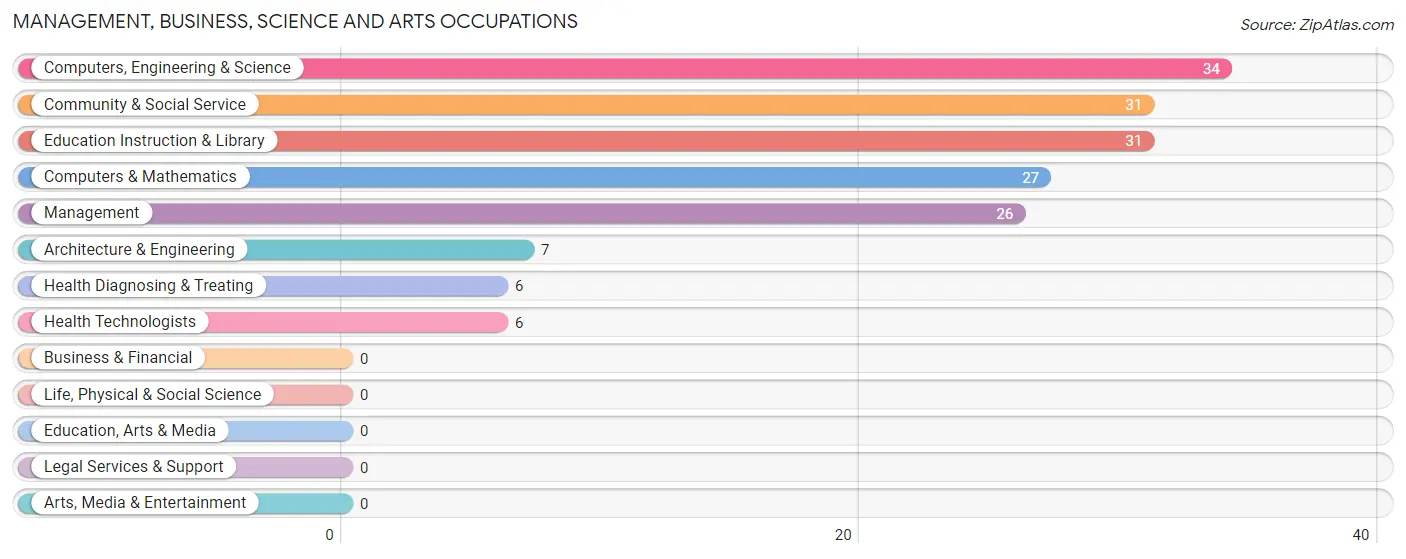
Management, Business, Science and Arts Occupations
The most common Management, Business, Science and Arts occupations in Laupahoehoe are Computers, Engineering & Science (34 | 10.8%), Community & Social Service (31 | 9.8%), Education Instruction & Library (31 | 9.8%), Computers & Mathematics (27 | 8.5%), and Management (26 | 8.2%).
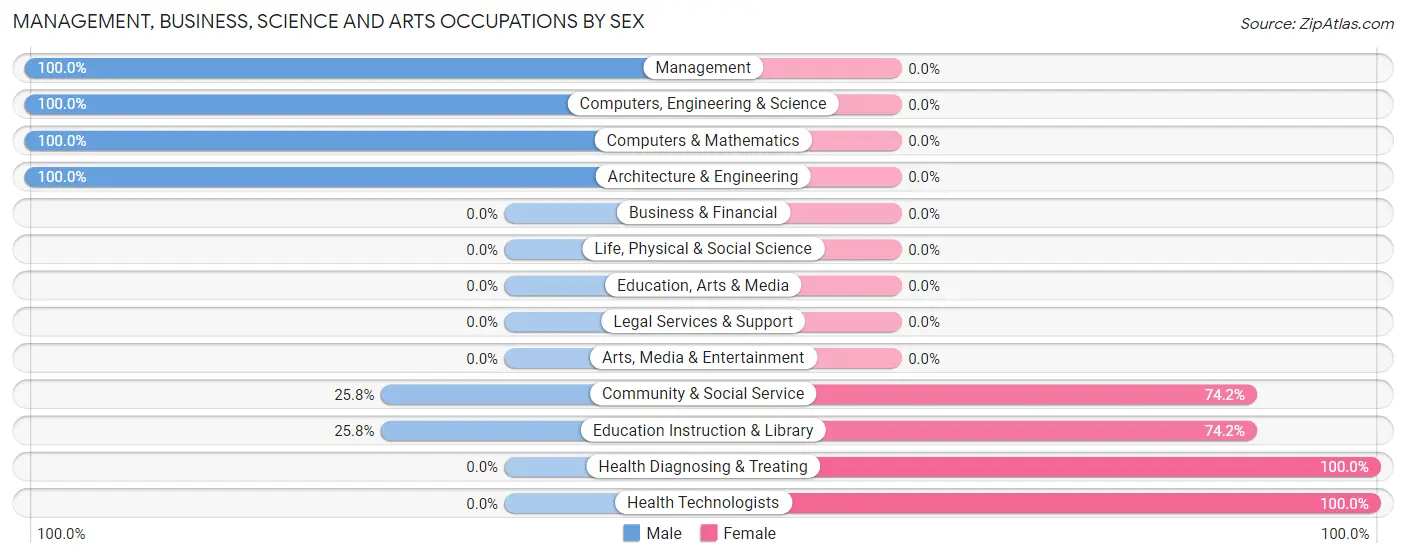
Management, Business, Science and Arts Occupations by Sex
Within the Management, Business, Science and Arts occupations in Laupahoehoe, the most male-oriented occupations are Management (100.0%), Computers, Engineering & Science (100.0%), and Computers & Mathematics (100.0%), while the most female-oriented occupations are Health Diagnosing & Treating (100.0%), Health Technologists (100.0%), and Community & Social Service (74.2%).
| Occupation | Male | Female |
| Management | 26 (100.0%) | 0 (0.0%) |
| Business & Financial | 0 (0.0%) | 0 (0.0%) |
| Computers, Engineering & Science | 34 (100.0%) | 0 (0.0%) |
| Computers & Mathematics | 27 (100.0%) | 0 (0.0%) |
| Architecture & Engineering | 7 (100.0%) | 0 (0.0%) |
| Life, Physical & Social Science | 0 (0.0%) | 0 (0.0%) |
| Community & Social Service | 8 (25.8%) | 23 (74.2%) |
| Education, Arts & Media | 0 (0.0%) | 0 (0.0%) |
| Legal Services & Support | 0 (0.0%) | 0 (0.0%) |
| Education Instruction & Library | 8 (25.8%) | 23 (74.2%) |
| Arts, Media & Entertainment | 0 (0.0%) | 0 (0.0%) |
| Health Diagnosing & Treating | 0 (0.0%) | 6 (100.0%) |
| Health Technologists | 0 (0.0%) | 6 (100.0%) |
| Total (Category) | 68 (70.1%) | 29 (29.9%) |
| Total (Overall) | 125 (39.6%) | 191 (60.4%) |
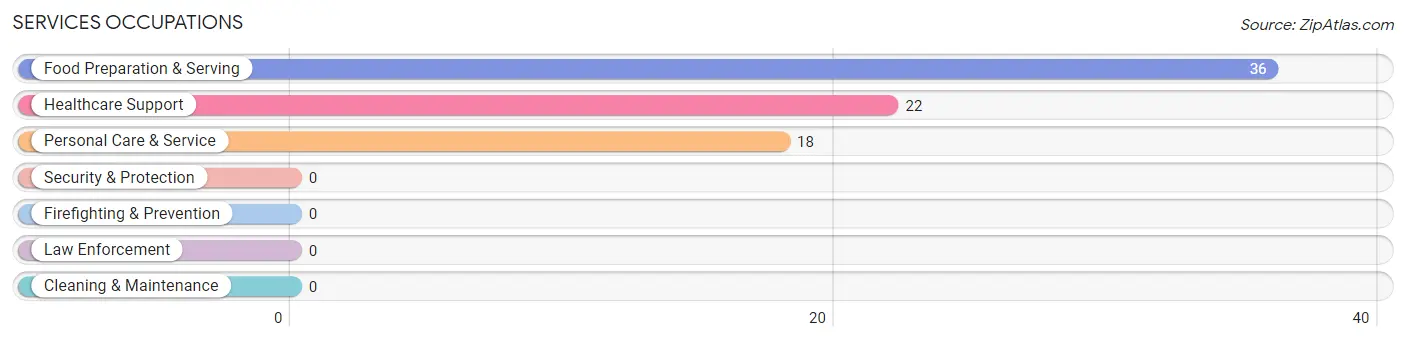
Services Occupations
The most common Services occupations in Laupahoehoe are Food Preparation & Serving (36 | 11.4%), Healthcare Support (22 | 7.0%), and Personal Care & Service (18 | 5.7%).
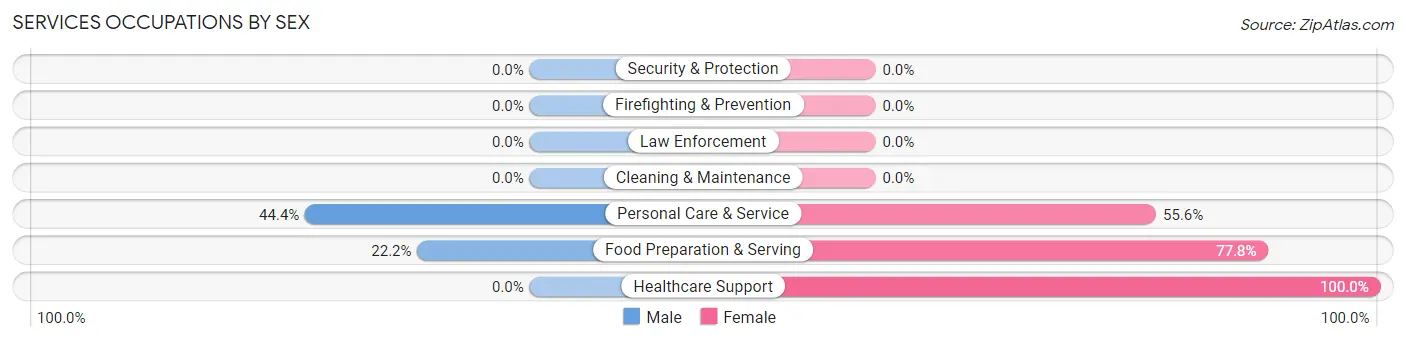
Services Occupations by Sex
Within the Services occupations in Laupahoehoe, the most male-oriented occupations are Personal Care & Service (44.4%), and Food Preparation & Serving (22.2%), while the most female-oriented occupations are Healthcare Support (100.0%), Food Preparation & Serving (77.8%), and Personal Care & Service (55.6%).
| Occupation | Male | Female |
| Healthcare Support | 0 (0.0%) | 22 (100.0%) |
| Security & Protection | 0 (0.0%) | 0 (0.0%) |
| Firefighting & Prevention | 0 (0.0%) | 0 (0.0%) |
| Law Enforcement | 0 (0.0%) | 0 (0.0%) |
| Food Preparation & Serving | 8 (22.2%) | 28 (77.8%) |
| Cleaning & Maintenance | 0 (0.0%) | 0 (0.0%) |
| Personal Care & Service | 8 (44.4%) | 10 (55.6%) |
| Total (Category) | 16 (21.0%) | 60 (78.9%) |
| Total (Overall) | 125 (39.6%) | 191 (60.4%) |
Sales and Office Occupations
The most common Sales and Office occupations in Laupahoehoe are Office & Administration (44 | 13.9%), and Sales & Related (28 | 8.9%).

Sales and Office Occupations by Sex
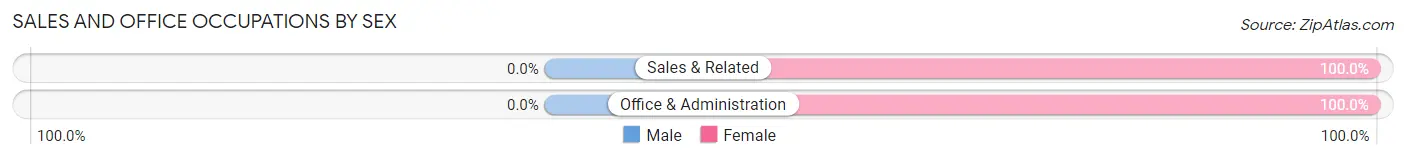
| Occupation | Male | Female |
| Sales & Related | 0 (0.0%) | 28 (100.0%) |
| Office & Administration | 0 (0.0%) | 44 (100.0%) |
| Total (Category) | 0 (0.0%) | 72 (100.0%) |
| Total (Overall) | 125 (39.6%) | 191 (60.4%) |
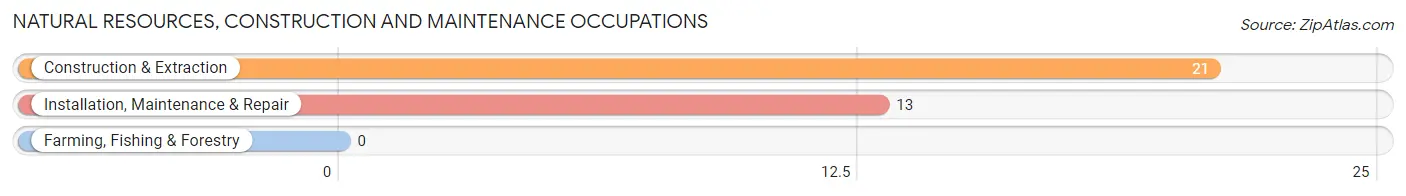
Natural Resources, Construction and Maintenance Occupations
The most common Natural Resources, Construction and Maintenance occupations in Laupahoehoe are Construction & Extraction (21 | 6.7%), and Installation, Maintenance & Repair (13 | 4.1%).
Natural Resources, Construction and Maintenance Occupations by Sex
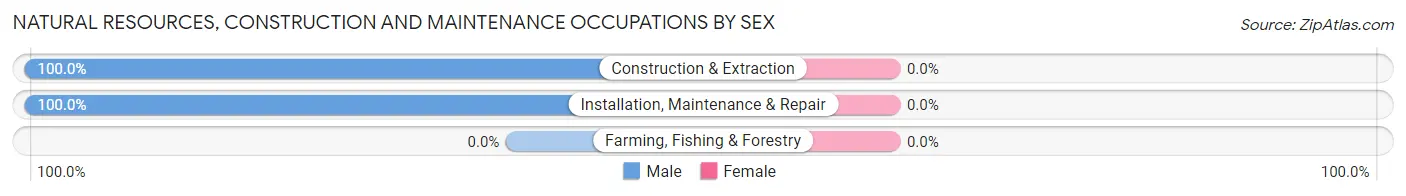
| Occupation | Male | Female |
| Farming, Fishing & Forestry | 0 (0.0%) | 0 (0.0%) |
| Construction & Extraction | 21 (100.0%) | 0 (0.0%) |
| Installation, Maintenance & Repair | 13 (100.0%) | 0 (0.0%) |
| Total (Category) | 34 (100.0%) | 0 (0.0%) |
| Total (Overall) | 125 (39.6%) | 191 (60.4%) |
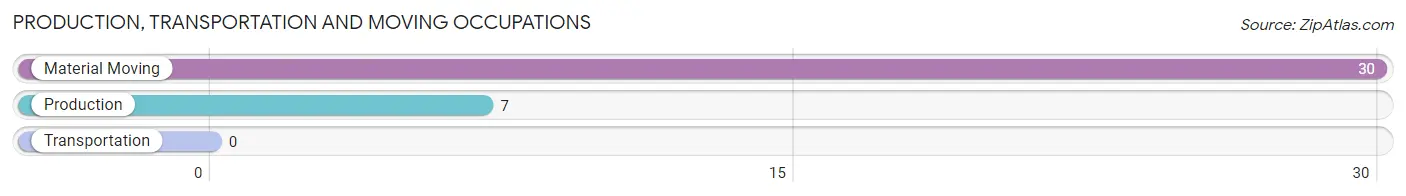
Production, Transportation and Moving Occupations
The most common Production, Transportation and Moving occupations in Laupahoehoe are Material Moving (30 | 9.5%), and Production (7 | 2.2%).
Production, Transportation and Moving Occupations by Sex
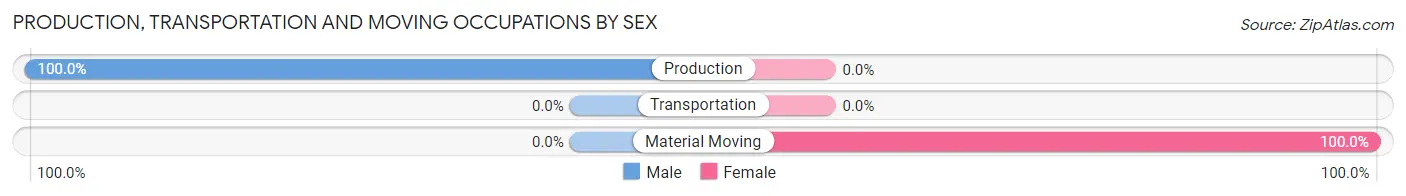
| Occupation | Male | Female |
| Production | 7 (100.0%) | 0 (0.0%) |
| Transportation | 0 (0.0%) | 0 (0.0%) |
| Material Moving | 0 (0.0%) | 30 (100.0%) |
| Total (Category) | 7 (18.9%) | 30 (81.1%) |
| Total (Overall) | 125 (39.6%) | 191 (60.4%) |
Employment Industries by Sex in Laupahoehoe
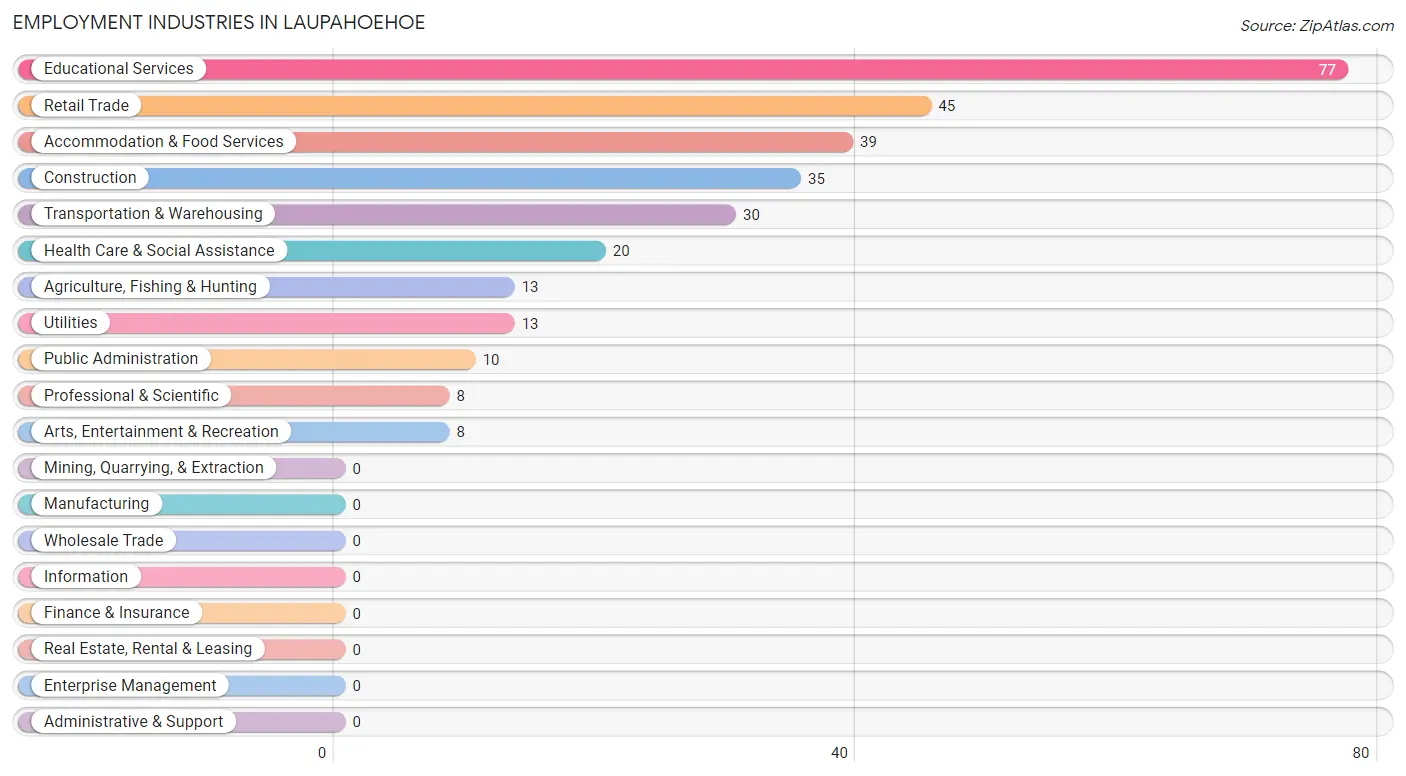
Employment Industries in Laupahoehoe
The major employment industries in Laupahoehoe include Educational Services (77 | 24.4%), Retail Trade (45 | 14.2%), Accommodation & Food Services (39 | 12.3%), Construction (35 | 11.1%), and Transportation & Warehousing (30 | 9.5%).
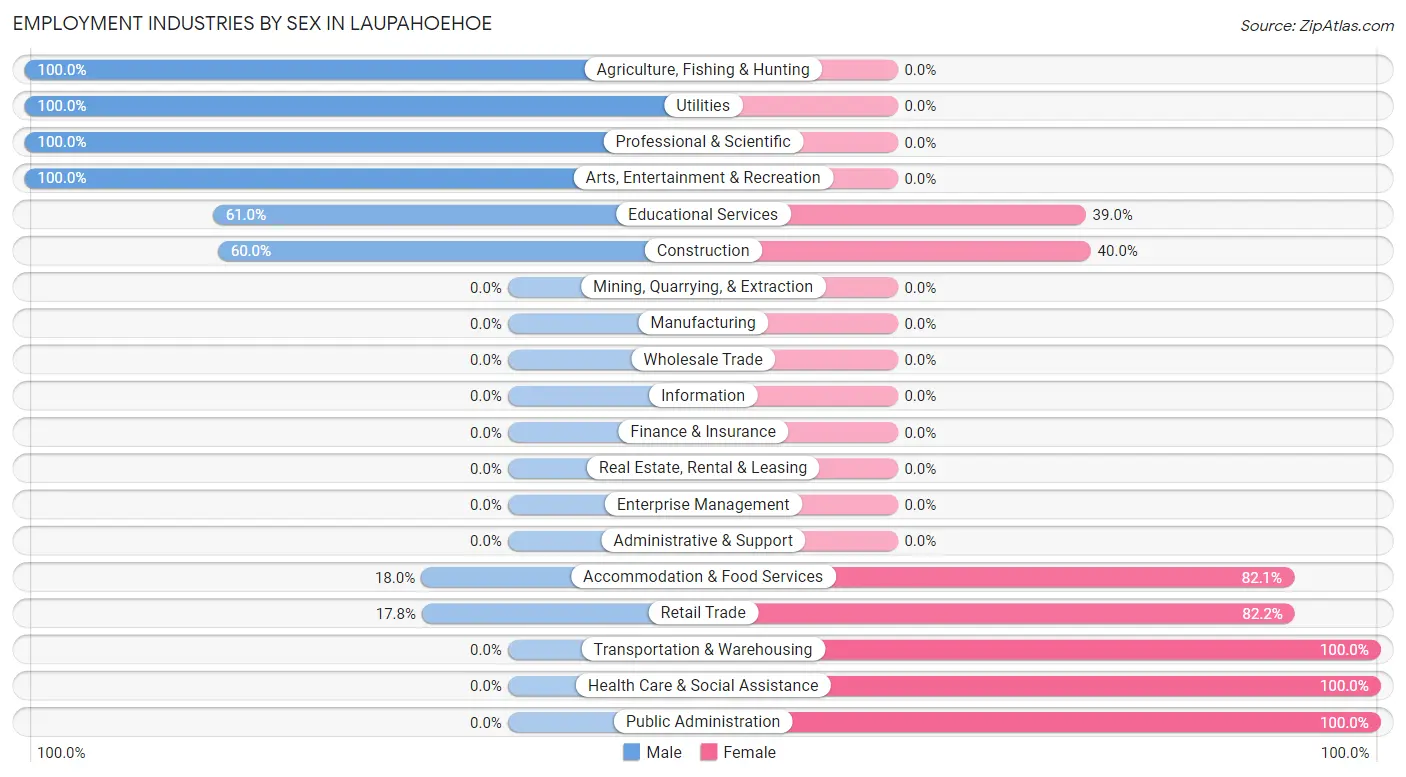
Employment Industries by Sex in Laupahoehoe
The Laupahoehoe industries that see more men than women are Agriculture, Fishing & Hunting (100.0%), Utilities (100.0%), and Professional & Scientific (100.0%), whereas the industries that tend to have a higher number of women are Transportation & Warehousing (100.0%), Health Care & Social Assistance (100.0%), and Public Administration (100.0%).
| Industry | Male | Female |
| Agriculture, Fishing & Hunting | 13 (100.0%) | 0 (0.0%) |
| Mining, Quarrying, & Extraction | 0 (0.0%) | 0 (0.0%) |
| Construction | 21 (60.0%) | 14 (40.0%) |
| Manufacturing | 0 (0.0%) | 0 (0.0%) |
| Wholesale Trade | 0 (0.0%) | 0 (0.0%) |
| Retail Trade | 8 (17.8%) | 37 (82.2%) |
| Transportation & Warehousing | 0 (0.0%) | 30 (100.0%) |
| Utilities | 13 (100.0%) | 0 (0.0%) |
| Information | 0 (0.0%) | 0 (0.0%) |
| Finance & Insurance | 0 (0.0%) | 0 (0.0%) |
| Real Estate, Rental & Leasing | 0 (0.0%) | 0 (0.0%) |
| Professional & Scientific | 8 (100.0%) | 0 (0.0%) |
| Enterprise Management | 0 (0.0%) | 0 (0.0%) |
| Administrative & Support | 0 (0.0%) | 0 (0.0%) |
| Educational Services | 47 (61.0%) | 30 (39.0%) |
| Health Care & Social Assistance | 0 (0.0%) | 20 (100.0%) |
| Arts, Entertainment & Recreation | 8 (100.0%) | 0 (0.0%) |
| Accommodation & Food Services | 7 (17.9%) | 32 (82.1%) |
| Public Administration | 0 (0.0%) | 10 (100.0%) |
| Total | 125 (39.6%) | 191 (60.4%) |
Education in Laupahoehoe
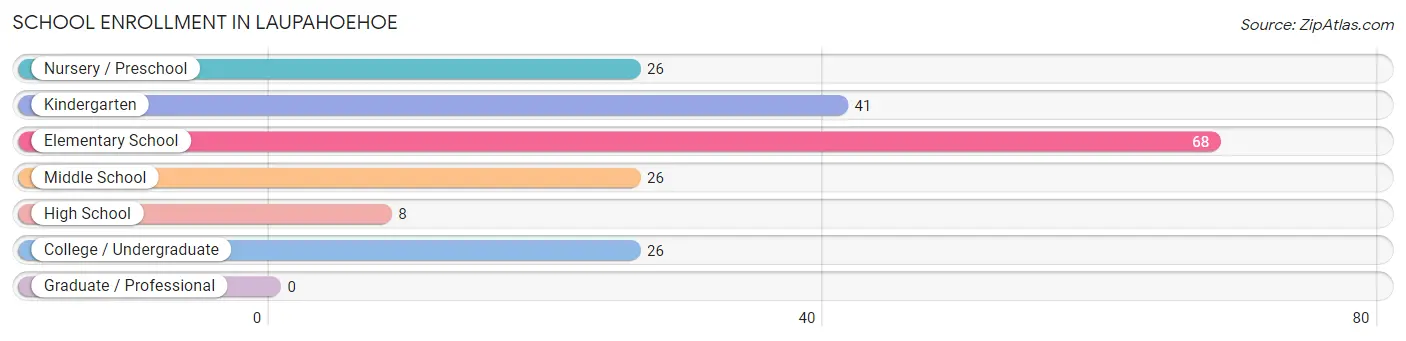
School Enrollment in Laupahoehoe
The most common levels of schooling among the 195 students in Laupahoehoe are elementary school (68 | 34.9%), kindergarten (41 | 21.0%), and nursery / preschool (26 | 13.3%).
| School Level | # Students | % Students |
| Nursery / Preschool | 26 | 13.3% |
| Kindergarten | 41 | 21.0% |
| Elementary School | 68 | 34.9% |
| Middle School | 26 | 13.3% |
| High School | 8 | 4.1% |
| College / Undergraduate | 26 | 13.3% |
| Graduate / Professional | 0 | 0.0% |
| Total | 195 | 100.0% |
School Enrollment by Age by Funding Source in Laupahoehoe
Out of a total of 195 students who are enrolled in schools in Laupahoehoe, 10 (5.1%) attend a private institution, while the remaining 185 (94.9%) are enrolled in public schools. The age group of 10 to 14 year olds has the highest likelihood of being enrolled in private schools, with 10 (27.8% in the age bracket) enrolled. Conversely, the age group of 3 to 4 year olds has the lowest likelihood of being enrolled in a private school, with 26 (100.0% in the age bracket) attending a public institution.
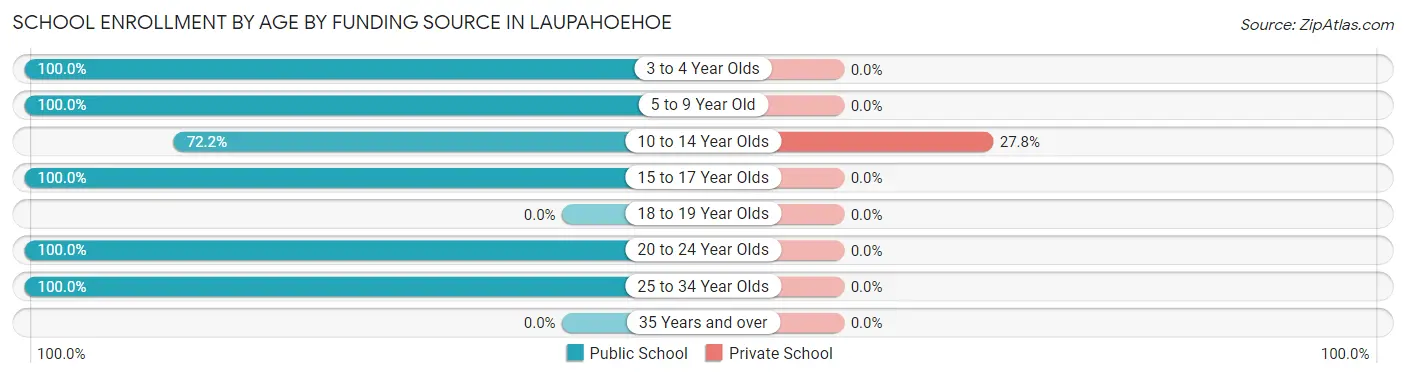
| Age Bracket | Public School | Private School |
| 3 to 4 Year Olds | 26 (100.0%) | 0 (0.0%) |
| 5 to 9 Year Old | 99 (100.0%) | 0 (0.0%) |
| 10 to 14 Year Olds | 26 (72.2%) | 10 (27.8%) |
| 15 to 17 Year Olds | 8 (100.0%) | 0 (0.0%) |
| 18 to 19 Year Olds | 0 (0.0%) | 0 (0.0%) |
| 20 to 24 Year Olds | 17 (100.0%) | 0 (0.0%) |
| 25 to 34 Year Olds | 9 (100.0%) | 0 (0.0%) |
| 35 Years and over | 0 (0.0%) | 0 (0.0%) |
| Total | 185 (94.9%) | 10 (5.1%) |
Educational Attainment by Field of Study in Laupahoehoe
Bio, nature & agricultural (50 | 19.6%), education (34 | 13.3%), engineering (32 | 12.6%), physical & health sciences (29 | 11.4%), and computers & mathematics (27 | 10.6%) are the most common fields of study among 255 individuals in Laupahoehoe who have obtained a bachelor's degree or higher.
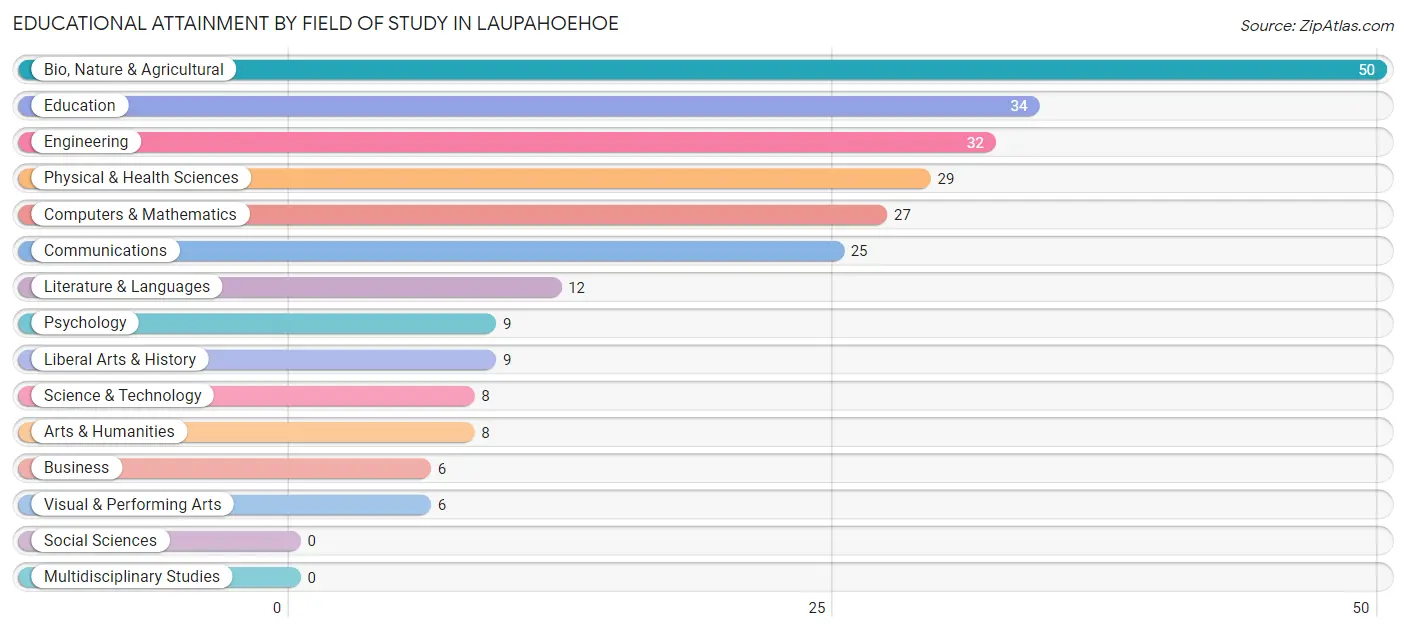
| Field of Study | # Graduates | % Graduates |
| Computers & Mathematics | 27 | 10.6% |
| Bio, Nature & Agricultural | 50 | 19.6% |
| Physical & Health Sciences | 29 | 11.4% |
| Psychology | 9 | 3.5% |
| Social Sciences | 0 | 0.0% |
| Engineering | 32 | 12.6% |
| Multidisciplinary Studies | 0 | 0.0% |
| Science & Technology | 8 | 3.1% |
| Business | 6 | 2.4% |
| Education | 34 | 13.3% |
| Literature & Languages | 12 | 4.7% |
| Liberal Arts & History | 9 | 3.5% |
| Visual & Performing Arts | 6 | 2.4% |
| Communications | 25 | 9.8% |
| Arts & Humanities | 8 | 3.1% |
| Total | 255 | 100.0% |
Transportation & Commute in Laupahoehoe
Vehicle Availability by Sex in Laupahoehoe
The most prevalent vehicle ownership categories in Laupahoehoe are males with 3 vehicles (50, accounting for 42.0%) and females with 3 vehicles (36, making up 26.2%).
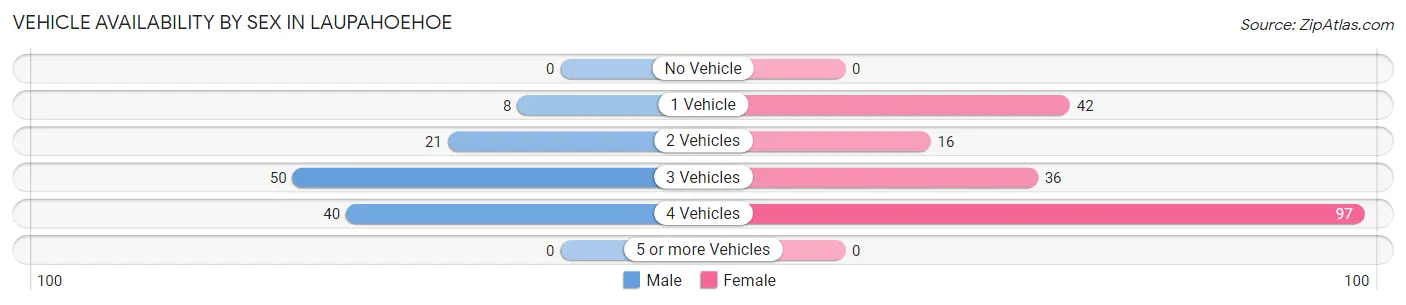
| Vehicles Available | Male | Female |
| No Vehicle | 0 (0.0%) | 0 (0.0%) |
| 1 Vehicle | 8 (6.7%) | 42 (22.0%) |
| 2 Vehicles | 21 (17.6%) | 16 (8.4%) |
| 3 Vehicles | 50 (42.0%) | 36 (18.9%) |
| 4 Vehicles | 40 (33.6%) | 97 (50.8%) |
| 5 or more Vehicles | 0 (0.0%) | 0 (0.0%) |
| Total | 119 (100.0%) | 191 (100.0%) |
Commute Time in Laupahoehoe
The most frequently occuring commute durations in Laupahoehoe are 45 to 59 minutes (97 commuters, 36.6%), 30 to 34 minutes (30 commuters, 11.3%), and 5 to 9 minutes (29 commuters, 10.9%).
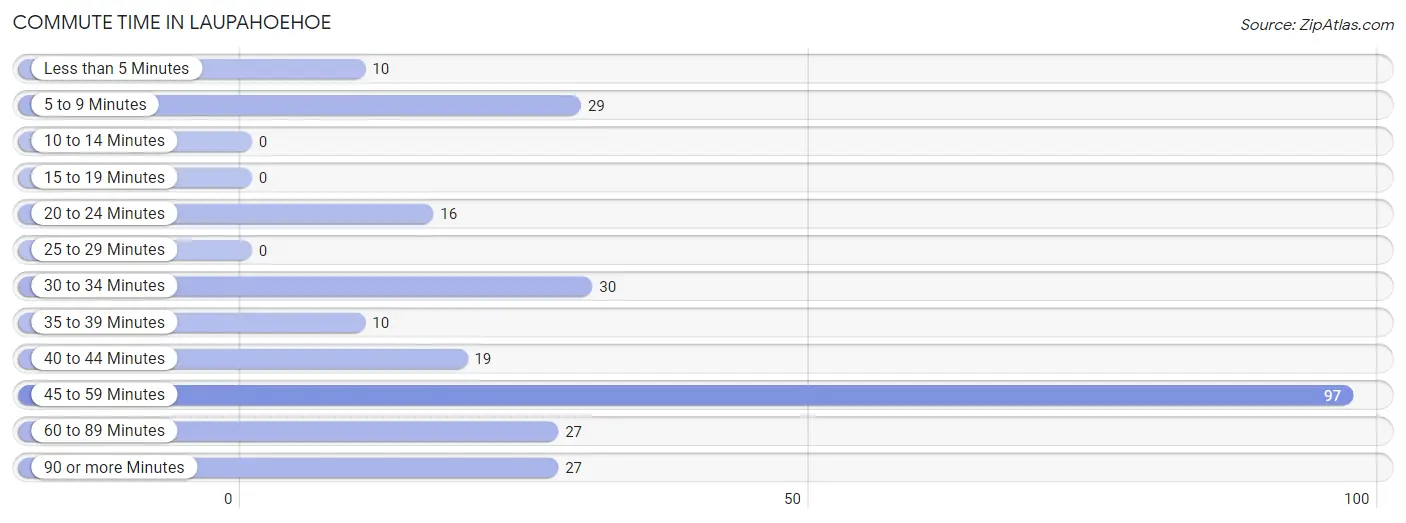
| Commute Time | # Commuters | % Commuters |
| Less than 5 Minutes | 10 | 3.8% |
| 5 to 9 Minutes | 29 | 10.9% |
| 10 to 14 Minutes | 0 | 0.0% |
| 15 to 19 Minutes | 0 | 0.0% |
| 20 to 24 Minutes | 16 | 6.0% |
| 25 to 29 Minutes | 0 | 0.0% |
| 30 to 34 Minutes | 30 | 11.3% |
| 35 to 39 Minutes | 10 | 3.8% |
| 40 to 44 Minutes | 19 | 7.2% |
| 45 to 59 Minutes | 97 | 36.6% |
| 60 to 89 Minutes | 27 | 10.2% |
| 90 or more Minutes | 27 | 10.2% |
Commute Time by Sex in Laupahoehoe
The most common commute times in Laupahoehoe are 45 to 59 minutes (65 commuters, 67.7%) for males and 45 to 59 minutes (32 commuters, 18.9%) for females.
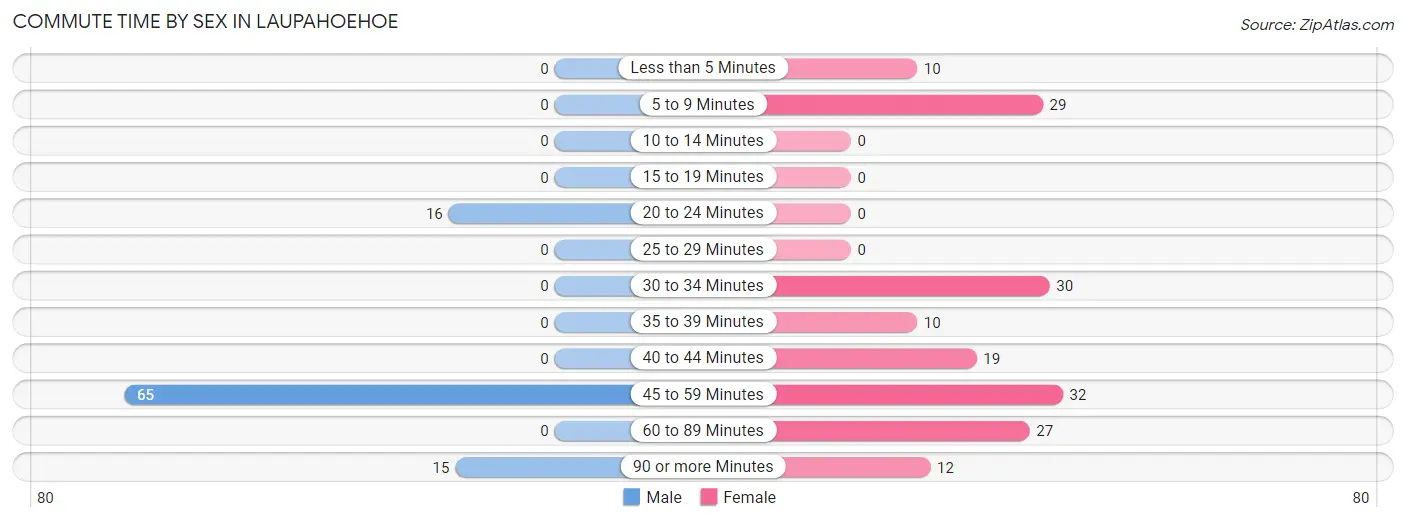
| Commute Time | Male | Female |
| Less than 5 Minutes | 0 (0.0%) | 10 (5.9%) |
| 5 to 9 Minutes | 0 (0.0%) | 29 (17.2%) |
| 10 to 14 Minutes | 0 (0.0%) | 0 (0.0%) |
| 15 to 19 Minutes | 0 (0.0%) | 0 (0.0%) |
| 20 to 24 Minutes | 16 (16.7%) | 0 (0.0%) |
| 25 to 29 Minutes | 0 (0.0%) | 0 (0.0%) |
| 30 to 34 Minutes | 0 (0.0%) | 30 (17.7%) |
| 35 to 39 Minutes | 0 (0.0%) | 10 (5.9%) |
| 40 to 44 Minutes | 0 (0.0%) | 19 (11.2%) |
| 45 to 59 Minutes | 65 (67.7%) | 32 (18.9%) |
| 60 to 89 Minutes | 0 (0.0%) | 27 (16.0%) |
| 90 or more Minutes | 15 (15.6%) | 12 (7.1%) |
Time of Departure to Work by Sex in Laupahoehoe
The most frequent times of departure to work in Laupahoehoe are 6:30 AM to 6:59 AM (58, 60.4%) for males and 7:00 AM to 7:29 AM (57, 33.7%) for females.
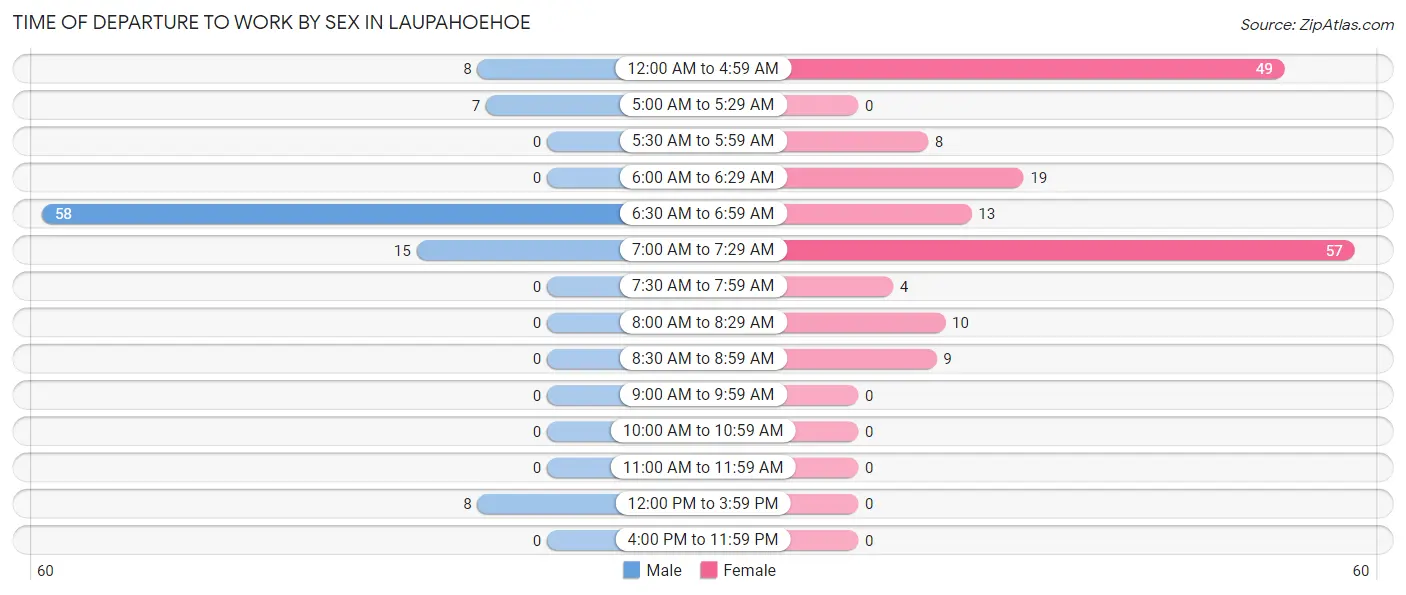
| Time of Departure | Male | Female |
| 12:00 AM to 4:59 AM | 8 (8.3%) | 49 (29.0%) |
| 5:00 AM to 5:29 AM | 7 (7.3%) | 0 (0.0%) |
| 5:30 AM to 5:59 AM | 0 (0.0%) | 8 (4.7%) |
| 6:00 AM to 6:29 AM | 0 (0.0%) | 19 (11.2%) |
| 6:30 AM to 6:59 AM | 58 (60.4%) | 13 (7.7%) |
| 7:00 AM to 7:29 AM | 15 (15.6%) | 57 (33.7%) |
| 7:30 AM to 7:59 AM | 0 (0.0%) | 4 (2.4%) |
| 8:00 AM to 8:29 AM | 0 (0.0%) | 10 (5.9%) |
| 8:30 AM to 8:59 AM | 0 (0.0%) | 9 (5.3%) |
| 9:00 AM to 9:59 AM | 0 (0.0%) | 0 (0.0%) |
| 10:00 AM to 10:59 AM | 0 (0.0%) | 0 (0.0%) |
| 11:00 AM to 11:59 AM | 0 (0.0%) | 0 (0.0%) |
| 12:00 PM to 3:59 PM | 8 (8.3%) | 0 (0.0%) |
| 4:00 PM to 11:59 PM | 0 (0.0%) | 0 (0.0%) |
| Total | 96 (100.0%) | 169 (100.0%) |
Housing Occupancy in Laupahoehoe
Occupancy by Ownership in Laupahoehoe
Of the total 411 dwellings in Laupahoehoe, owner-occupied units account for 302 (73.5%), while renter-occupied units make up 109 (26.5%).
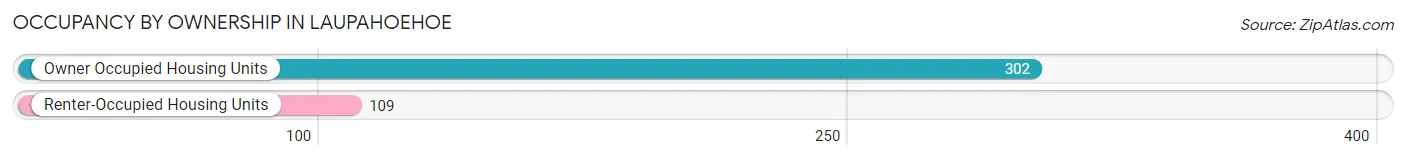
| Occupancy | # Housing Units | % Housing Units |
| Owner Occupied Housing Units | 302 | 73.5% |
| Renter-Occupied Housing Units | 109 | 26.5% |
| Total Occupied Housing Units | 411 | 100.0% |
Occupancy by Household Size in Laupahoehoe
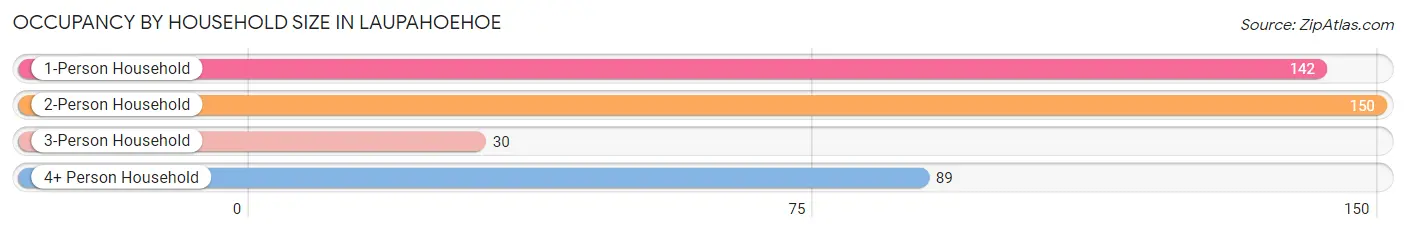
| Household Size | # Housing Units | % Housing Units |
| 1-Person Household | 142 | 34.5% |
| 2-Person Household | 150 | 36.5% |
| 3-Person Household | 30 | 7.3% |
| 4+ Person Household | 89 | 21.6% |
| Total Housing Units | 411 | 100.0% |
Occupancy by Ownership by Household Size in Laupahoehoe
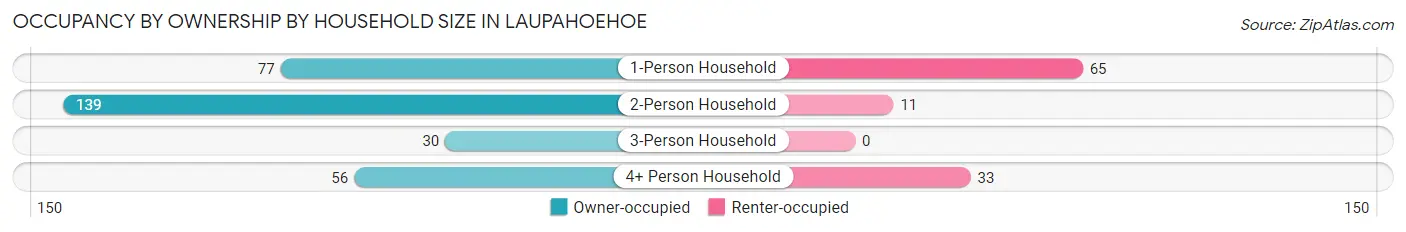
| Household Size | Owner-occupied | Renter-occupied |
| 1-Person Household | 77 (54.2%) | 65 (45.8%) |
| 2-Person Household | 139 (92.7%) | 11 (7.3%) |
| 3-Person Household | 30 (100.0%) | 0 (0.0%) |
| 4+ Person Household | 56 (62.9%) | 33 (37.1%) |
| Total Housing Units | 302 (73.5%) | 109 (26.5%) |
Occupancy by Educational Attainment in Laupahoehoe
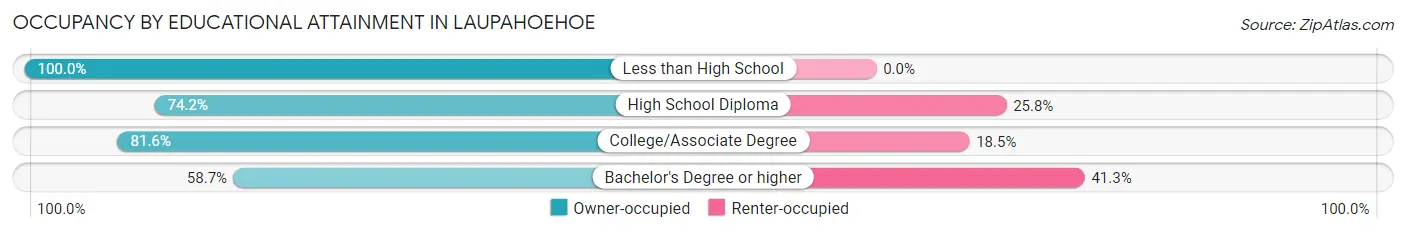
| Household Size | Owner-occupied | Renter-occupied |
| Less than High School | 42 (100.0%) | 0 (0.0%) |
| High School Diploma | 95 (74.2%) | 33 (25.8%) |
| College/Associate Degree | 84 (81.6%) | 19 (18.4%) |
| Bachelor's Degree or higher | 81 (58.7%) | 57 (41.3%) |
Occupancy by Age of Householder in Laupahoehoe
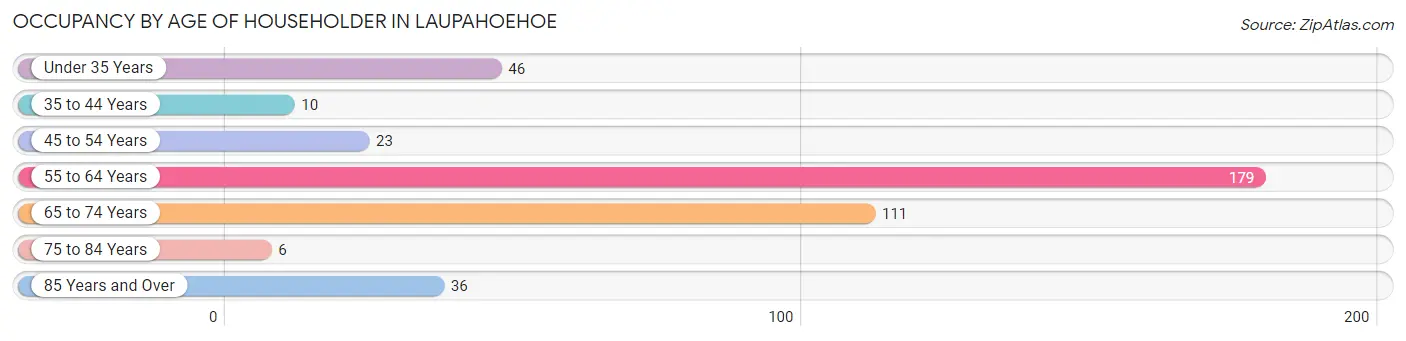
| Age Bracket | # Households | % Households |
| Under 35 Years | 46 | 11.2% |
| 35 to 44 Years | 10 | 2.4% |
| 45 to 54 Years | 23 | 5.6% |
| 55 to 64 Years | 179 | 43.5% |
| 65 to 74 Years | 111 | 27.0% |
| 75 to 84 Years | 6 | 1.5% |
| 85 Years and Over | 36 | 8.8% |
| Total | 411 | 100.0% |
Housing Finances in Laupahoehoe
Median Income by Occupancy in Laupahoehoe
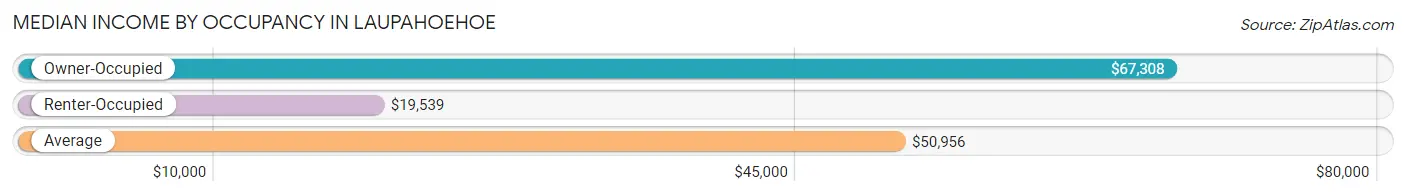
| Occupancy Type | # Households | Median Income |
| Owner-Occupied | 302 (73.5%) | $67,308 |
| Renter-Occupied | 109 (26.5%) | $19,539 |
| Average | 411 (100.0%) | $50,956 |
Occupancy by Householder Income Bracket in Laupahoehoe
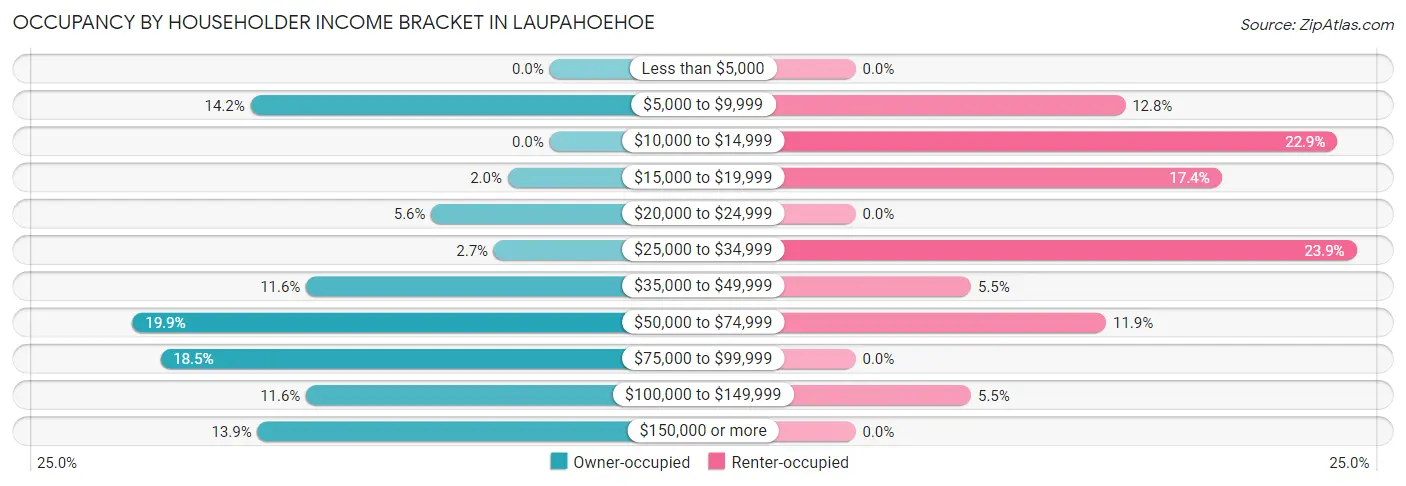
| Income Bracket | Owner-occupied | Renter-occupied |
| Less than $5,000 | 0 (0.0%) | 0 (0.0%) |
| $5,000 to $9,999 | 43 (14.2%) | 14 (12.8%) |
| $10,000 to $14,999 | 0 (0.0%) | 25 (22.9%) |
| $15,000 to $19,999 | 6 (2.0%) | 19 (17.4%) |
| $20,000 to $24,999 | 17 (5.6%) | 0 (0.0%) |
| $25,000 to $34,999 | 8 (2.6%) | 26 (23.8%) |
| $35,000 to $49,999 | 35 (11.6%) | 6 (5.5%) |
| $50,000 to $74,999 | 60 (19.9%) | 13 (11.9%) |
| $75,000 to $99,999 | 56 (18.5%) | 0 (0.0%) |
| $100,000 to $149,999 | 35 (11.6%) | 6 (5.5%) |
| $150,000 or more | 42 (13.9%) | 0 (0.0%) |
| Total | 302 (100.0%) | 109 (100.0%) |
Monthly Housing Cost Tiers in Laupahoehoe
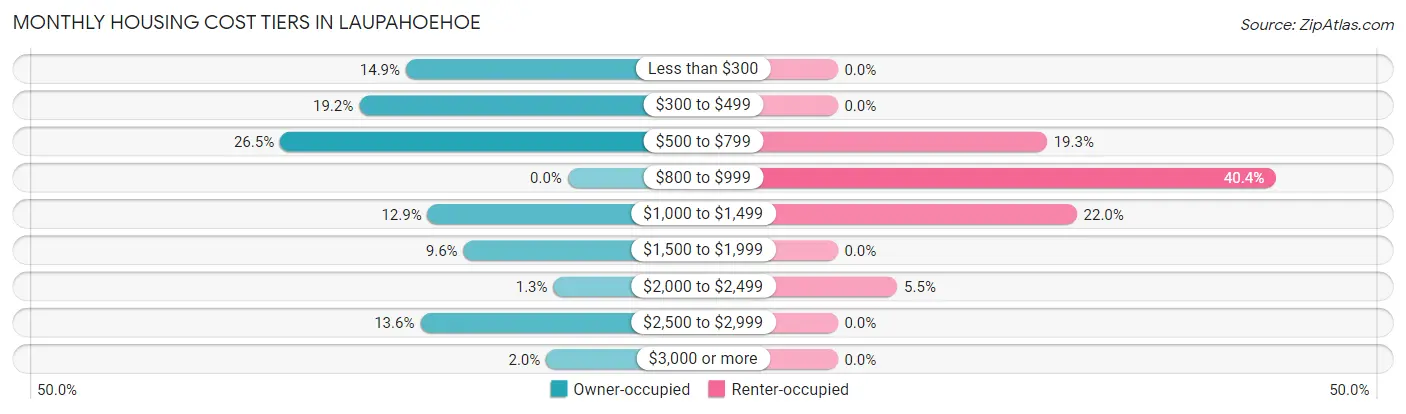
| Monthly Cost | Owner-occupied | Renter-occupied |
| Less than $300 | 45 (14.9%) | 0 (0.0%) |
| $300 to $499 | 58 (19.2%) | 0 (0.0%) |
| $500 to $799 | 80 (26.5%) | 21 (19.3%) |
| $800 to $999 | 0 (0.0%) | 44 (40.4%) |
| $1,000 to $1,499 | 39 (12.9%) | 24 (22.0%) |
| $1,500 to $1,999 | 29 (9.6%) | 0 (0.0%) |
| $2,000 to $2,499 | 4 (1.3%) | 6 (5.5%) |
| $2,500 to $2,999 | 41 (13.6%) | 0 (0.0%) |
| $3,000 or more | 6 (2.0%) | 0 (0.0%) |
| Total | 302 (100.0%) | 109 (100.0%) |
Physical Housing Characteristics in Laupahoehoe
Housing Structures in Laupahoehoe
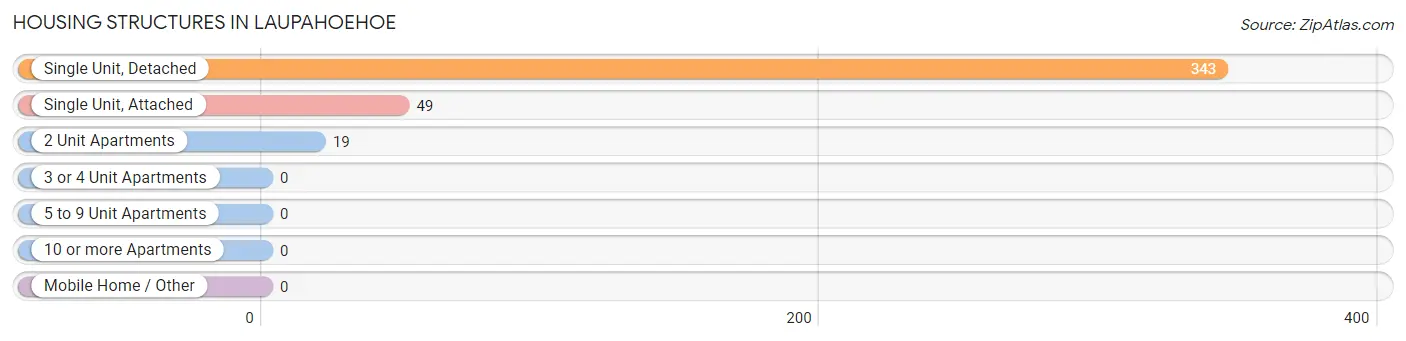
| Structure Type | # Housing Units | % Housing Units |
| Single Unit, Detached | 343 | 83.5% |
| Single Unit, Attached | 49 | 11.9% |
| 2 Unit Apartments | 19 | 4.6% |
| 3 or 4 Unit Apartments | 0 | 0.0% |
| 5 to 9 Unit Apartments | 0 | 0.0% |
| 10 or more Apartments | 0 | 0.0% |
| Mobile Home / Other | 0 | 0.0% |
| Total | 411 | 100.0% |
Housing Structures by Occupancy in Laupahoehoe
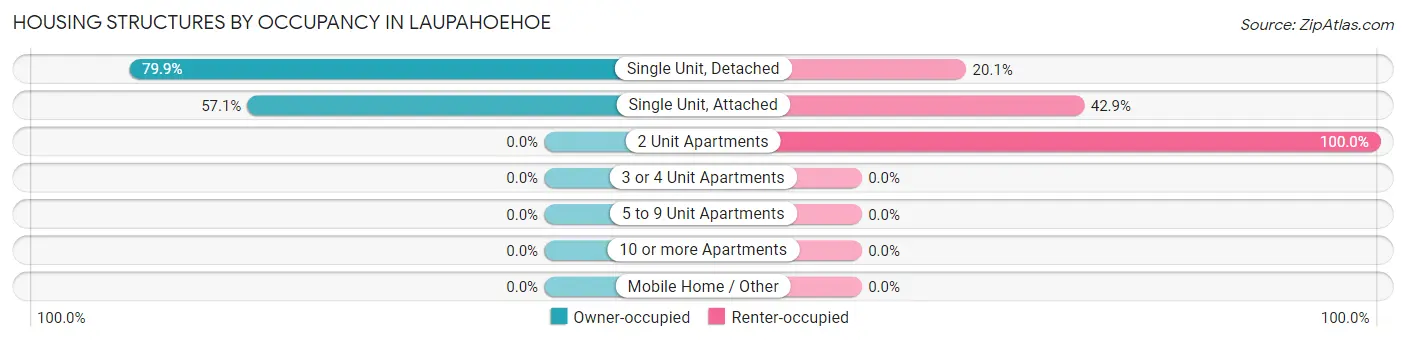
| Structure Type | Owner-occupied | Renter-occupied |
| Single Unit, Detached | 274 (79.9%) | 69 (20.1%) |
| Single Unit, Attached | 28 (57.1%) | 21 (42.9%) |
| 2 Unit Apartments | 0 (0.0%) | 19 (100.0%) |
| 3 or 4 Unit Apartments | 0 (0.0%) | 0 (0.0%) |
| 5 to 9 Unit Apartments | 0 (0.0%) | 0 (0.0%) |
| 10 or more Apartments | 0 (0.0%) | 0 (0.0%) |
| Mobile Home / Other | 0 (0.0%) | 0 (0.0%) |
| Total | 302 (73.5%) | 109 (26.5%) |
Housing Structures by Number of Rooms in Laupahoehoe
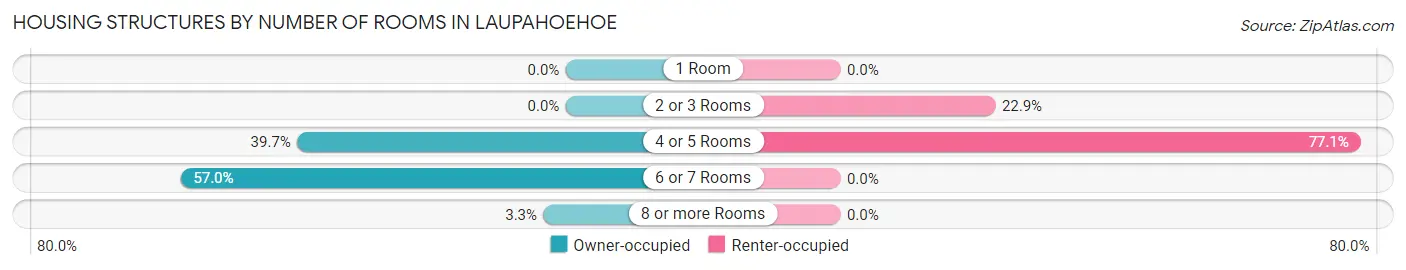
| Number of Rooms | Owner-occupied | Renter-occupied |
| 1 Room | 0 (0.0%) | 0 (0.0%) |
| 2 or 3 Rooms | 0 (0.0%) | 25 (22.9%) |
| 4 or 5 Rooms | 120 (39.7%) | 84 (77.1%) |
| 6 or 7 Rooms | 172 (57.0%) | 0 (0.0%) |
| 8 or more Rooms | 10 (3.3%) | 0 (0.0%) |
| Total | 302 (100.0%) | 109 (100.0%) |
Housing Structure by Heating Type in Laupahoehoe
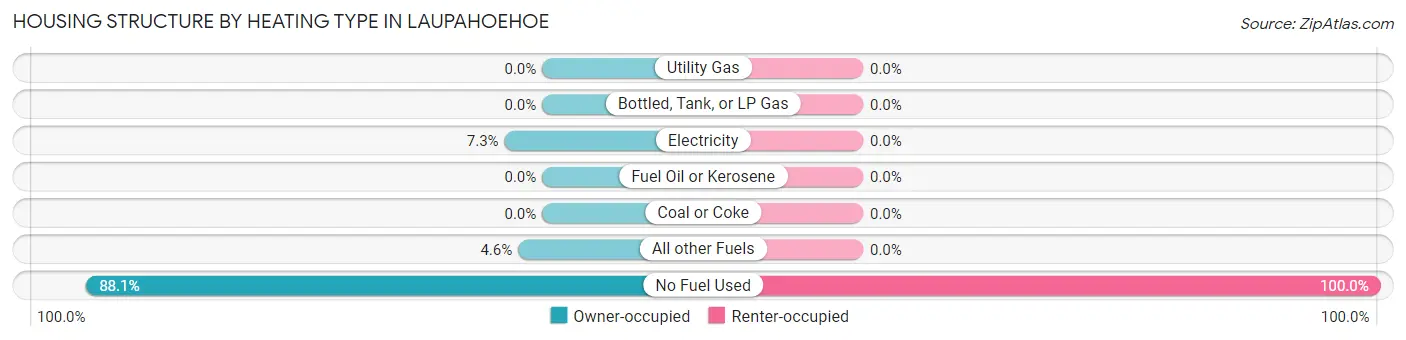
| Heating Type | Owner-occupied | Renter-occupied |
| Utility Gas | 0 (0.0%) | 0 (0.0%) |
| Bottled, Tank, or LP Gas | 0 (0.0%) | 0 (0.0%) |
| Electricity | 22 (7.3%) | 0 (0.0%) |
| Fuel Oil or Kerosene | 0 (0.0%) | 0 (0.0%) |
| Coal or Coke | 0 (0.0%) | 0 (0.0%) |
| All other Fuels | 14 (4.6%) | 0 (0.0%) |
| No Fuel Used | 266 (88.1%) | 109 (100.0%) |
| Total | 302 (100.0%) | 109 (100.0%) |
Household Vehicle Usage in Laupahoehoe
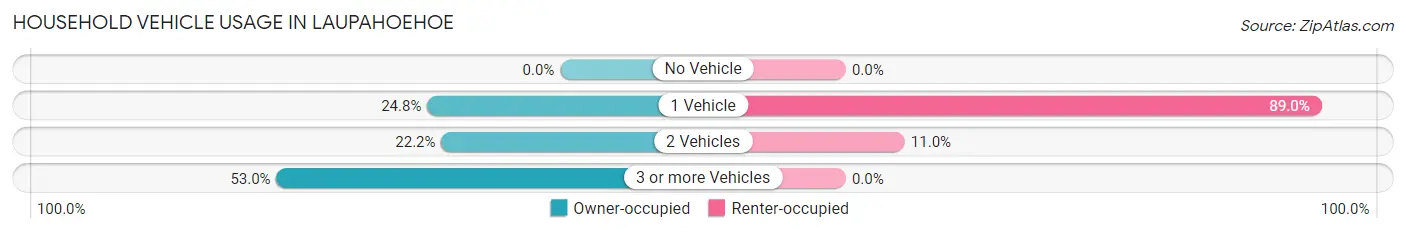
| Vehicles per Household | Owner-occupied | Renter-occupied |
| No Vehicle | 0 (0.0%) | 0 (0.0%) |
| 1 Vehicle | 75 (24.8%) | 97 (89.0%) |
| 2 Vehicles | 67 (22.2%) | 12 (11.0%) |
| 3 or more Vehicles | 160 (53.0%) | 0 (0.0%) |
| Total | 302 (100.0%) | 109 (100.0%) |
Real Estate & Mortgages in Laupahoehoe
Real Estate and Mortgage Overview in Laupahoehoe
| Characteristic | Without Mortgage | With Mortgage |
| Housing Units | 140 | 162 |
| Median Property Value | $507,900 | $455,300 |
| Median Household Income | $80,500 | $21 |
| Monthly Housing Costs | $403 | $6 |
| Real Estate Taxes | $677 | $0 |
Property Value by Mortgage Status in Laupahoehoe
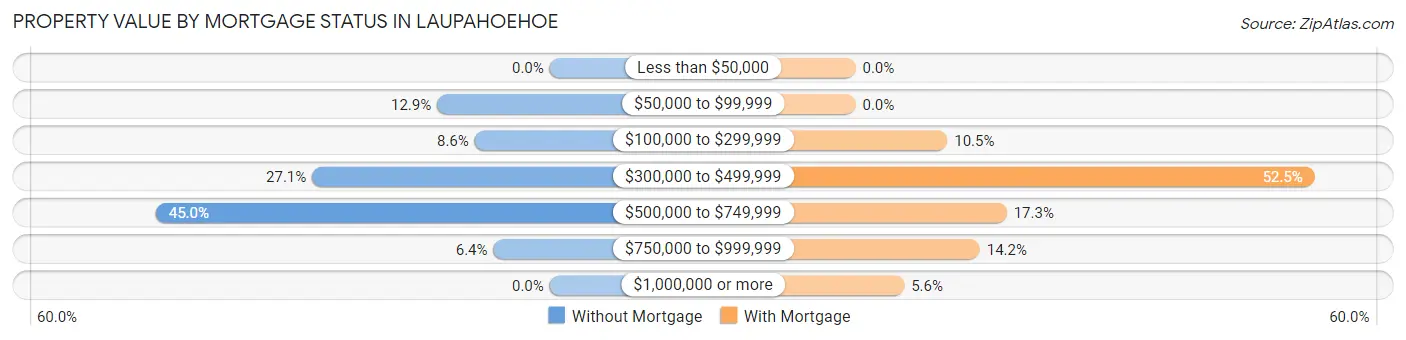
| Property Value | Without Mortgage | With Mortgage |
| Less than $50,000 | 0 (0.0%) | 0 (0.0%) |
| $50,000 to $99,999 | 18 (12.9%) | 0 (0.0%) |
| $100,000 to $299,999 | 12 (8.6%) | 17 (10.5%) |
| $300,000 to $499,999 | 38 (27.1%) | 85 (52.5%) |
| $500,000 to $749,999 | 63 (45.0%) | 28 (17.3%) |
| $750,000 to $999,999 | 9 (6.4%) | 23 (14.2%) |
| $1,000,000 or more | 0 (0.0%) | 9 (5.6%) |
| Total | 140 (100.0%) | 162 (100.0%) |
Household Income by Mortgage Status in Laupahoehoe
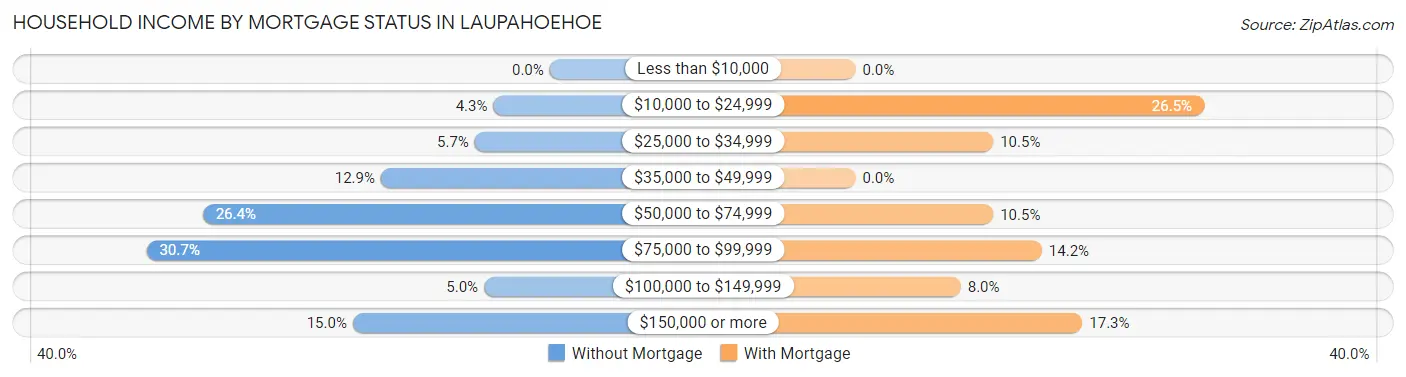
| Household Income | Without Mortgage | With Mortgage |
| Less than $10,000 | 0 (0.0%) | 0 (0.0%) |
| $10,000 to $24,999 | 6 (4.3%) | 43 (26.5%) |
| $25,000 to $34,999 | 8 (5.7%) | 17 (10.5%) |
| $35,000 to $49,999 | 18 (12.9%) | 0 (0.0%) |
| $50,000 to $74,999 | 37 (26.4%) | 17 (10.5%) |
| $75,000 to $99,999 | 43 (30.7%) | 23 (14.2%) |
| $100,000 to $149,999 | 7 (5.0%) | 13 (8.0%) |
| $150,000 or more | 21 (15.0%) | 28 (17.3%) |
| Total | 140 (100.0%) | 162 (100.0%) |
Property Value to Household Income Ratio in Laupahoehoe
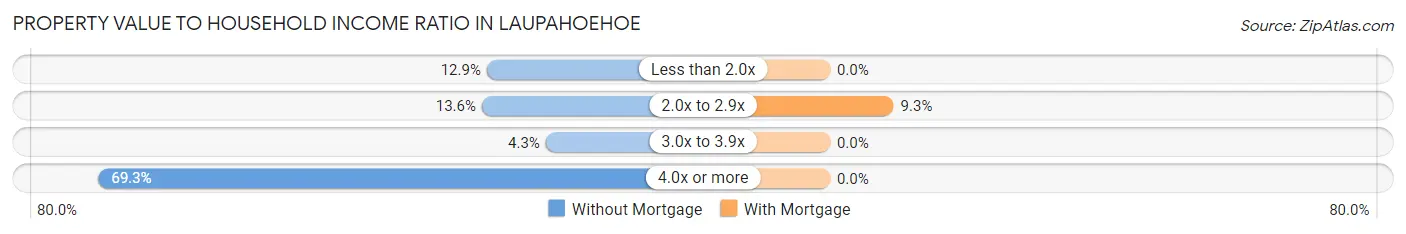
| Value-to-Income Ratio | Without Mortgage | With Mortgage |
| Less than 2.0x | 18 (12.9%) | 0 (0.0%) |
| 2.0x to 2.9x | 19 (13.6%) | 15 (9.3%) |
| 3.0x to 3.9x | 6 (4.3%) | 0 (0.0%) |
| 4.0x or more | 97 (69.3%) | 0 (0.0%) |
| Total | 140 (100.0%) | 162 (100.0%) |
Real Estate Taxes by Mortgage Status in Laupahoehoe
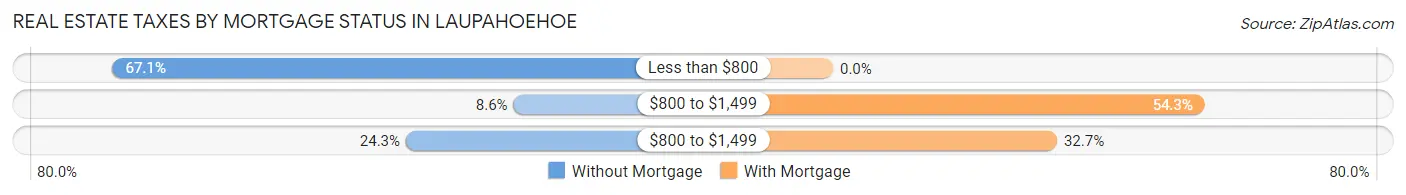
| Property Taxes | Without Mortgage | With Mortgage |
| Less than $800 | 94 (67.1%) | 0 (0.0%) |
| $800 to $1,499 | 12 (8.6%) | 88 (54.3%) |
| $800 to $1,499 | 34 (24.3%) | 53 (32.7%) |
| Total | 140 (100.0%) | 162 (100.0%) |
Health & Disability in Laupahoehoe
Health Insurance Coverage by Age in Laupahoehoe
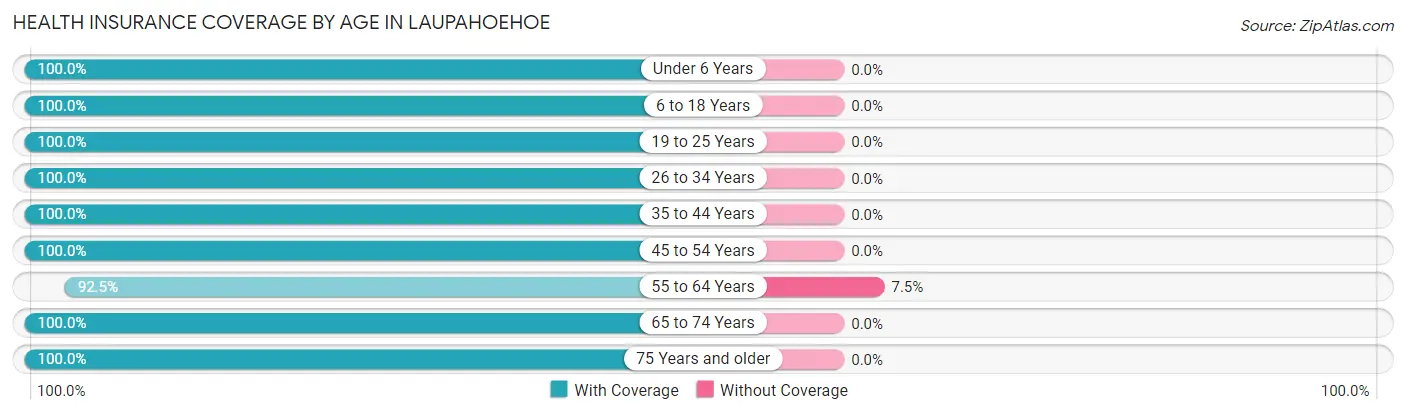
| Age Bracket | With Coverage | Without Coverage |
| Under 6 Years | 69 (100.0%) | 0 (0.0%) |
| 6 to 18 Years | 113 (100.0%) | 0 (0.0%) |
| 19 to 25 Years | 36 (100.0%) | 0 (0.0%) |
| 26 to 34 Years | 111 (100.0%) | 0 (0.0%) |
| 35 to 44 Years | 98 (100.0%) | 0 (0.0%) |
| 45 to 54 Years | 29 (100.0%) | 0 (0.0%) |
| 55 to 64 Years | 234 (92.5%) | 19 (7.5%) |
| 65 to 74 Years | 180 (100.0%) | 0 (0.0%) |
| 75 Years and older | 65 (100.0%) | 0 (0.0%) |
| Total | 935 (98.0%) | 19 (2.0%) |
Health Insurance Coverage by Citizenship Status in Laupahoehoe
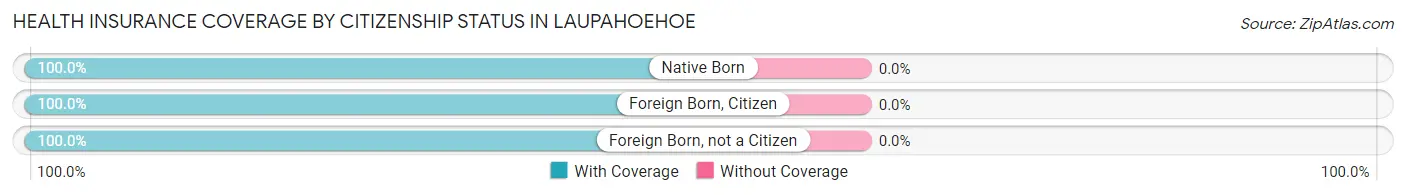
| Citizenship Status | With Coverage | Without Coverage |
| Native Born | 69 (100.0%) | 0 (0.0%) |
| Foreign Born, Citizen | 113 (100.0%) | 0 (0.0%) |
| Foreign Born, not a Citizen | 36 (100.0%) | 0 (0.0%) |
Health Insurance Coverage by Household Income in Laupahoehoe
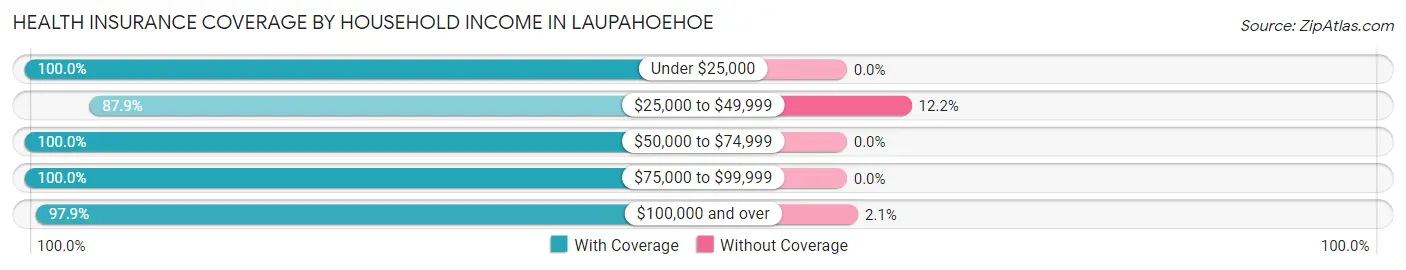
| Household Income | With Coverage | Without Coverage |
| Under $25,000 | 224 (100.0%) | 0 (0.0%) |
| $25,000 to $49,999 | 94 (87.8%) | 13 (12.1%) |
| $50,000 to $74,999 | 153 (100.0%) | 0 (0.0%) |
| $75,000 to $99,999 | 187 (100.0%) | 0 (0.0%) |
| $100,000 and over | 277 (97.9%) | 6 (2.1%) |
Public vs Private Health Insurance Coverage by Age in Laupahoehoe
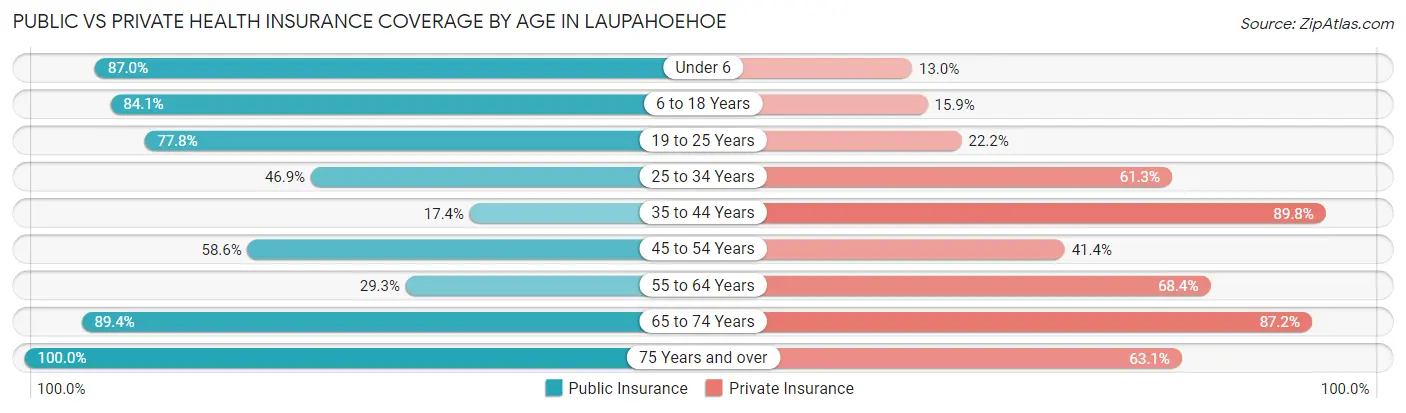
| Age Bracket | Public Insurance | Private Insurance |
| Under 6 | 60 (87.0%) | 9 (13.0%) |
| 6 to 18 Years | 95 (84.1%) | 18 (15.9%) |
| 19 to 25 Years | 28 (77.8%) | 8 (22.2%) |
| 25 to 34 Years | 52 (46.9%) | 68 (61.3%) |
| 35 to 44 Years | 17 (17.3%) | 88 (89.8%) |
| 45 to 54 Years | 17 (58.6%) | 12 (41.4%) |
| 55 to 64 Years | 74 (29.2%) | 173 (68.4%) |
| 65 to 74 Years | 161 (89.4%) | 157 (87.2%) |
| 75 Years and over | 65 (100.0%) | 41 (63.1%) |
| Total | 569 (59.6%) | 574 (60.2%) |
Disability Status by Sex by Age in Laupahoehoe
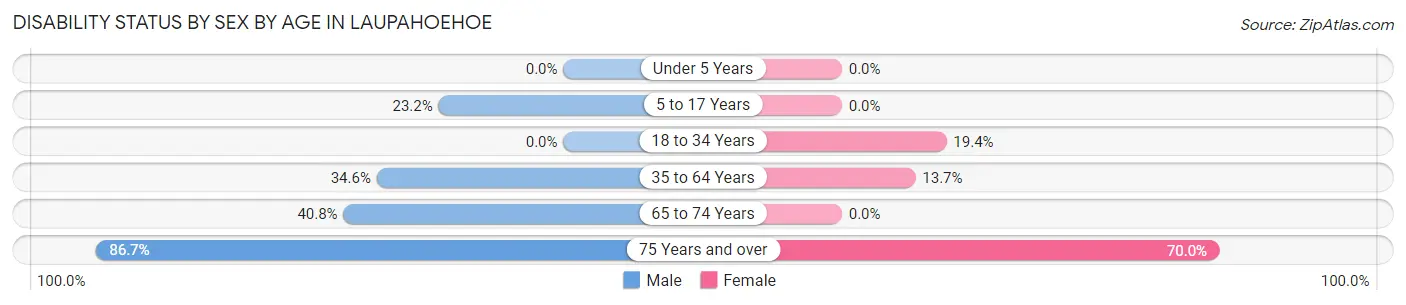
| Age Bracket | Male | Female |
| Under 5 Years | 0 (0.0%) | 0 (0.0%) |
| 5 to 17 Years | 22 (23.2%) | 0 (0.0%) |
| 18 to 34 Years | 0 (0.0%) | 20 (19.4%) |
| 35 to 64 Years | 53 (34.6%) | 31 (13.7%) |
| 65 to 74 Years | 40 (40.8%) | 0 (0.0%) |
| 75 Years and over | 39 (86.7%) | 14 (70.0%) |
Disability Class by Sex by Age in Laupahoehoe
Disability Class: Hearing Difficulty
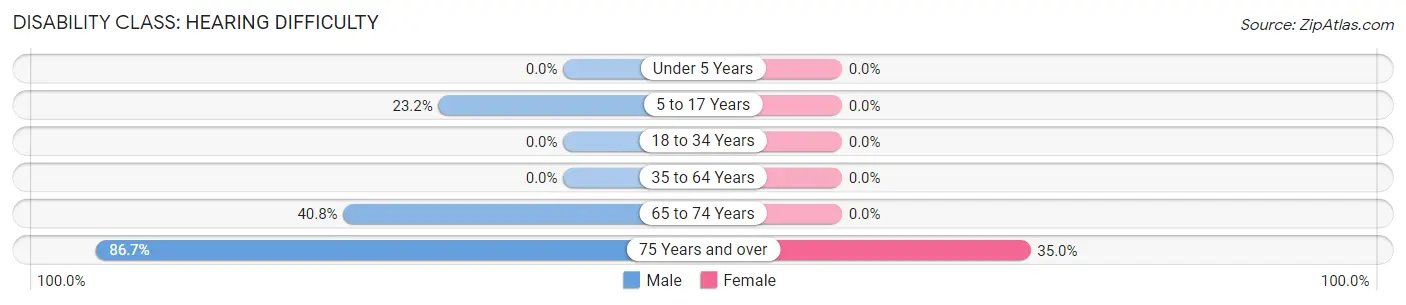
| Age Bracket | Male | Female |
| Under 5 Years | 0 (0.0%) | 0 (0.0%) |
| 5 to 17 Years | 22 (23.2%) | 0 (0.0%) |
| 18 to 34 Years | 0 (0.0%) | 0 (0.0%) |
| 35 to 64 Years | 0 (0.0%) | 0 (0.0%) |
| 65 to 74 Years | 40 (40.8%) | 0 (0.0%) |
| 75 Years and over | 39 (86.7%) | 7 (35.0%) |
Disability Class: Vision Difficulty
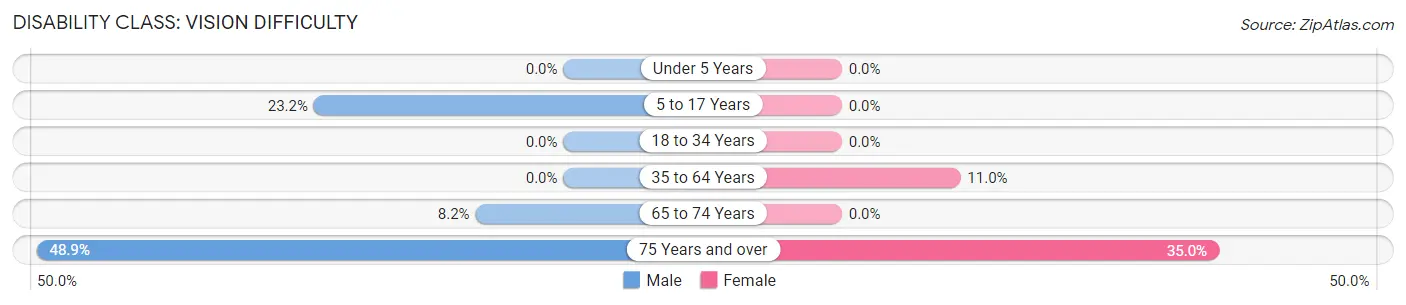
| Age Bracket | Male | Female |
| Under 5 Years | 0 (0.0%) | 0 (0.0%) |
| 5 to 17 Years | 22 (23.2%) | 0 (0.0%) |
| 18 to 34 Years | 0 (0.0%) | 0 (0.0%) |
| 35 to 64 Years | 0 (0.0%) | 25 (11.0%) |
| 65 to 74 Years | 8 (8.2%) | 0 (0.0%) |
| 75 Years and over | 22 (48.9%) | 7 (35.0%) |
Disability Class: Cognitive Difficulty
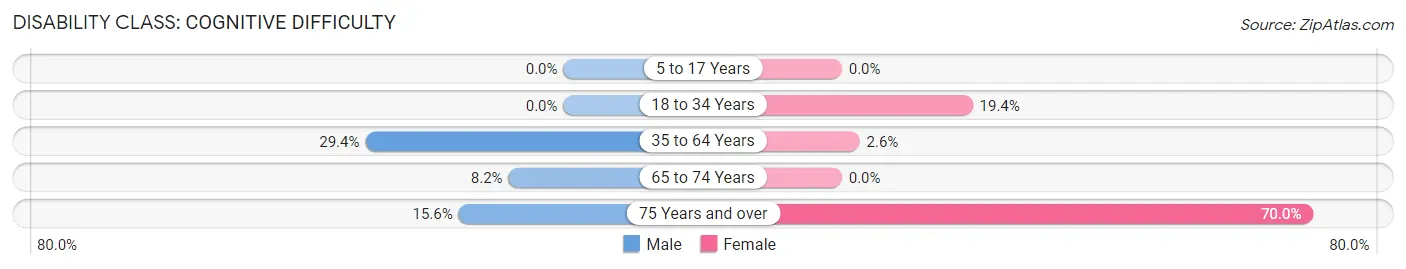
| Age Bracket | Male | Female |
| 5 to 17 Years | 0 (0.0%) | 0 (0.0%) |
| 18 to 34 Years | 0 (0.0%) | 20 (19.4%) |
| 35 to 64 Years | 45 (29.4%) | 6 (2.6%) |
| 65 to 74 Years | 8 (8.2%) | 0 (0.0%) |
| 75 Years and over | 7 (15.6%) | 14 (70.0%) |
Disability Class: Ambulatory Difficulty
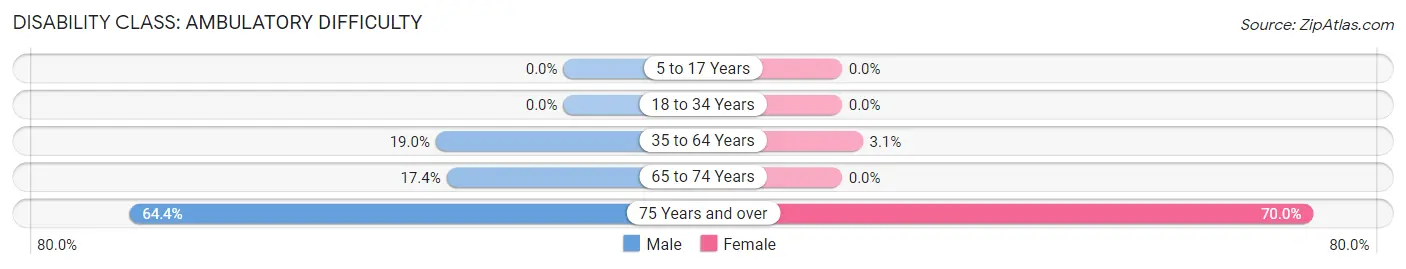
| Age Bracket | Male | Female |
| 5 to 17 Years | 0 (0.0%) | 0 (0.0%) |
| 18 to 34 Years | 0 (0.0%) | 0 (0.0%) |
| 35 to 64 Years | 29 (19.0%) | 7 (3.1%) |
| 65 to 74 Years | 17 (17.3%) | 0 (0.0%) |
| 75 Years and over | 29 (64.4%) | 14 (70.0%) |
Disability Class: Self-Care Difficulty
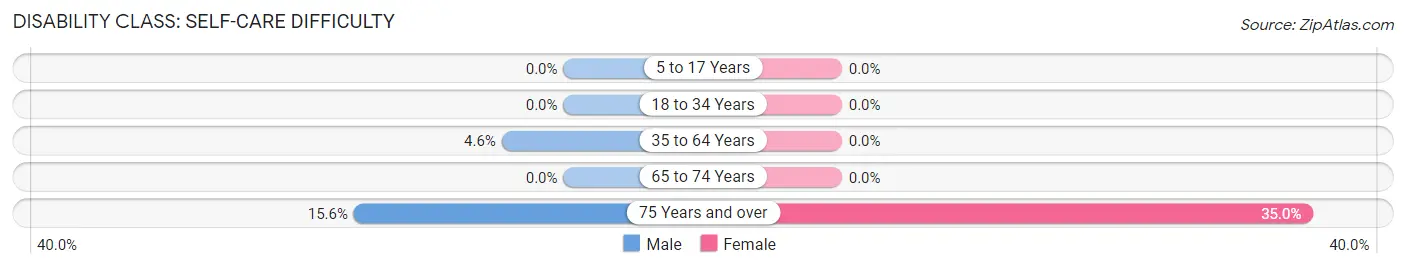
| Age Bracket | Male | Female |
| 5 to 17 Years | 0 (0.0%) | 0 (0.0%) |
| 18 to 34 Years | 0 (0.0%) | 0 (0.0%) |
| 35 to 64 Years | 7 (4.6%) | 0 (0.0%) |
| 65 to 74 Years | 0 (0.0%) | 0 (0.0%) |
| 75 Years and over | 7 (15.6%) | 7 (35.0%) |
Technology Access in Laupahoehoe
Computing Device Access in Laupahoehoe
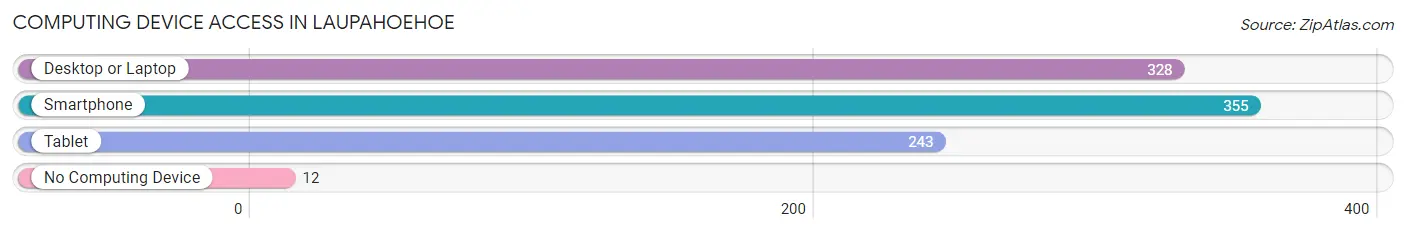
| Device Type | # Households | % Households |
| Desktop or Laptop | 328 | 79.8% |
| Smartphone | 355 | 86.4% |
| Tablet | 243 | 59.1% |
| No Computing Device | 12 | 2.9% |
| Total | 411 | 100.0% |
Internet Access in Laupahoehoe
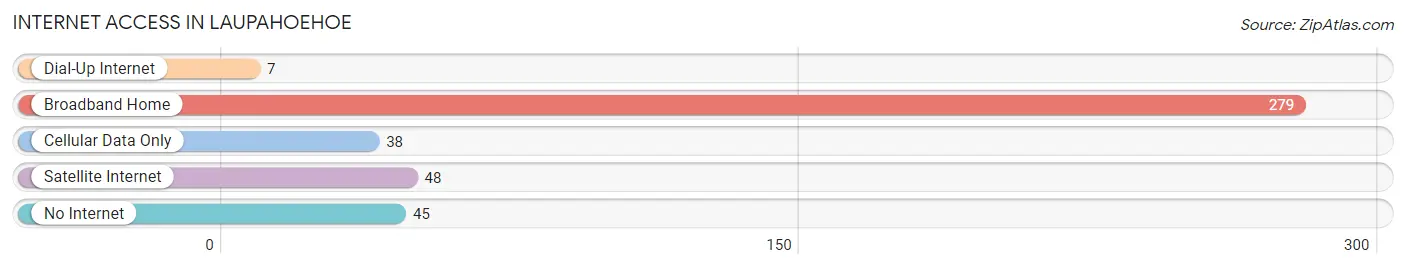
| Internet Type | # Households | % Households |
| Dial-Up Internet | 7 | 1.7% |
| Broadband Home | 279 | 67.9% |
| Cellular Data Only | 38 | 9.2% |
| Satellite Internet | 48 | 11.7% |
| No Internet | 45 | 11.0% |
| Total | 411 | 100.0% |
Laupahoehoe Summary
Laupahoehoe is a small unincorporated community located on the Hamakua Coast of the Big Island of Hawaii. It is located about 25 miles north of Hilo and is part of the North Hilo District. The population of Laupahoehoe was 1,093 as of the 2010 census.
History
Laupahoehoe was originally settled by Native Hawaiians in the late 1700s. The area was known for its abundance of fish and other seafood, and the name Laupahoehoe means “curved spear” in Hawaiian, referring to the shape of the fishhooks used by the local fishermen.
In the early 1800s, the area was a major port for whaling ships, and the town grew as a result. In 1832, the first school in the area was established, and in 1846, the first church was built.
In 1946, a tsunami struck the area, killing over 150 people and destroying much of the town. The town was rebuilt, and the Laupahoehoe Point School was established in 1948.
Geography
Laupahoehoe is located on the Hamakua Coast of the Big Island of Hawaii. It is situated at an elevation of about 500 feet above sea level. The town is surrounded by lush tropical rainforest and is bordered by the Pacific Ocean to the east.
The climate in Laupahoehoe is tropical, with temperatures ranging from the mid-70s to the mid-80s year-round. The area receives an average of about 75 inches of rain per year.
Economy
The economy of Laupahoehoe is largely based on tourism and agriculture. The town is home to several small businesses, including restaurants, shops, and a few bed and breakfasts.
Agriculture is also an important part of the local economy. The area is known for its macadamia nut farms, as well as its coffee and papaya plantations.
Demographics
As of the 2010 census, the population of Laupahoehoe was 1,093. The racial makeup of the town was 57.3% White, 0.7% African American, 0.3% Native American, 0.2% Asian, 0.1% Pacific Islander, and 41.4% from other races.
The median household income in Laupahoehoe was $37,917, and the median family income was $45,000. The per capita income was $17,917. About 17.3% of the population was below the poverty line.
Conclusion
Laupahoehoe is a small unincorporated community located on the Hamakua Coast of the Big Island of Hawaii. It has a rich history, with the first settlers arriving in the late 1700s. The economy of Laupahoehoe is largely based on tourism and agriculture, and the population of the town was 1,093 as of the 2010 census. The town is surrounded by lush tropical rainforest and is bordered by the Pacific Ocean to the east.
Common Questions
What is the Total Population of Laupahoehoe?
Total Population of Laupahoehoe is 954.
What is the Total Male Population of Laupahoehoe?
Total Male Population of Laupahoehoe is 453.
What is the Total Female Population of Laupahoehoe?
Total Female Population of Laupahoehoe is 501.
What is the Ratio of Males per 100 Females in Laupahoehoe?
There are 90.42 Males per 100 Females in Laupahoehoe.
What is the Ratio of Females per 100 Males in Laupahoehoe?
There are 110.60 Females per 100 Males in Laupahoehoe.
What is the Median Population Age in Laupahoehoe?
Median Population Age in Laupahoehoe is 57.3 Years.
What is the Average Family Size in Laupahoehoe
Average Family Size in Laupahoehoe is 3.0 People.
What is the Average Household Size in Laupahoehoe
Average Household Size in Laupahoehoe is 2.3 People.
What is Per Capita Income in Laupahoehoe?
Per Capita income in Laupahoehoe is $37,702.
What is the Median Family Income in Laupahoehoe?
Median Family Income in Laupahoehoe is $81,389.
What is the Median Household income in Laupahoehoe?
Median Household Income in Laupahoehoe is $50,956.
What is Income or Wage Gap in Laupahoehoe?
Income or Wage Gap in Laupahoehoe is 8.2%.
Women in Laupahoehoe earn 91.8 cents for every dollar earned by a man.
What is Inequality or Gini Index in Laupahoehoe?
Inequality or Gini Index in Laupahoehoe is 0.55.
How Large is the Labor Force in Laupahoehoe?
There are 370 People in the Labor Forcein in Laupahoehoe.
What is the Percentage of People in the Labor Force in Laupahoehoe?
47.4% of People are in the Labor Force in Laupahoehoe.
What is the Unemployment Rate in Laupahoehoe?
Unemployment Rate in Laupahoehoe is 14.6%.