Pearl City, HI
Pearl City Map
Pearl City Overview
46,812
TOTAL POPULATION
23,332
MALE POPULATION
23,480
FEMALE POPULATION
99.37
MALES / 100 FEMALES
100.63
FEMALES / 100 MALES
44.2
MEDIAN AGE
3.6
AVG FAMILY SIZE
3.1
AVG HOUSEHOLD SIZE
$46,626
PER CAPITA INCOME
$134,544
AVG FAMILY INCOME
$116,938
AVG HOUSEHOLD INCOME
15.6%
WAGE / INCOME GAP [ % ]
84.4¢/ $1
WAGE / INCOME GAP [ $ ]
$13,323
FAMILY INCOME DEFICIT
0.40
INEQUALITY / GINI INDEX
24,748
LABOR FORCE [ PEOPLE ]
63.2%
PERCENT IN LABOR FORCE
2.7%
UNEMPLOYMENT RATE
Pearl City Zip Codes
Pearl City Area Codes
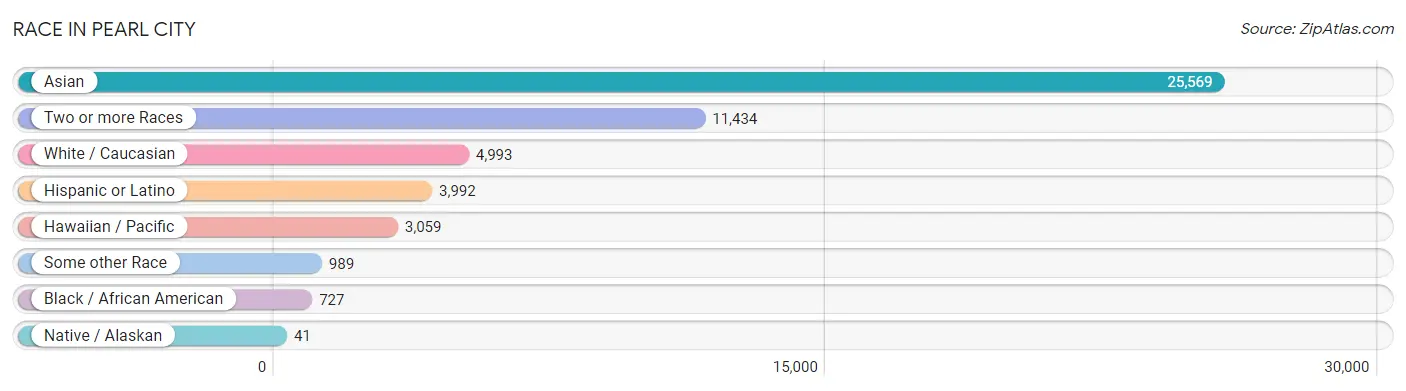
Race in Pearl City
The most populous races in Pearl City are Asian (25,569 | 54.6%), Two or more Races (11,434 | 24.4%), and White / Caucasian (4,993 | 10.7%).
| Race | # Population | % Population |
| Asian | 25,569 | 54.6% |
| Black / African American | 727 | 1.5% |
| Hawaiian / Pacific | 3,059 | 6.5% |
| Hispanic or Latino | 3,992 | 8.5% |
| Native / Alaskan | 41 | 0.1% |
| White / Caucasian | 4,993 | 10.7% |
| Two or more Races | 11,434 | 24.4% |
| Some other Race | 989 | 2.1% |
| Total | 46,812 | 100.0% |
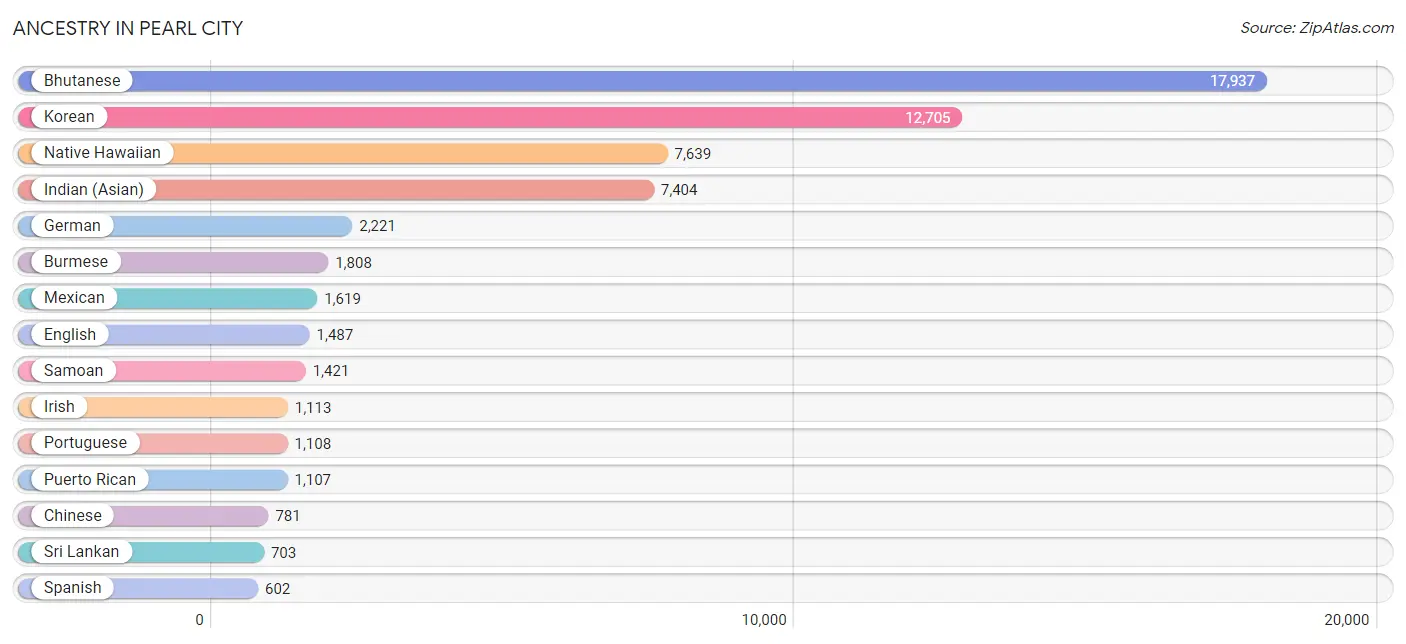
Ancestry in Pearl City
The most populous ancestries reported in Pearl City are Bhutanese (17,937 | 38.3%), Korean (12,705 | 27.1%), Native Hawaiian (7,639 | 16.3%), Indian (Asian) (7,404 | 15.8%), and German (2,221 | 4.7%), together accounting for 102.3% of all Pearl City residents.
| Ancestry | # Population | % Population |
| African | 22 | 0.1% |
| American | 310 | 0.7% |
| Apache | 18 | 0.0% |
| Arab | 103 | 0.2% |
| Australian | 8 | 0.0% |
| Austrian | 31 | 0.1% |
| Barbadian | 8 | 0.0% |
| Bhutanese | 17,937 | 38.3% |
| Blackfeet | 91 | 0.2% |
| Brazilian | 23 | 0.1% |
| British | 49 | 0.1% |
| Burmese | 1,808 | 3.9% |
| Cambodian | 27 | 0.1% |
| Canadian | 6 | 0.0% |
| Central American | 36 | 0.1% |
| Central American Indian | 19 | 0.0% |
| Cherokee | 212 | 0.4% |
| Chinese | 781 | 1.7% |
| Chippewa | 4 | 0.0% |
| Choctaw | 30 | 0.1% |
| Colombian | 17 | 0.0% |
| Cree | 1 | 0.0% |
| Cuban | 28 | 0.1% |
| Czech | 19 | 0.0% |
| Czechoslovakian | 10 | 0.0% |
| Danish | 36 | 0.1% |
| Dominican | 13 | 0.0% |
| Dutch | 125 | 0.3% |
| Eastern European | 11 | 0.0% |
| English | 1,487 | 3.2% |
| European | 47 | 0.1% |
| Fijian | 203 | 0.4% |
| Filipino | 55 | 0.1% |
| Finnish | 2 | 0.0% |
| French | 374 | 0.8% |
| French Canadian | 26 | 0.1% |
| German | 2,221 | 4.7% |
| German Russian | 5 | 0.0% |
| Greek | 89 | 0.2% |
| Guamanian / Chamorro | 141 | 0.3% |
| Honduran | 13 | 0.0% |
| Hungarian | 31 | 0.1% |
| Indian (Asian) | 7,404 | 15.8% |
| Irish | 1,113 | 2.4% |
| Iroquois | 231 | 0.5% |
| Italian | 340 | 0.7% |
| Jamaican | 120 | 0.3% |
| Japanese | 30 | 0.1% |
| Korean | 12,705 | 27.1% |
| Laotian | 86 | 0.2% |
| Lithuanian | 61 | 0.1% |
| Malaysian | 254 | 0.5% |
| Marshallese | 97 | 0.2% |
| Mexican | 1,619 | 3.5% |
| Mexican American Indian | 27 | 0.1% |
| Moroccan | 35 | 0.1% |
| Native Hawaiian | 7,639 | 16.3% |
| Navajo | 39 | 0.1% |
| Northern European | 20 | 0.0% |
| Norwegian | 186 | 0.4% |
| Pakistani | 260 | 0.6% |
| Polish | 192 | 0.4% |
| Portuguese | 1,108 | 2.4% |
| Puerto Rican | 1,107 | 2.4% |
| Russian | 126 | 0.3% |
| Salvadoran | 23 | 0.1% |
| Samoan | 1,421 | 3.0% |
| Scandinavian | 54 | 0.1% |
| Scotch-Irish | 133 | 0.3% |
| Scottish | 319 | 0.7% |
| Seminole | 42 | 0.1% |
| Sioux | 9 | 0.0% |
| Slovak | 29 | 0.1% |
| South American | 17 | 0.0% |
| Spaniard | 522 | 1.1% |
| Spanish | 602 | 1.3% |
| Sri Lankan | 703 | 1.5% |
| Subsaharan African | 22 | 0.1% |
| Swedish | 155 | 0.3% |
| Swiss | 14 | 0.0% |
| Syrian | 35 | 0.1% |
| Thai | 98 | 0.2% |
| Tongan | 158 | 0.3% |
| Welsh | 30 | 0.1% |
| West Indian | 5 | 0.0% |
| Yugoslavian | 18 | 0.0% | View All 86 Rows |
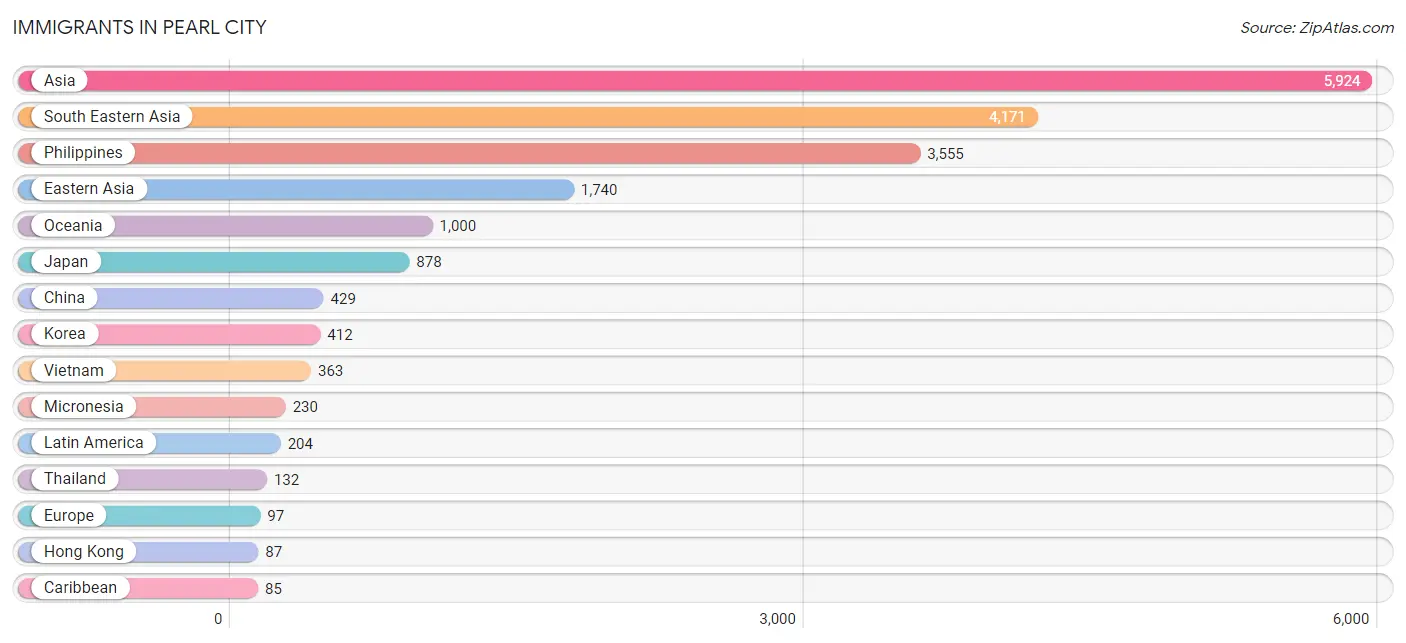
Immigrants in Pearl City
The most numerous immigrant groups reported in Pearl City came from Asia (5,924 | 12.7%), South Eastern Asia (4,171 | 8.9%), Philippines (3,555 | 7.6%), Eastern Asia (1,740 | 3.7%), and Oceania (1,000 | 2.1%), together accounting for 35.0% of all Pearl City residents.
| Immigration Origin | # Population | % Population |
| Asia | 5,924 | 12.7% |
| Australia | 8 | 0.0% |
| Brazil | 36 | 0.1% |
| Canada | 6 | 0.0% |
| Caribbean | 85 | 0.2% |
| Central America | 83 | 0.2% |
| China | 429 | 0.9% |
| Denmark | 4 | 0.0% |
| Dominican Republic | 24 | 0.1% |
| Eastern Asia | 1,740 | 3.7% |
| El Salvador | 18 | 0.0% |
| England | 6 | 0.0% |
| Europe | 97 | 0.2% |
| Germany | 70 | 0.2% |
| Hong Kong | 87 | 0.2% |
| India | 10 | 0.0% |
| Indonesia | 73 | 0.2% |
| Ireland | 10 | 0.0% |
| Jamaica | 61 | 0.1% |
| Japan | 878 | 1.9% |
| Korea | 412 | 0.9% |
| Laos | 34 | 0.1% |
| Latin America | 204 | 0.4% |
| Mexico | 65 | 0.1% |
| Micronesia | 230 | 0.5% |
| Northern Europe | 20 | 0.0% |
| Oceania | 1,000 | 2.1% |
| Philippines | 3,555 | 7.6% |
| Singapore | 14 | 0.0% |
| South America | 36 | 0.1% |
| South Central Asia | 10 | 0.0% |
| South Eastern Asia | 4,171 | 8.9% |
| Switzerland | 7 | 0.0% |
| Taiwan | 62 | 0.1% |
| Thailand | 132 | 0.3% |
| Vietnam | 363 | 0.8% |
| Western Asia | 3 | 0.0% |
| Western Europe | 77 | 0.2% |
| Yemen | 3 | 0.0% | View All 39 Rows |
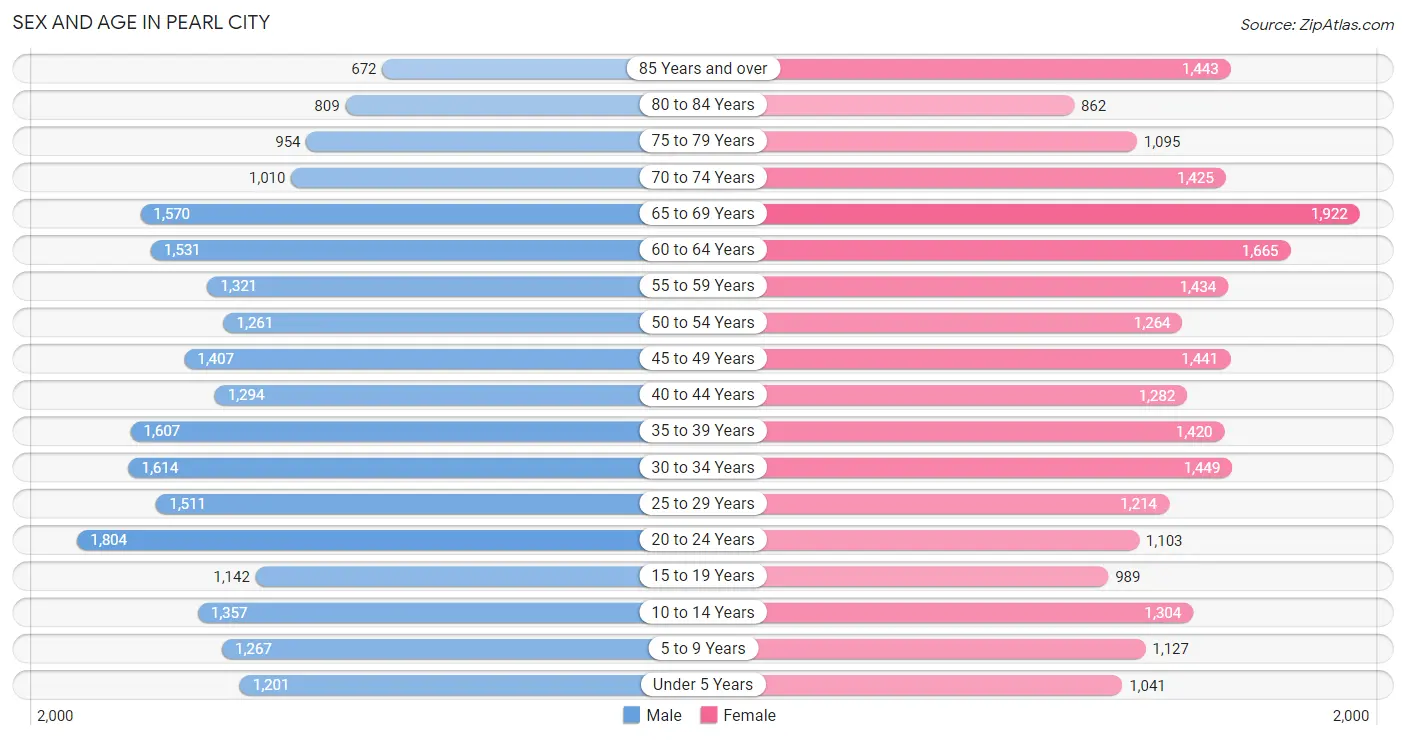
Sex and Age in Pearl City
Sex and Age in Pearl City
The most populous age groups in Pearl City are 20 to 24 Years (1,804 | 7.7%) for men and 65 to 69 Years (1,922 | 8.2%) for women.
| Age Bracket | Male | Female |
| Under 5 Years | 1,201 (5.1%) | 1,041 (4.4%) |
| 5 to 9 Years | 1,267 (5.4%) | 1,127 (4.8%) |
| 10 to 14 Years | 1,357 (5.8%) | 1,304 (5.6%) |
| 15 to 19 Years | 1,142 (4.9%) | 989 (4.2%) |
| 20 to 24 Years | 1,804 (7.7%) | 1,103 (4.7%) |
| 25 to 29 Years | 1,511 (6.5%) | 1,214 (5.2%) |
| 30 to 34 Years | 1,614 (6.9%) | 1,449 (6.2%) |
| 35 to 39 Years | 1,607 (6.9%) | 1,420 (6.0%) |
| 40 to 44 Years | 1,294 (5.6%) | 1,282 (5.5%) |
| 45 to 49 Years | 1,407 (6.0%) | 1,441 (6.1%) |
| 50 to 54 Years | 1,261 (5.4%) | 1,264 (5.4%) |
| 55 to 59 Years | 1,321 (5.7%) | 1,434 (6.1%) |
| 60 to 64 Years | 1,531 (6.6%) | 1,665 (7.1%) |
| 65 to 69 Years | 1,570 (6.7%) | 1,922 (8.2%) |
| 70 to 74 Years | 1,010 (4.3%) | 1,425 (6.1%) |
| 75 to 79 Years | 954 (4.1%) | 1,095 (4.7%) |
| 80 to 84 Years | 809 (3.5%) | 862 (3.7%) |
| 85 Years and over | 672 (2.9%) | 1,443 (6.1%) |
| Total | 23,332 (100.0%) | 23,480 (100.0%) |
Families and Households in Pearl City
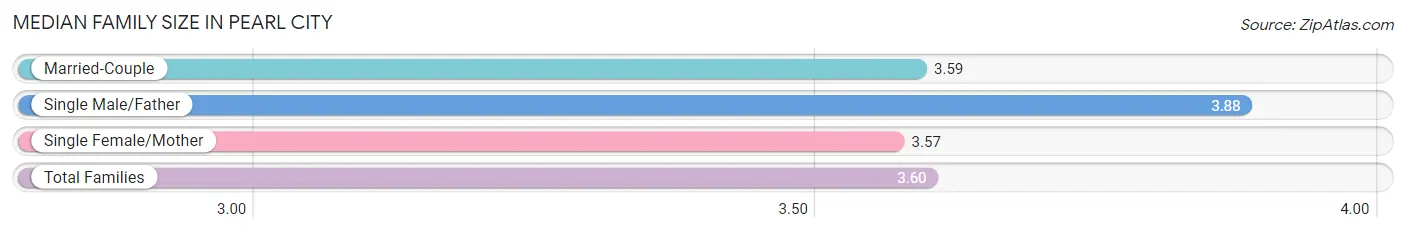
Median Family Size in Pearl City
The median family size in Pearl City is 3.60 persons per family, with single male/father families (760 | 6.9%) accounting for the largest median family size of 3.88 persons per family. On the other hand, single female/mother families (2,094 | 19.0%) represent the smallest median family size with 3.57 persons per family.
| Family Type | # Families | Family Size |
| Married-Couple | 8,172 (74.1%) | 3.59 |
| Single Male/Father | 760 (6.9%) | 3.88 |
| Single Female/Mother | 2,094 (19.0%) | 3.57 |
| Total Families | 11,026 (100.0%) | 3.60 |
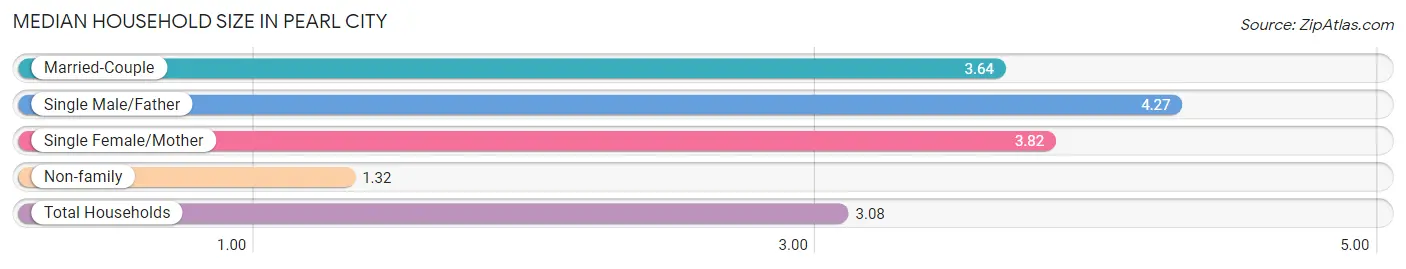
Median Household Size in Pearl City
The median household size in Pearl City is 3.08 persons per household, with single male/father households (760 | 5.1%) accounting for the largest median household size of 4.27 persons per household. non-family households (3,961 | 26.4%) represent the smallest median household size with 1.32 persons per household.
| Household Type | # Households | Household Size |
| Married-Couple | 8,172 (54.5%) | 3.64 |
| Single Male/Father | 760 (5.1%) | 4.27 |
| Single Female/Mother | 2,094 (14.0%) | 3.82 |
| Non-family | 3,961 (26.4%) | 1.32 |
| Total Households | 14,987 (100.0%) | 3.08 |
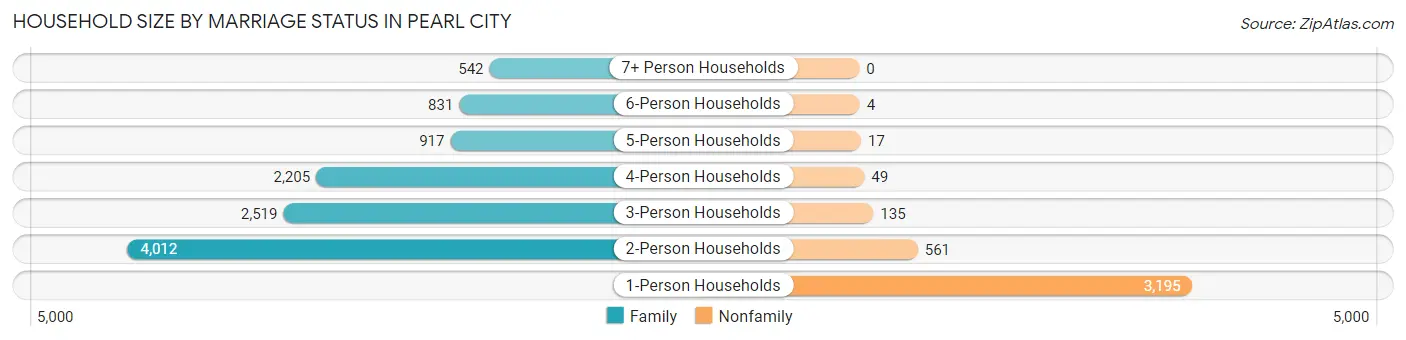
Household Size by Marriage Status in Pearl City
Out of a total of 14,987 households in Pearl City, 11,026 (73.6%) are family households, while 3,961 (26.4%) are nonfamily households. The most numerous type of family households are 2-person households, comprising 4,012, and the most common type of nonfamily households are 1-person households, comprising 3,195.
| Household Size | Family Households | Nonfamily Households |
| 1-Person Households | - | 3,195 (21.3%) |
| 2-Person Households | 4,012 (26.8%) | 561 (3.7%) |
| 3-Person Households | 2,519 (16.8%) | 135 (0.9%) |
| 4-Person Households | 2,205 (14.7%) | 49 (0.3%) |
| 5-Person Households | 917 (6.1%) | 17 (0.1%) |
| 6-Person Households | 831 (5.5%) | 4 (0.0%) |
| 7+ Person Households | 542 (3.6%) | 0 (0.0%) |
| Total | 11,026 (73.6%) | 3,961 (26.4%) |
Female Fertility in Pearl City
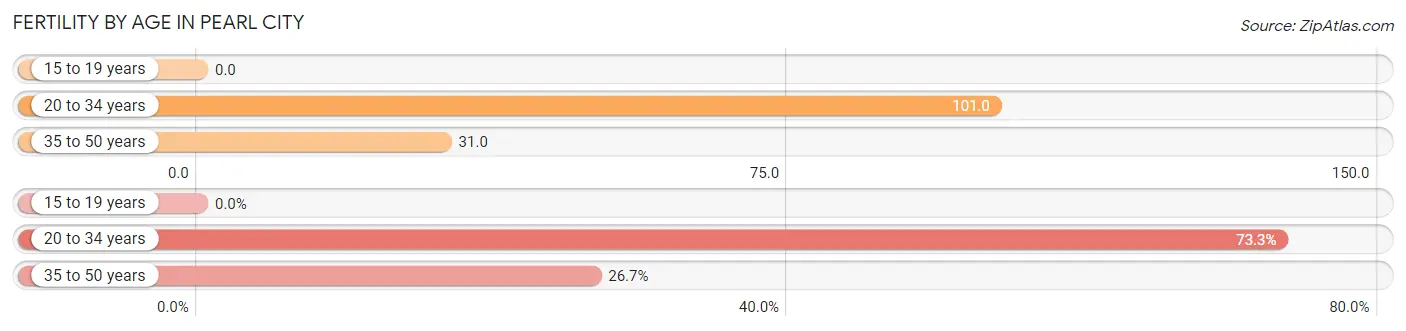
Fertility by Age in Pearl City
Average fertility rate in Pearl City is 57.0 births per 1,000 women. Women in the age bracket of 20 to 34 years have the highest fertility rate with 101.0 births per 1,000 women. Women in the age bracket of 20 to 34 years acount for 73.3% of all women with births.
| Age Bracket | Women with Births | Births / 1,000 Women |
| 15 to 19 years | 0 (0.0%) | 0.0 |
| 20 to 34 years | 379 (73.3%) | 101.0 |
| 35 to 50 years | 138 (26.7%) | 31.0 |
| Total | 517 (100.0%) | 57.0 |
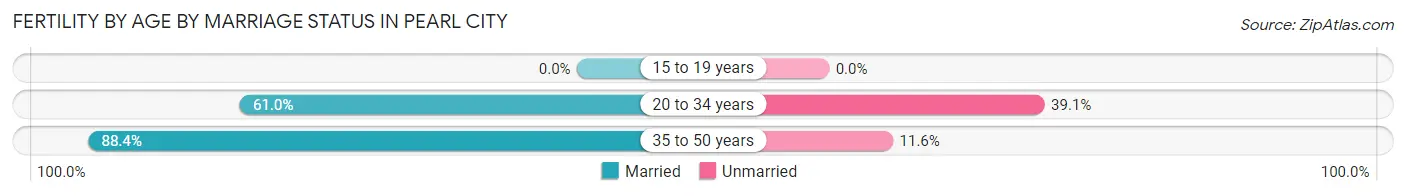
Fertility by Age by Marriage Status in Pearl City
68.3% of women with births (517) in Pearl City are married. The highest percentage of unmarried women with births falls into 20 to 34 years age bracket with 39.1% of them unmarried at the time of birth, while the lowest percentage of unmarried women with births belong to 35 to 50 years age bracket with 11.6% of them unmarried.
| Age Bracket | Married | Unmarried |
| 15 to 19 years | 0 (0.0%) | 0 (0.0%) |
| 20 to 34 years | 231 (61.0%) | 148 (39.1%) |
| 35 to 50 years | 122 (88.4%) | 16 (11.6%) |
| Total | 353 (68.3%) | 164 (31.7%) |
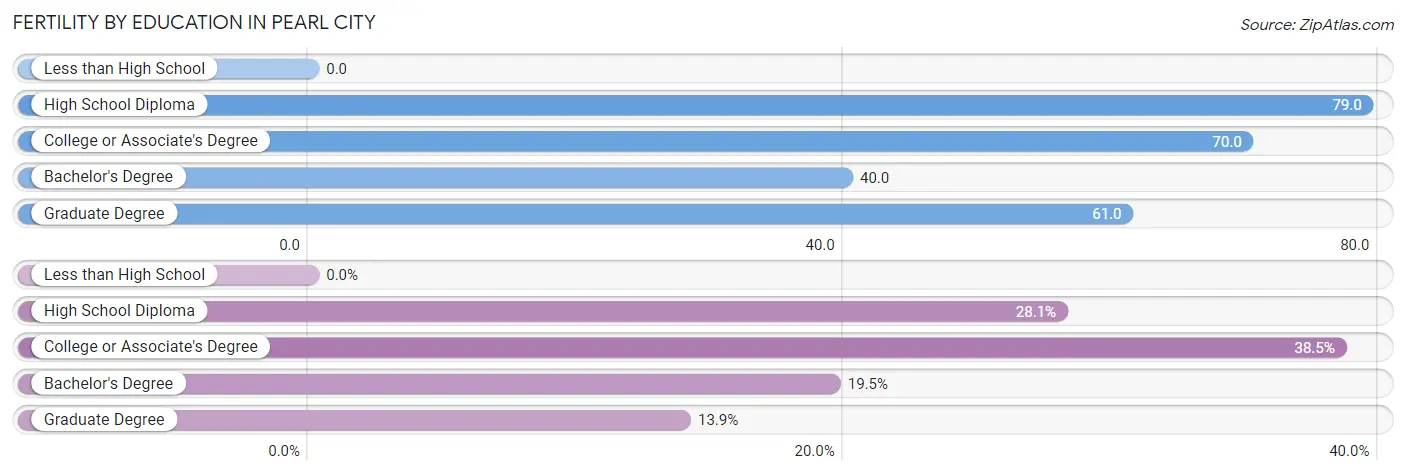
Fertility by Education in Pearl City
| Educational Attainment | Women with Births | Births / 1,000 Women |
| Less than High School | 0 (0.0%) | 0.0 |
| High School Diploma | 145 (28.1%) | 79.0 |
| College or Associate's Degree | 199 (38.5%) | 70.0 |
| Bachelor's Degree | 101 (19.5%) | 40.0 |
| Graduate Degree | 72 (13.9%) | 61.0 |
| Total | 517 (100.0%) | 57.0 |
Fertility by Education by Marriage Status in Pearl City
31.7% of women with births in Pearl City are unmarried. Women with the educational attainment of graduate degree are most likely to be married with 100.0% of them married at childbirth, while women with the educational attainment of high school diploma are least likely to be married with 69.0% of them unmarried at childbirth.
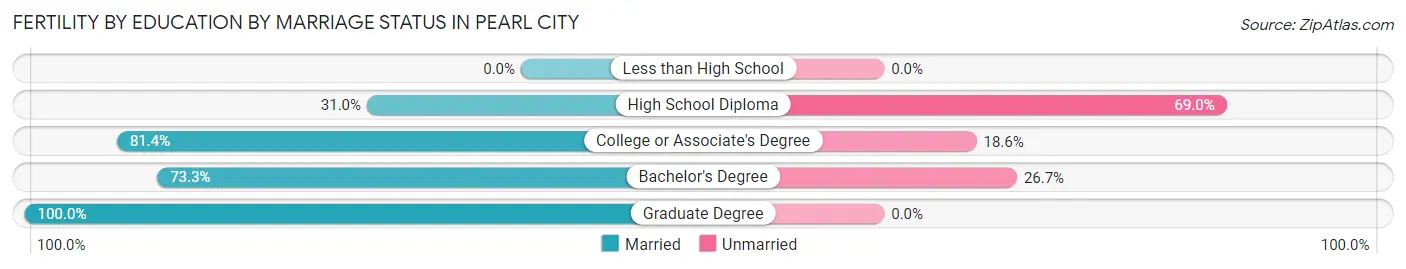
| Educational Attainment | Married | Unmarried |
| Less than High School | 0 (0.0%) | 0 (0.0%) |
| High School Diploma | 45 (31.0%) | 100 (69.0%) |
| College or Associate's Degree | 162 (81.4%) | 37 (18.6%) |
| Bachelor's Degree | 74 (73.3%) | 27 (26.7%) |
| Graduate Degree | 72 (100.0%) | 0 (0.0%) |
| Total | 353 (68.3%) | 164 (31.7%) |
Income in Pearl City
Income Overview in Pearl City
Per Capita Income in Pearl City is $46,626, while median incomes of families and households are $134,544 and $116,938 respectively.
| Characteristic | Number | Measure |
| Per Capita Income | 46,812 | $46,626 |
| Median Family Income | 11,026 | $134,544 |
| Mean Family Income | 11,026 | $159,518 |
| Median Household Income | 14,987 | $116,938 |
| Mean Household Income | 14,987 | $138,814 |
| Income Deficit | 11,026 | $13,323 |
| Wage / Income Gap (%) | 46,812 | 15.56% |
| Wage / Income Gap ($) | 46,812 | 84.44¢ per $1 |
| Gini / Inequality Index | 46,812 | 0.40 |
Earnings by Sex in Pearl City
Average Earnings in Pearl City are $49,674, $54,931 for men and $46,383 for women, a difference of 15.6%.
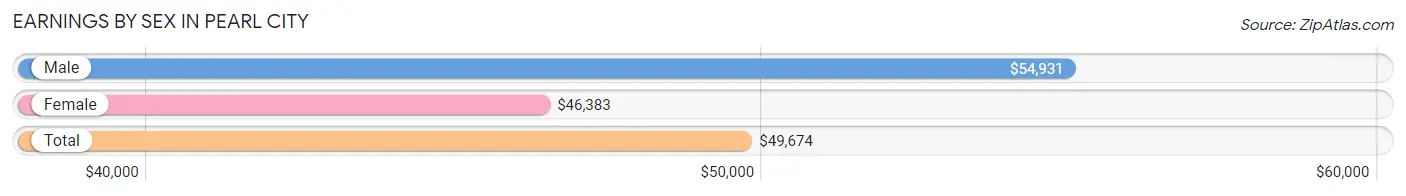
| Sex | Number | Average Earnings |
| Male | 13,566 (53.2%) | $54,931 |
| Female | 11,924 (46.8%) | $46,383 |
| Total | 25,490 (100.0%) | $49,674 |
Earnings by Sex by Income Bracket in Pearl City
The most common earnings brackets in Pearl City are $100,000+ for men (2,551 | 18.8%) and $75,000 to $99,999 for women (1,442 | 12.1%).
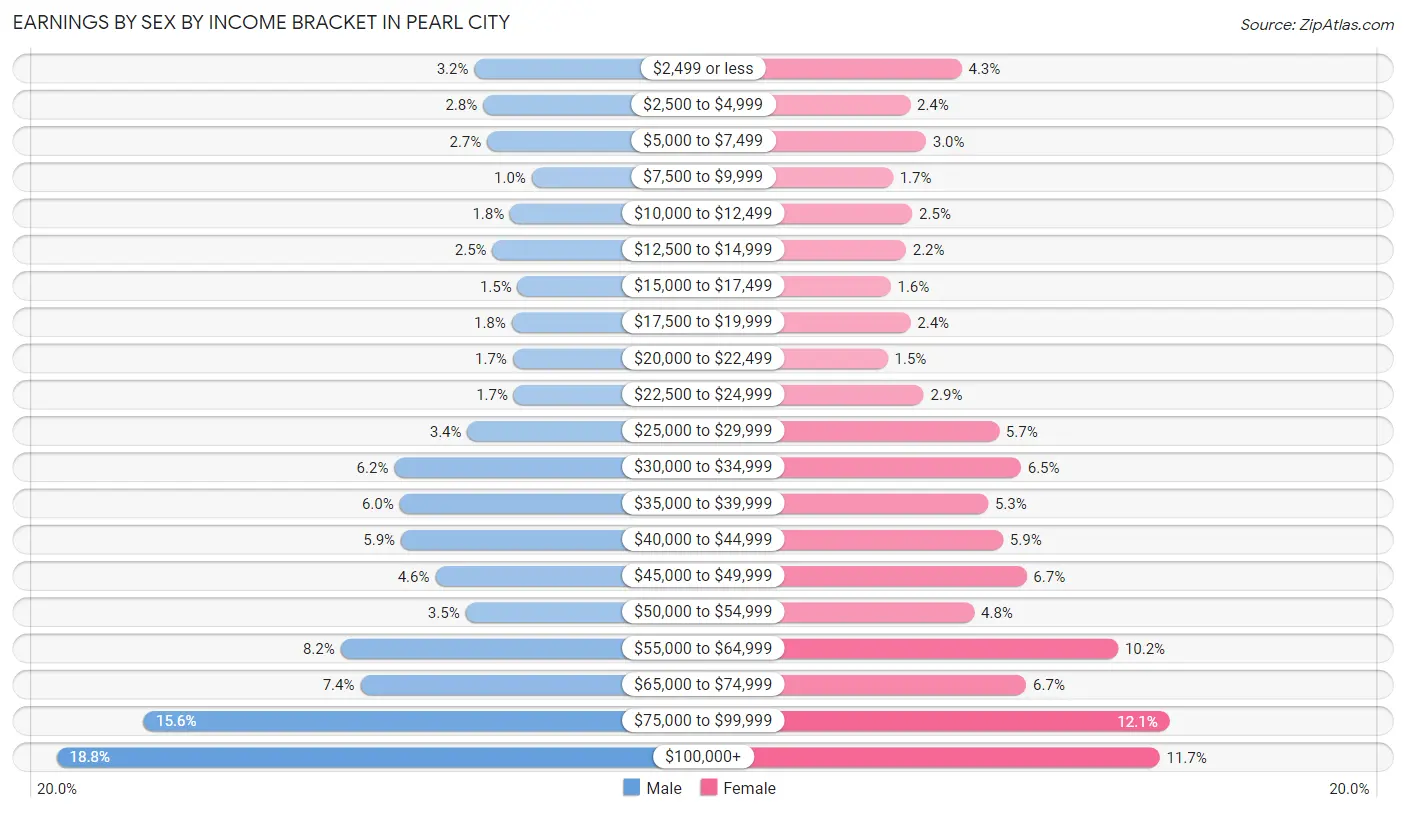
| Income | Male | Female |
| $2,499 or less | 428 (3.2%) | 513 (4.3%) |
| $2,500 to $4,999 | 382 (2.8%) | 283 (2.4%) |
| $5,000 to $7,499 | 362 (2.7%) | 353 (3.0%) |
| $7,500 to $9,999 | 135 (1.0%) | 205 (1.7%) |
| $10,000 to $12,499 | 246 (1.8%) | 292 (2.5%) |
| $12,500 to $14,999 | 335 (2.5%) | 264 (2.2%) |
| $15,000 to $17,499 | 207 (1.5%) | 195 (1.6%) |
| $17,500 to $19,999 | 237 (1.8%) | 284 (2.4%) |
| $20,000 to $22,499 | 232 (1.7%) | 183 (1.5%) |
| $22,500 to $24,999 | 226 (1.7%) | 344 (2.9%) |
| $25,000 to $29,999 | 462 (3.4%) | 680 (5.7%) |
| $30,000 to $34,999 | 834 (6.1%) | 777 (6.5%) |
| $35,000 to $39,999 | 807 (5.9%) | 631 (5.3%) |
| $40,000 to $44,999 | 800 (5.9%) | 698 (5.9%) |
| $45,000 to $49,999 | 625 (4.6%) | 802 (6.7%) |
| $50,000 to $54,999 | 472 (3.5%) | 569 (4.8%) |
| $55,000 to $64,999 | 1,107 (8.2%) | 1,211 (10.2%) |
| $65,000 to $74,999 | 1,007 (7.4%) | 801 (6.7%) |
| $75,000 to $99,999 | 2,111 (15.6%) | 1,442 (12.1%) |
| $100,000+ | 2,551 (18.8%) | 1,397 (11.7%) |
| Total | 13,566 (100.0%) | 11,924 (100.0%) |
Earnings by Sex by Educational Attainment in Pearl City
Average earnings in Pearl City are $62,325 for men and $49,974 for women, a difference of 19.8%. Men with an educational attainment of graduate degree enjoy the highest average annual earnings of $87,439, while those with less than high school education earn the least with $40,469. Women with an educational attainment of graduate degree earn the most with the average annual earnings of $78,889, while those with high school diploma education have the smallest earnings of $33,214.
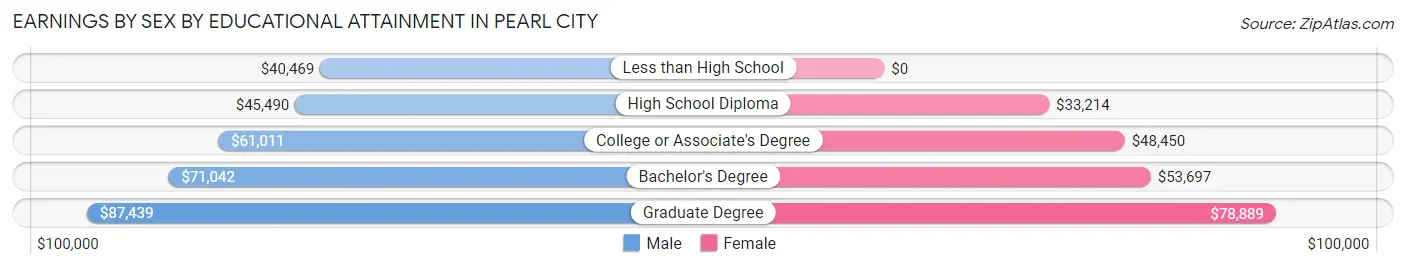
| Educational Attainment | Male Income | Female Income |
| Less than High School | $40,469 | $0 |
| High School Diploma | $45,490 | $33,214 |
| College or Associate's Degree | $61,011 | $48,450 |
| Bachelor's Degree | $71,042 | $53,697 |
| Graduate Degree | $87,439 | $78,889 |
| Total | $62,325 | $49,974 |
Family Income in Pearl City
Family Income Brackets in Pearl City
According to the Pearl City family income data, there are 2,734 families falling into the $200,000+ income range, which is the most common income bracket and makes up 24.8% of all families. Conversely, the $10,000 to $14,999 income bracket is the least frequent group with only 33 families (0.3%) belonging to this category.
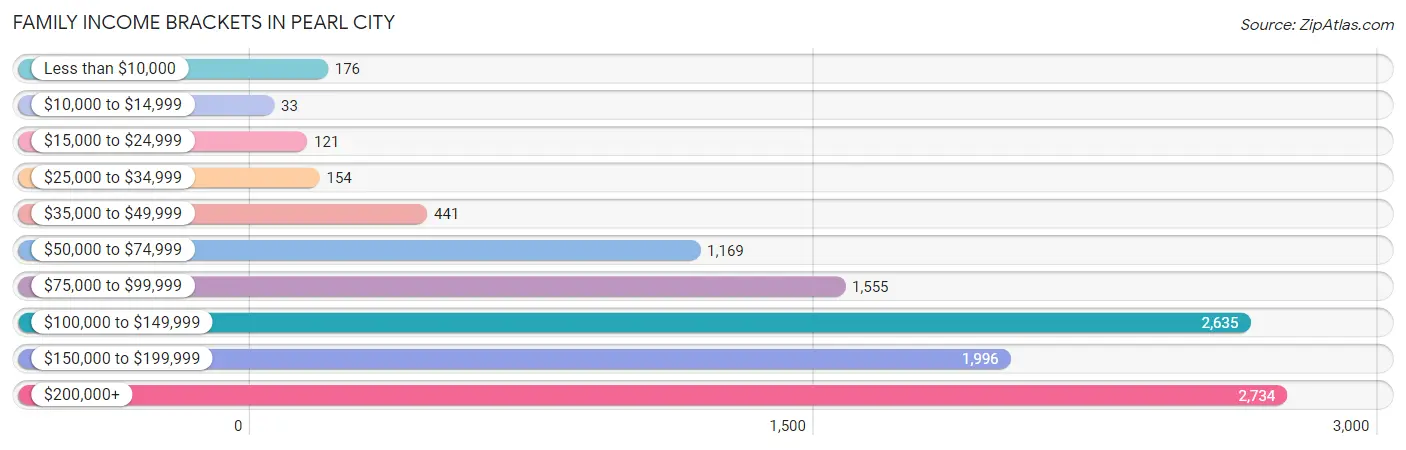
| Income Bracket | # Families | % Families |
| Less than $10,000 | 176 | 1.6% |
| $10,000 to $14,999 | 33 | 0.3% |
| $15,000 to $24,999 | 121 | 1.1% |
| $25,000 to $34,999 | 154 | 1.4% |
| $35,000 to $49,999 | 441 | 4.0% |
| $50,000 to $74,999 | 1,169 | 10.6% |
| $75,000 to $99,999 | 1,555 | 14.1% |
| $100,000 to $149,999 | 2,635 | 23.9% |
| $150,000 to $199,999 | 1,996 | 18.1% |
| $200,000+ | 2,734 | 24.8% |
Family Income by Famaliy Size in Pearl City
7+ person families (426 | 3.9%) account for the highest median family income in Pearl City with $218,913 per family, while 2-person families (4,185 | 38.0%) have the highest median income of $54,394 per family member.
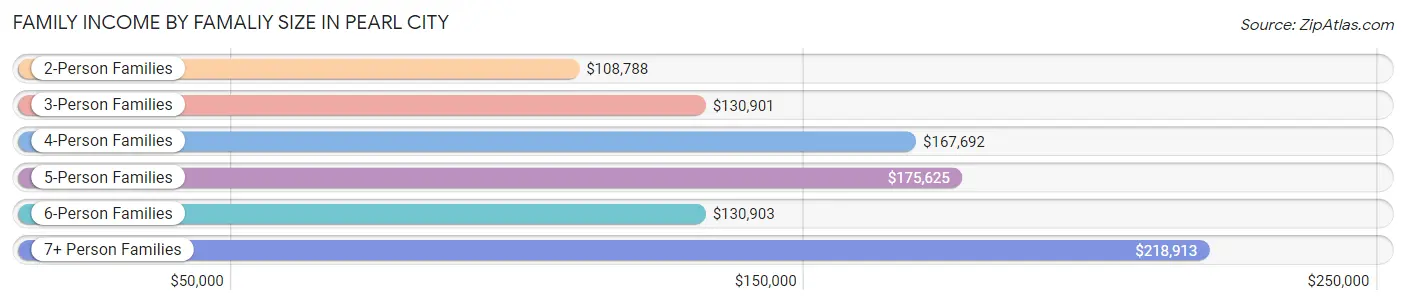
| Income Bracket | # Families | Median Income |
| 2-Person Families | 4,185 (38.0%) | $108,788 |
| 3-Person Families | 2,671 (24.2%) | $130,901 |
| 4-Person Families | 2,064 (18.7%) | $167,692 |
| 5-Person Families | 862 (7.8%) | $175,625 |
| 6-Person Families | 818 (7.4%) | $130,903 |
| 7+ Person Families | 426 (3.9%) | $218,913 |
| Total | 11,026 (100.0%) | $134,544 |
Family Income by Number of Earners in Pearl City
The median family income in Pearl City is $134,544, with families comprising 3+ earners (2,478) having the highest median family income of $197,973, while families with 1 earner (2,738) have the lowest median family income of $97,262, accounting for 22.5% and 24.8% of families, respectively.
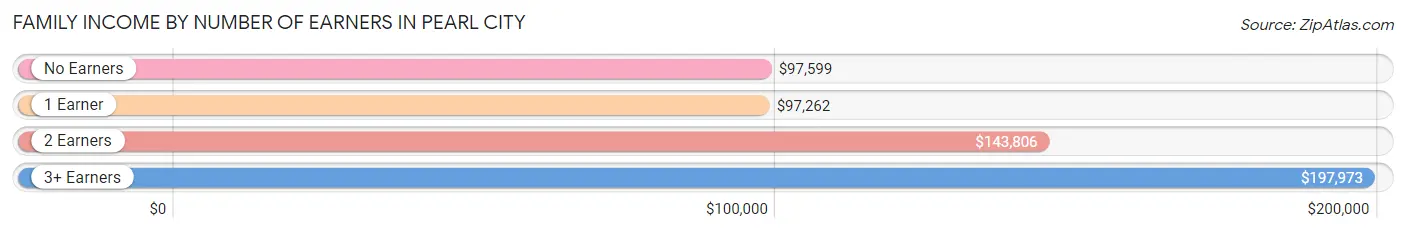
| Number of Earners | # Families | Median Income |
| No Earners | 1,476 (13.4%) | $97,599 |
| 1 Earner | 2,738 (24.8%) | $97,262 |
| 2 Earners | 4,334 (39.3%) | $143,806 |
| 3+ Earners | 2,478 (22.5%) | $197,973 |
| Total | 11,026 (100.0%) | $134,544 |
Household Income in Pearl City
Household Income Brackets in Pearl City
With 3,177 households falling in the category, the $100,000 to $149,999 income range is the most frequent in Pearl City, accounting for 21.2% of all households. In contrast, only 225 households (1.5%) fall into the $10,000 to $14,999 income bracket, making it the least populous group.
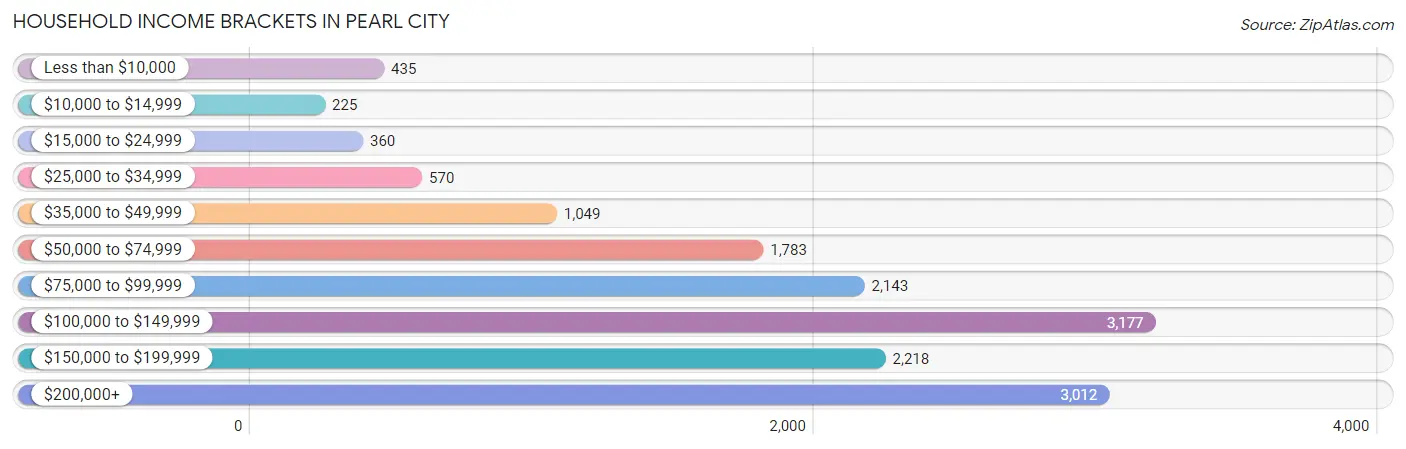
| Income Bracket | # Households | % Households |
| Less than $10,000 | 435 | 2.9% |
| $10,000 to $14,999 | 225 | 1.5% |
| $15,000 to $24,999 | 360 | 2.4% |
| $25,000 to $34,999 | 570 | 3.8% |
| $35,000 to $49,999 | 1,049 | 7.0% |
| $50,000 to $74,999 | 1,783 | 11.9% |
| $75,000 to $99,999 | 2,143 | 14.3% |
| $100,000 to $149,999 | 3,177 | 21.2% |
| $150,000 to $199,999 | 2,218 | 14.8% |
| $200,000+ | 3,012 | 20.1% |
Household Income by Householder Age in Pearl City
The median household income in Pearl City is $116,938, with the highest median household income of $134,418 found in the 45 to 64 years age bracket for the primary householder. A total of 4,973 households (33.2%) fall into this category. Meanwhile, the 15 to 24 years age bracket for the primary householder has the lowest median household income of $52,208, with 371 households (2.5%) in this group.
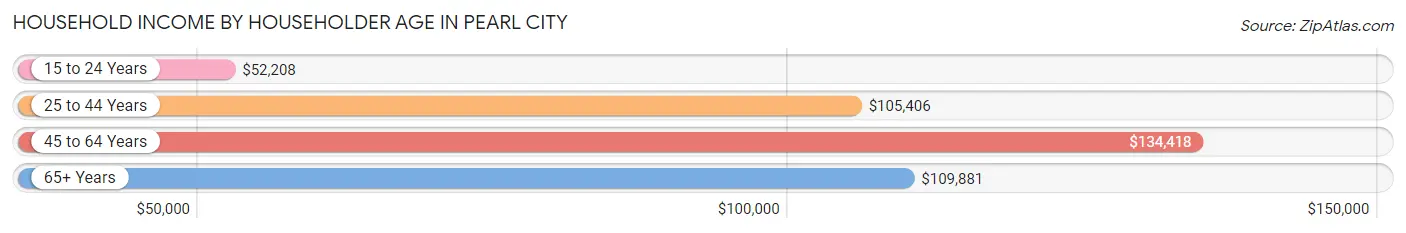
| Income Bracket | # Households | Median Income |
| 15 to 24 Years | 371 (2.5%) | $52,208 |
| 25 to 44 Years | 3,466 (23.1%) | $105,406 |
| 45 to 64 Years | 4,973 (33.2%) | $134,418 |
| 65+ Years | 6,177 (41.2%) | $109,881 |
| Total | 14,987 (100.0%) | $116,938 |
Poverty in Pearl City
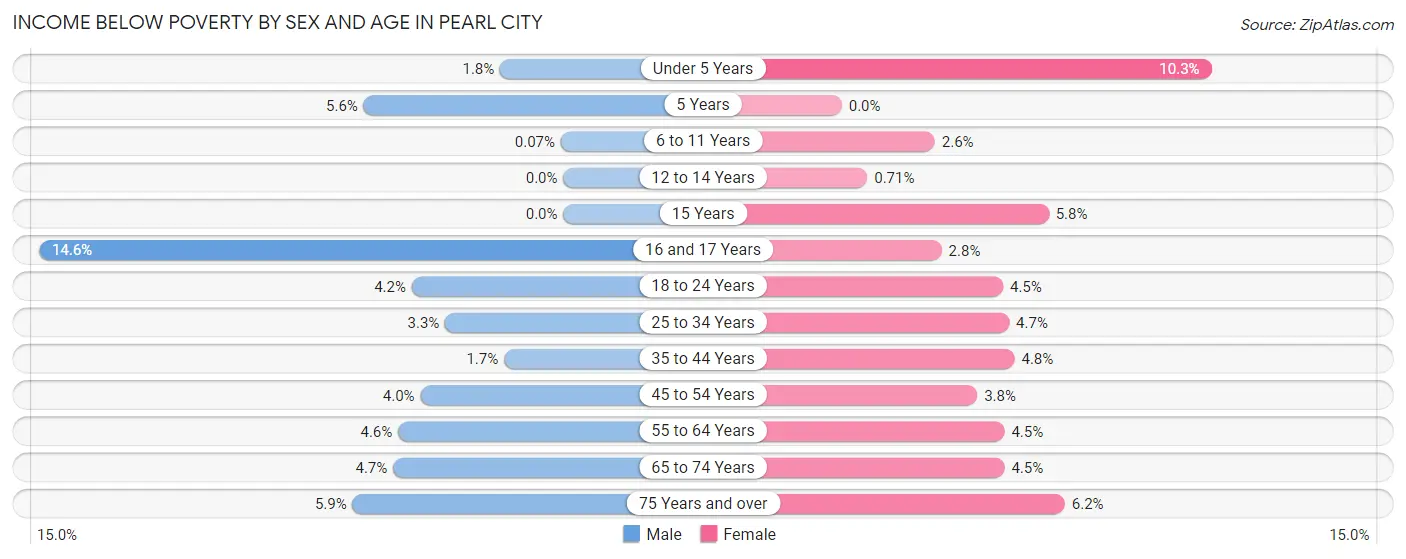
Income Below Poverty by Sex and Age in Pearl City
With 3.7% poverty level for males and 4.7% for females among the residents of Pearl City, 16 and 17 year old males and under 5 year old females are the most vulnerable to poverty, with 87 males (14.6%) and 106 females (10.3%) in their respective age groups living below the poverty level.
| Age Bracket | Male | Female |
| Under 5 Years | 21 (1.8%) | 106 (10.3%) |
| 5 Years | 16 (5.6%) | 0 (0.0%) |
| 6 to 11 Years | 1 (0.1%) | 36 (2.6%) |
| 12 to 14 Years | 0 (0.0%) | 6 (0.7%) |
| 15 Years | 0 (0.0%) | 11 (5.8%) |
| 16 and 17 Years | 87 (14.6%) | 12 (2.8%) |
| 18 to 24 Years | 83 (4.2%) | 66 (4.5%) |
| 25 to 34 Years | 100 (3.3%) | 124 (4.7%) |
| 35 to 44 Years | 48 (1.7%) | 130 (4.8%) |
| 45 to 54 Years | 106 (4.0%) | 102 (3.8%) |
| 55 to 64 Years | 131 (4.6%) | 140 (4.5%) |
| 65 to 74 Years | 122 (4.7%) | 151 (4.5%) |
| 75 Years and over | 141 (5.9%) | 204 (6.2%) |
| Total | 856 (3.7%) | 1,088 (4.7%) |
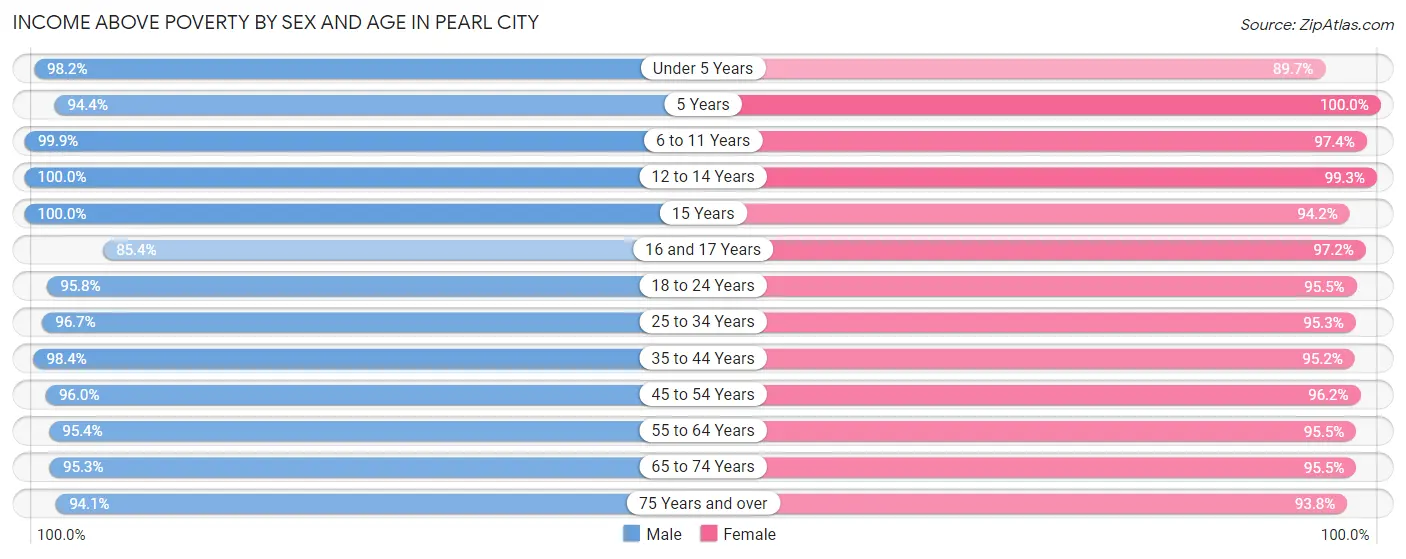
Income Above Poverty by Sex and Age in Pearl City
According to the poverty statistics in Pearl City, males aged 12 to 14 years and females aged 5 years are the age groups that are most secure financially, with 100.0% of males and 100.0% of females in these age groups living above the poverty line.
| Age Bracket | Male | Female |
| Under 5 Years | 1,175 (98.2%) | 924 (89.7%) |
| 5 Years | 272 (94.4%) | 182 (100.0%) |
| 6 to 11 Years | 1,393 (99.9%) | 1,355 (97.4%) |
| 12 to 14 Years | 873 (100.0%) | 838 (99.3%) |
| 15 Years | 164 (100.0%) | 180 (94.2%) |
| 16 and 17 Years | 509 (85.4%) | 420 (97.2%) |
| 18 to 24 Years | 1,883 (95.8%) | 1,403 (95.5%) |
| 25 to 34 Years | 2,943 (96.7%) | 2,539 (95.3%) |
| 35 to 44 Years | 2,853 (98.4%) | 2,572 (95.2%) |
| 45 to 54 Years | 2,557 (96.0%) | 2,601 (96.2%) |
| 55 to 64 Years | 2,714 (95.4%) | 2,952 (95.5%) |
| 65 to 74 Years | 2,454 (95.3%) | 3,186 (95.5%) |
| 75 Years and over | 2,261 (94.1%) | 3,079 (93.8%) |
| Total | 22,051 (96.3%) | 22,231 (95.3%) |
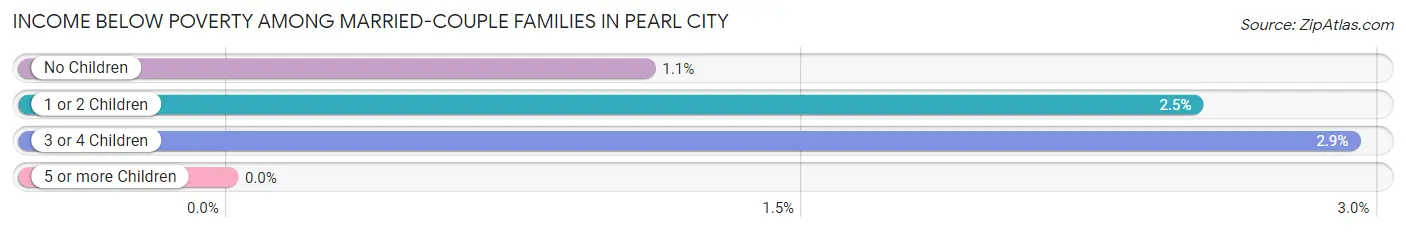
Income Below Poverty Among Married-Couple Families in Pearl City
The poverty statistics for married-couple families in Pearl City show that 1.7% or 136 of the total 8,172 families live below the poverty line. Families with 3 or 4 children have the highest poverty rate of 2.9%, comprising of 17 families. On the other hand, families with 5 or more children have the lowest poverty rate of 0.0%, which includes 0 families.
| Children | Above Poverty | Below Poverty |
| No Children | 4,979 (98.9%) | 55 (1.1%) |
| 1 or 2 Children | 2,473 (97.5%) | 64 (2.5%) |
| 3 or 4 Children | 563 (97.1%) | 17 (2.9%) |
| 5 or more Children | 21 (100.0%) | 0 (0.0%) |
| Total | 8,036 (98.3%) | 136 (1.7%) |
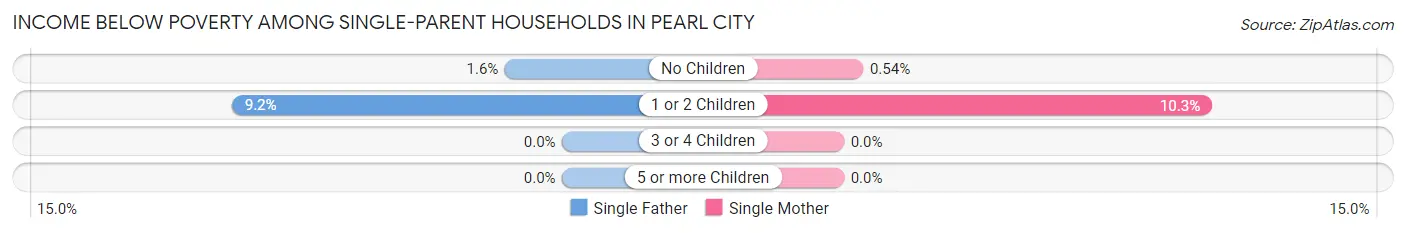
Income Below Poverty Among Single-Parent Households in Pearl City
According to the poverty data in Pearl City, 4.5% or 34 single-father households and 3.7% or 78 single-mother households are living below the poverty line. Among single-father households, those with 1 or 2 children have the highest poverty rate, with 28 households (9.2%) experiencing poverty. Likewise, among single-mother households, those with 1 or 2 children have the highest poverty rate, with 71 households (10.3%) falling below the poverty line.
| Children | Single Father | Single Mother |
| No Children | 6 (1.6%) | 7 (0.5%) |
| 1 or 2 Children | 28 (9.2%) | 71 (10.3%) |
| 3 or 4 Children | 0 (0.0%) | 0 (0.0%) |
| 5 or more Children | 0 (0.0%) | 0 (0.0%) |
| Total | 34 (4.5%) | 78 (3.7%) |
Income Below Poverty Among Married-Couple vs Single-Parent Households in Pearl City
The poverty data for Pearl City shows that 136 of the married-couple family households (1.7%) and 112 of the single-parent households (3.9%) are living below the poverty level. Within the married-couple family households, those with 3 or 4 children have the highest poverty rate, with 17 households (2.9%) falling below the poverty line. Among the single-parent households, those with 1 or 2 children have the highest poverty rate, with 99 household (10.0%) living below poverty.
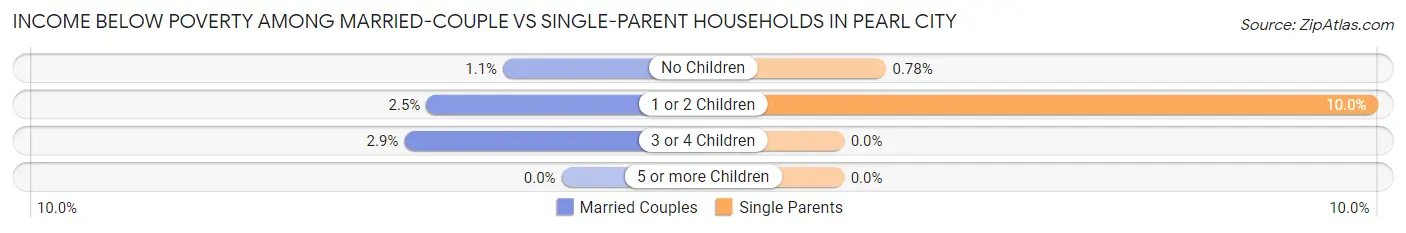
| Children | Married-Couple Families | Single-Parent Households |
| No Children | 55 (1.1%) | 13 (0.8%) |
| 1 or 2 Children | 64 (2.5%) | 99 (10.0%) |
| 3 or 4 Children | 17 (2.9%) | 0 (0.0%) |
| 5 or more Children | 0 (0.0%) | 0 (0.0%) |
| Total | 136 (1.7%) | 112 (3.9%) |
Employment Characteristics in Pearl City
Employment by Class of Employer in Pearl City
Among the 23,243 employed individuals in Pearl City, private company employees (11,800 | 50.8%), federal government employees (4,133 | 17.8%), and state government employees (2,191 | 9.4%) make up the most common classes of employment.
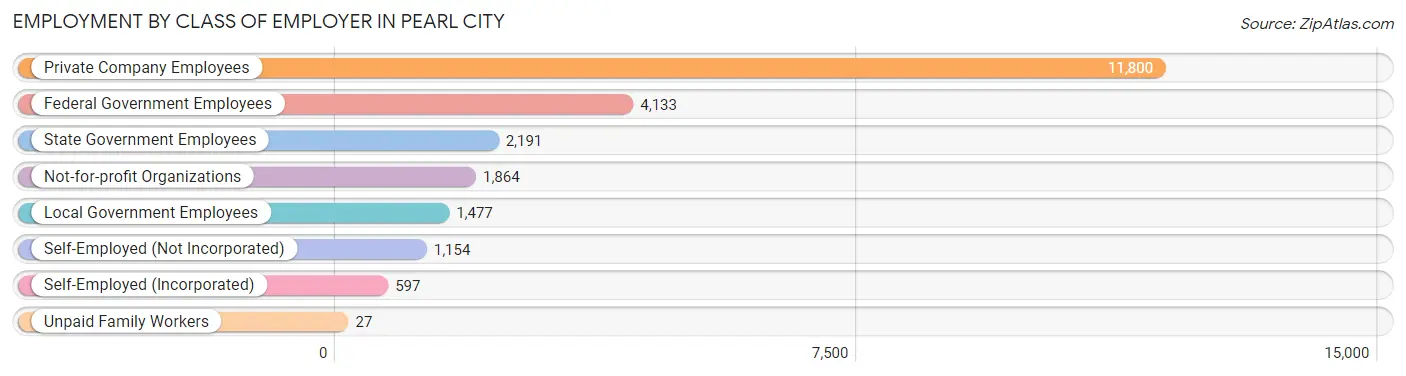
| Employer Class | # Employees | % Employees |
| Private Company Employees | 11,800 | 50.8% |
| Self-Employed (Incorporated) | 597 | 2.6% |
| Self-Employed (Not Incorporated) | 1,154 | 5.0% |
| Not-for-profit Organizations | 1,864 | 8.0% |
| Local Government Employees | 1,477 | 6.4% |
| State Government Employees | 2,191 | 9.4% |
| Federal Government Employees | 4,133 | 17.8% |
| Unpaid Family Workers | 27 | 0.1% |
| Total | 23,243 | 100.0% |
Employment Status by Age in Pearl City
According to the labor force statistics for Pearl City, out of the total population over 16 years of age (39,158), 63.2% or 24,748 individuals are in the labor force, with 2.7% or 668 of them unemployed. The age group with the highest labor force participation rate is 35 to 44 years, with 91.9% or 5,149 individuals in the labor force. Within the labor force, the 16 to 19 years age range has the highest percentage of unemployed individuals, with 9.2% or 59 of them being unemployed.
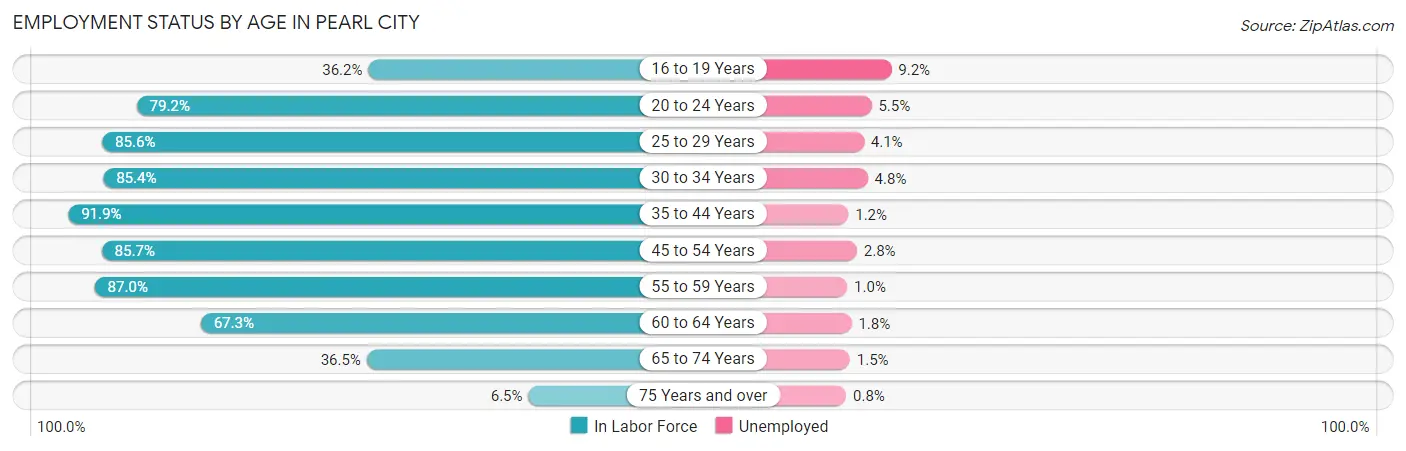
| Age Bracket | In Labor Force | Unemployed |
| 16 to 19 Years | 642 (36.2%) | 59 (9.2%) |
| 20 to 24 Years | 2,302 (79.2%) | 127 (5.5%) |
| 25 to 29 Years | 2,333 (85.6%) | 96 (4.1%) |
| 30 to 34 Years | 2,616 (85.4%) | 126 (4.8%) |
| 35 to 44 Years | 5,149 (91.9%) | 62 (1.2%) |
| 45 to 54 Years | 4,605 (85.7%) | 129 (2.8%) |
| 55 to 59 Years | 2,397 (87.0%) | 24 (1.0%) |
| 60 to 64 Years | 2,151 (67.3%) | 39 (1.8%) |
| 65 to 74 Years | 2,163 (36.5%) | 32 (1.5%) |
| 75 Years and over | 379 (6.5%) | 3 (0.8%) |
| Total | 24,748 (63.2%) | 668 (2.7%) |
Employment Status by Educational Attainment in Pearl City
According to labor force statistics for Pearl City, 84.7% of individuals (19,240) out of the total population between 25 and 64 years of age (22,715) are in the labor force, with 2.4% or 462 of them being unemployed. The group with the highest labor force participation rate are those with the educational attainment of bachelor's degree or higher, with 87.9% or 7,851 individuals in the labor force. Within the labor force, individuals with less than high school education have the highest percentage of unemployment, with 6.8% or 28 of them being unemployed.
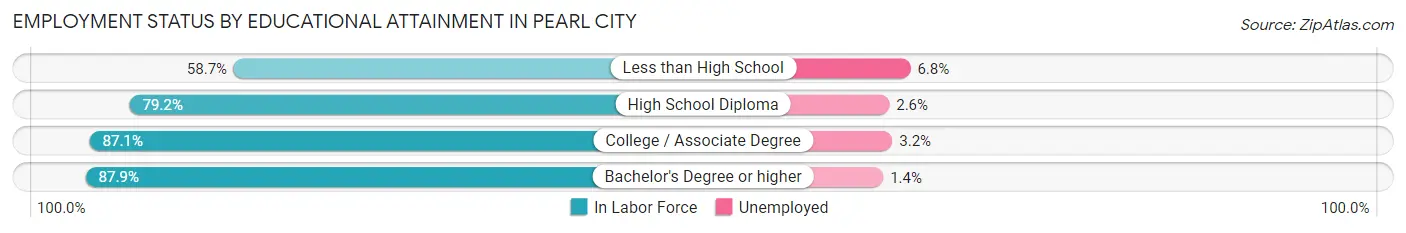
| Educational Attainment | In Labor Force | Unemployed |
| Less than High School | 413 (58.7%) | 48 (6.8%) |
| High School Diploma | 4,030 (79.2%) | 132 (2.6%) |
| College / Associate Degree | 6,959 (87.1%) | 256 (3.2%) |
| Bachelor's Degree or higher | 7,851 (87.9%) | 125 (1.4%) |
| Total | 19,240 (84.7%) | 545 (2.4%) |
Employment Occupations by Sex in Pearl City
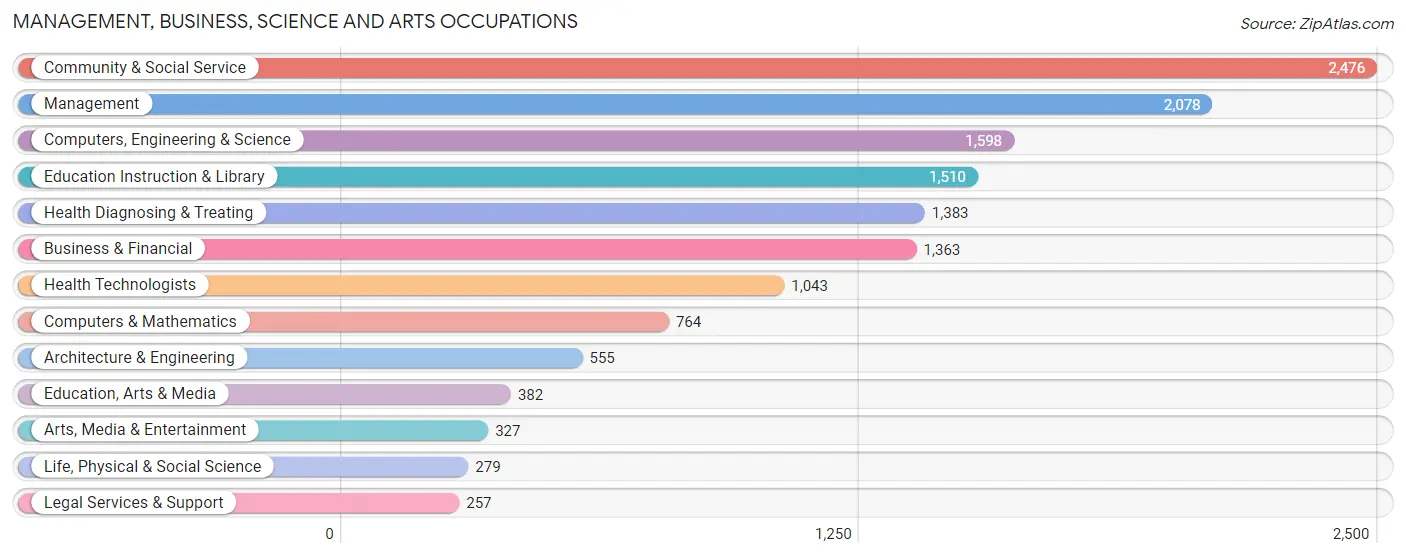
Management, Business, Science and Arts Occupations
The most common Management, Business, Science and Arts occupations in Pearl City are Community & Social Service (2,476 | 11.1%), Management (2,078 | 9.3%), Computers, Engineering & Science (1,598 | 7.1%), Education Instruction & Library (1,510 | 6.8%), and Health Diagnosing & Treating (1,383 | 6.2%).
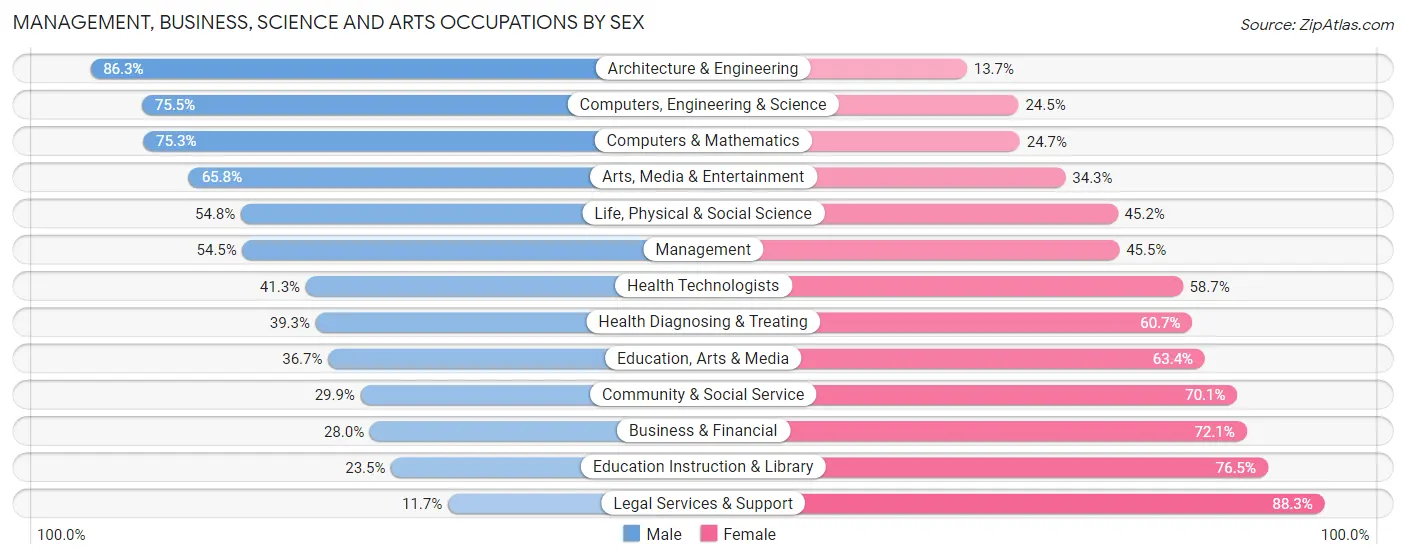
Management, Business, Science and Arts Occupations by Sex
Within the Management, Business, Science and Arts occupations in Pearl City, the most male-oriented occupations are Architecture & Engineering (86.3%), Computers, Engineering & Science (75.5%), and Computers & Mathematics (75.3%), while the most female-oriented occupations are Legal Services & Support (88.3%), Education Instruction & Library (76.5%), and Business & Financial (72.1%).
| Occupation | Male | Female |
| Management | 1,133 (54.5%) | 945 (45.5%) |
| Business & Financial | 381 (28.0%) | 982 (72.1%) |
| Computers, Engineering & Science | 1,207 (75.5%) | 391 (24.5%) |
| Computers & Mathematics | 575 (75.3%) | 189 (24.7%) |
| Architecture & Engineering | 479 (86.3%) | 76 (13.7%) |
| Life, Physical & Social Science | 153 (54.8%) | 126 (45.2%) |
| Community & Social Service | 740 (29.9%) | 1,736 (70.1%) |
| Education, Arts & Media | 140 (36.6%) | 242 (63.3%) |
| Legal Services & Support | 30 (11.7%) | 227 (88.3%) |
| Education Instruction & Library | 355 (23.5%) | 1,155 (76.5%) |
| Arts, Media & Entertainment | 215 (65.7%) | 112 (34.3%) |
| Health Diagnosing & Treating | 543 (39.3%) | 840 (60.7%) |
| Health Technologists | 431 (41.3%) | 612 (58.7%) |
| Total (Category) | 4,004 (45.0%) | 4,894 (55.0%) |
| Total (Overall) | 11,489 (51.3%) | 10,896 (48.7%) |
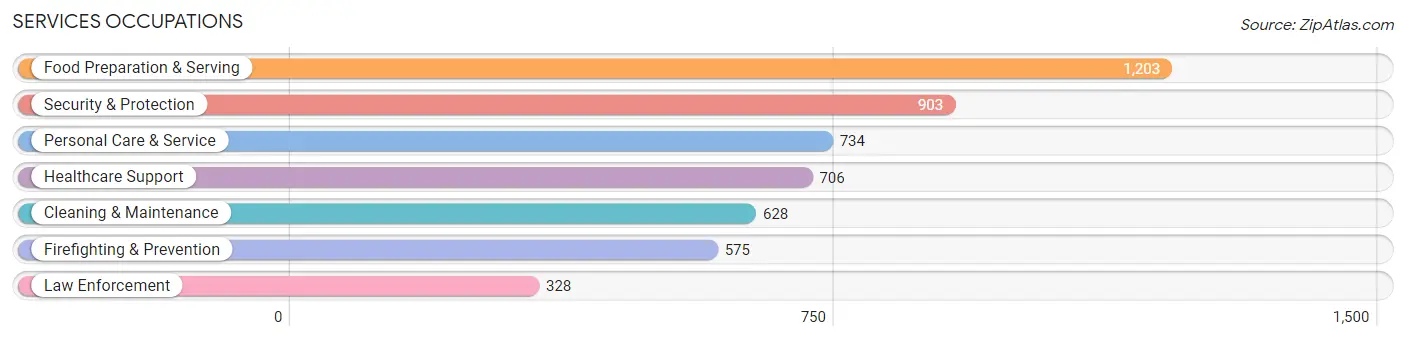
Services Occupations
The most common Services occupations in Pearl City are Food Preparation & Serving (1,203 | 5.4%), Security & Protection (903 | 4.0%), Personal Care & Service (734 | 3.3%), Healthcare Support (706 | 3.2%), and Cleaning & Maintenance (628 | 2.8%).
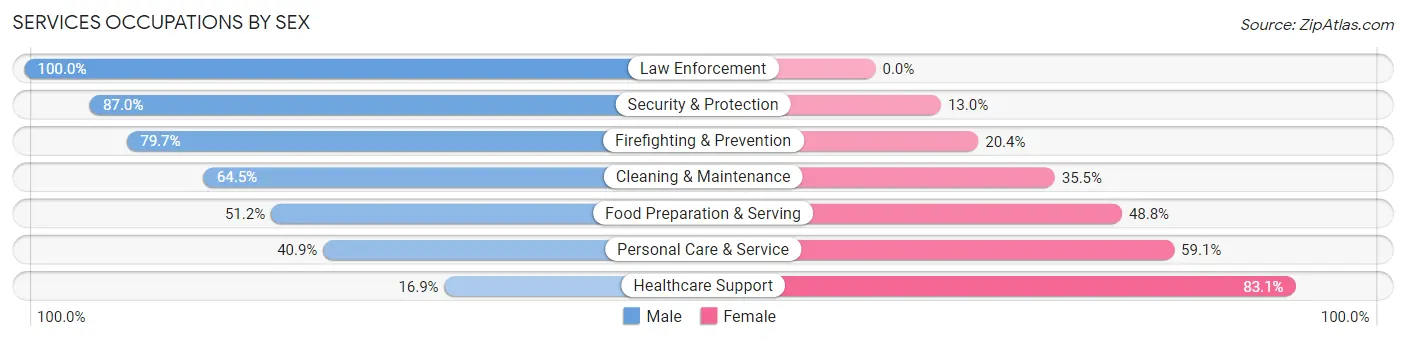
Services Occupations by Sex
Within the Services occupations in Pearl City, the most male-oriented occupations are Law Enforcement (100.0%), Security & Protection (87.0%), and Firefighting & Prevention (79.6%), while the most female-oriented occupations are Healthcare Support (83.1%), Personal Care & Service (59.1%), and Food Preparation & Serving (48.8%).
| Occupation | Male | Female |
| Healthcare Support | 119 (16.9%) | 587 (83.1%) |
| Security & Protection | 786 (87.0%) | 117 (13.0%) |
| Firefighting & Prevention | 458 (79.6%) | 117 (20.3%) |
| Law Enforcement | 328 (100.0%) | 0 (0.0%) |
| Food Preparation & Serving | 616 (51.2%) | 587 (48.8%) |
| Cleaning & Maintenance | 405 (64.5%) | 223 (35.5%) |
| Personal Care & Service | 300 (40.9%) | 434 (59.1%) |
| Total (Category) | 2,226 (53.3%) | 1,948 (46.7%) |
| Total (Overall) | 11,489 (51.3%) | 10,896 (48.7%) |
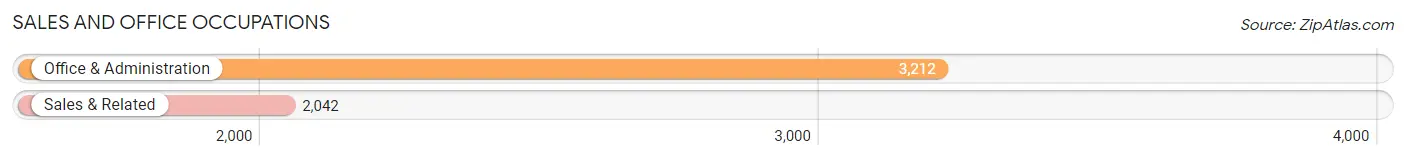
Sales and Office Occupations
The most common Sales and Office occupations in Pearl City are Office & Administration (3,212 | 14.3%), and Sales & Related (2,042 | 9.1%).
Sales and Office Occupations by Sex
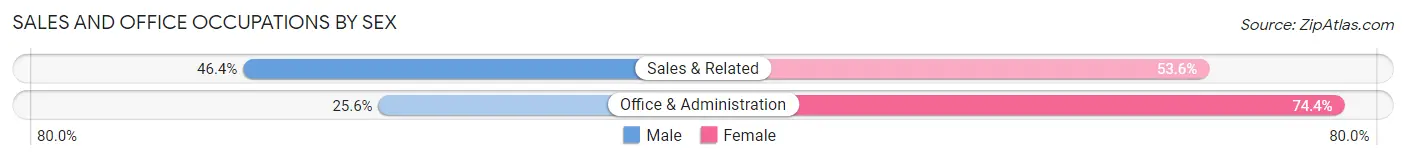
| Occupation | Male | Female |
| Sales & Related | 947 (46.4%) | 1,095 (53.6%) |
| Office & Administration | 821 (25.6%) | 2,391 (74.4%) |
| Total (Category) | 1,768 (33.7%) | 3,486 (66.3%) |
| Total (Overall) | 11,489 (51.3%) | 10,896 (48.7%) |
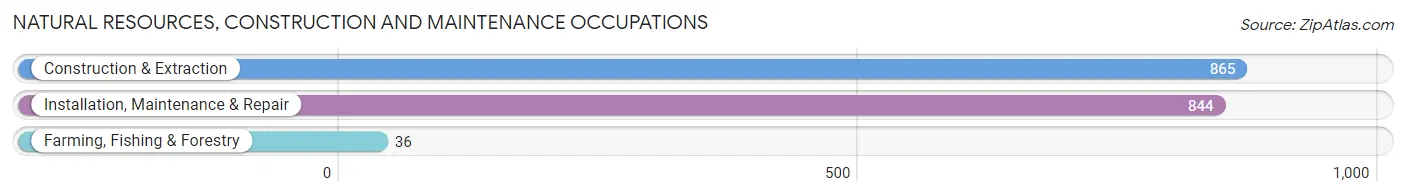
Natural Resources, Construction and Maintenance Occupations
The most common Natural Resources, Construction and Maintenance occupations in Pearl City are Construction & Extraction (865 | 3.9%), Installation, Maintenance & Repair (844 | 3.8%), and Farming, Fishing & Forestry (36 | 0.2%).
Natural Resources, Construction and Maintenance Occupations by Sex
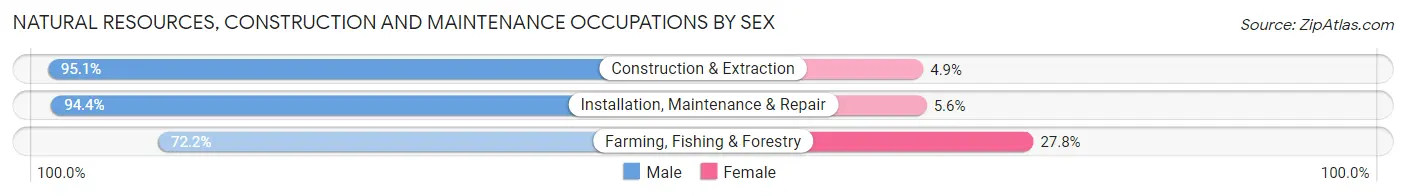
| Occupation | Male | Female |
| Farming, Fishing & Forestry | 26 (72.2%) | 10 (27.8%) |
| Construction & Extraction | 823 (95.1%) | 42 (4.9%) |
| Installation, Maintenance & Repair | 797 (94.4%) | 47 (5.6%) |
| Total (Category) | 1,646 (94.3%) | 99 (5.7%) |
| Total (Overall) | 11,489 (51.3%) | 10,896 (48.7%) |
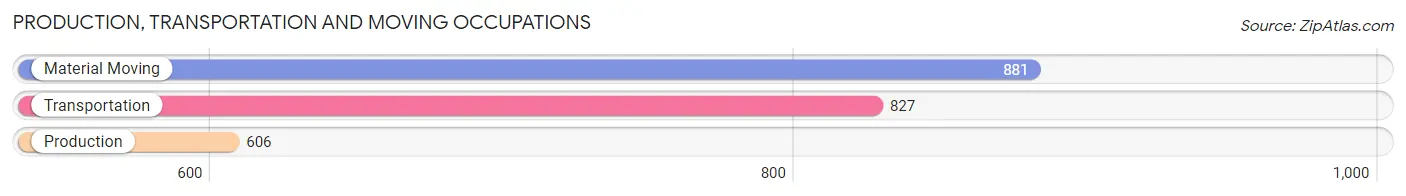
Production, Transportation and Moving Occupations
The most common Production, Transportation and Moving occupations in Pearl City are Material Moving (881 | 3.9%), Transportation (827 | 3.7%), and Production (606 | 2.7%).
Production, Transportation and Moving Occupations by Sex
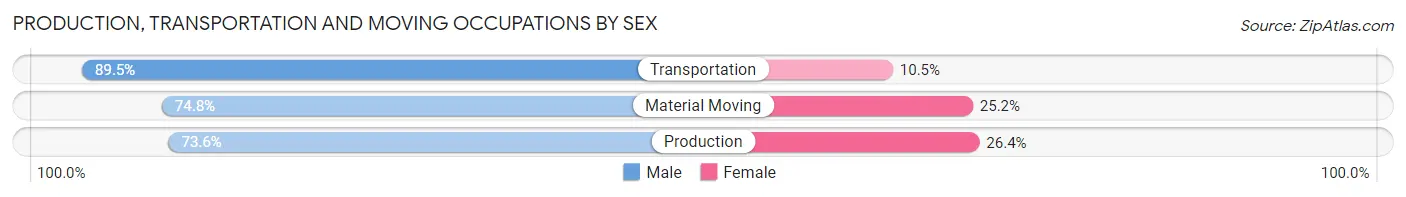
| Occupation | Male | Female |
| Production | 446 (73.6%) | 160 (26.4%) |
| Transportation | 740 (89.5%) | 87 (10.5%) |
| Material Moving | 659 (74.8%) | 222 (25.2%) |
| Total (Category) | 1,845 (79.7%) | 469 (20.3%) |
| Total (Overall) | 11,489 (51.3%) | 10,896 (48.7%) |
Employment Industries by Sex in Pearl City
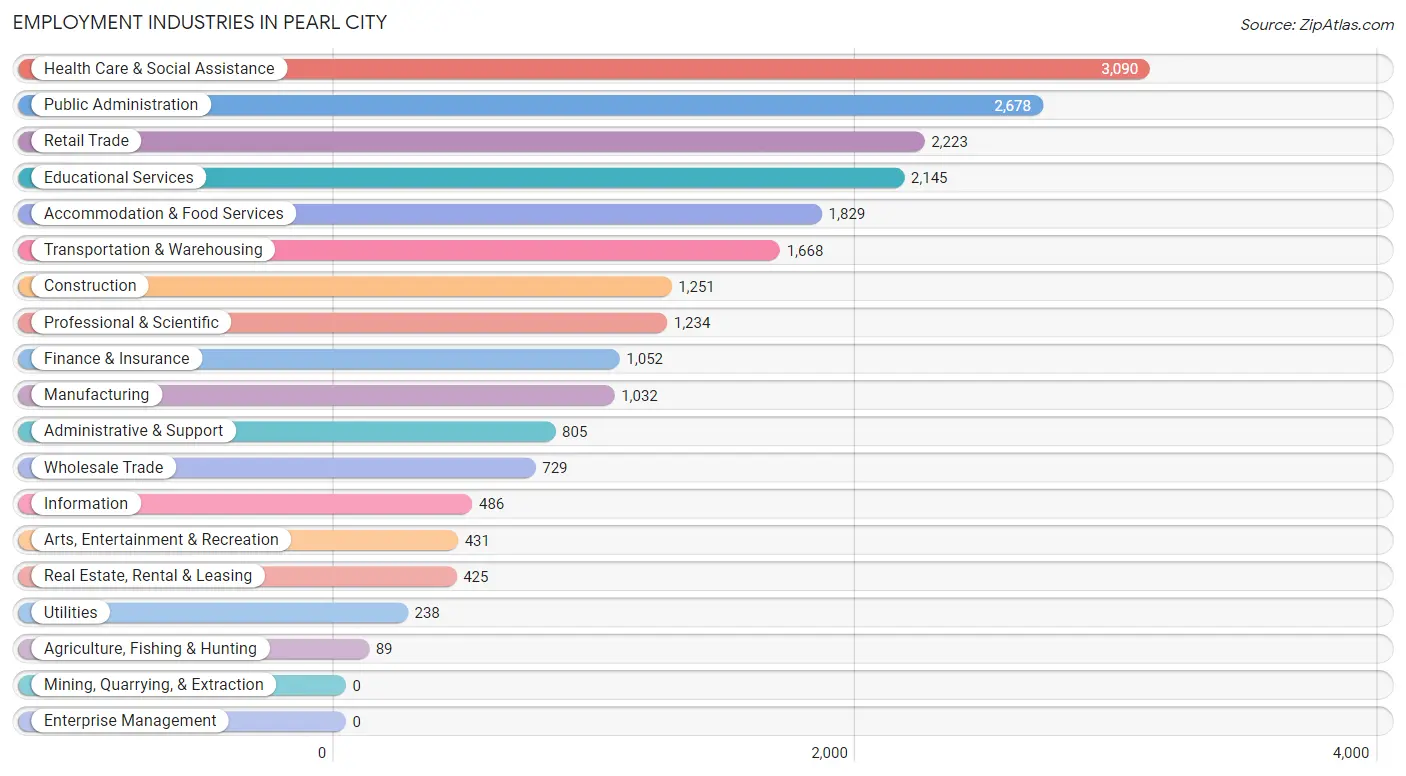
Employment Industries in Pearl City
The major employment industries in Pearl City include Health Care & Social Assistance (3,090 | 13.8%), Public Administration (2,678 | 12.0%), Retail Trade (2,223 | 9.9%), Educational Services (2,145 | 9.6%), and Accommodation & Food Services (1,829 | 8.2%).
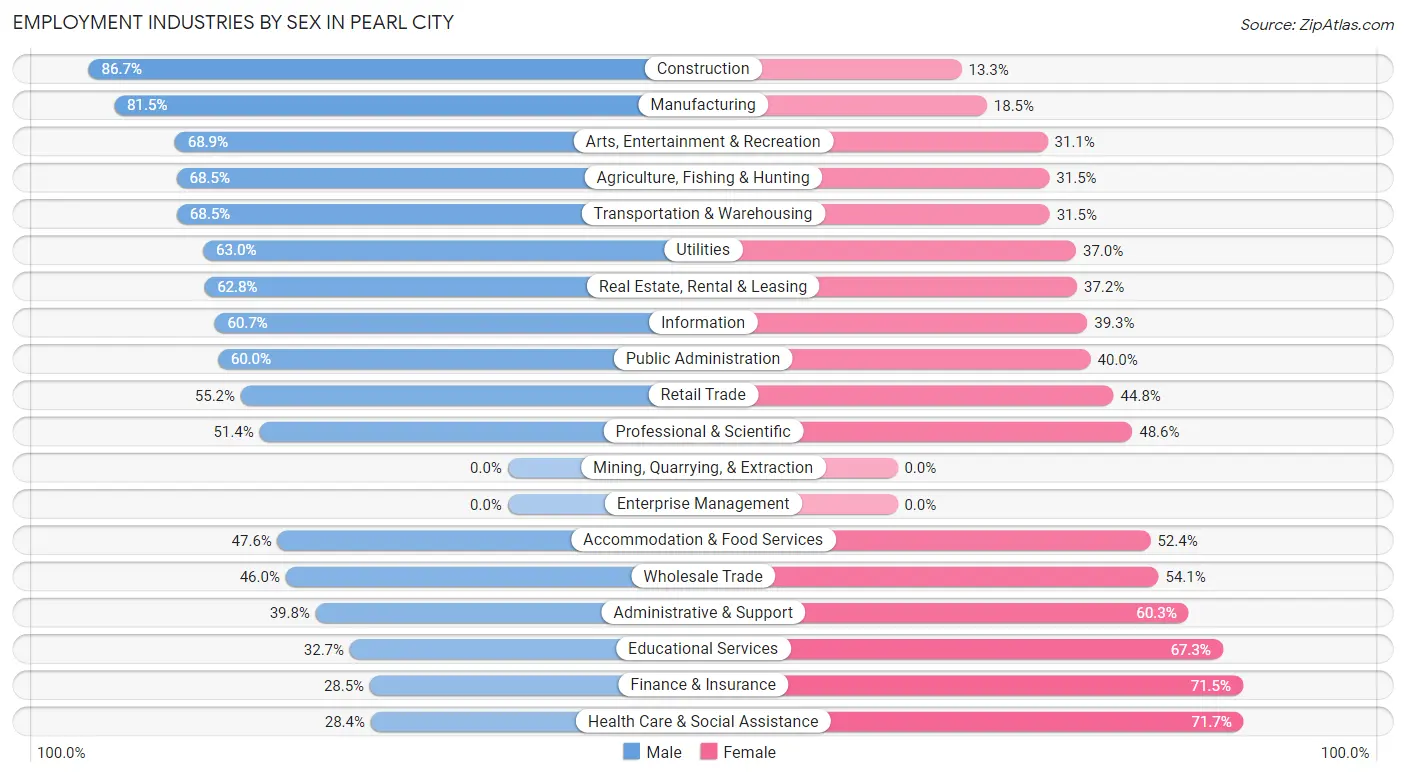
Employment Industries by Sex in Pearl City
The Pearl City industries that see more men than women are Construction (86.7%), Manufacturing (81.5%), and Arts, Entertainment & Recreation (68.9%), whereas the industries that tend to have a higher number of women are Health Care & Social Assistance (71.7%), Finance & Insurance (71.5%), and Educational Services (67.3%).
| Industry | Male | Female |
| Agriculture, Fishing & Hunting | 61 (68.5%) | 28 (31.5%) |
| Mining, Quarrying, & Extraction | 0 (0.0%) | 0 (0.0%) |
| Construction | 1,085 (86.7%) | 166 (13.3%) |
| Manufacturing | 841 (81.5%) | 191 (18.5%) |
| Wholesale Trade | 335 (46.0%) | 394 (54.0%) |
| Retail Trade | 1,228 (55.2%) | 995 (44.8%) |
| Transportation & Warehousing | 1,142 (68.5%) | 526 (31.5%) |
| Utilities | 150 (63.0%) | 88 (37.0%) |
| Information | 295 (60.7%) | 191 (39.3%) |
| Finance & Insurance | 300 (28.5%) | 752 (71.5%) |
| Real Estate, Rental & Leasing | 267 (62.8%) | 158 (37.2%) |
| Professional & Scientific | 634 (51.4%) | 600 (48.6%) |
| Enterprise Management | 0 (0.0%) | 0 (0.0%) |
| Administrative & Support | 320 (39.8%) | 485 (60.3%) |
| Educational Services | 701 (32.7%) | 1,444 (67.3%) |
| Health Care & Social Assistance | 876 (28.3%) | 2,214 (71.7%) |
| Arts, Entertainment & Recreation | 297 (68.9%) | 134 (31.1%) |
| Accommodation & Food Services | 871 (47.6%) | 958 (52.4%) |
| Public Administration | 1,607 (60.0%) | 1,071 (40.0%) |
| Total | 11,489 (51.3%) | 10,896 (48.7%) |
Education in Pearl City
School Enrollment in Pearl City
The most common levels of schooling among the 9,840 students in Pearl City are college / undergraduate (2,585 | 26.3%), high school (1,896 | 19.3%), and elementary school (1,803 | 18.3%).
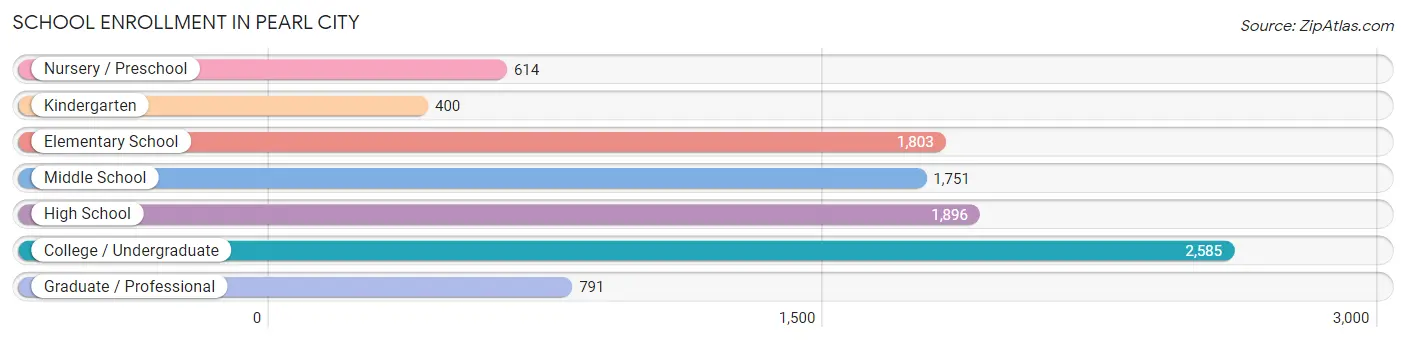
| School Level | # Students | % Students |
| Nursery / Preschool | 614 | 6.2% |
| Kindergarten | 400 | 4.1% |
| Elementary School | 1,803 | 18.3% |
| Middle School | 1,751 | 17.8% |
| High School | 1,896 | 19.3% |
| College / Undergraduate | 2,585 | 26.3% |
| Graduate / Professional | 791 | 8.0% |
| Total | 9,840 | 100.0% |
School Enrollment by Age by Funding Source in Pearl City
Out of a total of 9,840 students who are enrolled in schools in Pearl City, 2,312 (23.5%) attend a private institution, while the remaining 7,528 (76.5%) are enrolled in public schools. The age group of 3 to 4 year olds has the highest likelihood of being enrolled in private schools, with 337 (64.6% in the age bracket) enrolled. Conversely, the age group of 5 to 9 year old has the lowest likelihood of being enrolled in a private school, with 1,904 (87.0% in the age bracket) attending a public institution.
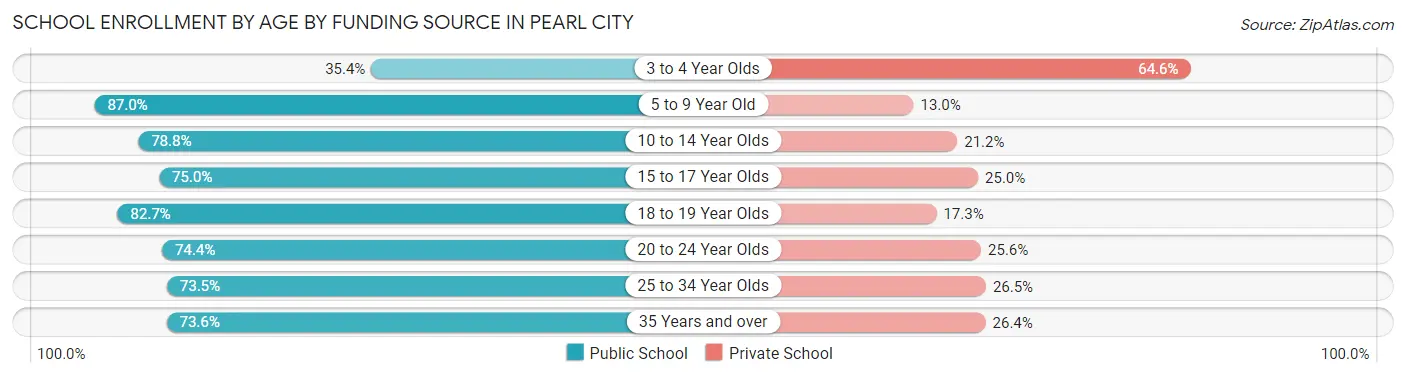
| Age Bracket | Public School | Private School |
| 3 to 4 Year Olds | 185 (35.4%) | 337 (64.6%) |
| 5 to 9 Year Old | 1,904 (87.0%) | 285 (13.0%) |
| 10 to 14 Year Olds | 1,910 (78.8%) | 513 (21.2%) |
| 15 to 17 Year Olds | 925 (75.0%) | 309 (25.0%) |
| 18 to 19 Year Olds | 330 (82.7%) | 69 (17.3%) |
| 20 to 24 Year Olds | 898 (74.4%) | 309 (25.6%) |
| 25 to 34 Year Olds | 696 (73.5%) | 251 (26.5%) |
| 35 Years and over | 676 (73.6%) | 243 (26.4%) |
| Total | 7,528 (76.5%) | 2,312 (23.5%) |
Educational Attainment by Field of Study in Pearl City
Business (2,572 | 19.4%), education (2,031 | 15.3%), science & technology (1,347 | 10.1%), engineering (1,147 | 8.6%), and arts & humanities (967 | 7.3%) are the most common fields of study among 13,287 individuals in Pearl City who have obtained a bachelor's degree or higher.
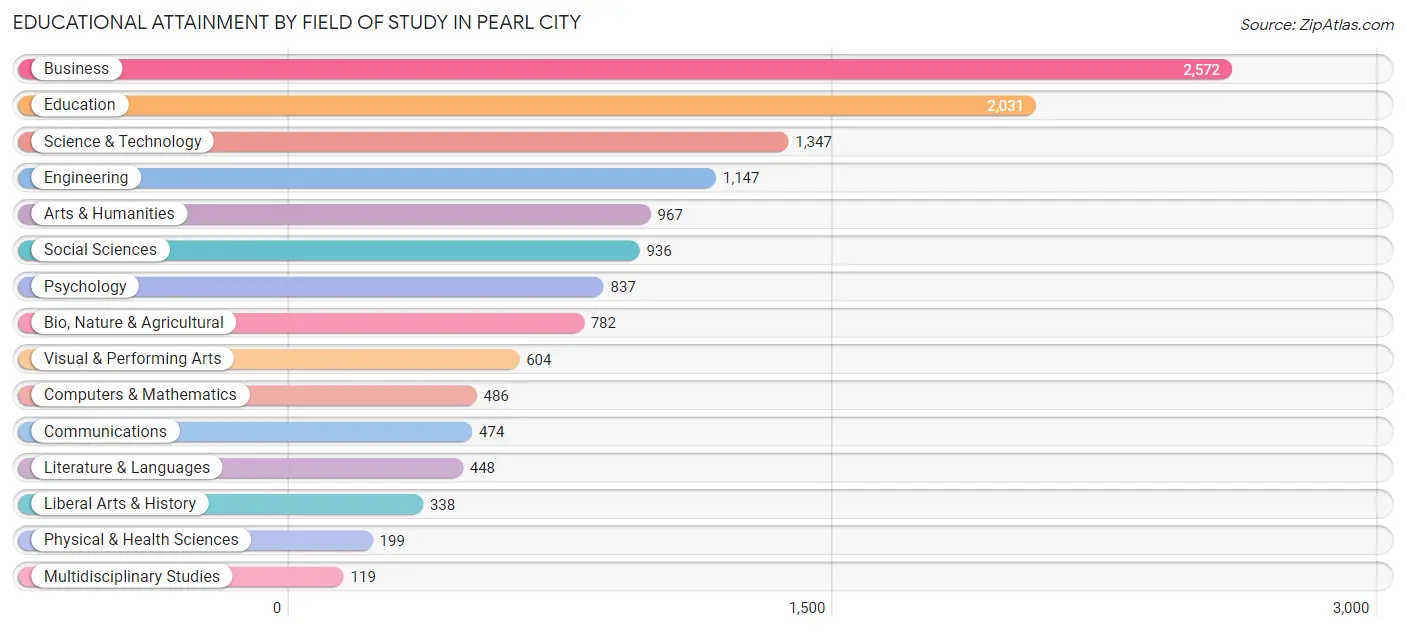
| Field of Study | # Graduates | % Graduates |
| Computers & Mathematics | 486 | 3.7% |
| Bio, Nature & Agricultural | 782 | 5.9% |
| Physical & Health Sciences | 199 | 1.5% |
| Psychology | 837 | 6.3% |
| Social Sciences | 936 | 7.0% |
| Engineering | 1,147 | 8.6% |
| Multidisciplinary Studies | 119 | 0.9% |
| Science & Technology | 1,347 | 10.1% |
| Business | 2,572 | 19.4% |
| Education | 2,031 | 15.3% |
| Literature & Languages | 448 | 3.4% |
| Liberal Arts & History | 338 | 2.5% |
| Visual & Performing Arts | 604 | 4.5% |
| Communications | 474 | 3.6% |
| Arts & Humanities | 967 | 7.3% |
| Total | 13,287 | 100.0% |
Transportation & Commute in Pearl City
Vehicle Availability by Sex in Pearl City
The most prevalent vehicle ownership categories in Pearl City are males with 2 vehicles (4,422, accounting for 36.1%) and females with 2 vehicles (4,014, making up 41.4%).
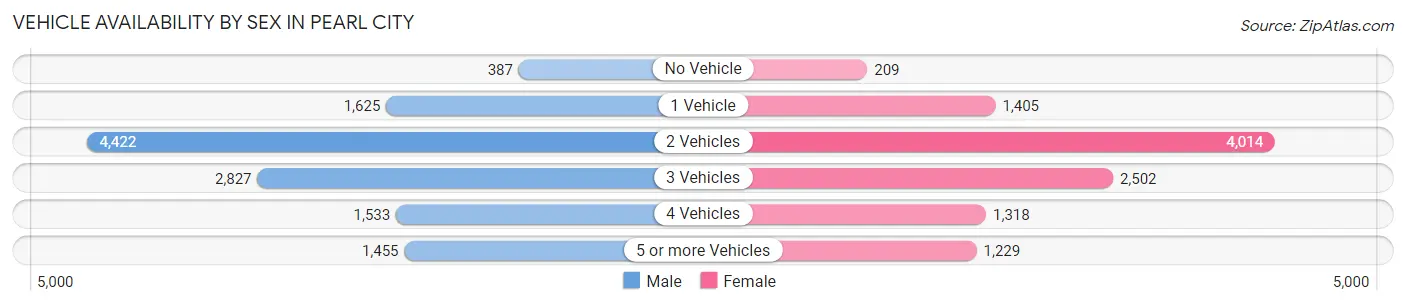
| Vehicles Available | Male | Female |
| No Vehicle | 387 (3.2%) | 209 (2.0%) |
| 1 Vehicle | 1,625 (13.3%) | 1,405 (13.2%) |
| 2 Vehicles | 4,422 (36.1%) | 4,014 (37.6%) |
| 3 Vehicles | 2,827 (23.1%) | 2,502 (23.4%) |
| 4 Vehicles | 1,533 (12.5%) | 1,318 (12.3%) |
| 5 or more Vehicles | 1,455 (11.9%) | 1,229 (11.5%) |
| Total | 12,249 (100.0%) | 10,677 (100.0%) |
Commute Time in Pearl City
The most frequently occuring commute durations in Pearl City are 30 to 34 minutes (4,945 commuters, 23.1%), 20 to 24 minutes (4,095 commuters, 19.1%), and 15 to 19 minutes (3,117 commuters, 14.5%).
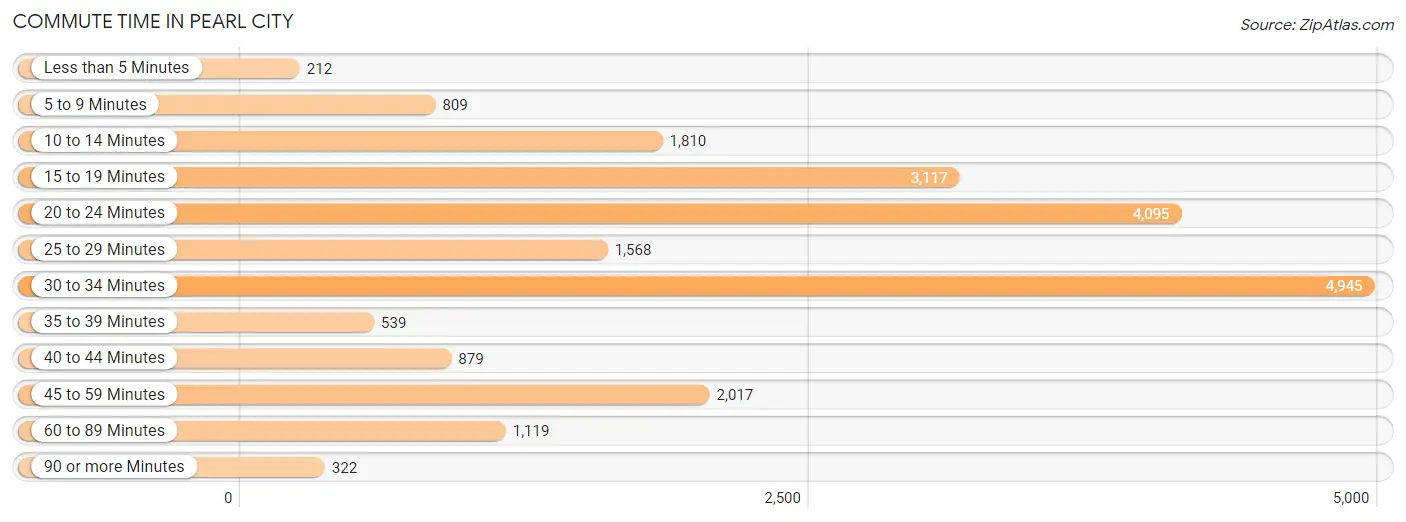
| Commute Time | # Commuters | % Commuters |
| Less than 5 Minutes | 212 | 1.0% |
| 5 to 9 Minutes | 809 | 3.8% |
| 10 to 14 Minutes | 1,810 | 8.5% |
| 15 to 19 Minutes | 3,117 | 14.5% |
| 20 to 24 Minutes | 4,095 | 19.1% |
| 25 to 29 Minutes | 1,568 | 7.3% |
| 30 to 34 Minutes | 4,945 | 23.1% |
| 35 to 39 Minutes | 539 | 2.5% |
| 40 to 44 Minutes | 879 | 4.1% |
| 45 to 59 Minutes | 2,017 | 9.4% |
| 60 to 89 Minutes | 1,119 | 5.2% |
| 90 or more Minutes | 322 | 1.5% |
Commute Time by Sex in Pearl City
The most common commute times in Pearl City are 30 to 34 minutes (2,722 commuters, 23.0%) for males and 30 to 34 minutes (2,223 commuters, 23.2%) for females.
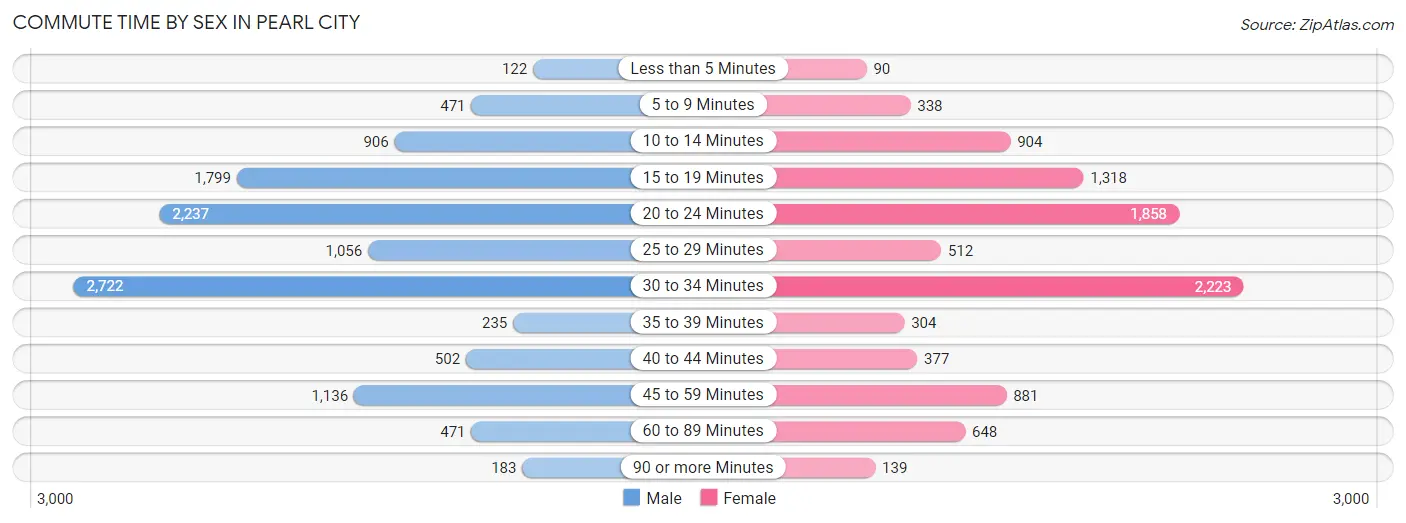
| Commute Time | Male | Female |
| Less than 5 Minutes | 122 (1.0%) | 90 (0.9%) |
| 5 to 9 Minutes | 471 (4.0%) | 338 (3.5%) |
| 10 to 14 Minutes | 906 (7.6%) | 904 (9.4%) |
| 15 to 19 Minutes | 1,799 (15.2%) | 1,318 (13.7%) |
| 20 to 24 Minutes | 2,237 (18.9%) | 1,858 (19.4%) |
| 25 to 29 Minutes | 1,056 (8.9%) | 512 (5.3%) |
| 30 to 34 Minutes | 2,722 (23.0%) | 2,223 (23.2%) |
| 35 to 39 Minutes | 235 (2.0%) | 304 (3.2%) |
| 40 to 44 Minutes | 502 (4.2%) | 377 (3.9%) |
| 45 to 59 Minutes | 1,136 (9.6%) | 881 (9.2%) |
| 60 to 89 Minutes | 471 (4.0%) | 648 (6.8%) |
| 90 or more Minutes | 183 (1.5%) | 139 (1.5%) |
Time of Departure to Work by Sex in Pearl City
The most frequent times of departure to work in Pearl City are 6:00 AM to 6:29 AM (1,459, 12.3%) for males and 7:00 AM to 7:29 AM (1,612, 16.8%) for females.
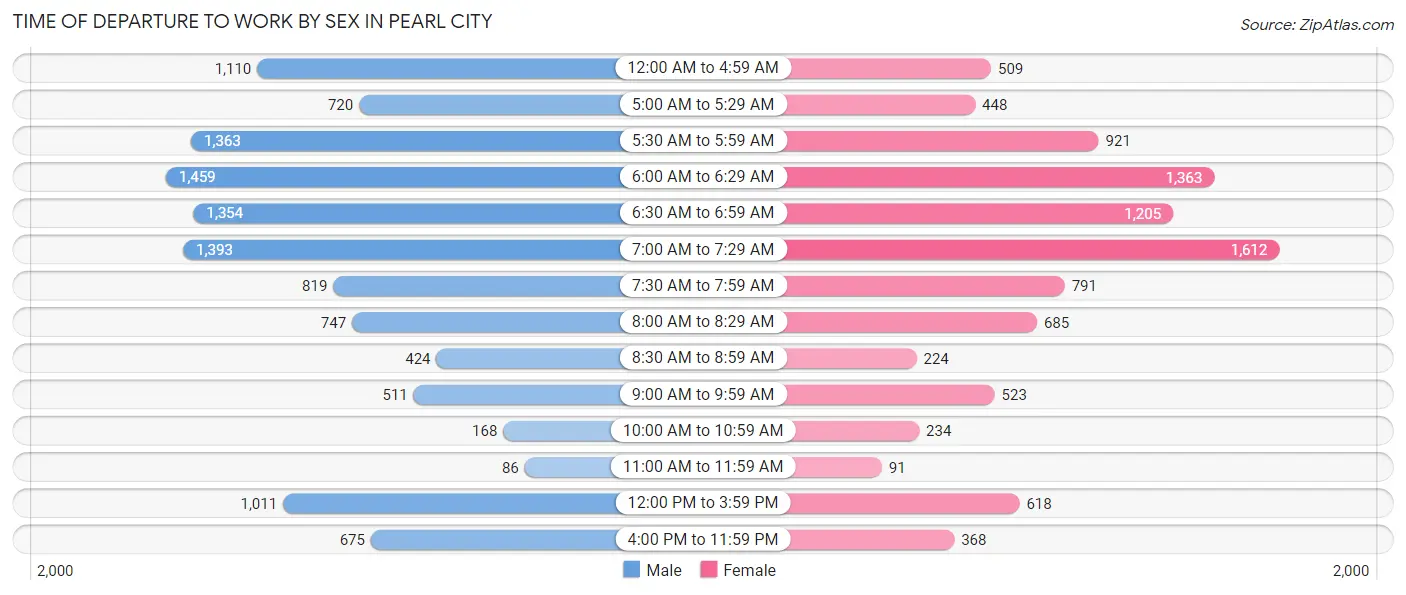
| Time of Departure | Male | Female |
| 12:00 AM to 4:59 AM | 1,110 (9.4%) | 509 (5.3%) |
| 5:00 AM to 5:29 AM | 720 (6.1%) | 448 (4.7%) |
| 5:30 AM to 5:59 AM | 1,363 (11.5%) | 921 (9.6%) |
| 6:00 AM to 6:29 AM | 1,459 (12.3%) | 1,363 (14.2%) |
| 6:30 AM to 6:59 AM | 1,354 (11.4%) | 1,205 (12.6%) |
| 7:00 AM to 7:29 AM | 1,393 (11.8%) | 1,612 (16.8%) |
| 7:30 AM to 7:59 AM | 819 (6.9%) | 791 (8.3%) |
| 8:00 AM to 8:29 AM | 747 (6.3%) | 685 (7.1%) |
| 8:30 AM to 8:59 AM | 424 (3.6%) | 224 (2.3%) |
| 9:00 AM to 9:59 AM | 511 (4.3%) | 523 (5.4%) |
| 10:00 AM to 10:59 AM | 168 (1.4%) | 234 (2.4%) |
| 11:00 AM to 11:59 AM | 86 (0.7%) | 91 (0.9%) |
| 12:00 PM to 3:59 PM | 1,011 (8.5%) | 618 (6.4%) |
| 4:00 PM to 11:59 PM | 675 (5.7%) | 368 (3.8%) |
| Total | 11,840 (100.0%) | 9,592 (100.0%) |
Housing Occupancy in Pearl City
Occupancy by Ownership in Pearl City
Of the total 14,987 dwellings in Pearl City, owner-occupied units account for 10,590 (70.7%), while renter-occupied units make up 4,397 (29.3%).
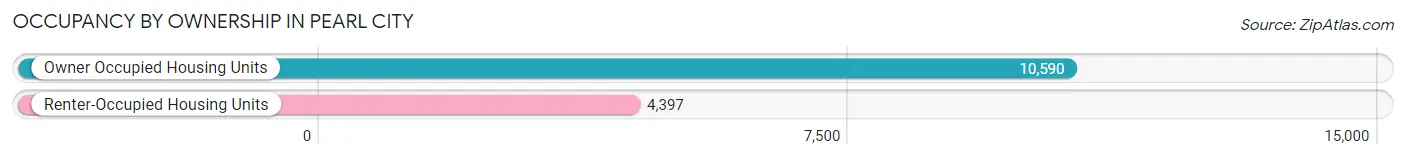
| Occupancy | # Housing Units | % Housing Units |
| Owner Occupied Housing Units | 10,590 | 70.7% |
| Renter-Occupied Housing Units | 4,397 | 29.3% |
| Total Occupied Housing Units | 14,987 | 100.0% |
Occupancy by Household Size in Pearl City
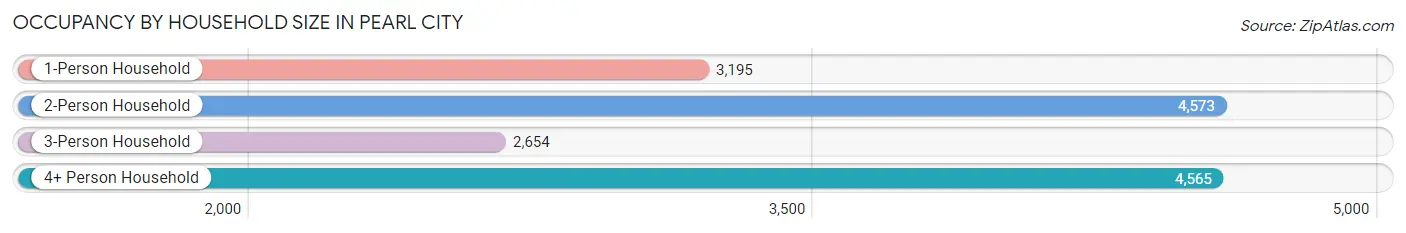
| Household Size | # Housing Units | % Housing Units |
| 1-Person Household | 3,195 | 21.3% |
| 2-Person Household | 4,573 | 30.5% |
| 3-Person Household | 2,654 | 17.7% |
| 4+ Person Household | 4,565 | 30.5% |
| Total Housing Units | 14,987 | 100.0% |
Occupancy by Ownership by Household Size in Pearl City
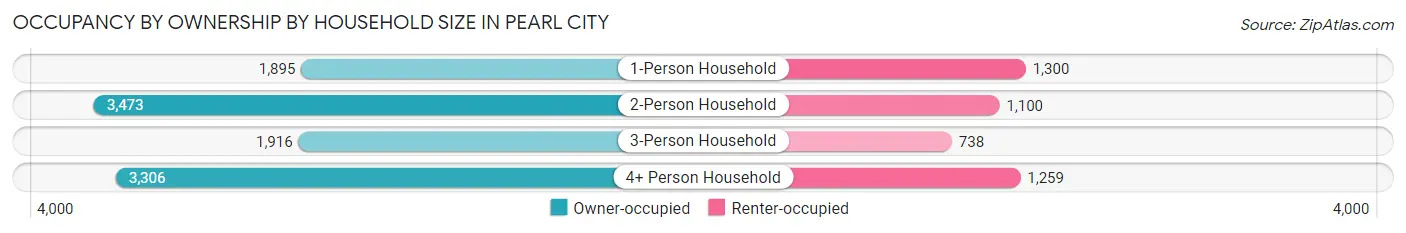
| Household Size | Owner-occupied | Renter-occupied |
| 1-Person Household | 1,895 (59.3%) | 1,300 (40.7%) |
| 2-Person Household | 3,473 (75.9%) | 1,100 (24.0%) |
| 3-Person Household | 1,916 (72.2%) | 738 (27.8%) |
| 4+ Person Household | 3,306 (72.4%) | 1,259 (27.6%) |
| Total Housing Units | 10,590 (70.7%) | 4,397 (29.3%) |
Occupancy by Educational Attainment in Pearl City
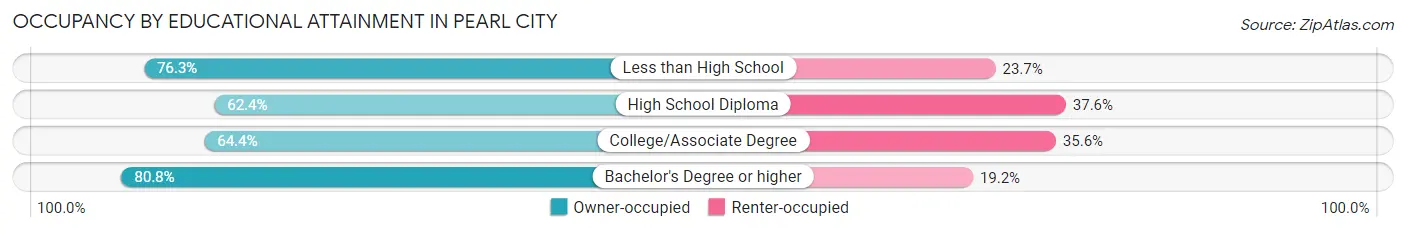
| Household Size | Owner-occupied | Renter-occupied |
| Less than High School | 432 (76.3%) | 134 (23.7%) |
| High School Diploma | 1,981 (62.4%) | 1,194 (37.6%) |
| College/Associate Degree | 3,563 (64.4%) | 1,973 (35.6%) |
| Bachelor's Degree or higher | 4,614 (80.8%) | 1,096 (19.2%) |
Occupancy by Age of Householder in Pearl City
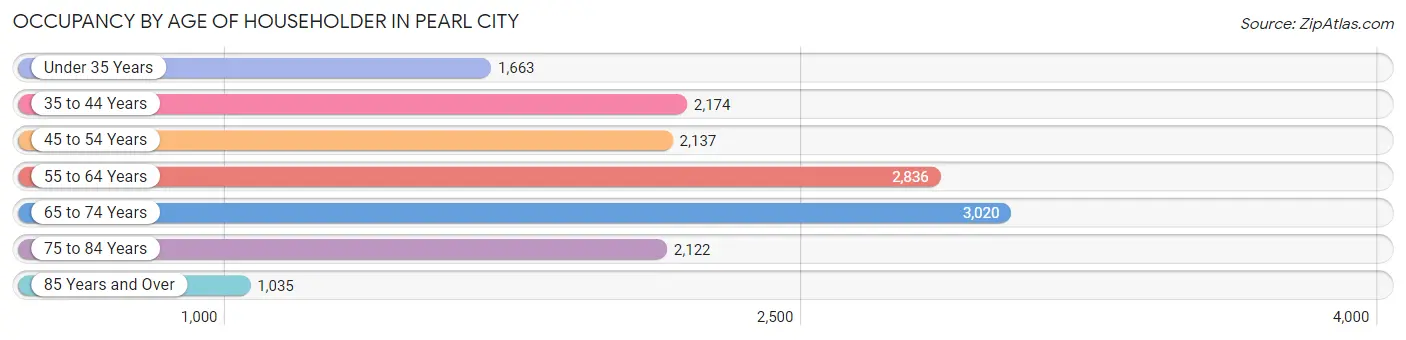
| Age Bracket | # Households | % Households |
| Under 35 Years | 1,663 | 11.1% |
| 35 to 44 Years | 2,174 | 14.5% |
| 45 to 54 Years | 2,137 | 14.3% |
| 55 to 64 Years | 2,836 | 18.9% |
| 65 to 74 Years | 3,020 | 20.2% |
| 75 to 84 Years | 2,122 | 14.2% |
| 85 Years and Over | 1,035 | 6.9% |
| Total | 14,987 | 100.0% |
Housing Finances in Pearl City
Median Income by Occupancy in Pearl City
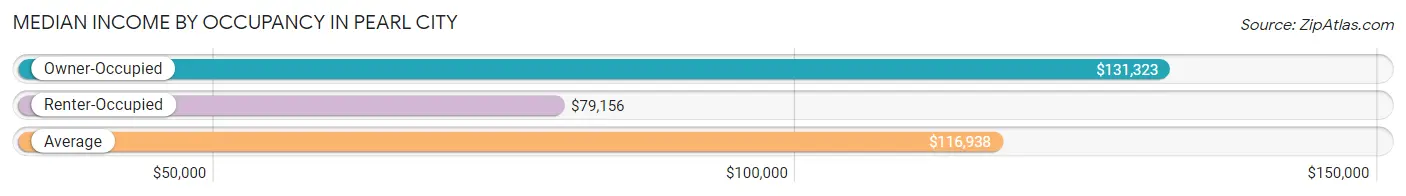
| Occupancy Type | # Households | Median Income |
| Owner-Occupied | 10,590 (70.7%) | $131,323 |
| Renter-Occupied | 4,397 (29.3%) | $79,156 |
| Average | 14,987 (100.0%) | $116,938 |
Occupancy by Householder Income Bracket in Pearl City
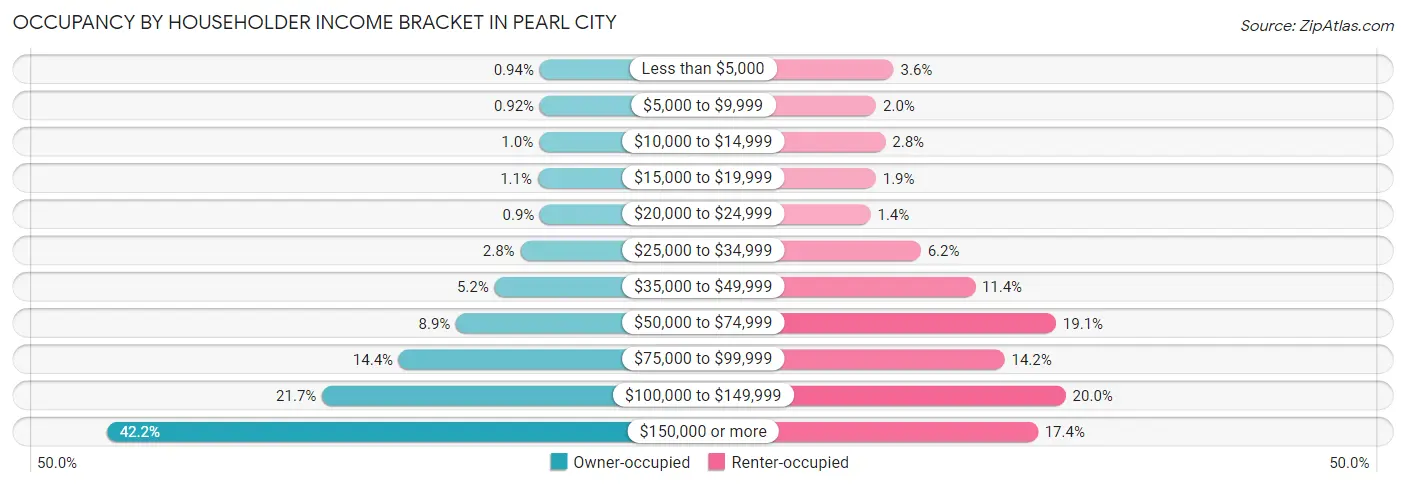
| Income Bracket | Owner-occupied | Renter-occupied |
| Less than $5,000 | 100 (0.9%) | 159 (3.6%) |
| $5,000 to $9,999 | 97 (0.9%) | 86 (2.0%) |
| $10,000 to $14,999 | 107 (1.0%) | 125 (2.8%) |
| $15,000 to $19,999 | 119 (1.1%) | 85 (1.9%) |
| $20,000 to $24,999 | 95 (0.9%) | 63 (1.4%) |
| $25,000 to $34,999 | 294 (2.8%) | 273 (6.2%) |
| $35,000 to $49,999 | 555 (5.2%) | 500 (11.4%) |
| $50,000 to $74,999 | 942 (8.9%) | 839 (19.1%) |
| $75,000 to $99,999 | 1,520 (14.3%) | 624 (14.2%) |
| $100,000 to $149,999 | 2,294 (21.7%) | 880 (20.0%) |
| $150,000 or more | 4,467 (42.2%) | 763 (17.3%) |
| Total | 10,590 (100.0%) | 4,397 (100.0%) |
Monthly Housing Cost Tiers in Pearl City
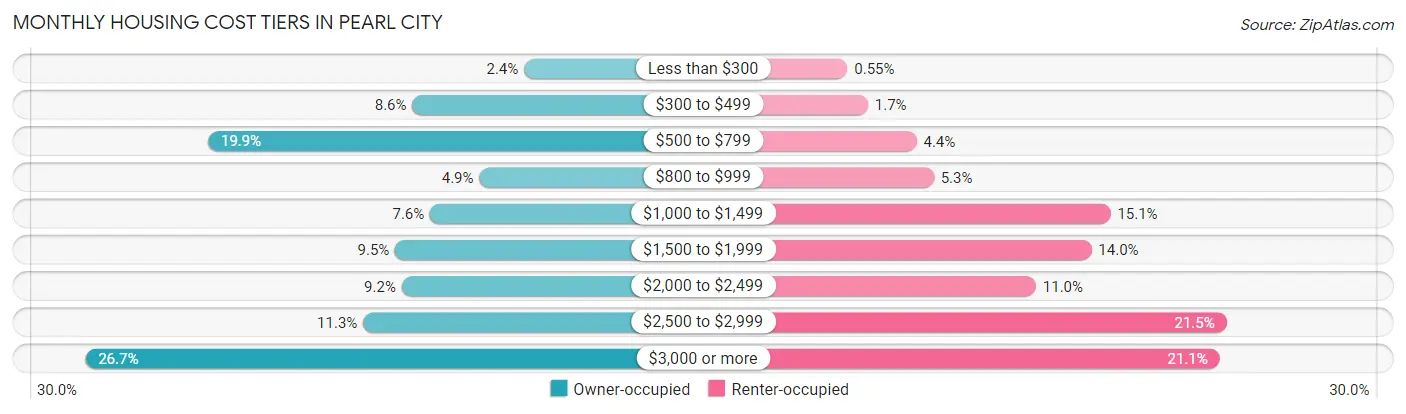
| Monthly Cost | Owner-occupied | Renter-occupied |
| Less than $300 | 255 (2.4%) | 24 (0.5%) |
| $300 to $499 | 909 (8.6%) | 74 (1.7%) |
| $500 to $799 | 2,105 (19.9%) | 192 (4.4%) |
| $800 to $999 | 517 (4.9%) | 234 (5.3%) |
| $1,000 to $1,499 | 805 (7.6%) | 663 (15.1%) |
| $1,500 to $1,999 | 1,009 (9.5%) | 617 (14.0%) |
| $2,000 to $2,499 | 971 (9.2%) | 482 (11.0%) |
| $2,500 to $2,999 | 1,197 (11.3%) | 945 (21.5%) |
| $3,000 or more | 2,822 (26.7%) | 928 (21.1%) |
| Total | 10,590 (100.0%) | 4,397 (100.0%) |
Physical Housing Characteristics in Pearl City
Housing Structures in Pearl City
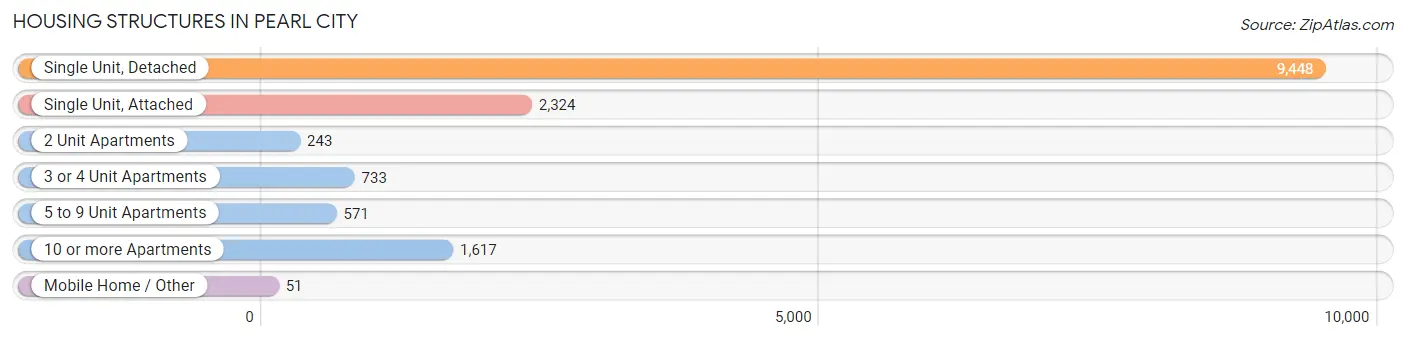
| Structure Type | # Housing Units | % Housing Units |
| Single Unit, Detached | 9,448 | 63.0% |
| Single Unit, Attached | 2,324 | 15.5% |
| 2 Unit Apartments | 243 | 1.6% |
| 3 or 4 Unit Apartments | 733 | 4.9% |
| 5 to 9 Unit Apartments | 571 | 3.8% |
| 10 or more Apartments | 1,617 | 10.8% |
| Mobile Home / Other | 51 | 0.3% |
| Total | 14,987 | 100.0% |
Housing Structures by Occupancy in Pearl City
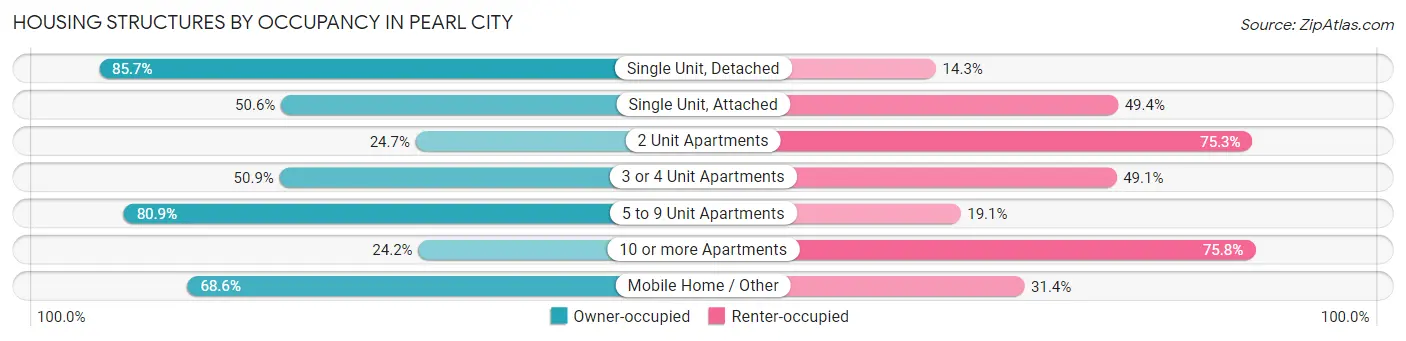
| Structure Type | Owner-occupied | Renter-occupied |
| Single Unit, Detached | 8,093 (85.7%) | 1,355 (14.3%) |
| Single Unit, Attached | 1,176 (50.6%) | 1,148 (49.4%) |
| 2 Unit Apartments | 60 (24.7%) | 183 (75.3%) |
| 3 or 4 Unit Apartments | 373 (50.9%) | 360 (49.1%) |
| 5 to 9 Unit Apartments | 462 (80.9%) | 109 (19.1%) |
| 10 or more Apartments | 391 (24.2%) | 1,226 (75.8%) |
| Mobile Home / Other | 35 (68.6%) | 16 (31.4%) |
| Total | 10,590 (70.7%) | 4,397 (29.3%) |
Housing Structures by Number of Rooms in Pearl City
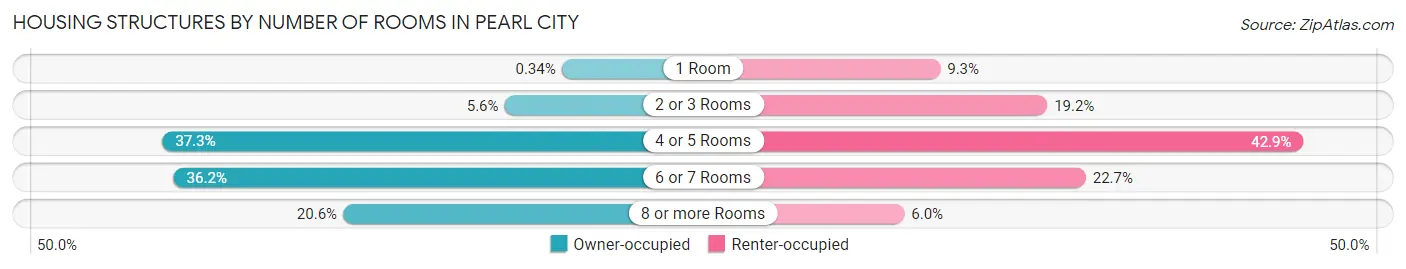
| Number of Rooms | Owner-occupied | Renter-occupied |
| 1 Room | 36 (0.3%) | 408 (9.3%) |
| 2 or 3 Rooms | 596 (5.6%) | 843 (19.2%) |
| 4 or 5 Rooms | 3,946 (37.3%) | 1,884 (42.8%) |
| 6 or 7 Rooms | 3,835 (36.2%) | 1,000 (22.7%) |
| 8 or more Rooms | 2,177 (20.6%) | 262 (6.0%) |
| Total | 10,590 (100.0%) | 4,397 (100.0%) |
Housing Structure by Heating Type in Pearl City
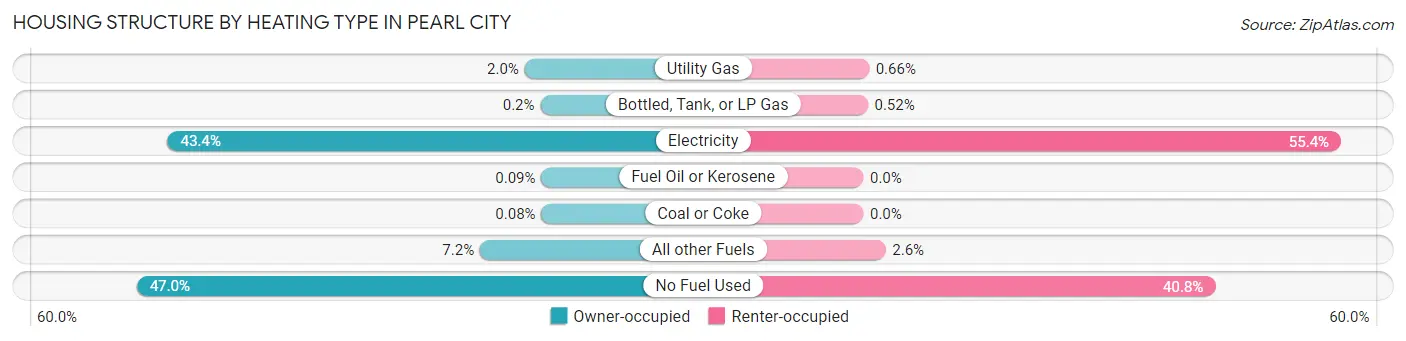
| Heating Type | Owner-occupied | Renter-occupied |
| Utility Gas | 214 (2.0%) | 29 (0.7%) |
| Bottled, Tank, or LP Gas | 21 (0.2%) | 23 (0.5%) |
| Electricity | 4,598 (43.4%) | 2,436 (55.4%) |
| Fuel Oil or Kerosene | 10 (0.1%) | 0 (0.0%) |
| Coal or Coke | 8 (0.1%) | 0 (0.0%) |
| All other Fuels | 762 (7.2%) | 114 (2.6%) |
| No Fuel Used | 4,977 (47.0%) | 1,795 (40.8%) |
| Total | 10,590 (100.0%) | 4,397 (100.0%) |
Household Vehicle Usage in Pearl City
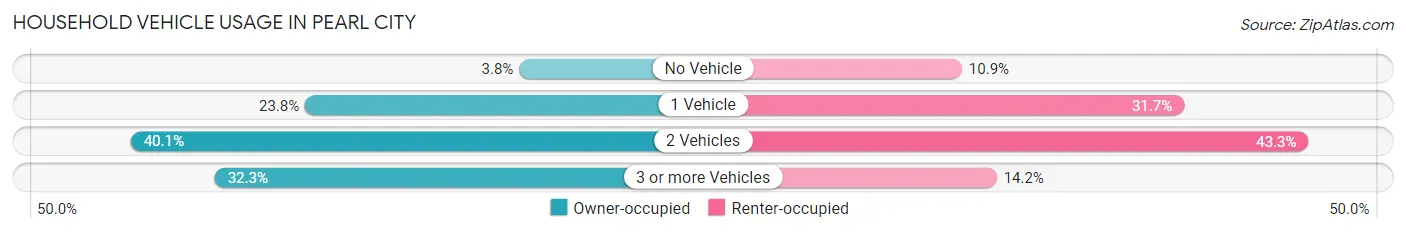
| Vehicles per Household | Owner-occupied | Renter-occupied |
| No Vehicle | 406 (3.8%) | 480 (10.9%) |
| 1 Vehicle | 2,523 (23.8%) | 1,392 (31.7%) |
| 2 Vehicles | 4,246 (40.1%) | 1,902 (43.3%) |
| 3 or more Vehicles | 3,415 (32.3%) | 623 (14.2%) |
| Total | 10,590 (100.0%) | 4,397 (100.0%) |
Real Estate & Mortgages in Pearl City
Real Estate and Mortgage Overview in Pearl City
| Characteristic | Without Mortgage | With Mortgage |
| Housing Units | 3,691 | 6,899 |
| Median Property Value | $844,200 | $836,300 |
| Median Household Income | $104,107 | $3,236 |
| Monthly Housing Costs | $596 | $2,822 |
| Real Estate Taxes | $2,430 | $354 |
Property Value by Mortgage Status in Pearl City
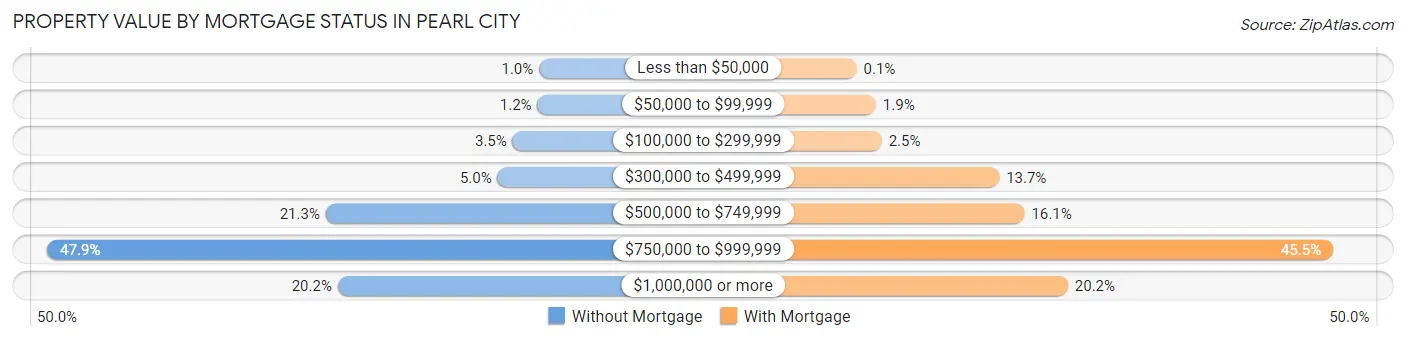
| Property Value | Without Mortgage | With Mortgage |
| Less than $50,000 | 37 (1.0%) | 7 (0.1%) |
| $50,000 to $99,999 | 43 (1.2%) | 134 (1.9%) |
| $100,000 to $299,999 | 130 (3.5%) | 172 (2.5%) |
| $300,000 to $499,999 | 183 (5.0%) | 944 (13.7%) |
| $500,000 to $749,999 | 787 (21.3%) | 1,110 (16.1%) |
| $750,000 to $999,999 | 1,766 (47.8%) | 3,137 (45.5%) |
| $1,000,000 or more | 745 (20.2%) | 1,395 (20.2%) |
| Total | 3,691 (100.0%) | 6,899 (100.0%) |
Household Income by Mortgage Status in Pearl City
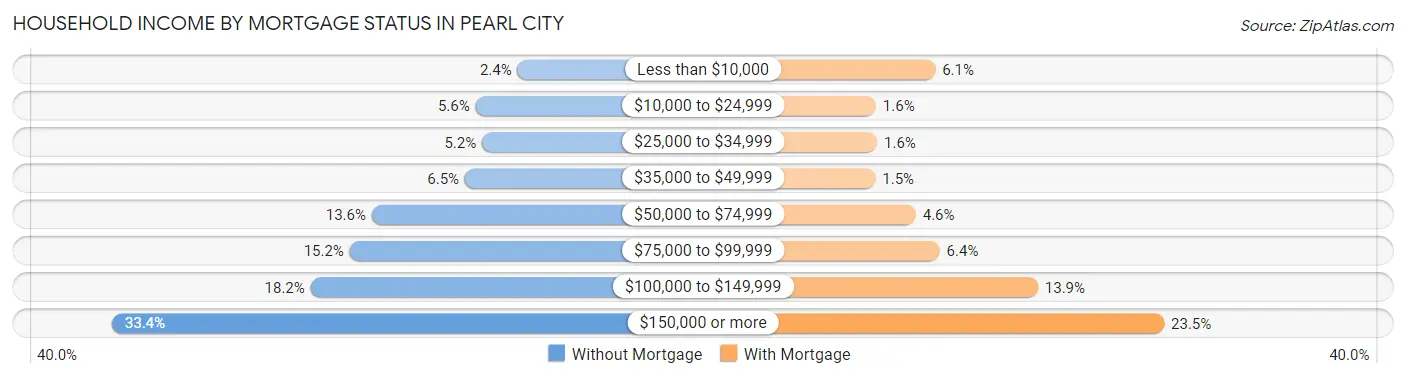
| Household Income | Without Mortgage | With Mortgage |
| Less than $10,000 | 90 (2.4%) | 419 (6.1%) |
| $10,000 to $24,999 | 208 (5.6%) | 107 (1.5%) |
| $25,000 to $34,999 | 190 (5.1%) | 113 (1.6%) |
| $35,000 to $49,999 | 238 (6.5%) | 104 (1.5%) |
| $50,000 to $74,999 | 500 (13.6%) | 317 (4.6%) |
| $75,000 to $99,999 | 562 (15.2%) | 442 (6.4%) |
| $100,000 to $149,999 | 672 (18.2%) | 958 (13.9%) |
| $150,000 or more | 1,231 (33.4%) | 1,622 (23.5%) |
| Total | 3,691 (100.0%) | 6,899 (100.0%) |
Property Value to Household Income Ratio in Pearl City
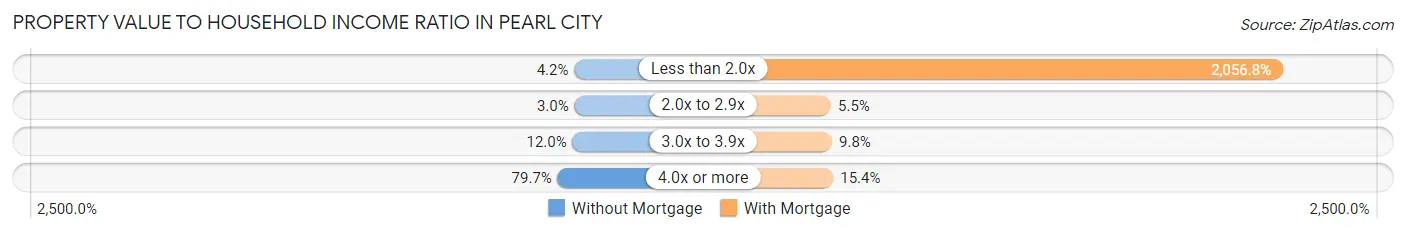
| Value-to-Income Ratio | Without Mortgage | With Mortgage |
| Less than 2.0x | 153 (4.2%) | 141,901 (2,056.8%) |
| 2.0x to 2.9x | 110 (3.0%) | 379 (5.5%) |
| 3.0x to 3.9x | 444 (12.0%) | 675 (9.8%) |
| 4.0x or more | 2,942 (79.7%) | 1,063 (15.4%) |
| Total | 3,691 (100.0%) | 6,899 (100.0%) |
Real Estate Taxes by Mortgage Status in Pearl City
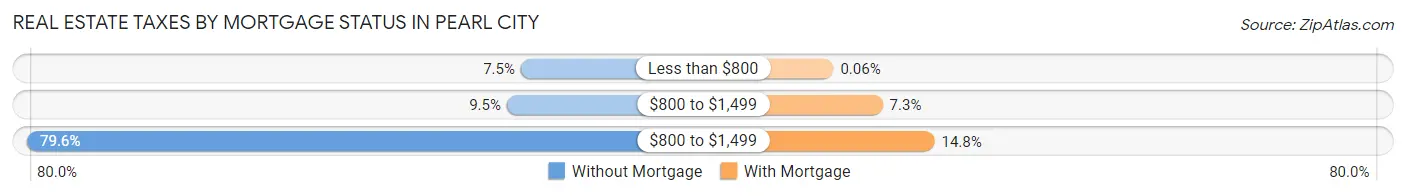
| Property Taxes | Without Mortgage | With Mortgage |
| Less than $800 | 277 (7.5%) | 4 (0.1%) |
| $800 to $1,499 | 352 (9.5%) | 500 (7.2%) |
| $800 to $1,499 | 2,939 (79.6%) | 1,023 (14.8%) |
| Total | 3,691 (100.0%) | 6,899 (100.0%) |
Health & Disability in Pearl City
Health Insurance Coverage by Age in Pearl City
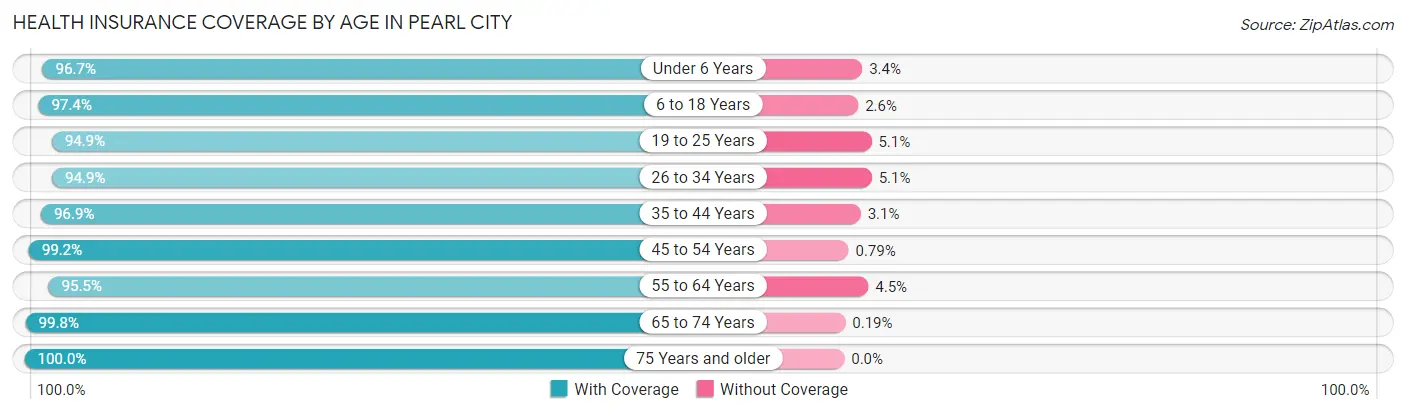
| Age Bracket | With Coverage | Without Coverage |
| Under 6 Years | 2,627 (96.7%) | 91 (3.4%) |
| 6 to 18 Years | 6,068 (97.4%) | 162 (2.6%) |
| 19 to 25 Years | 3,016 (94.9%) | 161 (5.1%) |
| 26 to 34 Years | 4,425 (94.9%) | 239 (5.1%) |
| 35 to 44 Years | 5,092 (96.9%) | 161 (3.1%) |
| 45 to 54 Years | 5,271 (99.2%) | 42 (0.8%) |
| 55 to 64 Years | 5,671 (95.5%) | 266 (4.5%) |
| 65 to 74 Years | 5,902 (99.8%) | 11 (0.2%) |
| 75 Years and older | 5,685 (100.0%) | 0 (0.0%) |
| Total | 43,757 (97.5%) | 1,133 (2.5%) |
Health Insurance Coverage by Citizenship Status in Pearl City
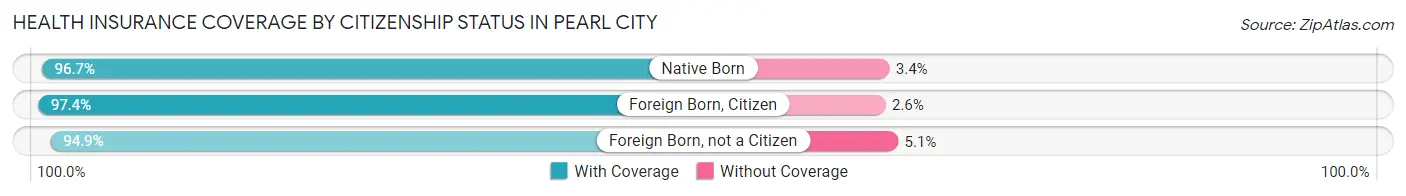
| Citizenship Status | With Coverage | Without Coverage |
| Native Born | 2,627 (96.7%) | 91 (3.4%) |
| Foreign Born, Citizen | 6,068 (97.4%) | 162 (2.6%) |
| Foreign Born, not a Citizen | 3,016 (94.9%) | 161 (5.1%) |
Health Insurance Coverage by Household Income in Pearl City
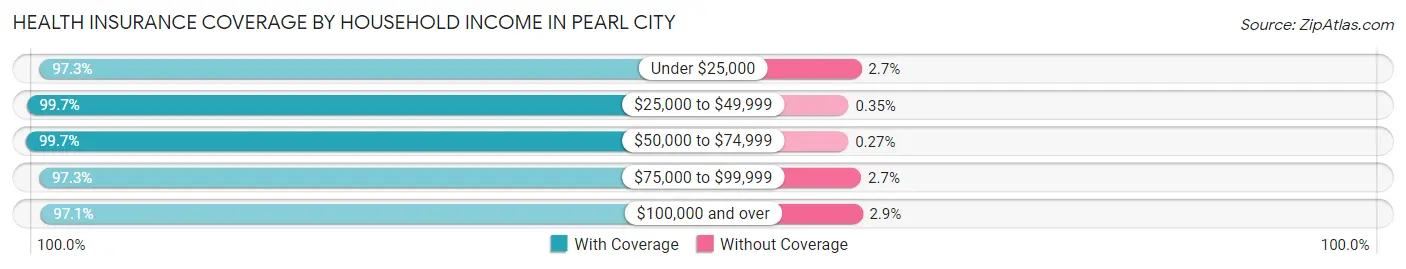
| Household Income | With Coverage | Without Coverage |
| Under $25,000 | 1,489 (97.3%) | 42 (2.7%) |
| $25,000 to $49,999 | 2,816 (99.7%) | 10 (0.4%) |
| $50,000 to $74,999 | 3,733 (99.7%) | 10 (0.3%) |
| $75,000 to $99,999 | 5,166 (97.3%) | 143 (2.7%) |
| $100,000 and over | 30,412 (97.1%) | 922 (2.9%) |
Public vs Private Health Insurance Coverage by Age in Pearl City
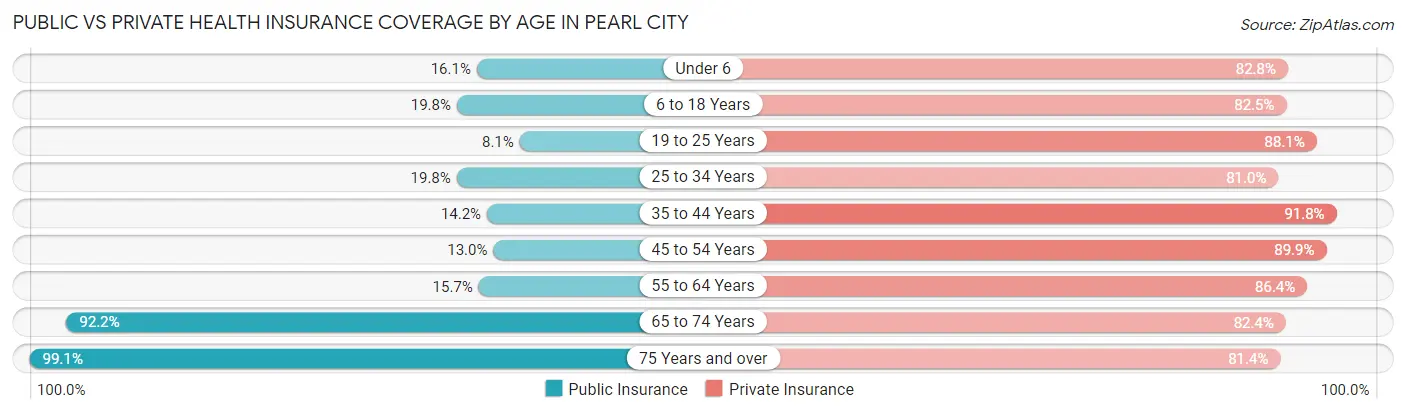
| Age Bracket | Public Insurance | Private Insurance |
| Under 6 | 437 (16.1%) | 2,250 (82.8%) |
| 6 to 18 Years | 1,232 (19.8%) | 5,140 (82.5%) |
| 19 to 25 Years | 258 (8.1%) | 2,800 (88.1%) |
| 25 to 34 Years | 924 (19.8%) | 3,778 (81.0%) |
| 35 to 44 Years | 745 (14.2%) | 4,823 (91.8%) |
| 45 to 54 Years | 691 (13.0%) | 4,778 (89.9%) |
| 55 to 64 Years | 933 (15.7%) | 5,127 (86.4%) |
| 65 to 74 Years | 5,454 (92.2%) | 4,872 (82.4%) |
| 75 Years and over | 5,632 (99.1%) | 4,626 (81.4%) |
| Total | 16,306 (36.3%) | 38,194 (85.1%) |
Disability Status by Sex by Age in Pearl City
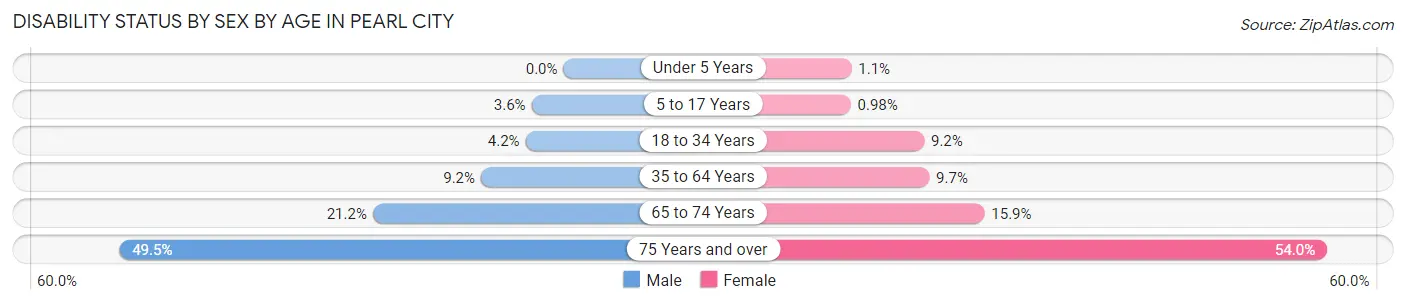
| Age Bracket | Male | Female |
| Under 5 Years | 0 (0.0%) | 11 (1.1%) |
| 5 to 17 Years | 120 (3.5%) | 30 (1.0%) |
| 18 to 34 Years | 176 (4.2%) | 361 (9.2%) |
| 35 to 64 Years | 745 (9.2%) | 817 (9.7%) |
| 65 to 74 Years | 547 (21.2%) | 530 (15.9%) |
| 75 Years and over | 1,188 (49.5%) | 1,774 (54.0%) |
Disability Class by Sex by Age in Pearl City
Disability Class: Hearing Difficulty
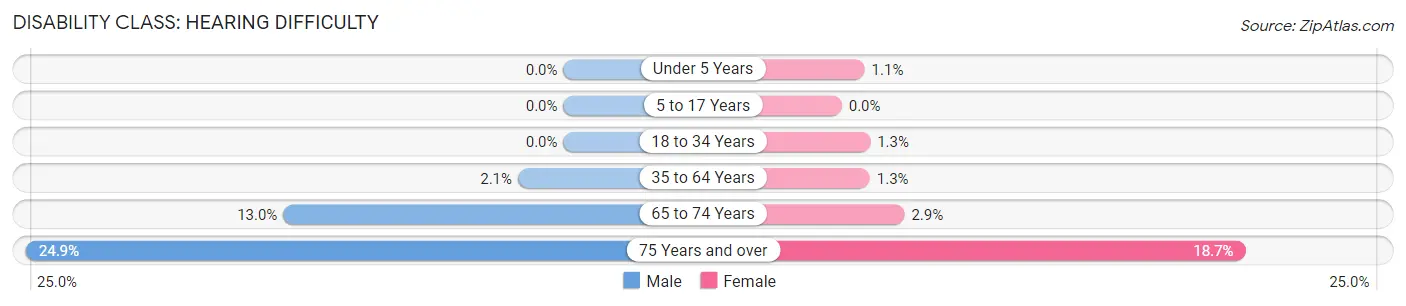
| Age Bracket | Male | Female |
| Under 5 Years | 0 (0.0%) | 11 (1.1%) |
| 5 to 17 Years | 0 (0.0%) | 0 (0.0%) |
| 18 to 34 Years | 0 (0.0%) | 52 (1.3%) |
| 35 to 64 Years | 171 (2.1%) | 109 (1.3%) |
| 65 to 74 Years | 335 (13.0%) | 97 (2.9%) |
| 75 Years and over | 599 (24.9%) | 615 (18.7%) |
Disability Class: Vision Difficulty
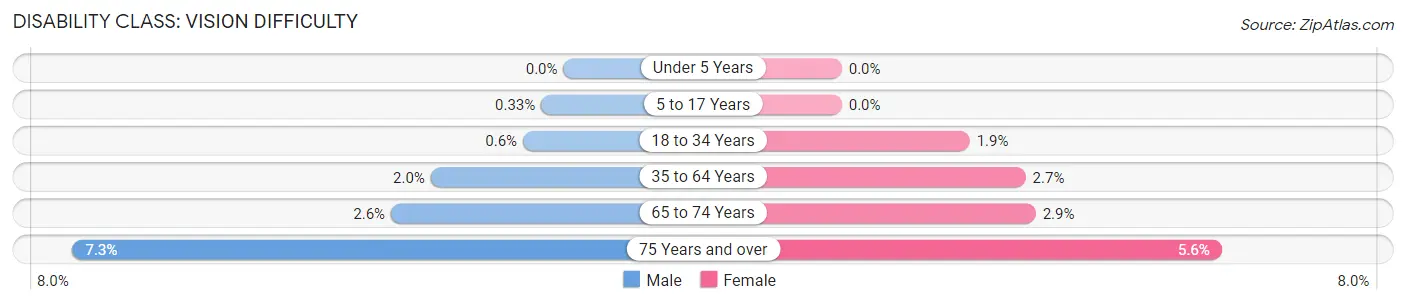
| Age Bracket | Male | Female |
| Under 5 Years | 0 (0.0%) | 0 (0.0%) |
| 5 to 17 Years | 11 (0.3%) | 0 (0.0%) |
| 18 to 34 Years | 25 (0.6%) | 75 (1.9%) |
| 35 to 64 Years | 160 (2.0%) | 229 (2.7%) |
| 65 to 74 Years | 66 (2.6%) | 96 (2.9%) |
| 75 Years and over | 175 (7.3%) | 185 (5.6%) |
Disability Class: Cognitive Difficulty
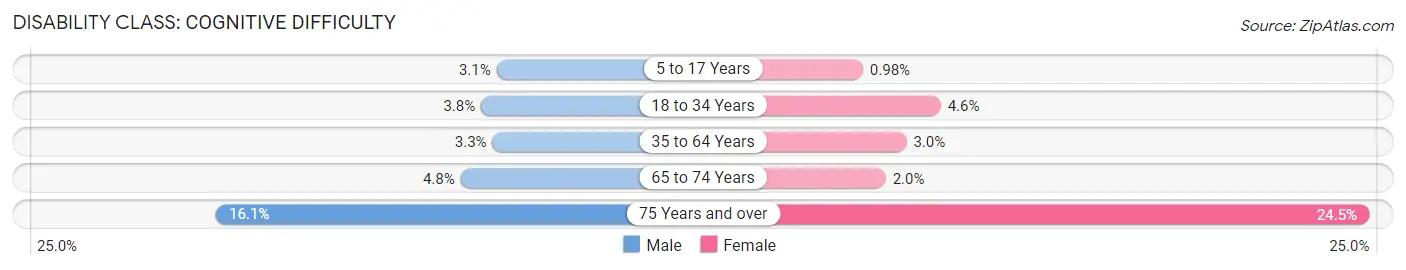
| Age Bracket | Male | Female |
| 5 to 17 Years | 105 (3.1%) | 30 (1.0%) |
| 18 to 34 Years | 159 (3.8%) | 181 (4.6%) |
| 35 to 64 Years | 267 (3.3%) | 252 (3.0%) |
| 65 to 74 Years | 123 (4.8%) | 68 (2.0%) |
| 75 Years and over | 387 (16.1%) | 803 (24.5%) |
Disability Class: Ambulatory Difficulty
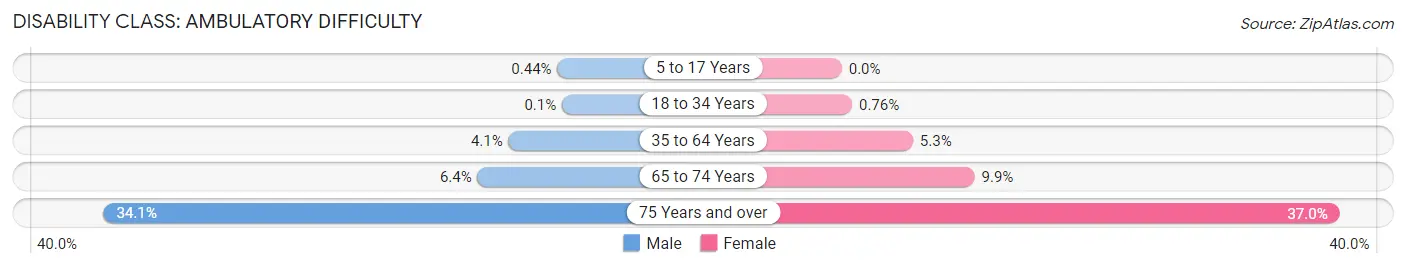
| Age Bracket | Male | Female |
| 5 to 17 Years | 15 (0.4%) | 0 (0.0%) |
| 18 to 34 Years | 4 (0.1%) | 30 (0.8%) |
| 35 to 64 Years | 330 (4.1%) | 443 (5.3%) |
| 65 to 74 Years | 164 (6.4%) | 329 (9.9%) |
| 75 Years and over | 820 (34.1%) | 1,213 (36.9%) |
Disability Class: Self-Care Difficulty
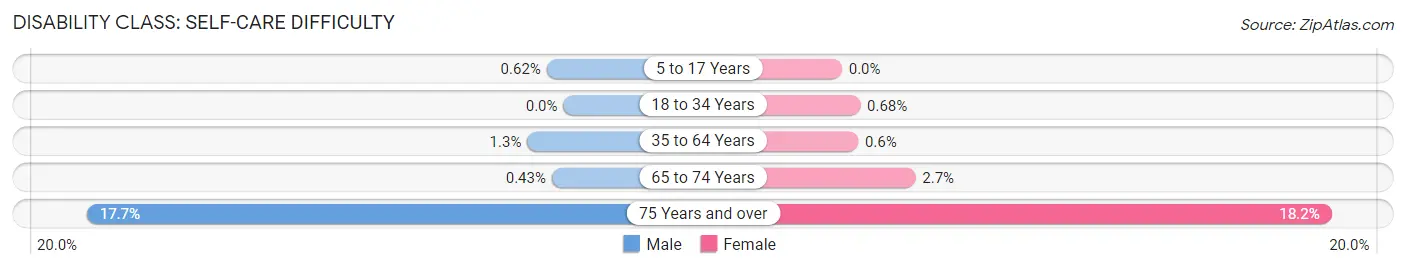
| Age Bracket | Male | Female |
| 5 to 17 Years | 21 (0.6%) | 0 (0.0%) |
| 18 to 34 Years | 0 (0.0%) | 27 (0.7%) |
| 35 to 64 Years | 109 (1.3%) | 50 (0.6%) |
| 65 to 74 Years | 11 (0.4%) | 91 (2.7%) |
| 75 Years and over | 425 (17.7%) | 597 (18.2%) |
Technology Access in Pearl City
Computing Device Access in Pearl City
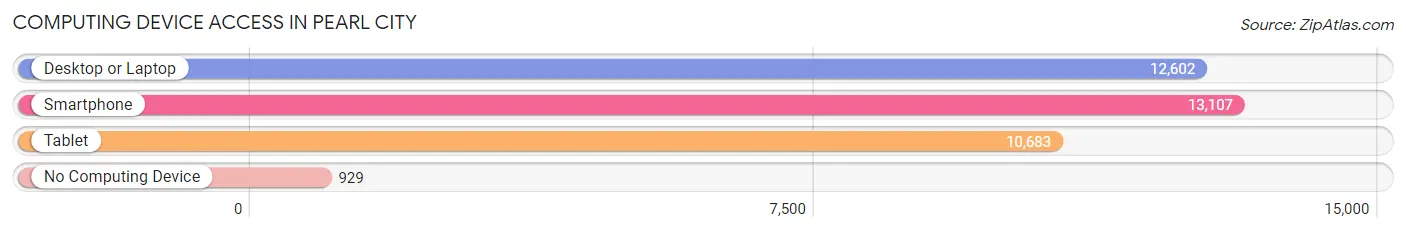
| Device Type | # Households | % Households |
| Desktop or Laptop | 12,602 | 84.1% |
| Smartphone | 13,107 | 87.5% |
| Tablet | 10,683 | 71.3% |
| No Computing Device | 929 | 6.2% |
| Total | 14,987 | 100.0% |
Internet Access in Pearl City
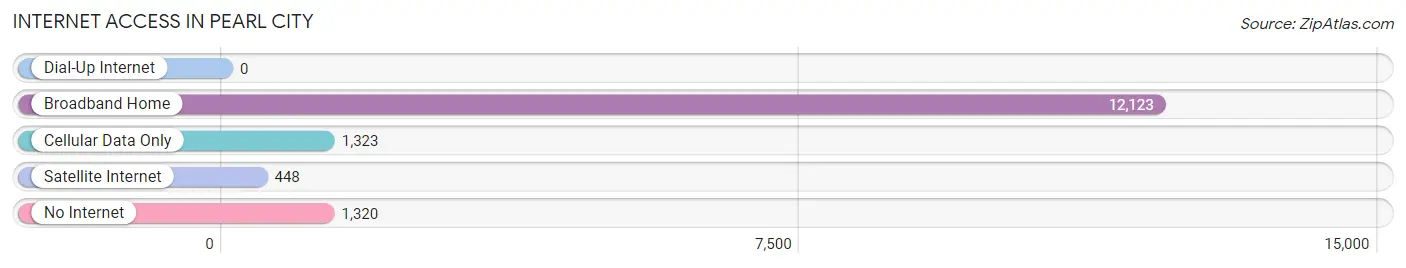
| Internet Type | # Households | % Households |
| Dial-Up Internet | 0 | 0.0% |
| Broadband Home | 12,123 | 80.9% |
| Cellular Data Only | 1,323 | 8.8% |
| Satellite Internet | 448 | 3.0% |
| No Internet | 1,320 | 8.8% |
| Total | 14,987 | 100.0% |
Pearl City Summary
Pearl City is a census-designated place (CDP) located in the City and County of Honolulu, Hawaii, United States. It is located on the island of Oahu, approximately 12 miles (19 km) northwest of Honolulu. As of the 2010 Census, the CDP had a population of 47,698.
History
Pearl City was originally a small fishing village, and was named after the pearl oysters that were found in the area. The area was first settled by Japanese immigrants in the late 19th century, and the population grew rapidly in the early 20th century. The area was annexed by the City and County of Honolulu in 1959, and has since become a major residential and commercial center.
Geography
Pearl City is located at 21°24'30" North, 157°58'30" West (21.408333, -157.975000). It is bordered by the communities of Aiea to the east, Waipahu to the west, and Waipio to the north. The Pacific Ocean lies to the south.
The area is mostly flat, with an elevation of about 20 feet (6 m) above sea level. The climate is tropical, with temperatures ranging from an average low of 65 °F (18 °C) in the winter to an average high of 85 °F (29 °C) in the summer.
Economy
Pearl City is a major commercial and residential center in Honolulu County. The area is home to several large shopping centers, including Pearlridge Center, Pearl City Shopping Center, and Pearl City Gateway Center. The area is also home to several industrial parks, including the Pearl City Industrial Park and the Pearl City Business Park.
The area is also home to several military installations, including the Pearl Harbor Naval Base, the Hickam Air Force Base, and the Marine Corps Base Hawaii.
Demographics
As of the 2010 Census, there were 47,698 people, 16,945 households, and 12,845 families residing in the CDP. The population density was 4,845.3 people per square mile (1,873.2/km2). There were 17,845 housing units at an average density of 1,845.3 per square mile (715.2/km2). The racial makeup of the CDP was 44.2% White, 4.3% African American, 0.3% Native American, 28.2% Asian, 8.2% Pacific Islander, 0.7% from other races, and 14.2% from two or more races. Hispanic or Latino of any race were 11.2% of the population.
There were 16,945 households, out of which 33.2% had children under the age of 18 living with them, 54.2% were married couples living together, 11.7% had a female householder with no husband present, and 28.2% were non-families. 21.2% of all households were made up of individuals, and 6.7% had someone living alone who was 65 years of age or older. The average household size was 2.80 and the average family size was 3.26.
In the CDP, the population was spread out, with 24.2% under the age of 18, 8.3% from 18 to 24, 28.2% from 25 to 44, 25.2% from 45 to 64, and 14.1% who were 65 years of age or older. The median age was 38 years. For every 100 females, there were 97.2 males. For every 100 females age 18 and over, there were 94.7 males.
The median income for a household in the CDP was $60,945, and the median income for a family was $67,845. Males had a median income of $45,945 versus $35,945 for females. The per capita income for the CDP was $25,945. About 5.2% of families and 7.2% of the population were below the poverty line, including 8.2% of those under age 18 and 6.2% of those age 65 or over.
Common Questions
What is the Total Population of Pearl City?
Total Population of Pearl City is 46,812.
What is the Total Male Population of Pearl City?
Total Male Population of Pearl City is 23,332.
What is the Total Female Population of Pearl City?
Total Female Population of Pearl City is 23,480.
What is the Ratio of Males per 100 Females in Pearl City?
There are 99.37 Males per 100 Females in Pearl City.
What is the Ratio of Females per 100 Males in Pearl City?
There are 100.63 Females per 100 Males in Pearl City.
What is the Median Population Age in Pearl City?
Median Population Age in Pearl City is 44.2 Years.
What is the Average Family Size in Pearl City
Average Family Size in Pearl City is 3.6 People.
What is the Average Household Size in Pearl City
Average Household Size in Pearl City is 3.1 People.
What is Per Capita Income in Pearl City?
Per Capita income in Pearl City is $46,626.
What is the Median Family Income in Pearl City?
Median Family Income in Pearl City is $134,544.
What is the Median Household income in Pearl City?
Median Household Income in Pearl City is $116,938.
What is Income or Wage Gap in Pearl City?
Income or Wage Gap in Pearl City is 15.6%.
Women in Pearl City earn 84.4 cents for every dollar earned by a man.
What is Family Income Deficit in Pearl City?
Family Income Deficit in Pearl City is $13,323.
Families that are below poverty line in Pearl City earn $13,323 less on average than the poverty threshold level.
What is Inequality or Gini Index in Pearl City?
Inequality or Gini Index in Pearl City is 0.40.
How Large is the Labor Force in Pearl City?
There are 24,748 People in the Labor Forcein in Pearl City.
What is the Percentage of People in the Labor Force in Pearl City?
63.2% of People are in the Labor Force in Pearl City.
What is the Unemployment Rate in Pearl City?
Unemployment Rate in Pearl City is 2.7%.