Wahiawa, HI
Wahiawa Map
Wahiawa Overview
17,400
TOTAL POPULATION
8,592
MALE POPULATION
8,808
FEMALE POPULATION
97.55
MALES / 100 FEMALES
102.51
FEMALES / 100 MALES
41.8
MEDIAN AGE
3.5
AVG FAMILY SIZE
2.9
AVG HOUSEHOLD SIZE
$36,808
PER CAPITA INCOME
$93,821
AVG FAMILY INCOME
$81,433
AVG HOUSEHOLD INCOME
17.5%
WAGE / INCOME GAP [ % ]
82.5¢/ $1
WAGE / INCOME GAP [ $ ]
$13,438
FAMILY INCOME DEFICIT
0.47
INEQUALITY / GINI INDEX
8,575
LABOR FORCE [ PEOPLE ]
60.0%
PERCENT IN LABOR FORCE
3.6%
UNEMPLOYMENT RATE
Wahiawa Zip Codes
Wahiawa Area Codes
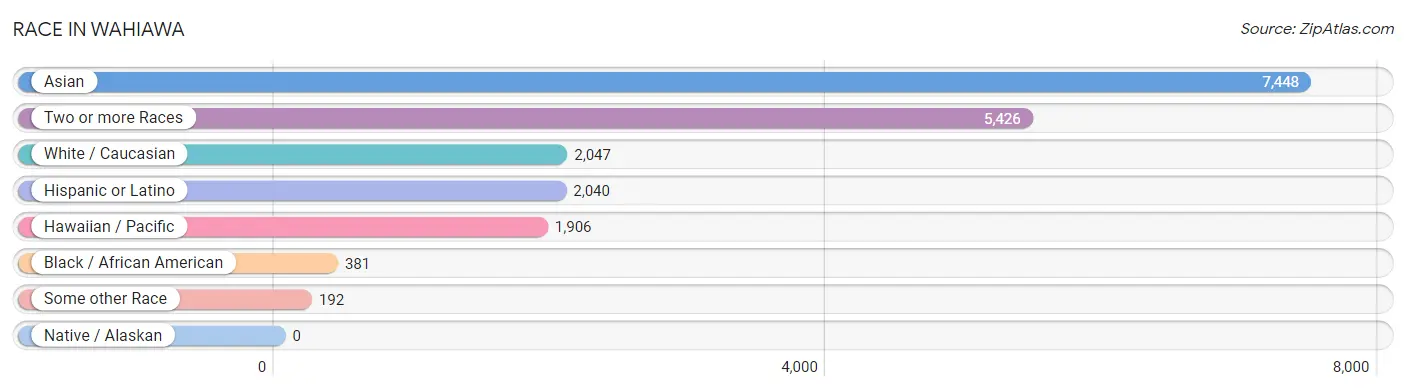
Race in Wahiawa
The most populous races in Wahiawa are Asian (7,448 | 42.8%), Two or more Races (5,426 | 31.2%), and White / Caucasian (2,047 | 11.8%).
| Race | # Population | % Population |
| Asian | 7,448 | 42.8% |
| Black / African American | 381 | 2.2% |
| Hawaiian / Pacific | 1,906 | 11.0% |
| Hispanic or Latino | 2,040 | 11.7% |
| Native / Alaskan | 0 | 0.0% |
| White / Caucasian | 2,047 | 11.8% |
| Two or more Races | 5,426 | 31.2% |
| Some other Race | 192 | 1.1% |
| Total | 17,400 | 100.0% |
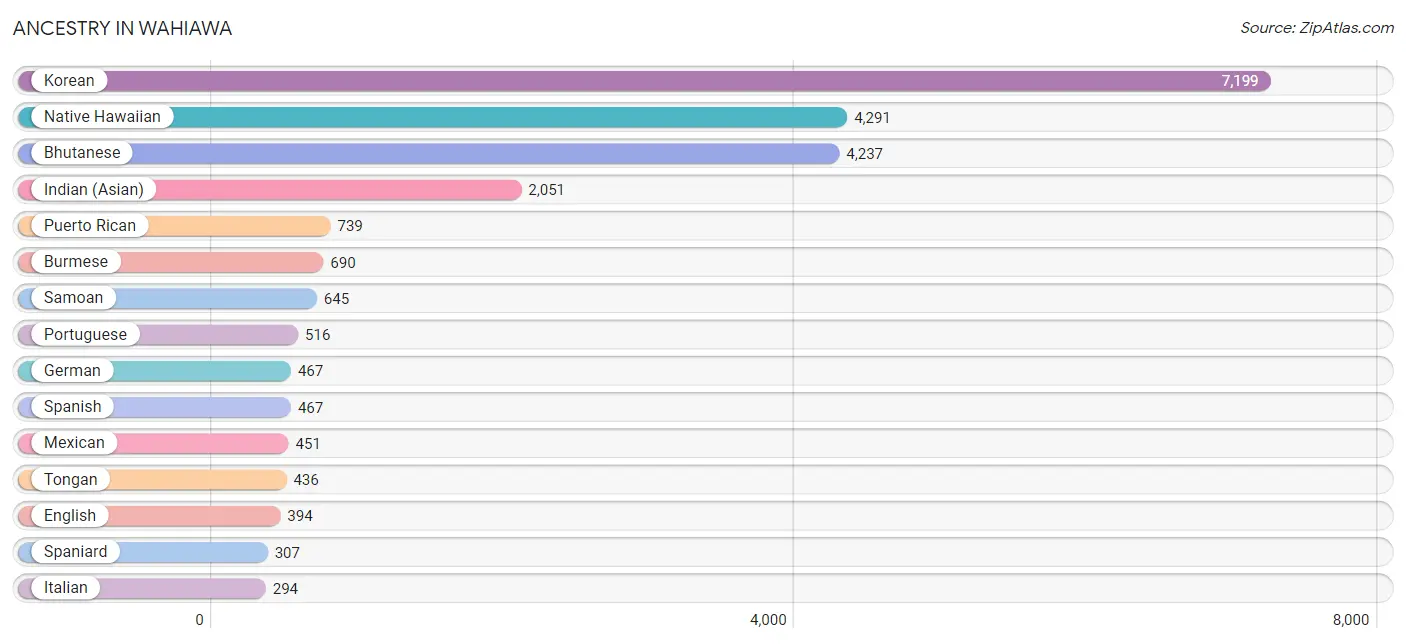
Ancestry in Wahiawa
The most populous ancestries reported in Wahiawa are Korean (7,199 | 41.4%), Native Hawaiian (4,291 | 24.7%), Bhutanese (4,237 | 24.3%), Indian (Asian) (2,051 | 11.8%), and Puerto Rican (739 | 4.3%), together accounting for 106.4% of all Wahiawa residents.
| Ancestry | # Population | % Population |
| American | 93 | 0.5% |
| Apache | 24 | 0.1% |
| Bhutanese | 4,237 | 24.3% |
| British | 10 | 0.1% |
| Burmese | 690 | 4.0% |
| Canadian | 50 | 0.3% |
| Cherokee | 159 | 0.9% |
| Chinese | 147 | 0.8% |
| Choctaw | 7 | 0.0% |
| Colombian | 34 | 0.2% |
| Danish | 50 | 0.3% |
| Dutch | 130 | 0.7% |
| English | 394 | 2.3% |
| European | 51 | 0.3% |
| Fijian | 34 | 0.2% |
| Filipino | 17 | 0.1% |
| French | 157 | 0.9% |
| French Canadian | 9 | 0.1% |
| German | 467 | 2.7% |
| Greek | 39 | 0.2% |
| Guamanian / Chamorro | 206 | 1.2% |
| Haitian | 34 | 0.2% |
| Indian (Asian) | 2,051 | 11.8% |
| Irish | 240 | 1.4% |
| Italian | 294 | 1.7% |
| Korean | 7,199 | 41.4% |
| Lumbee | 31 | 0.2% |
| Marshallese | 187 | 1.1% |
| Mexican | 451 | 2.6% |
| Native Hawaiian | 4,291 | 24.7% |
| Navajo | 12 | 0.1% |
| Nigerian | 32 | 0.2% |
| Norwegian | 114 | 0.7% |
| Pakistani | 147 | 0.8% |
| Paraguayan | 30 | 0.2% |
| Peruvian | 11 | 0.1% |
| Polish | 84 | 0.5% |
| Portuguese | 516 | 3.0% |
| Puerto Rican | 739 | 4.3% |
| Samoan | 645 | 3.7% |
| Scandinavian | 14 | 0.1% |
| Scotch-Irish | 35 | 0.2% |
| Scottish | 28 | 0.2% |
| Sioux | 28 | 0.2% |
| South American | 75 | 0.4% |
| Spaniard | 307 | 1.8% |
| Spanish | 467 | 2.7% |
| Sri Lankan | 9 | 0.1% |
| Subsaharan African | 32 | 0.2% |
| Swedish | 8 | 0.1% |
| Tlingit-Haida | 202 | 1.2% |
| Tongan | 436 | 2.5% |
| Ukrainian | 1 | 0.0% |
| Welsh | 9 | 0.1% | View All 54 Rows |
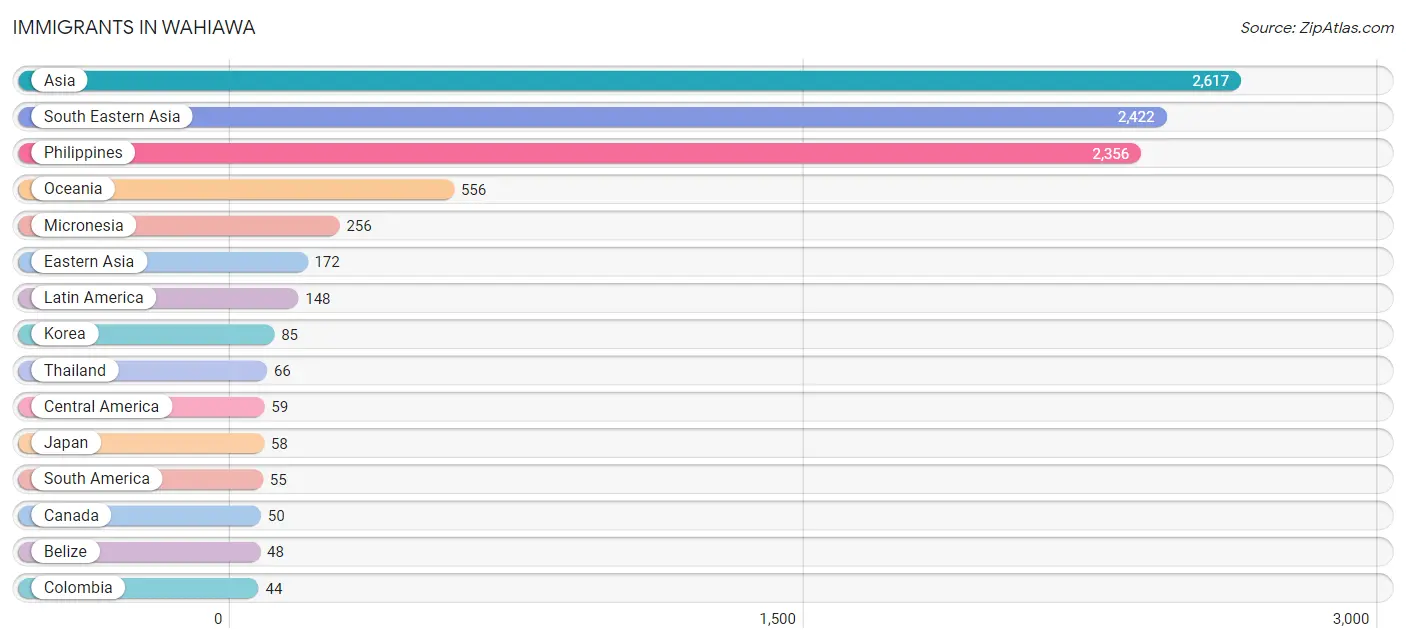
Immigrants in Wahiawa
The most numerous immigrant groups reported in Wahiawa came from Asia (2,617 | 15.0%), South Eastern Asia (2,422 | 13.9%), Philippines (2,356 | 13.5%), Oceania (556 | 3.2%), and Micronesia (256 | 1.5%), together accounting for 47.2% of all Wahiawa residents.
| Immigration Origin | # Population | % Population |
| Africa | 6 | 0.0% |
| Asia | 2,617 | 15.0% |
| Belize | 48 | 0.3% |
| Canada | 50 | 0.3% |
| Caribbean | 34 | 0.2% |
| Central America | 59 | 0.3% |
| China | 29 | 0.2% |
| Colombia | 44 | 0.3% |
| Eastern Asia | 172 | 1.0% |
| Europe | 22 | 0.1% |
| France | 12 | 0.1% |
| Haiti | 34 | 0.2% |
| Japan | 58 | 0.3% |
| Kazakhstan | 12 | 0.1% |
| Korea | 85 | 0.5% |
| Latin America | 148 | 0.9% |
| Mexico | 11 | 0.1% |
| Micronesia | 256 | 1.5% |
| Northern Europe | 10 | 0.1% |
| Oceania | 556 | 3.2% |
| Philippines | 2,356 | 13.5% |
| South Africa | 6 | 0.0% |
| South America | 55 | 0.3% |
| South Central Asia | 23 | 0.1% |
| South Eastern Asia | 2,422 | 13.9% |
| Sri Lanka | 11 | 0.1% |
| Taiwan | 7 | 0.0% |
| Thailand | 66 | 0.4% |
| Western Europe | 12 | 0.1% | View All 29 Rows |
Sex and Age in Wahiawa
Sex and Age in Wahiawa
The most populous age groups in Wahiawa are 60 to 64 Years (817 | 9.5%) for men and 30 to 34 Years (715 | 8.1%) for women.
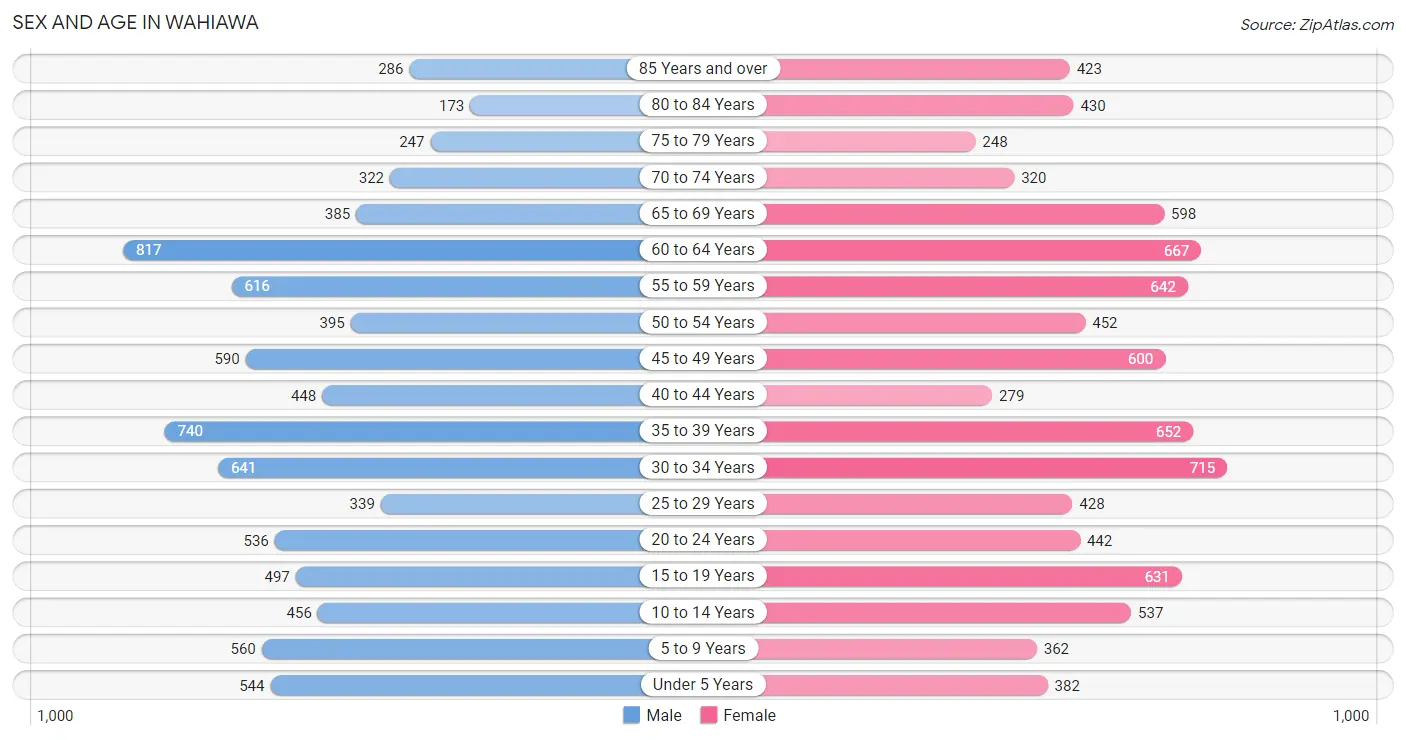
| Age Bracket | Male | Female |
| Under 5 Years | 544 (6.3%) | 382 (4.3%) |
| 5 to 9 Years | 560 (6.5%) | 362 (4.1%) |
| 10 to 14 Years | 456 (5.3%) | 537 (6.1%) |
| 15 to 19 Years | 497 (5.8%) | 631 (7.2%) |
| 20 to 24 Years | 536 (6.2%) | 442 (5.0%) |
| 25 to 29 Years | 339 (4.0%) | 428 (4.9%) |
| 30 to 34 Years | 641 (7.5%) | 715 (8.1%) |
| 35 to 39 Years | 740 (8.6%) | 652 (7.4%) |
| 40 to 44 Years | 448 (5.2%) | 279 (3.2%) |
| 45 to 49 Years | 590 (6.9%) | 600 (6.8%) |
| 50 to 54 Years | 395 (4.6%) | 452 (5.1%) |
| 55 to 59 Years | 616 (7.2%) | 642 (7.3%) |
| 60 to 64 Years | 817 (9.5%) | 667 (7.6%) |
| 65 to 69 Years | 385 (4.5%) | 598 (6.8%) |
| 70 to 74 Years | 322 (3.7%) | 320 (3.6%) |
| 75 to 79 Years | 247 (2.9%) | 248 (2.8%) |
| 80 to 84 Years | 173 (2.0%) | 430 (4.9%) |
| 85 Years and over | 286 (3.3%) | 423 (4.8%) |
| Total | 8,592 (100.0%) | 8,808 (100.0%) |
Families and Households in Wahiawa
Median Family Size in Wahiawa
The median family size in Wahiawa is 3.48 persons per family, with married-couple families (2,631 | 64.5%) accounting for the largest median family size of 3.58 persons per family. On the other hand, single female/mother families (1,016 | 24.9%) represent the smallest median family size with 3.27 persons per family.
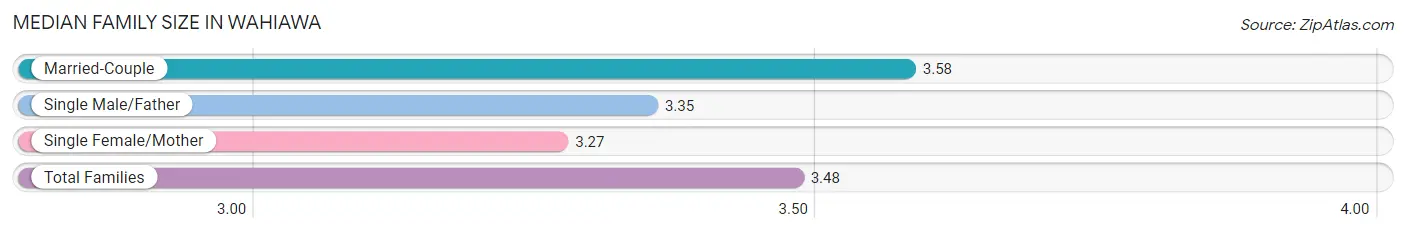
| Family Type | # Families | Family Size |
| Married-Couple | 2,631 (64.5%) | 3.58 |
| Single Male/Father | 434 (10.6%) | 3.35 |
| Single Female/Mother | 1,016 (24.9%) | 3.27 |
| Total Families | 4,081 (100.0%) | 3.48 |
Median Household Size in Wahiawa
The median household size in Wahiawa is 2.88 persons per household, with single male/father households (434 | 7.3%) accounting for the largest median household size of 3.68 persons per household. non-family households (1,897 | 31.7%) represent the smallest median household size with 1.30 persons per household.
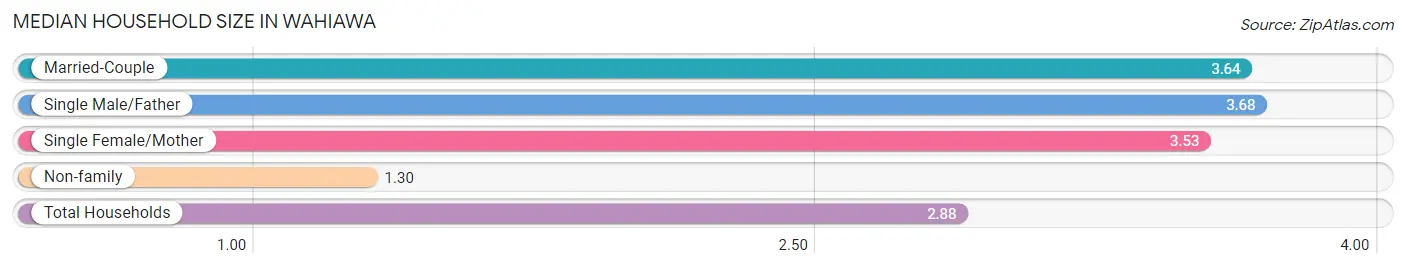
| Household Type | # Households | Household Size |
| Married-Couple | 2,631 (44.0%) | 3.64 |
| Single Male/Father | 434 (7.3%) | 3.68 |
| Single Female/Mother | 1,016 (17.0%) | 3.53 |
| Non-family | 1,897 (31.7%) | 1.30 |
| Total Households | 5,978 (100.0%) | 2.88 |
Household Size by Marriage Status in Wahiawa
Out of a total of 5,978 households in Wahiawa, 4,081 (68.3%) are family households, while 1,897 (31.7%) are nonfamily households. The most numerous type of family households are 2-person households, comprising 1,523, and the most common type of nonfamily households are 1-person households, comprising 1,554.
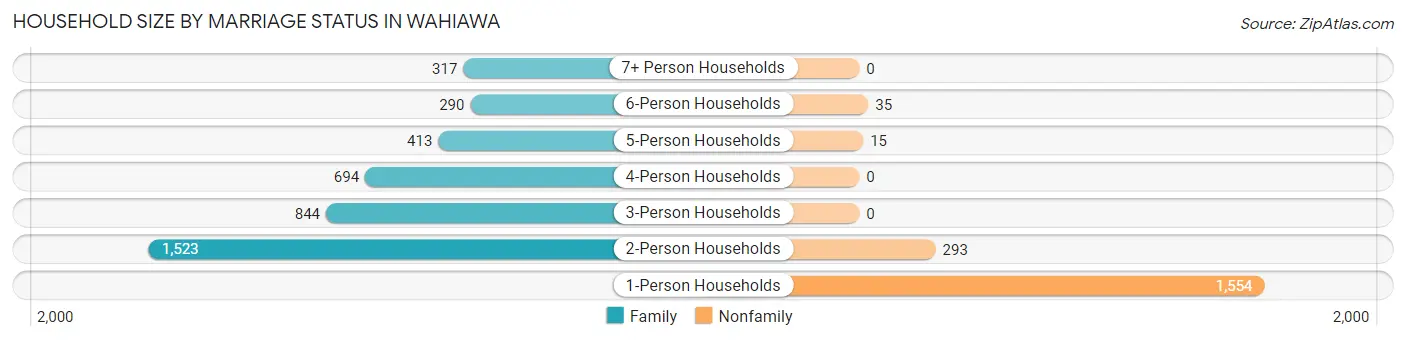
| Household Size | Family Households | Nonfamily Households |
| 1-Person Households | - | 1,554 (26.0%) |
| 2-Person Households | 1,523 (25.5%) | 293 (4.9%) |
| 3-Person Households | 844 (14.1%) | 0 (0.0%) |
| 4-Person Households | 694 (11.6%) | 0 (0.0%) |
| 5-Person Households | 413 (6.9%) | 15 (0.3%) |
| 6-Person Households | 290 (4.9%) | 35 (0.6%) |
| 7+ Person Households | 317 (5.3%) | 0 (0.0%) |
| Total | 4,081 (68.3%) | 1,897 (31.7%) |
Female Fertility in Wahiawa
Fertility by Age in Wahiawa
Average fertility rate in Wahiawa is 35.0 births per 1,000 women. Women in the age bracket of 20 to 34 years have the highest fertility rate with 44.0 births per 1,000 women. Women in the age bracket of 20 to 34 years acount for 51.5% of all women with births.
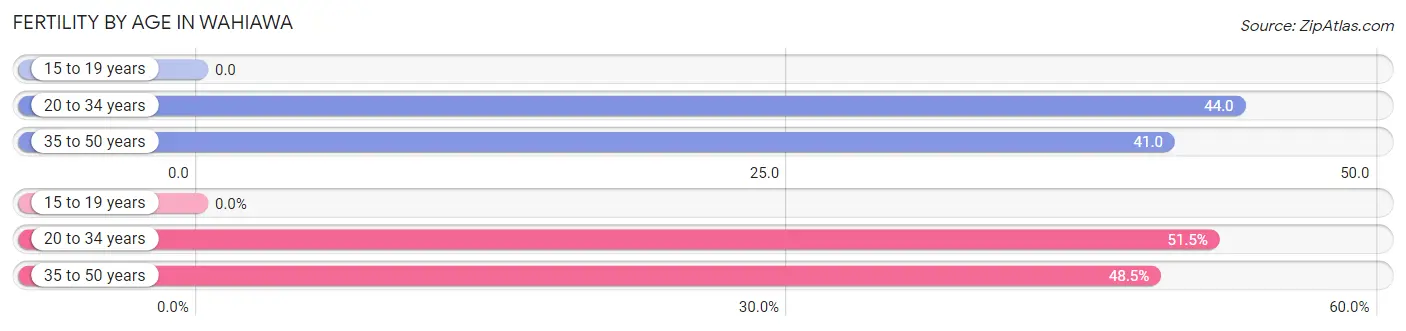
| Age Bracket | Women with Births | Births / 1,000 Women |
| 15 to 19 years | 0 (0.0%) | 0.0 |
| 20 to 34 years | 69 (51.5%) | 44.0 |
| 35 to 50 years | 65 (48.5%) | 41.0 |
| Total | 134 (100.0%) | 35.0 |
Fertility by Age by Marriage Status in Wahiawa
70.9% of women with births (134) in Wahiawa are married. The highest percentage of unmarried women with births falls into 20 to 34 years age bracket with 43.5% of them unmarried at the time of birth, while the lowest percentage of unmarried women with births belong to 35 to 50 years age bracket with 13.8% of them unmarried.
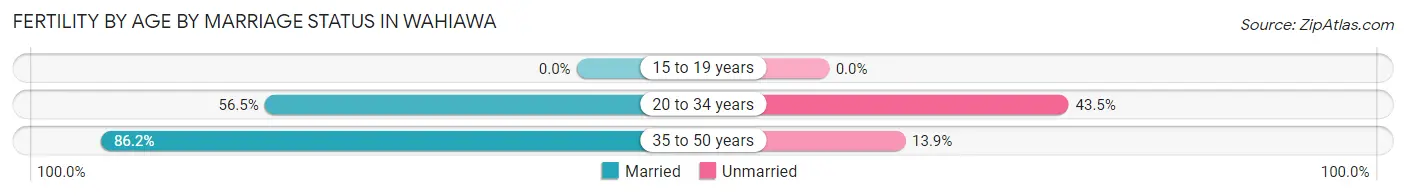
| Age Bracket | Married | Unmarried |
| 15 to 19 years | 0 (0.0%) | 0 (0.0%) |
| 20 to 34 years | 39 (56.5%) | 30 (43.5%) |
| 35 to 50 years | 56 (86.2%) | 9 (13.9%) |
| Total | 95 (70.9%) | 39 (29.1%) |
Fertility by Education in Wahiawa
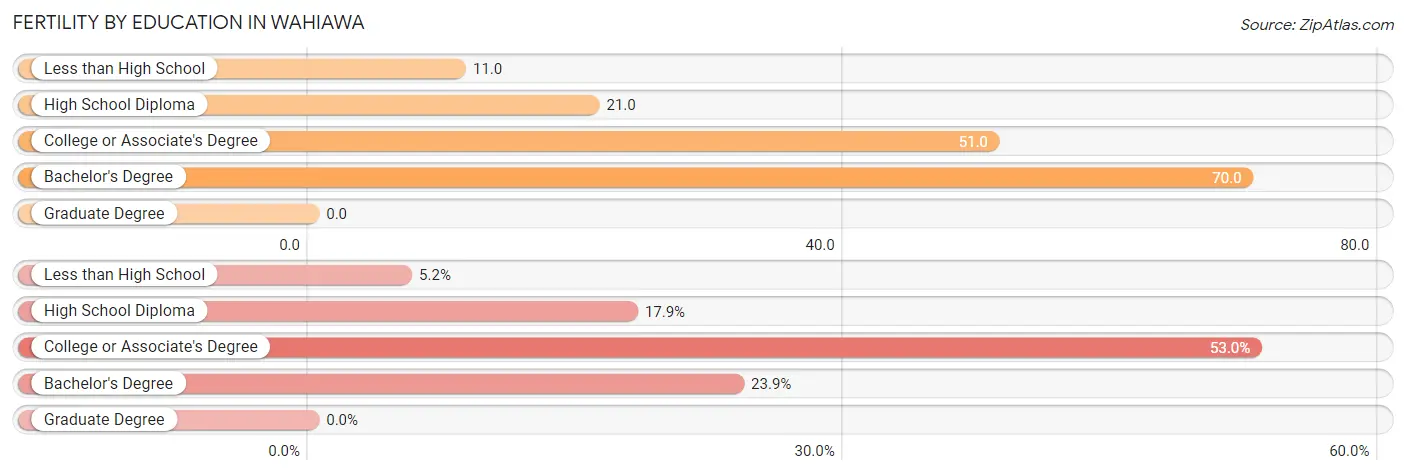
| Educational Attainment | Women with Births | Births / 1,000 Women |
| Less than High School | 7 (5.2%) | 11.0 |
| High School Diploma | 24 (17.9%) | 21.0 |
| College or Associate's Degree | 71 (53.0%) | 51.0 |
| Bachelor's Degree | 32 (23.9%) | 70.0 |
| Graduate Degree | 0 (0.0%) | 0.0 |
| Total | 134 (100.0%) | 35.0 |
Fertility by Education by Marriage Status in Wahiawa
29.1% of women with births in Wahiawa are unmarried. Women with the educational attainment of bachelor's degree are most likely to be married with 100.0% of them married at childbirth, while women with the educational attainment of less than high school are least likely to be married with 100.0% of them unmarried at childbirth.
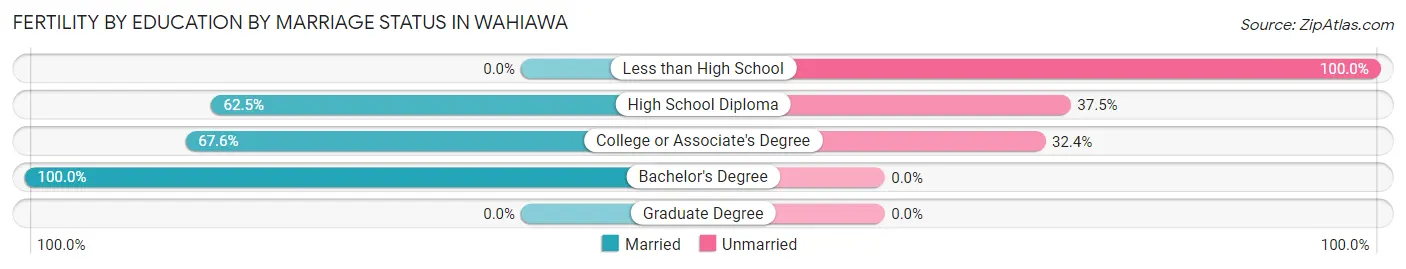
| Educational Attainment | Married | Unmarried |
| Less than High School | 0 (0.0%) | 7 (100.0%) |
| High School Diploma | 15 (62.5%) | 9 (37.5%) |
| College or Associate's Degree | 48 (67.6%) | 23 (32.4%) |
| Bachelor's Degree | 32 (100.0%) | 0 (0.0%) |
| Graduate Degree | 0 (0.0%) | 0 (0.0%) |
| Total | 95 (70.9%) | 39 (29.1%) |
Income in Wahiawa
Income Overview in Wahiawa
Per Capita Income in Wahiawa is $36,808, while median incomes of families and households are $93,821 and $81,433 respectively.
| Characteristic | Number | Measure |
| Per Capita Income | 17,400 | $36,808 |
| Median Family Income | 4,081 | $93,821 |
| Mean Family Income | 4,081 | $115,034 |
| Median Household Income | 5,978 | $81,433 |
| Mean Household Income | 5,978 | $106,528 |
| Income Deficit | 4,081 | $13,438 |
| Wage / Income Gap (%) | 17,400 | 17.55% |
| Wage / Income Gap ($) | 17,400 | 82.45¢ per $1 |
| Gini / Inequality Index | 17,400 | 0.47 |
Earnings by Sex in Wahiawa
Average Earnings in Wahiawa are $41,317, $46,595 for men and $38,419 for women, a difference of 17.5%.
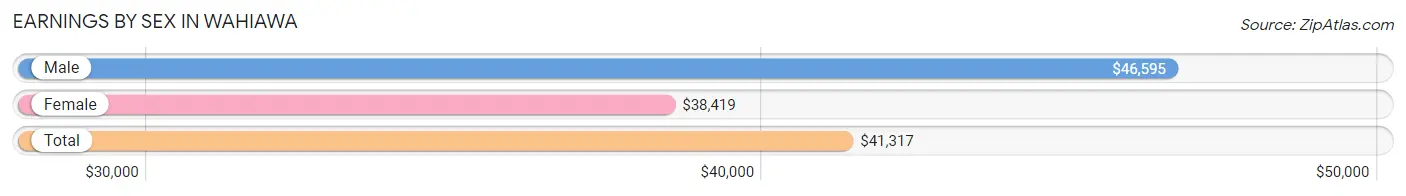
| Sex | Number | Average Earnings |
| Male | 4,651 (52.7%) | $46,595 |
| Female | 4,170 (47.3%) | $38,419 |
| Total | 8,821 (100.0%) | $41,317 |
Earnings by Sex by Income Bracket in Wahiawa
The most common earnings brackets in Wahiawa are $100,000+ for men (734 | 15.8%) and $55,000 to $64,999 for women (429 | 10.3%).
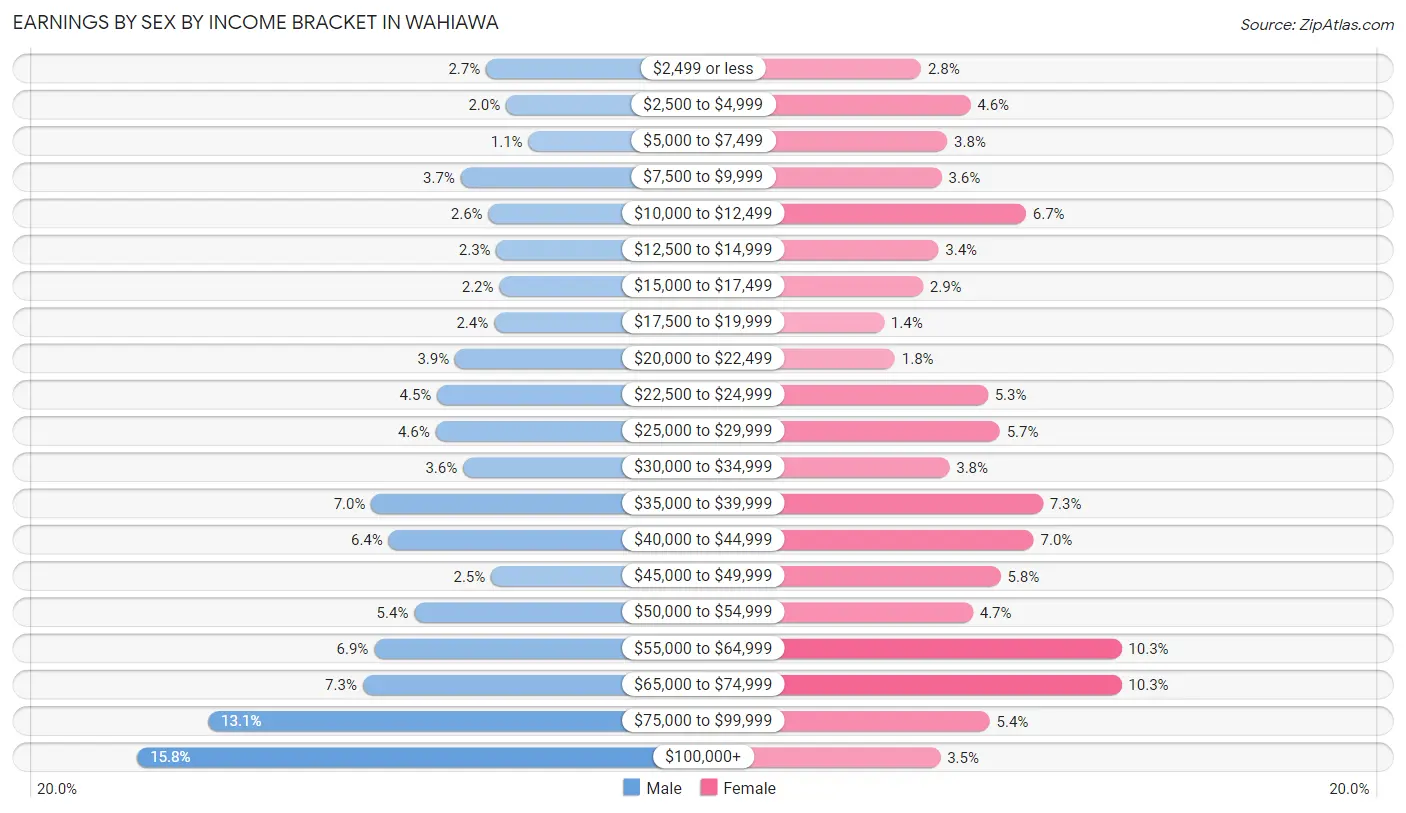
| Income | Male | Female |
| $2,499 or less | 126 (2.7%) | 116 (2.8%) |
| $2,500 to $4,999 | 91 (2.0%) | 193 (4.6%) |
| $5,000 to $7,499 | 52 (1.1%) | 157 (3.8%) |
| $7,500 to $9,999 | 170 (3.7%) | 148 (3.5%) |
| $10,000 to $12,499 | 122 (2.6%) | 280 (6.7%) |
| $12,500 to $14,999 | 108 (2.3%) | 143 (3.4%) |
| $15,000 to $17,499 | 103 (2.2%) | 119 (2.9%) |
| $17,500 to $19,999 | 112 (2.4%) | 58 (1.4%) |
| $20,000 to $22,499 | 180 (3.9%) | 75 (1.8%) |
| $22,500 to $24,999 | 211 (4.5%) | 220 (5.3%) |
| $25,000 to $29,999 | 214 (4.6%) | 239 (5.7%) |
| $30,000 to $34,999 | 166 (3.6%) | 160 (3.8%) |
| $35,000 to $39,999 | 326 (7.0%) | 306 (7.3%) |
| $40,000 to $44,999 | 296 (6.4%) | 292 (7.0%) |
| $45,000 to $49,999 | 117 (2.5%) | 240 (5.8%) |
| $50,000 to $54,999 | 251 (5.4%) | 197 (4.7%) |
| $55,000 to $64,999 | 321 (6.9%) | 429 (10.3%) |
| $65,000 to $74,999 | 341 (7.3%) | 429 (10.3%) |
| $75,000 to $99,999 | 610 (13.1%) | 223 (5.3%) |
| $100,000+ | 734 (15.8%) | 146 (3.5%) |
| Total | 4,651 (100.0%) | 4,170 (100.0%) |
Earnings by Sex by Educational Attainment in Wahiawa
Average earnings in Wahiawa are $52,816 for men and $40,815 for women, a difference of 22.7%. Men with an educational attainment of graduate degree enjoy the highest average annual earnings of $72,574, while those with less than high school education earn the least with $26,445. Women with an educational attainment of graduate degree earn the most with the average annual earnings of $59,545, while those with high school diploma education have the smallest earnings of $35,919.
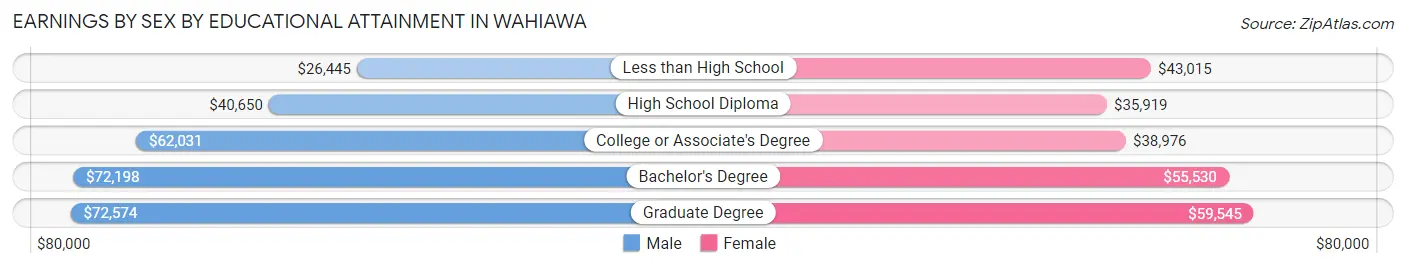
| Educational Attainment | Male Income | Female Income |
| Less than High School | $26,445 | $43,015 |
| High School Diploma | $40,650 | $35,919 |
| College or Associate's Degree | $62,031 | $38,976 |
| Bachelor's Degree | $72,198 | $55,530 |
| Graduate Degree | $72,574 | $59,545 |
| Total | $52,816 | $40,815 |
Family Income in Wahiawa
Family Income Brackets in Wahiawa
According to the Wahiawa family income data, there are 788 families falling into the $100,000 to $149,999 income range, which is the most common income bracket and makes up 19.3% of all families. Conversely, the $15,000 to $24,999 income bracket is the least frequent group with only 90 families (2.2%) belonging to this category.
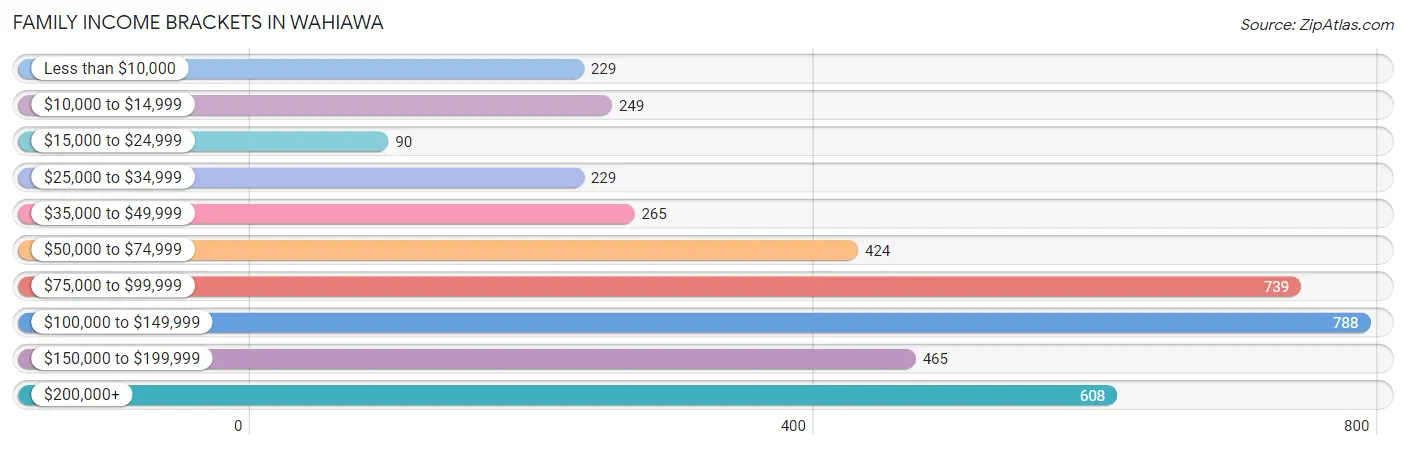
| Income Bracket | # Families | % Families |
| Less than $10,000 | 229 | 5.6% |
| $10,000 to $14,999 | 249 | 6.1% |
| $15,000 to $24,999 | 90 | 2.2% |
| $25,000 to $34,999 | 229 | 5.6% |
| $35,000 to $49,999 | 265 | 6.5% |
| $50,000 to $74,999 | 424 | 10.4% |
| $75,000 to $99,999 | 739 | 18.1% |
| $100,000 to $149,999 | 788 | 19.3% |
| $150,000 to $199,999 | 465 | 11.4% |
| $200,000+ | 608 | 14.9% |
Family Income by Famaliy Size in Wahiawa
7+ person families (267 | 6.5%) account for the highest median family income in Wahiawa with $198,348 per family, while 2-person families (1,664 | 40.8%) have the highest median income of $38,518 per family member.
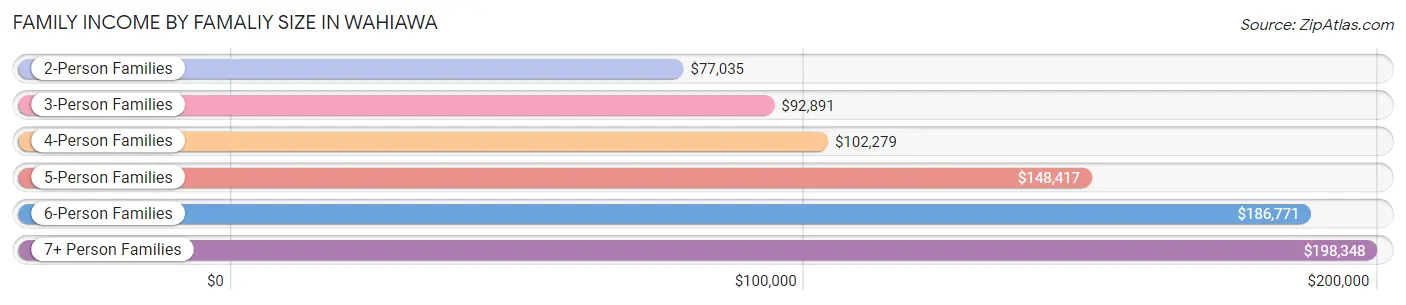
| Income Bracket | # Families | Median Income |
| 2-Person Families | 1,664 (40.8%) | $77,035 |
| 3-Person Families | 817 (20.0%) | $92,891 |
| 4-Person Families | 784 (19.2%) | $102,279 |
| 5-Person Families | 307 (7.5%) | $148,417 |
| 6-Person Families | 242 (5.9%) | $186,771 |
| 7+ Person Families | 267 (6.5%) | $198,348 |
| Total | 4,081 (100.0%) | $93,821 |
Family Income by Number of Earners in Wahiawa
The median family income in Wahiawa is $93,821, with families comprising 3+ earners (758) having the highest median family income of $204,917, while families with no earners (632) have the lowest median family income of $41,250, accounting for 18.6% and 15.5% of families, respectively.
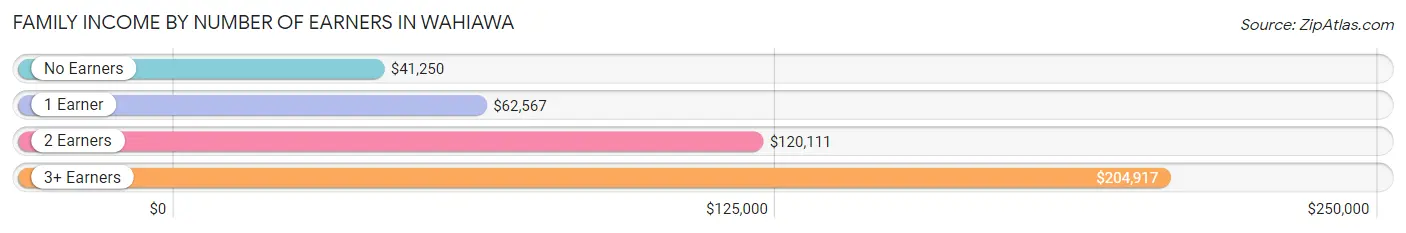
| Number of Earners | # Families | Median Income |
| No Earners | 632 (15.5%) | $41,250 |
| 1 Earner | 1,363 (33.4%) | $62,567 |
| 2 Earners | 1,328 (32.5%) | $120,111 |
| 3+ Earners | 758 (18.6%) | $204,917 |
| Total | 4,081 (100.0%) | $93,821 |
Household Income in Wahiawa
Household Income Brackets in Wahiawa
With 980 households falling in the category, the $75,000 to $99,999 income range is the most frequent in Wahiawa, accounting for 16.4% of all households. In contrast, only 299 households (5.0%) fall into the $10,000 to $14,999 income bracket, making it the least populous group.
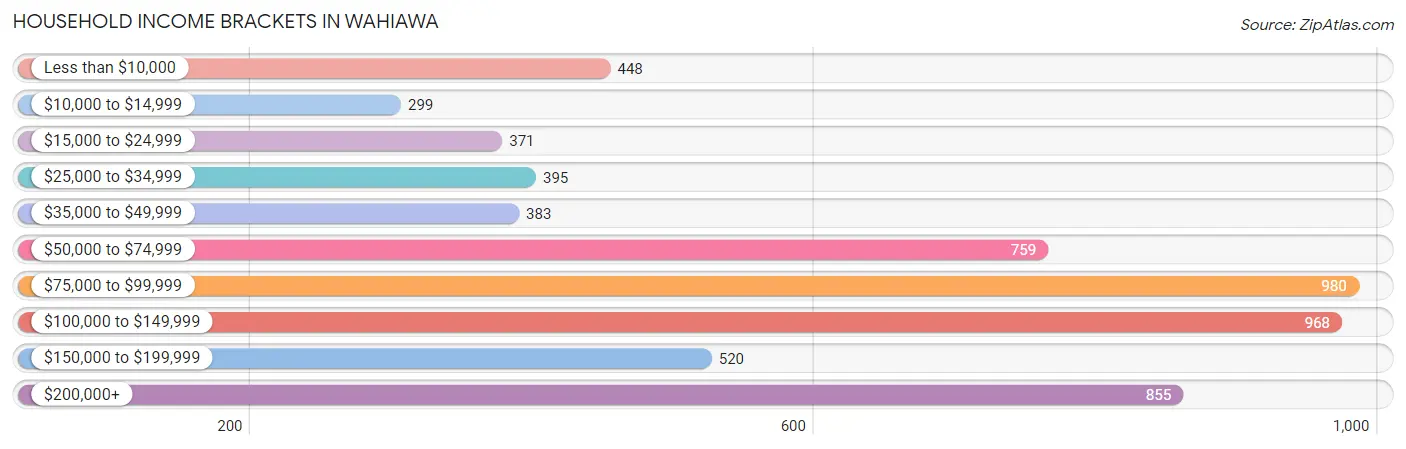
| Income Bracket | # Households | % Households |
| Less than $10,000 | 448 | 7.5% |
| $10,000 to $14,999 | 299 | 5.0% |
| $15,000 to $24,999 | 371 | 6.2% |
| $25,000 to $34,999 | 395 | 6.6% |
| $35,000 to $49,999 | 383 | 6.4% |
| $50,000 to $74,999 | 759 | 12.7% |
| $75,000 to $99,999 | 980 | 16.4% |
| $100,000 to $149,999 | 968 | 16.2% |
| $150,000 to $199,999 | 520 | 8.7% |
| $200,000+ | 855 | 14.3% |
Household Income by Householder Age in Wahiawa
The median household income in Wahiawa is $81,433, with the highest median household income of $92,833 found in the 65+ years age bracket for the primary householder. A total of 2,044 households (34.2%) fall into this category. Meanwhile, the 15 to 24 years age bracket for the primary householder has the lowest median household income of $35,240, with 65 households (1.1%) in this group.
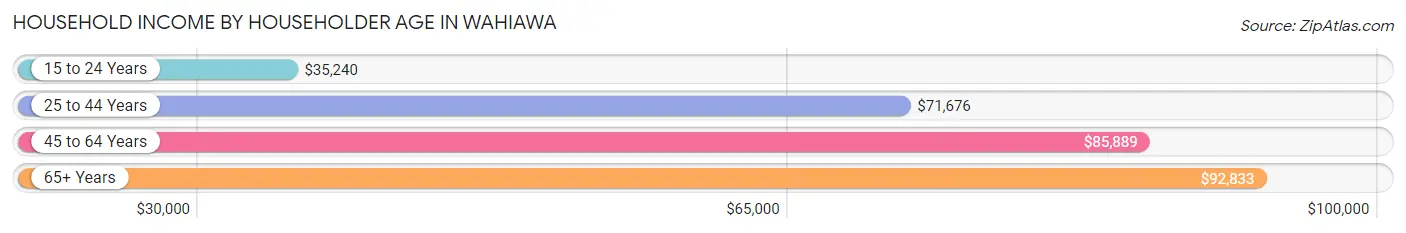
| Income Bracket | # Households | Median Income |
| 15 to 24 Years | 65 (1.1%) | $35,240 |
| 25 to 44 Years | 1,706 (28.5%) | $71,676 |
| 45 to 64 Years | 2,163 (36.2%) | $85,889 |
| 65+ Years | 2,044 (34.2%) | $92,833 |
| Total | 5,978 (100.0%) | $81,433 |
Poverty in Wahiawa
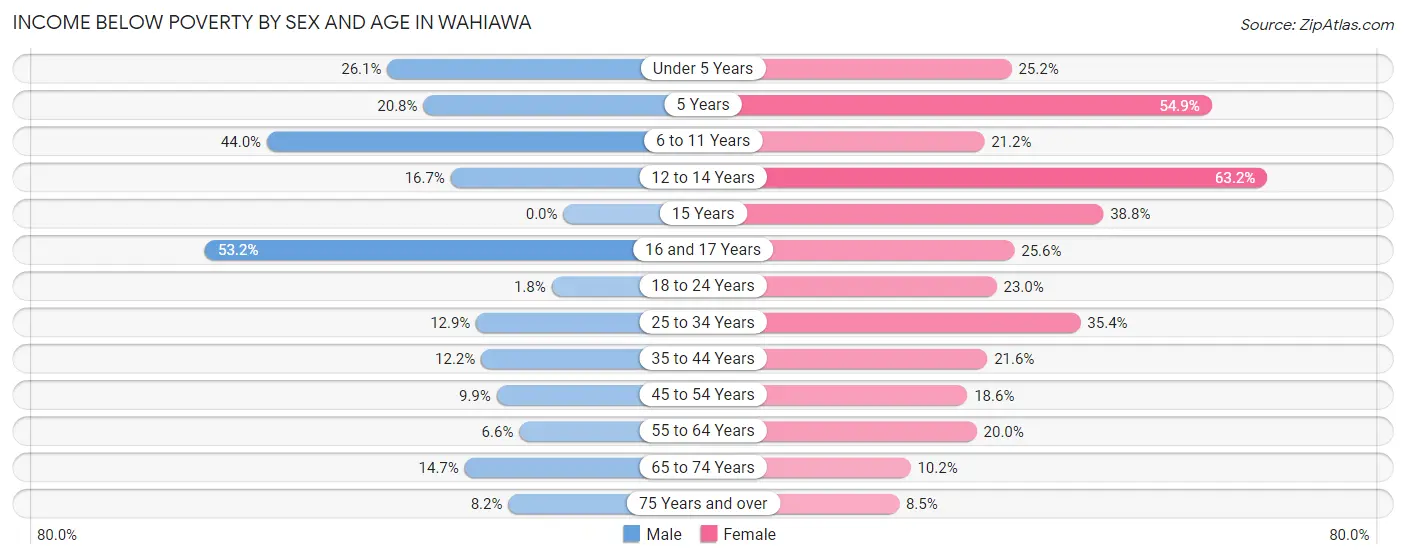
Income Below Poverty by Sex and Age in Wahiawa
With 14.7% poverty level for males and 22.5% for females among the residents of Wahiawa, 16 and 17 year old males and 12 to 14 year old females are the most vulnerable to poverty, with 133 males (53.2%) and 204 females (63.2%) in their respective age groups living below the poverty level.
| Age Bracket | Male | Female |
| Under 5 Years | 138 (26.1%) | 94 (25.2%) |
| 5 Years | 21 (20.8%) | 28 (54.9%) |
| 6 to 11 Years | 287 (44.0%) | 110 (21.1%) |
| 12 to 14 Years | 43 (16.7%) | 204 (63.2%) |
| 15 Years | 0 (0.0%) | 66 (38.8%) |
| 16 and 17 Years | 133 (53.2%) | 63 (25.6%) |
| 18 to 24 Years | 12 (1.8%) | 151 (23.0%) |
| 25 to 34 Years | 126 (12.9%) | 405 (35.4%) |
| 35 to 44 Years | 145 (12.2%) | 201 (21.6%) |
| 45 to 54 Years | 97 (9.9%) | 196 (18.6%) |
| 55 to 64 Years | 93 (6.6%) | 262 (20.0%) |
| 65 to 74 Years | 101 (14.7%) | 93 (10.2%) |
| 75 Years and over | 56 (8.2%) | 89 (8.5%) |
| Total | 1,252 (14.7%) | 1,962 (22.5%) |
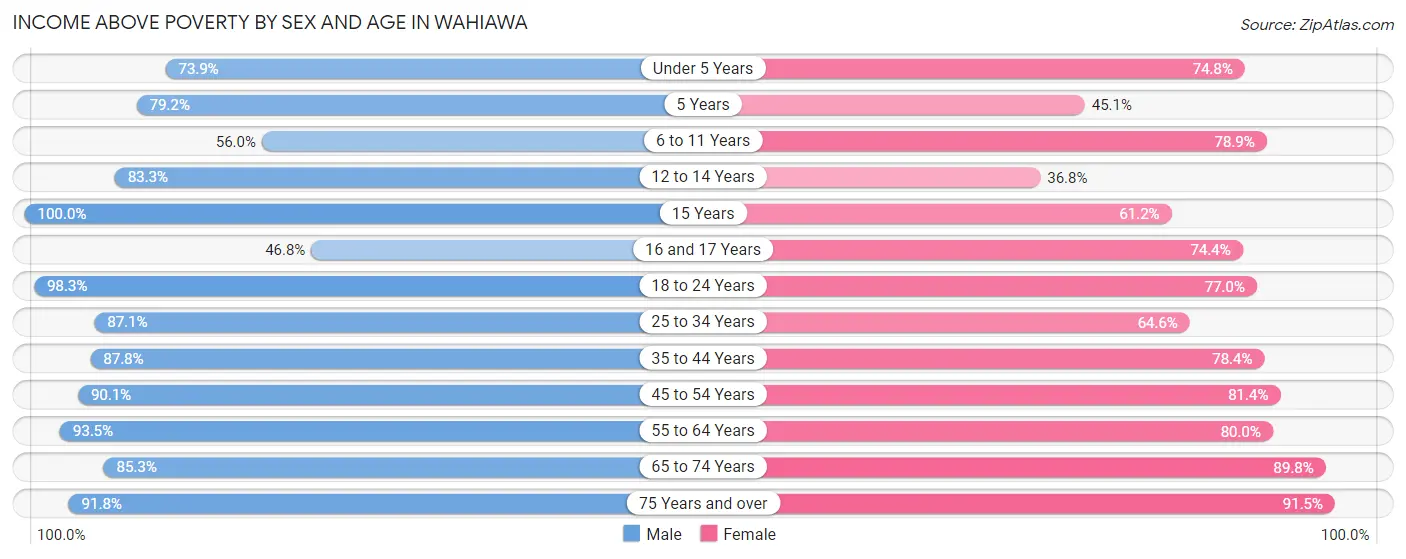
Income Above Poverty by Sex and Age in Wahiawa
According to the poverty statistics in Wahiawa, males aged 15 years and females aged 75 years and over are the age groups that are most secure financially, with 100.0% of males and 91.5% of females in these age groups living above the poverty line.
| Age Bracket | Male | Female |
| Under 5 Years | 390 (73.9%) | 279 (74.8%) |
| 5 Years | 80 (79.2%) | 23 (45.1%) |
| 6 to 11 Years | 365 (56.0%) | 410 (78.8%) |
| 12 to 14 Years | 214 (83.3%) | 119 (36.8%) |
| 15 Years | 97 (100.0%) | 104 (61.2%) |
| 16 and 17 Years | 117 (46.8%) | 183 (74.4%) |
| 18 to 24 Years | 674 (98.3%) | 506 (77.0%) |
| 25 to 34 Years | 848 (87.1%) | 738 (64.6%) |
| 35 to 44 Years | 1,043 (87.8%) | 730 (78.4%) |
| 45 to 54 Years | 882 (90.1%) | 856 (81.4%) |
| 55 to 64 Years | 1,327 (93.4%) | 1,047 (80.0%) |
| 65 to 74 Years | 588 (85.3%) | 819 (89.8%) |
| 75 Years and over | 629 (91.8%) | 959 (91.5%) |
| Total | 7,254 (85.3%) | 6,773 (77.5%) |
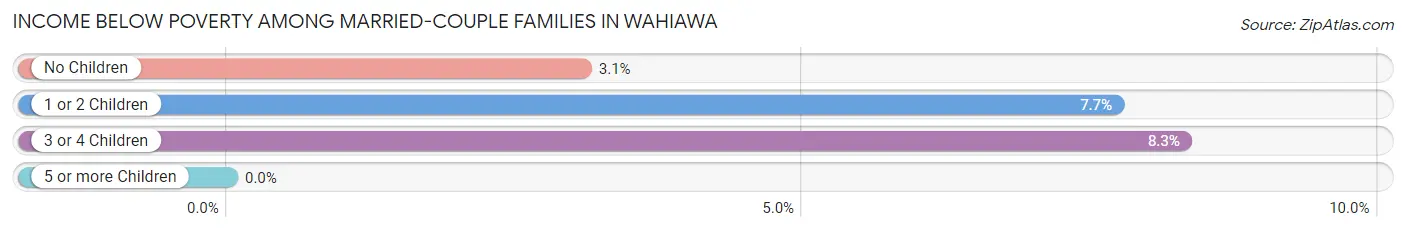
Income Below Poverty Among Married-Couple Families in Wahiawa
The poverty statistics for married-couple families in Wahiawa show that 4.8% or 126 of the total 2,631 families live below the poverty line. Families with 3 or 4 children have the highest poverty rate of 8.3%, comprising of 22 families. On the other hand, families with 5 or more children have the lowest poverty rate of 0.0%, which includes 0 families.
| Children | Above Poverty | Below Poverty |
| No Children | 1,607 (96.9%) | 51 (3.1%) |
| 1 or 2 Children | 634 (92.3%) | 53 (7.7%) |
| 3 or 4 Children | 243 (91.7%) | 22 (8.3%) |
| 5 or more Children | 21 (100.0%) | 0 (0.0%) |
| Total | 2,505 (95.2%) | 126 (4.8%) |
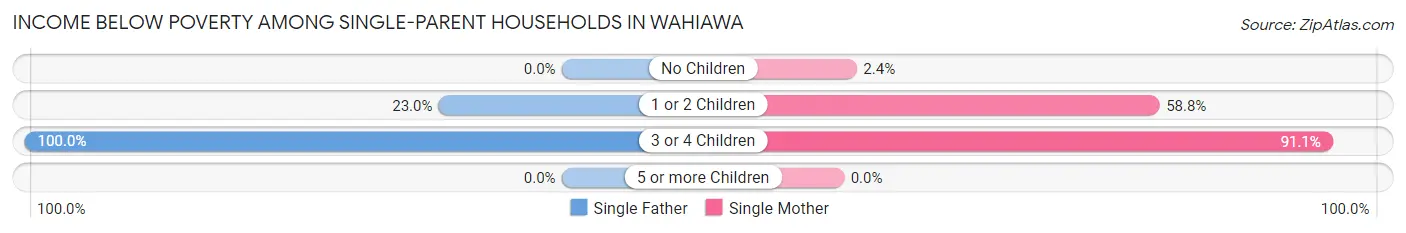
Income Below Poverty Among Single-Parent Households in Wahiawa
According to the poverty data in Wahiawa, 15.2% or 66 single-father households and 43.9% or 446 single-mother households are living below the poverty line. Among single-father households, those with 3 or 4 children have the highest poverty rate, with 24 households (100.0%) experiencing poverty. Likewise, among single-mother households, those with 3 or 4 children have the highest poverty rate, with 245 households (91.1%) falling below the poverty line.
| Children | Single Father | Single Mother |
| No Children | 0 (0.0%) | 10 (2.4%) |
| 1 or 2 Children | 42 (23.0%) | 191 (58.8%) |
| 3 or 4 Children | 24 (100.0%) | 245 (91.1%) |
| 5 or more Children | 0 (0.0%) | 0 (0.0%) |
| Total | 66 (15.2%) | 446 (43.9%) |
Income Below Poverty Among Married-Couple vs Single-Parent Households in Wahiawa
The poverty data for Wahiawa shows that 126 of the married-couple family households (4.8%) and 512 of the single-parent households (35.3%) are living below the poverty level. Within the married-couple family households, those with 3 or 4 children have the highest poverty rate, with 22 households (8.3%) falling below the poverty line. Among the single-parent households, those with 3 or 4 children have the highest poverty rate, with 269 household (91.8%) living below poverty.
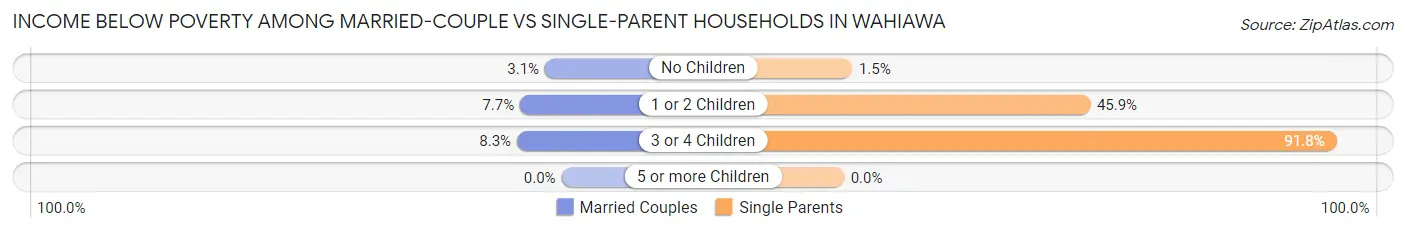
| Children | Married-Couple Families | Single-Parent Households |
| No Children | 51 (3.1%) | 10 (1.5%) |
| 1 or 2 Children | 53 (7.7%) | 233 (45.9%) |
| 3 or 4 Children | 22 (8.3%) | 269 (91.8%) |
| 5 or more Children | 0 (0.0%) | 0 (0.0%) |
| Total | 126 (4.8%) | 512 (35.3%) |
Employment Characteristics in Wahiawa
Employment by Class of Employer in Wahiawa
Among the 8,031 employed individuals in Wahiawa, private company employees (5,014 | 62.4%), federal government employees (812 | 10.1%), and state government employees (702 | 8.7%) make up the most common classes of employment.
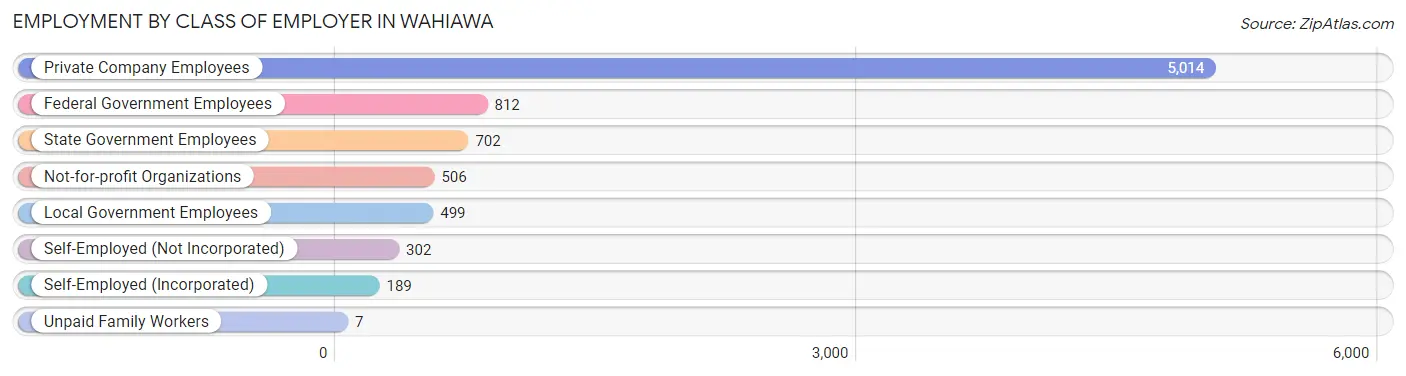
| Employer Class | # Employees | % Employees |
| Private Company Employees | 5,014 | 62.4% |
| Self-Employed (Incorporated) | 189 | 2.4% |
| Self-Employed (Not Incorporated) | 302 | 3.8% |
| Not-for-profit Organizations | 506 | 6.3% |
| Local Government Employees | 499 | 6.2% |
| State Government Employees | 702 | 8.7% |
| Federal Government Employees | 812 | 10.1% |
| Unpaid Family Workers | 7 | 0.1% |
| Total | 8,031 | 100.0% |
Employment Status by Age in Wahiawa
According to the labor force statistics for Wahiawa, out of the total population over 16 years of age (14,292), 60.0% or 8,575 individuals are in the labor force, with 3.6% or 309 of them unemployed. The age group with the highest labor force participation rate is 25 to 29 years, with 85.0% or 652 individuals in the labor force. Within the labor force, the 20 to 24 years age range has the highest percentage of unemployed individuals, with 11.7% or 94 of them being unemployed.
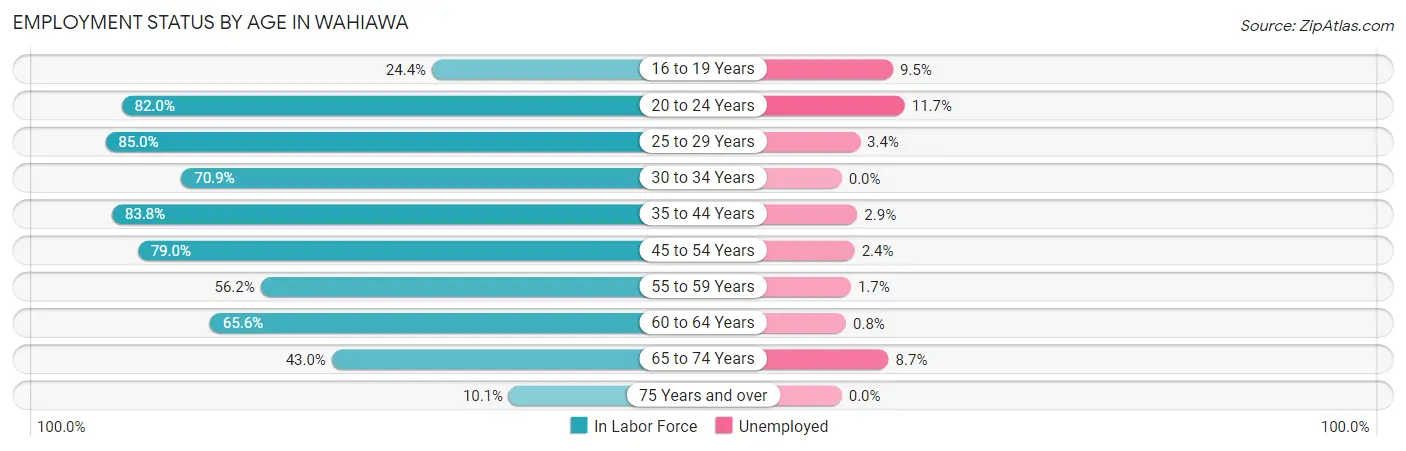
| Age Bracket | In Labor Force | Unemployed |
| 16 to 19 Years | 210 (24.4%) | 20 (9.5%) |
| 20 to 24 Years | 802 (82.0%) | 94 (11.7%) |
| 25 to 29 Years | 652 (85.0%) | 22 (3.4%) |
| 30 to 34 Years | 961 (70.9%) | 0 (0.0%) |
| 35 to 44 Years | 1,776 (83.8%) | 52 (2.9%) |
| 45 to 54 Years | 1,609 (79.0%) | 39 (2.4%) |
| 55 to 59 Years | 707 (56.2%) | 12 (1.7%) |
| 60 to 64 Years | 974 (65.6%) | 8 (0.8%) |
| 65 to 74 Years | 699 (43.0%) | 61 (8.7%) |
| 75 Years and over | 183 (10.1%) | 0 (0.0%) |
| Total | 8,575 (60.0%) | 309 (3.6%) |
Employment Status by Educational Attainment in Wahiawa
According to labor force statistics for Wahiawa, 74.0% of individuals (6,676) out of the total population between 25 and 64 years of age (9,021) are in the labor force, with 2.0% or 134 of them being unemployed. The group with the highest labor force participation rate are those with the educational attainment of bachelor's degree or higher, with 80.7% or 1,508 individuals in the labor force. Within the labor force, individuals with high school diploma education have the highest percentage of unemployment, with 3.6% or 79 of them being unemployed.
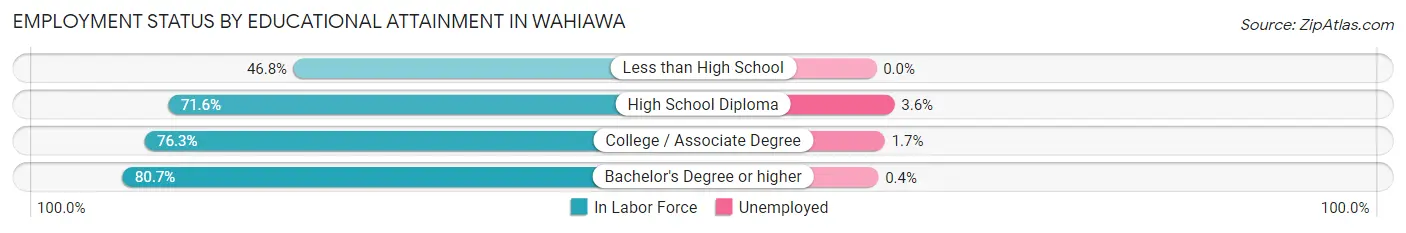
| Educational Attainment | In Labor Force | Unemployed |
| Less than High School | 220 (46.8%) | 0 (0.0%) |
| High School Diploma | 2,205 (71.6%) | 111 (3.6%) |
| College / Associate Degree | 2,748 (76.3%) | 61 (1.7%) |
| Bachelor's Degree or higher | 1,508 (80.7%) | 7 (0.4%) |
| Total | 6,676 (74.0%) | 180 (2.0%) |
Employment Occupations by Sex in Wahiawa
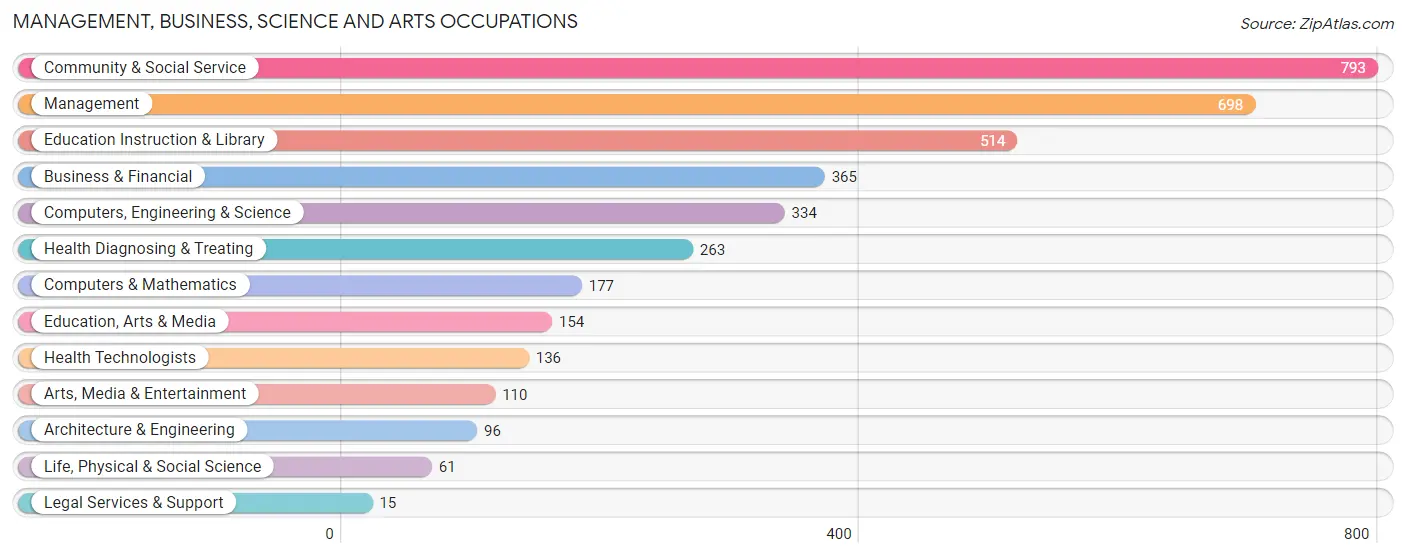
Management, Business, Science and Arts Occupations
The most common Management, Business, Science and Arts occupations in Wahiawa are Community & Social Service (793 | 9.8%), Management (698 | 8.7%), Education Instruction & Library (514 | 6.4%), Business & Financial (365 | 4.5%), and Computers, Engineering & Science (334 | 4.1%).
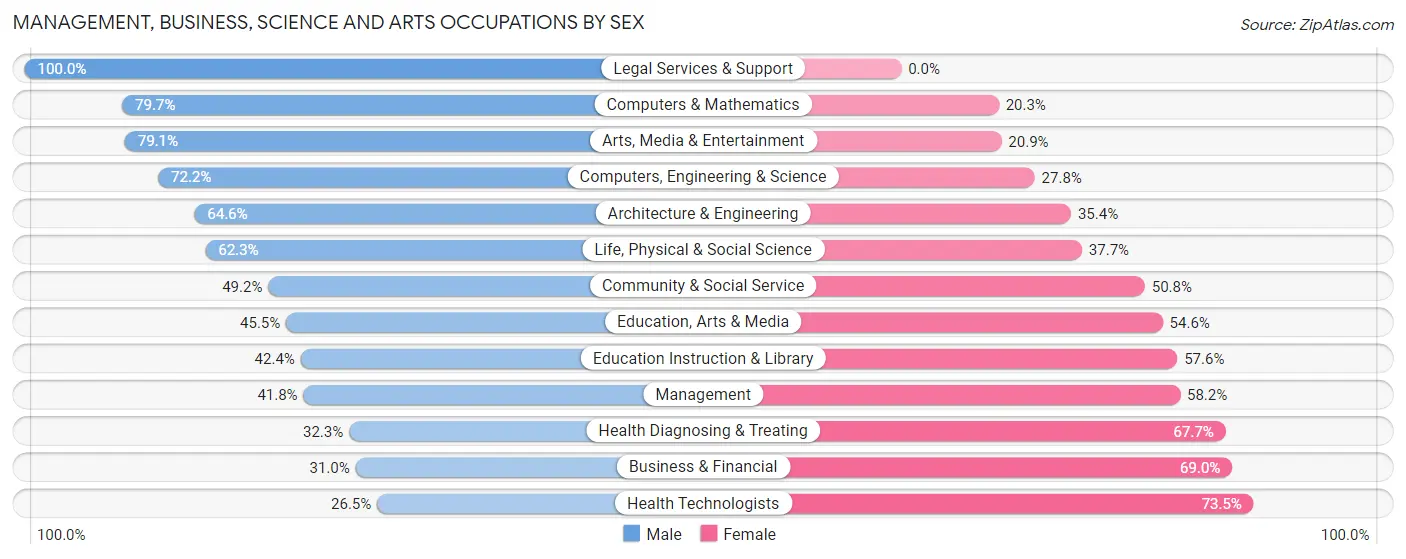
Management, Business, Science and Arts Occupations by Sex
Within the Management, Business, Science and Arts occupations in Wahiawa, the most male-oriented occupations are Legal Services & Support (100.0%), Computers & Mathematics (79.7%), and Arts, Media & Entertainment (79.1%), while the most female-oriented occupations are Health Technologists (73.5%), Business & Financial (69.0%), and Health Diagnosing & Treating (67.7%).
| Occupation | Male | Female |
| Management | 292 (41.8%) | 406 (58.2%) |
| Business & Financial | 113 (31.0%) | 252 (69.0%) |
| Computers, Engineering & Science | 241 (72.2%) | 93 (27.8%) |
| Computers & Mathematics | 141 (79.7%) | 36 (20.3%) |
| Architecture & Engineering | 62 (64.6%) | 34 (35.4%) |
| Life, Physical & Social Science | 38 (62.3%) | 23 (37.7%) |
| Community & Social Service | 390 (49.2%) | 403 (50.8%) |
| Education, Arts & Media | 70 (45.5%) | 84 (54.5%) |
| Legal Services & Support | 15 (100.0%) | 0 (0.0%) |
| Education Instruction & Library | 218 (42.4%) | 296 (57.6%) |
| Arts, Media & Entertainment | 87 (79.1%) | 23 (20.9%) |
| Health Diagnosing & Treating | 85 (32.3%) | 178 (67.7%) |
| Health Technologists | 36 (26.5%) | 100 (73.5%) |
| Total (Category) | 1,121 (45.7%) | 1,332 (54.3%) |
| Total (Overall) | 4,216 (52.3%) | 3,845 (47.7%) |
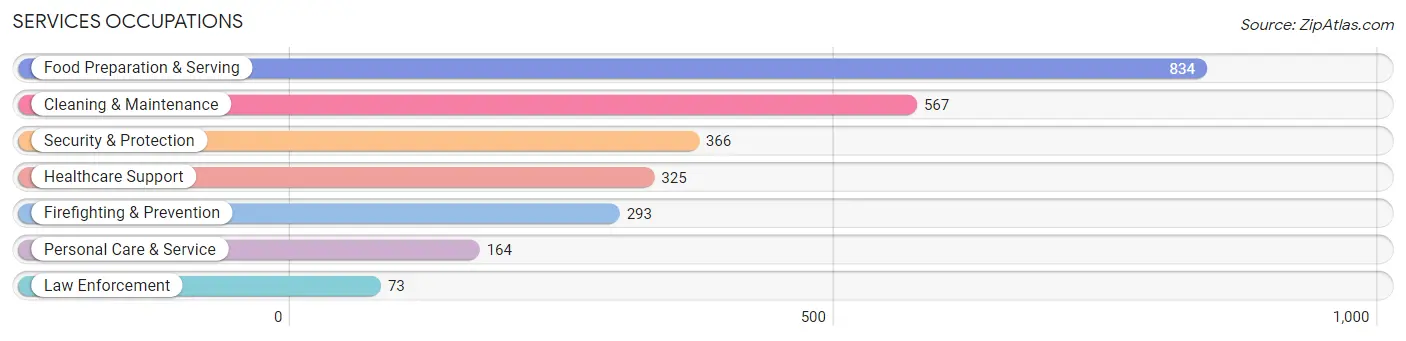
Services Occupations
The most common Services occupations in Wahiawa are Food Preparation & Serving (834 | 10.3%), Cleaning & Maintenance (567 | 7.0%), Security & Protection (366 | 4.5%), Healthcare Support (325 | 4.0%), and Firefighting & Prevention (293 | 3.6%).
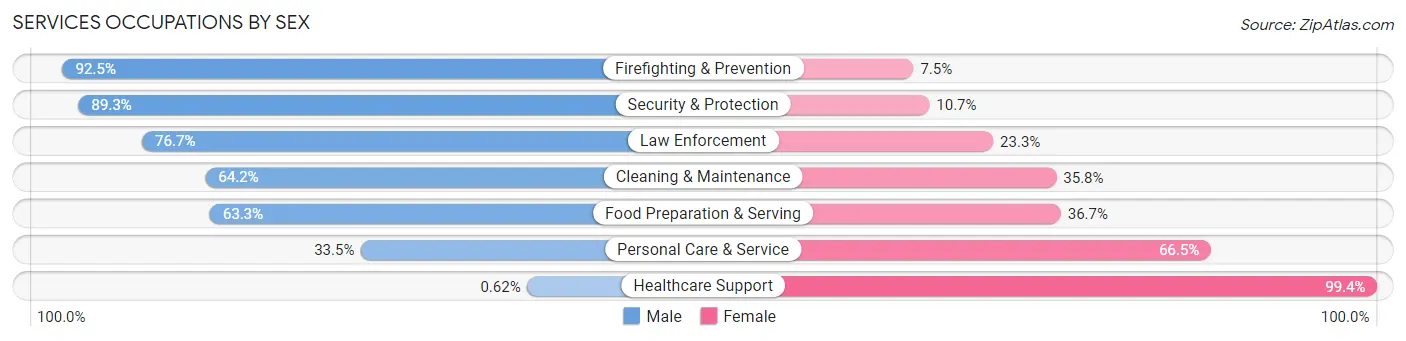
Services Occupations by Sex
Within the Services occupations in Wahiawa, the most male-oriented occupations are Firefighting & Prevention (92.5%), Security & Protection (89.3%), and Law Enforcement (76.7%), while the most female-oriented occupations are Healthcare Support (99.4%), Personal Care & Service (66.5%), and Food Preparation & Serving (36.7%).
| Occupation | Male | Female |
| Healthcare Support | 2 (0.6%) | 323 (99.4%) |
| Security & Protection | 327 (89.3%) | 39 (10.7%) |
| Firefighting & Prevention | 271 (92.5%) | 22 (7.5%) |
| Law Enforcement | 56 (76.7%) | 17 (23.3%) |
| Food Preparation & Serving | 528 (63.3%) | 306 (36.7%) |
| Cleaning & Maintenance | 364 (64.2%) | 203 (35.8%) |
| Personal Care & Service | 55 (33.5%) | 109 (66.5%) |
| Total (Category) | 1,276 (56.6%) | 980 (43.4%) |
| Total (Overall) | 4,216 (52.3%) | 3,845 (47.7%) |
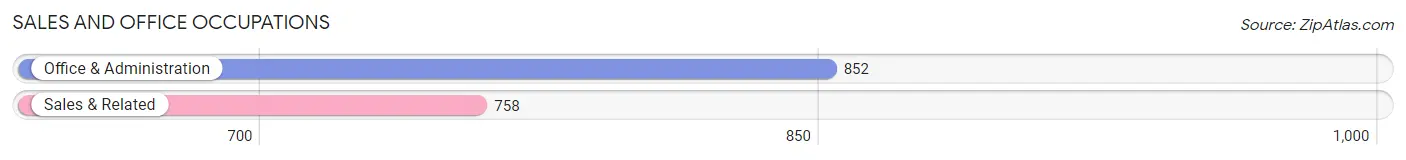
Sales and Office Occupations
The most common Sales and Office occupations in Wahiawa are Office & Administration (852 | 10.6%), and Sales & Related (758 | 9.4%).
Sales and Office Occupations by Sex
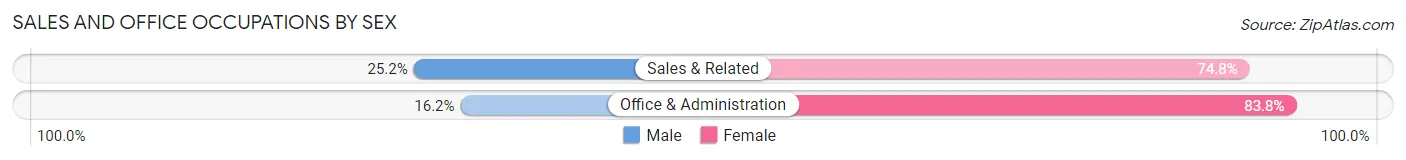
| Occupation | Male | Female |
| Sales & Related | 191 (25.2%) | 567 (74.8%) |
| Office & Administration | 138 (16.2%) | 714 (83.8%) |
| Total (Category) | 329 (20.4%) | 1,281 (79.6%) |
| Total (Overall) | 4,216 (52.3%) | 3,845 (47.7%) |
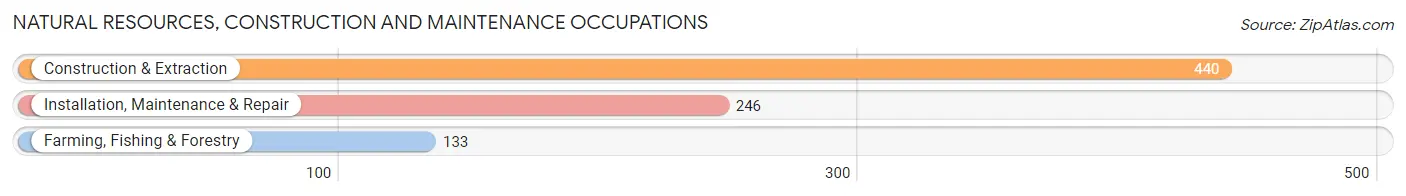
Natural Resources, Construction and Maintenance Occupations
The most common Natural Resources, Construction and Maintenance occupations in Wahiawa are Construction & Extraction (440 | 5.5%), Installation, Maintenance & Repair (246 | 3.0%), and Farming, Fishing & Forestry (133 | 1.7%).
Natural Resources, Construction and Maintenance Occupations by Sex
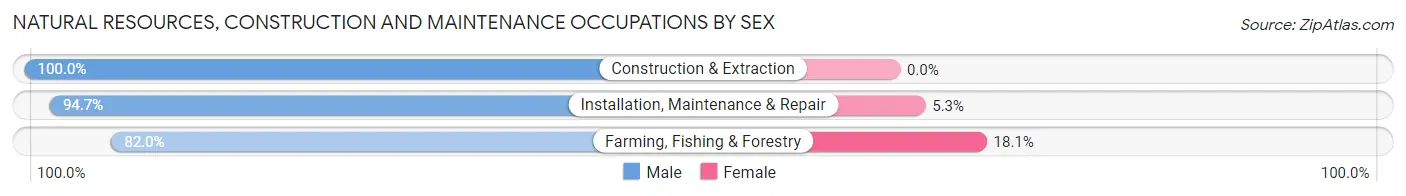
| Occupation | Male | Female |
| Farming, Fishing & Forestry | 109 (82.0%) | 24 (18.0%) |
| Construction & Extraction | 440 (100.0%) | 0 (0.0%) |
| Installation, Maintenance & Repair | 233 (94.7%) | 13 (5.3%) |
| Total (Category) | 782 (95.5%) | 37 (4.5%) |
| Total (Overall) | 4,216 (52.3%) | 3,845 (47.7%) |
Production, Transportation and Moving Occupations
The most common Production, Transportation and Moving occupations in Wahiawa are Transportation (384 | 4.8%), Material Moving (299 | 3.7%), and Production (240 | 3.0%).
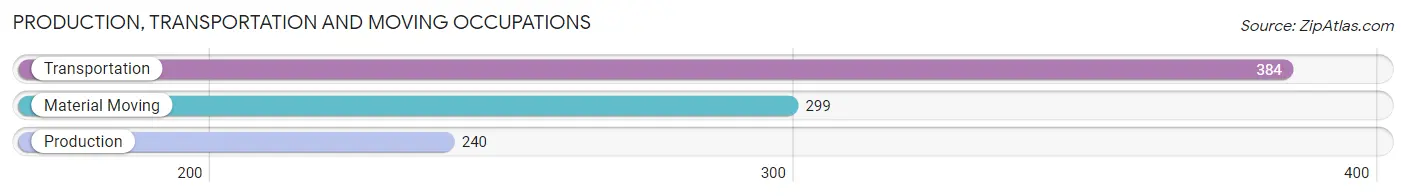
Production, Transportation and Moving Occupations by Sex
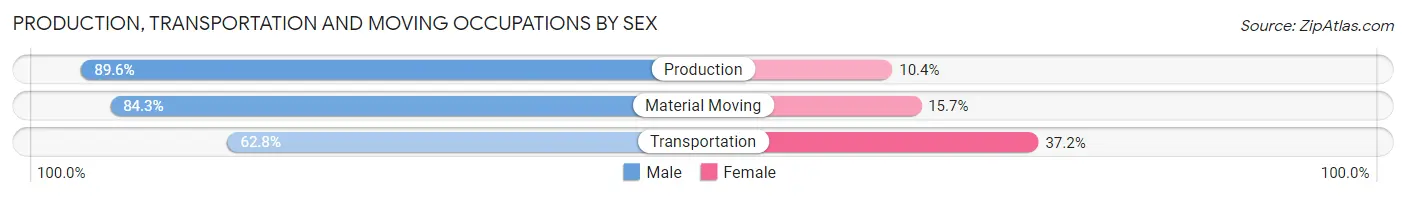
| Occupation | Male | Female |
| Production | 215 (89.6%) | 25 (10.4%) |
| Transportation | 241 (62.8%) | 143 (37.2%) |
| Material Moving | 252 (84.3%) | 47 (15.7%) |
| Total (Category) | 708 (76.7%) | 215 (23.3%) |
| Total (Overall) | 4,216 (52.3%) | 3,845 (47.7%) |
Employment Industries by Sex in Wahiawa
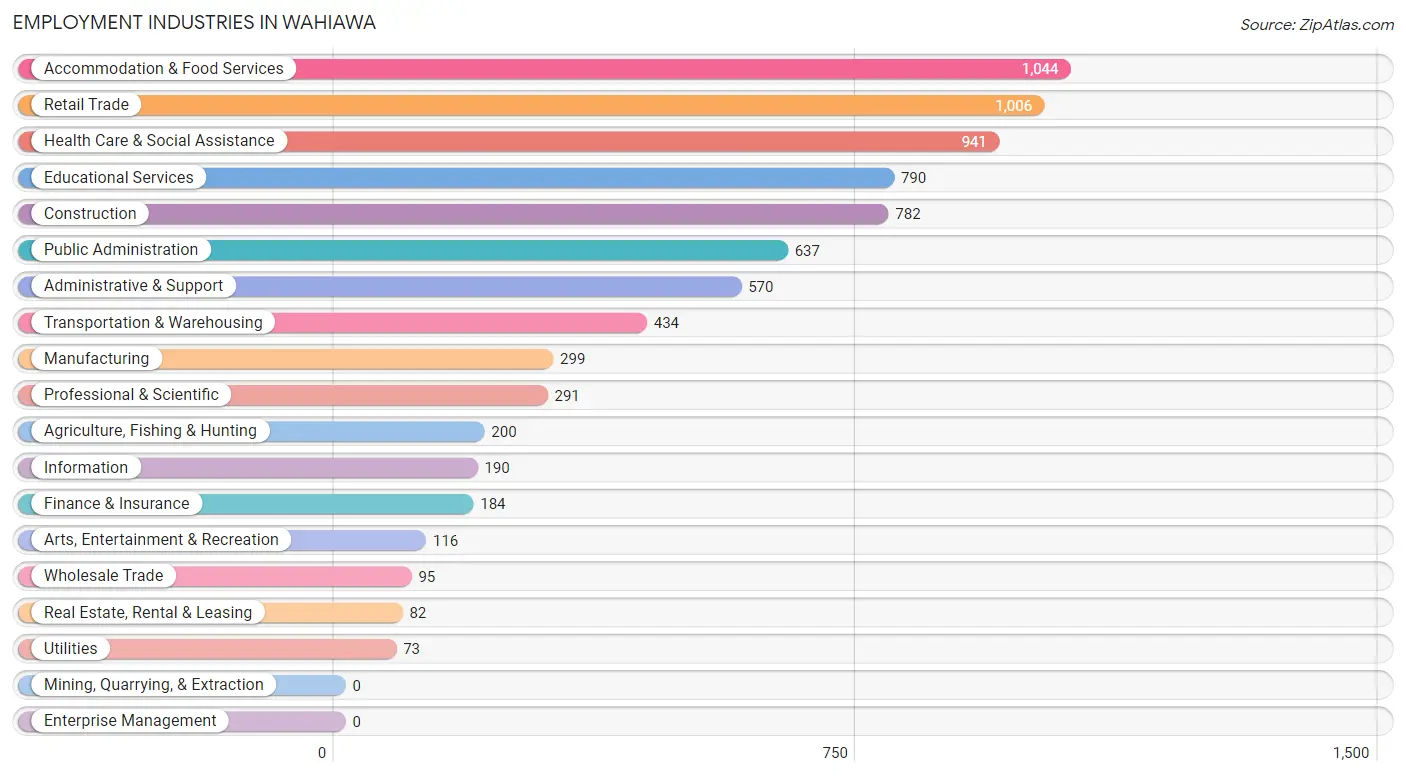
Employment Industries in Wahiawa
The major employment industries in Wahiawa include Accommodation & Food Services (1,044 | 13.0%), Retail Trade (1,006 | 12.5%), Health Care & Social Assistance (941 | 11.7%), Educational Services (790 | 9.8%), and Construction (782 | 9.7%).
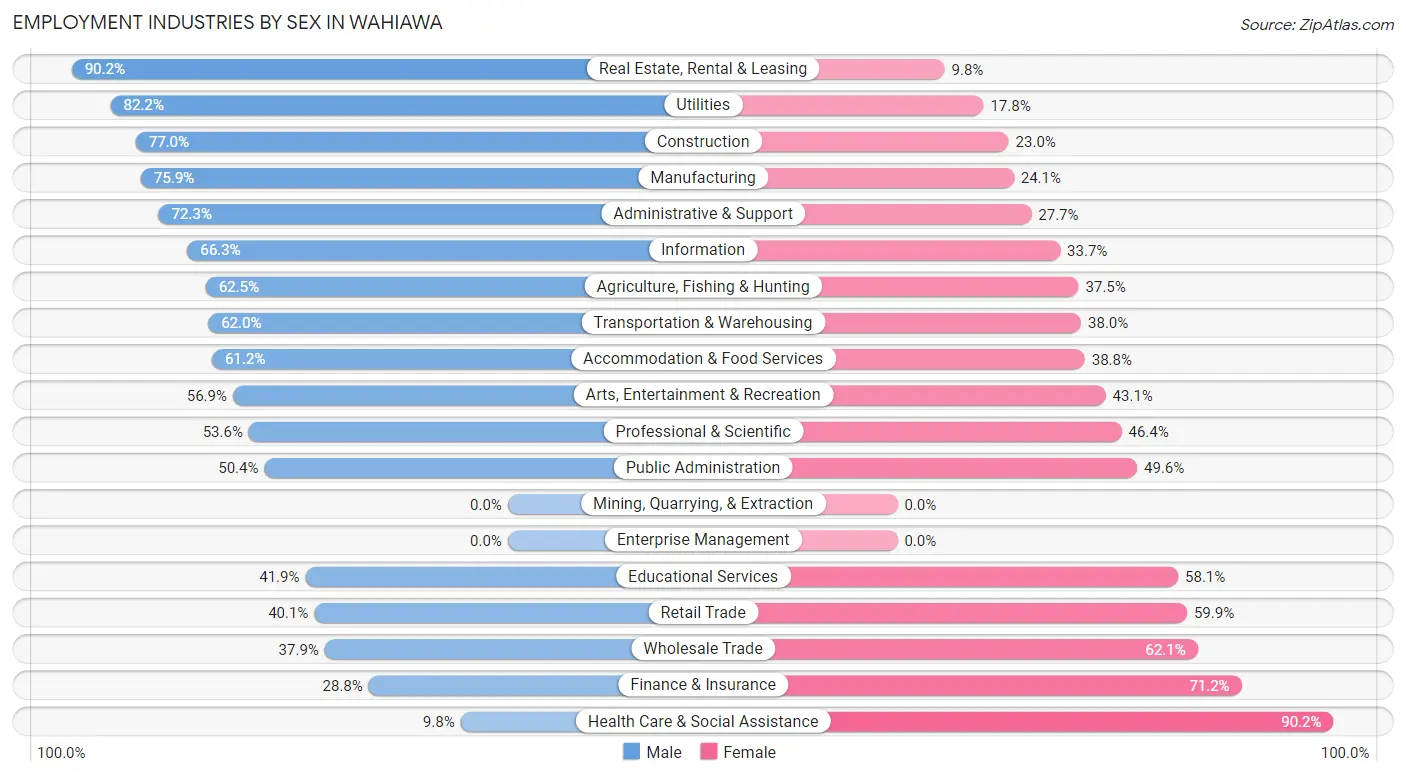
Employment Industries by Sex in Wahiawa
The Wahiawa industries that see more men than women are Real Estate, Rental & Leasing (90.2%), Utilities (82.2%), and Construction (77.0%), whereas the industries that tend to have a higher number of women are Health Care & Social Assistance (90.2%), Finance & Insurance (71.2%), and Wholesale Trade (62.1%).
| Industry | Male | Female |
| Agriculture, Fishing & Hunting | 125 (62.5%) | 75 (37.5%) |
| Mining, Quarrying, & Extraction | 0 (0.0%) | 0 (0.0%) |
| Construction | 602 (77.0%) | 180 (23.0%) |
| Manufacturing | 227 (75.9%) | 72 (24.1%) |
| Wholesale Trade | 36 (37.9%) | 59 (62.1%) |
| Retail Trade | 403 (40.1%) | 603 (59.9%) |
| Transportation & Warehousing | 269 (62.0%) | 165 (38.0%) |
| Utilities | 60 (82.2%) | 13 (17.8%) |
| Information | 126 (66.3%) | 64 (33.7%) |
| Finance & Insurance | 53 (28.8%) | 131 (71.2%) |
| Real Estate, Rental & Leasing | 74 (90.2%) | 8 (9.8%) |
| Professional & Scientific | 156 (53.6%) | 135 (46.4%) |
| Enterprise Management | 0 (0.0%) | 0 (0.0%) |
| Administrative & Support | 412 (72.3%) | 158 (27.7%) |
| Educational Services | 331 (41.9%) | 459 (58.1%) |
| Health Care & Social Assistance | 92 (9.8%) | 849 (90.2%) |
| Arts, Entertainment & Recreation | 66 (56.9%) | 50 (43.1%) |
| Accommodation & Food Services | 639 (61.2%) | 405 (38.8%) |
| Public Administration | 321 (50.4%) | 316 (49.6%) |
| Total | 4,216 (52.3%) | 3,845 (47.7%) |
Education in Wahiawa
School Enrollment in Wahiawa
The most common levels of schooling among the 3,557 students in Wahiawa are high school (1,038 | 29.2%), middle school (706 | 19.9%), and elementary school (659 | 18.5%).
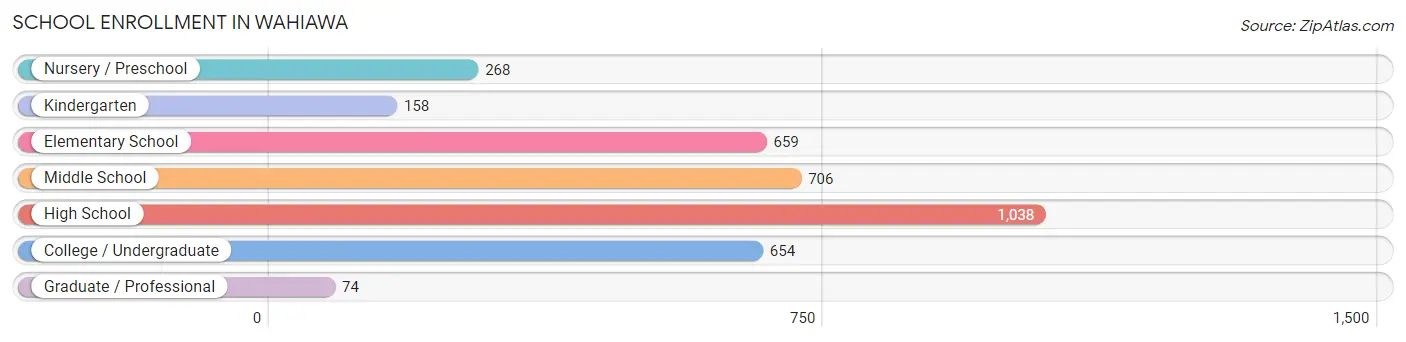
| School Level | # Students | % Students |
| Nursery / Preschool | 268 | 7.5% |
| Kindergarten | 158 | 4.4% |
| Elementary School | 659 | 18.5% |
| Middle School | 706 | 19.9% |
| High School | 1,038 | 29.2% |
| College / Undergraduate | 654 | 18.4% |
| Graduate / Professional | 74 | 2.1% |
| Total | 3,557 | 100.0% |
School Enrollment by Age by Funding Source in Wahiawa
Out of a total of 3,557 students who are enrolled in schools in Wahiawa, 622 (17.5%) attend a private institution, while the remaining 2,935 (82.5%) are enrolled in public schools. The age group of 35 years and over has the highest likelihood of being enrolled in private schools, with 117 (47.0% in the age bracket) enrolled. Conversely, the age group of 15 to 17 year olds has the lowest likelihood of being enrolled in a private school, with 718 (95.2% in the age bracket) attending a public institution.
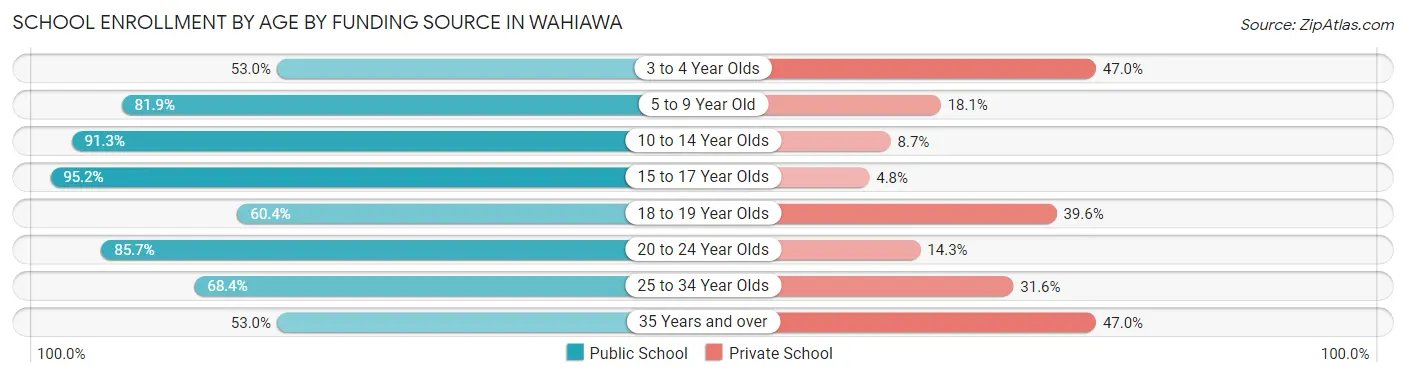
| Age Bracket | Public School | Private School |
| 3 to 4 Year Olds | 105 (53.0%) | 93 (47.0%) |
| 5 to 9 Year Old | 680 (81.9%) | 150 (18.1%) |
| 10 to 14 Year Olds | 898 (91.3%) | 86 (8.7%) |
| 15 to 17 Year Olds | 718 (95.2%) | 36 (4.8%) |
| 18 to 19 Year Olds | 67 (60.4%) | 44 (39.6%) |
| 20 to 24 Year Olds | 204 (85.7%) | 34 (14.3%) |
| 25 to 34 Year Olds | 132 (68.4%) | 61 (31.6%) |
| 35 Years and over | 132 (53.0%) | 117 (47.0%) |
| Total | 2,935 (82.5%) | 622 (17.5%) |
Educational Attainment by Field of Study in Wahiawa
Business (635 | 22.8%), education (379 | 13.6%), social sciences (239 | 8.6%), arts & humanities (211 | 7.6%), and engineering (193 | 6.9%) are the most common fields of study among 2,788 individuals in Wahiawa who have obtained a bachelor's degree or higher.
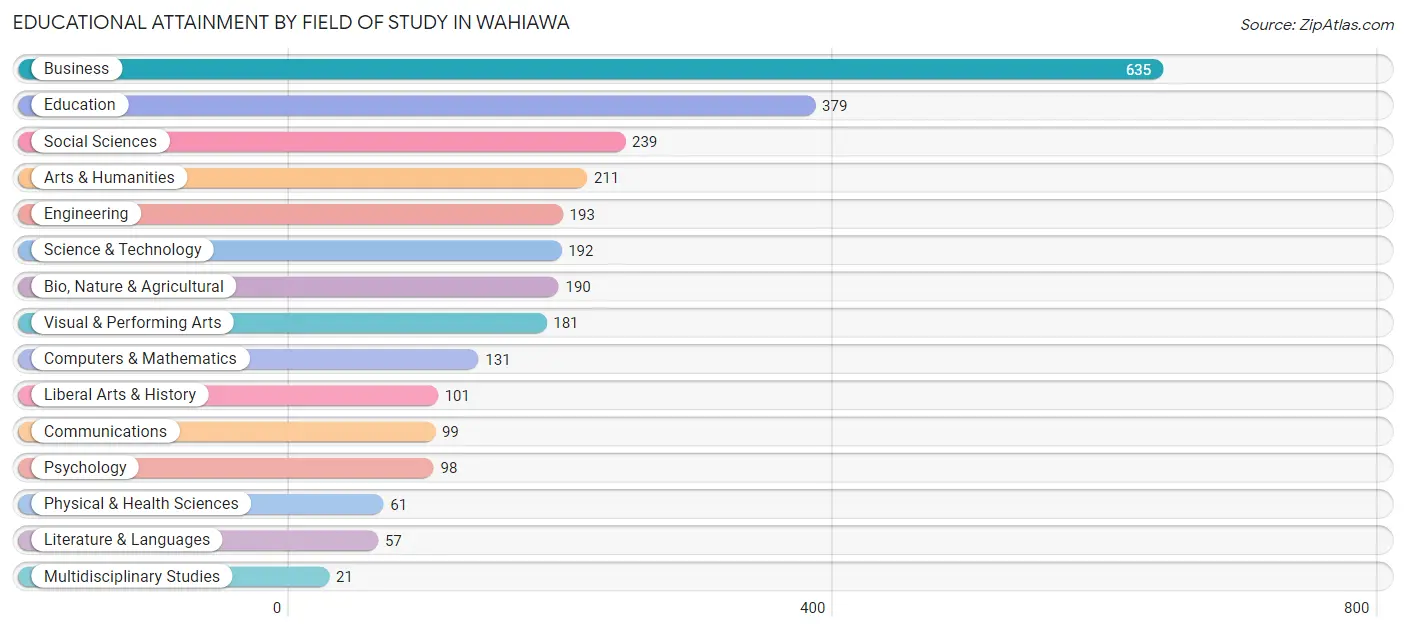
| Field of Study | # Graduates | % Graduates |
| Computers & Mathematics | 131 | 4.7% |
| Bio, Nature & Agricultural | 190 | 6.8% |
| Physical & Health Sciences | 61 | 2.2% |
| Psychology | 98 | 3.5% |
| Social Sciences | 239 | 8.6% |
| Engineering | 193 | 6.9% |
| Multidisciplinary Studies | 21 | 0.7% |
| Science & Technology | 192 | 6.9% |
| Business | 635 | 22.8% |
| Education | 379 | 13.6% |
| Literature & Languages | 57 | 2.0% |
| Liberal Arts & History | 101 | 3.6% |
| Visual & Performing Arts | 181 | 6.5% |
| Communications | 99 | 3.5% |
| Arts & Humanities | 211 | 7.6% |
| Total | 2,788 | 100.0% |
Transportation & Commute in Wahiawa
Vehicle Availability by Sex in Wahiawa
The most prevalent vehicle ownership categories in Wahiawa are males with 2 vehicles (1,587, accounting for 37.4%) and females with 2 vehicles (1,373, making up 42.1%).
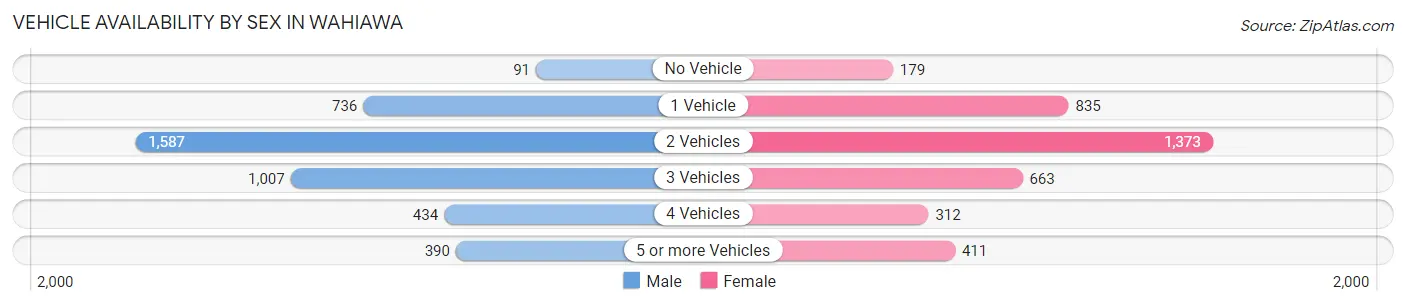
| Vehicles Available | Male | Female |
| No Vehicle | 91 (2.1%) | 179 (4.7%) |
| 1 Vehicle | 736 (17.3%) | 835 (22.1%) |
| 2 Vehicles | 1,587 (37.4%) | 1,373 (36.4%) |
| 3 Vehicles | 1,007 (23.7%) | 663 (17.6%) |
| 4 Vehicles | 434 (10.2%) | 312 (8.3%) |
| 5 or more Vehicles | 390 (9.2%) | 411 (10.9%) |
| Total | 4,245 (100.0%) | 3,773 (100.0%) |
Commute Time in Wahiawa
The most frequently occuring commute durations in Wahiawa are 30 to 34 minutes (1,362 commuters, 18.1%), 20 to 24 minutes (1,071 commuters, 14.2%), and 60 to 89 minutes (869 commuters, 11.5%).
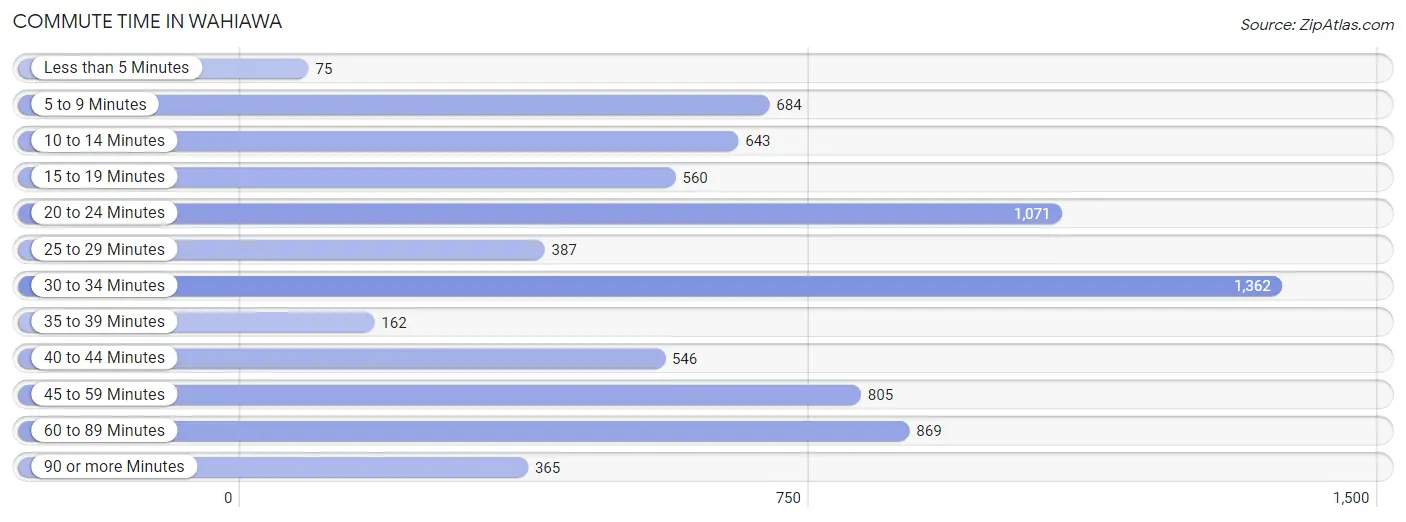
| Commute Time | # Commuters | % Commuters |
| Less than 5 Minutes | 75 | 1.0% |
| 5 to 9 Minutes | 684 | 9.1% |
| 10 to 14 Minutes | 643 | 8.5% |
| 15 to 19 Minutes | 560 | 7.4% |
| 20 to 24 Minutes | 1,071 | 14.2% |
| 25 to 29 Minutes | 387 | 5.1% |
| 30 to 34 Minutes | 1,362 | 18.1% |
| 35 to 39 Minutes | 162 | 2.1% |
| 40 to 44 Minutes | 546 | 7.2% |
| 45 to 59 Minutes | 805 | 10.7% |
| 60 to 89 Minutes | 869 | 11.5% |
| 90 or more Minutes | 365 | 4.9% |
Commute Time by Sex in Wahiawa
The most common commute times in Wahiawa are 30 to 34 minutes (846 commuters, 20.5%) for males and 30 to 34 minutes (516 commuters, 15.1%) for females.
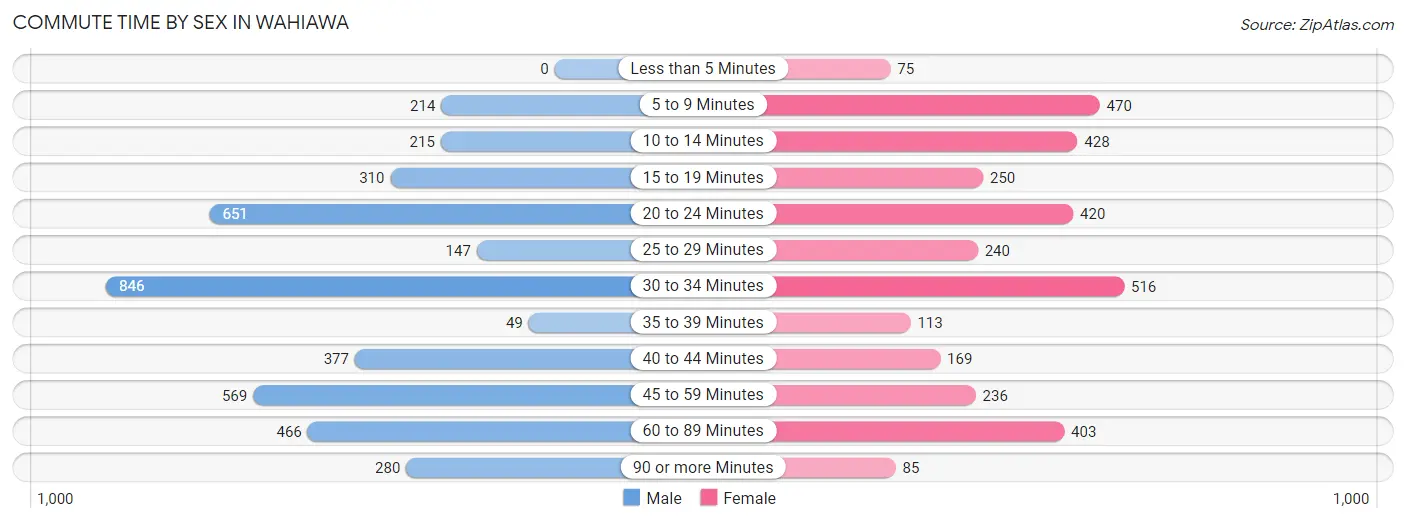
| Commute Time | Male | Female |
| Less than 5 Minutes | 0 (0.0%) | 75 (2.2%) |
| 5 to 9 Minutes | 214 (5.2%) | 470 (13.8%) |
| 10 to 14 Minutes | 215 (5.2%) | 428 (12.6%) |
| 15 to 19 Minutes | 310 (7.5%) | 250 (7.3%) |
| 20 to 24 Minutes | 651 (15.8%) | 420 (12.3%) |
| 25 to 29 Minutes | 147 (3.6%) | 240 (7.0%) |
| 30 to 34 Minutes | 846 (20.5%) | 516 (15.1%) |
| 35 to 39 Minutes | 49 (1.2%) | 113 (3.3%) |
| 40 to 44 Minutes | 377 (9.1%) | 169 (5.0%) |
| 45 to 59 Minutes | 569 (13.8%) | 236 (6.9%) |
| 60 to 89 Minutes | 466 (11.3%) | 403 (11.8%) |
| 90 or more Minutes | 280 (6.8%) | 85 (2.5%) |
Time of Departure to Work by Sex in Wahiawa
The most frequent times of departure to work in Wahiawa are 7:00 AM to 7:29 AM (719, 17.4%) for males and 8:00 AM to 8:29 AM (476, 14.0%) for females.
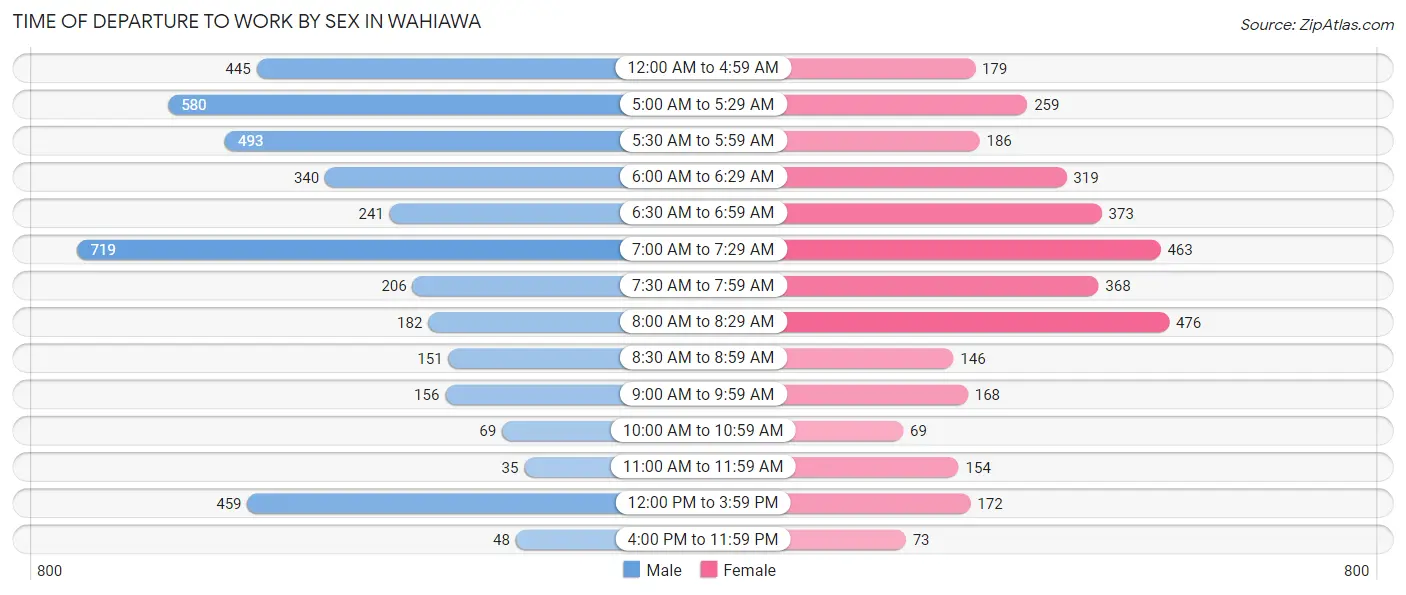
| Time of Departure | Male | Female |
| 12:00 AM to 4:59 AM | 445 (10.8%) | 179 (5.3%) |
| 5:00 AM to 5:29 AM | 580 (14.1%) | 259 (7.6%) |
| 5:30 AM to 5:59 AM | 493 (11.9%) | 186 (5.5%) |
| 6:00 AM to 6:29 AM | 340 (8.2%) | 319 (9.4%) |
| 6:30 AM to 6:59 AM | 241 (5.8%) | 373 (11.0%) |
| 7:00 AM to 7:29 AM | 719 (17.4%) | 463 (13.6%) |
| 7:30 AM to 7:59 AM | 206 (5.0%) | 368 (10.8%) |
| 8:00 AM to 8:29 AM | 182 (4.4%) | 476 (14.0%) |
| 8:30 AM to 8:59 AM | 151 (3.7%) | 146 (4.3%) |
| 9:00 AM to 9:59 AM | 156 (3.8%) | 168 (4.9%) |
| 10:00 AM to 10:59 AM | 69 (1.7%) | 69 (2.0%) |
| 11:00 AM to 11:59 AM | 35 (0.9%) | 154 (4.5%) |
| 12:00 PM to 3:59 PM | 459 (11.1%) | 172 (5.1%) |
| 4:00 PM to 11:59 PM | 48 (1.2%) | 73 (2.1%) |
| Total | 4,124 (100.0%) | 3,405 (100.0%) |
Housing Occupancy in Wahiawa
Occupancy by Ownership in Wahiawa
Of the total 5,978 dwellings in Wahiawa, owner-occupied units account for 3,062 (51.2%), while renter-occupied units make up 2,916 (48.8%).
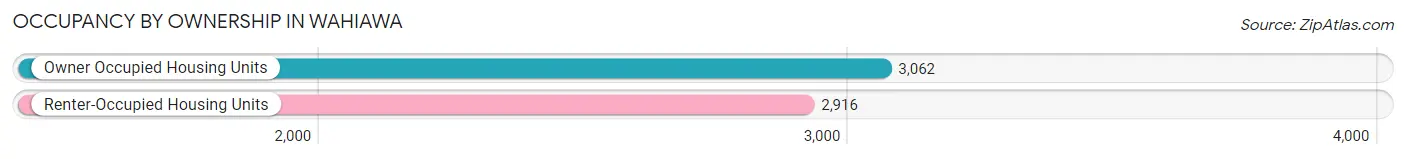
| Occupancy | # Housing Units | % Housing Units |
| Owner Occupied Housing Units | 3,062 | 51.2% |
| Renter-Occupied Housing Units | 2,916 | 48.8% |
| Total Occupied Housing Units | 5,978 | 100.0% |
Occupancy by Household Size in Wahiawa
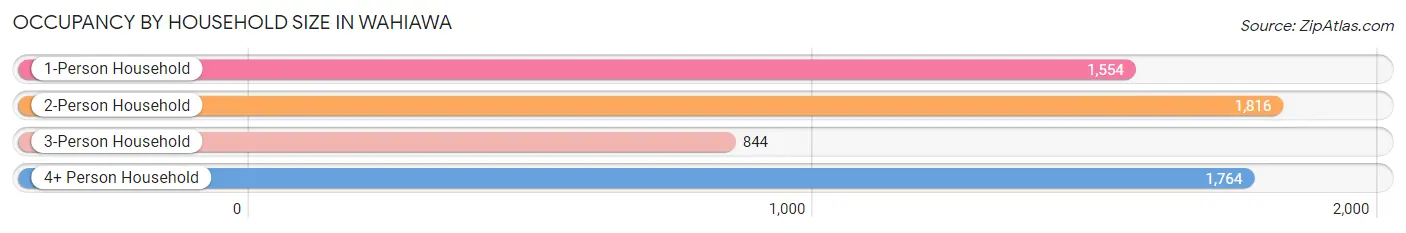
| Household Size | # Housing Units | % Housing Units |
| 1-Person Household | 1,554 | 26.0% |
| 2-Person Household | 1,816 | 30.4% |
| 3-Person Household | 844 | 14.1% |
| 4+ Person Household | 1,764 | 29.5% |
| Total Housing Units | 5,978 | 100.0% |
Occupancy by Ownership by Household Size in Wahiawa
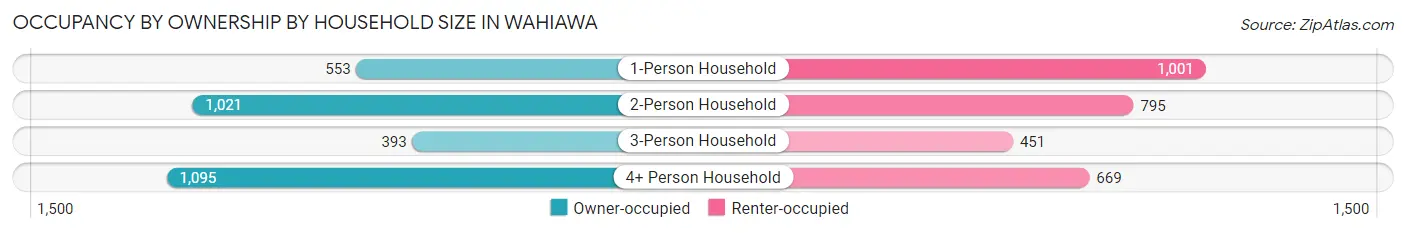
| Household Size | Owner-occupied | Renter-occupied |
| 1-Person Household | 553 (35.6%) | 1,001 (64.4%) |
| 2-Person Household | 1,021 (56.2%) | 795 (43.8%) |
| 3-Person Household | 393 (46.6%) | 451 (53.4%) |
| 4+ Person Household | 1,095 (62.1%) | 669 (37.9%) |
| Total Housing Units | 3,062 (51.2%) | 2,916 (48.8%) |
Occupancy by Educational Attainment in Wahiawa
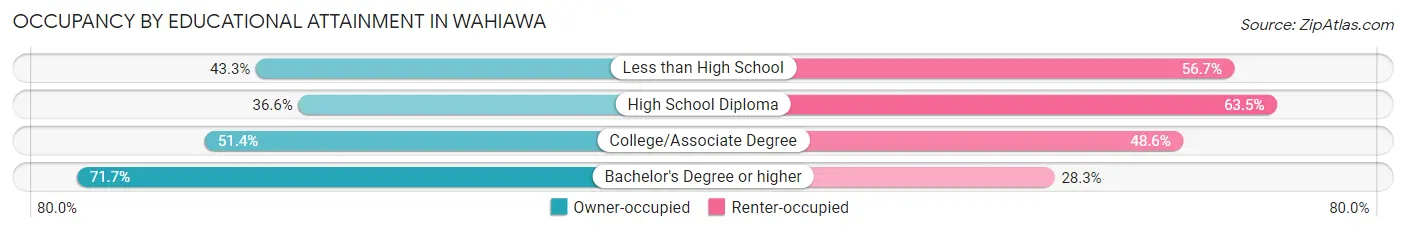
| Household Size | Owner-occupied | Renter-occupied |
| Less than High School | 148 (43.3%) | 194 (56.7%) |
| High School Diploma | 681 (36.5%) | 1,182 (63.4%) |
| College/Associate Degree | 1,196 (51.4%) | 1,131 (48.6%) |
| Bachelor's Degree or higher | 1,037 (71.7%) | 409 (28.3%) |
Occupancy by Age of Householder in Wahiawa
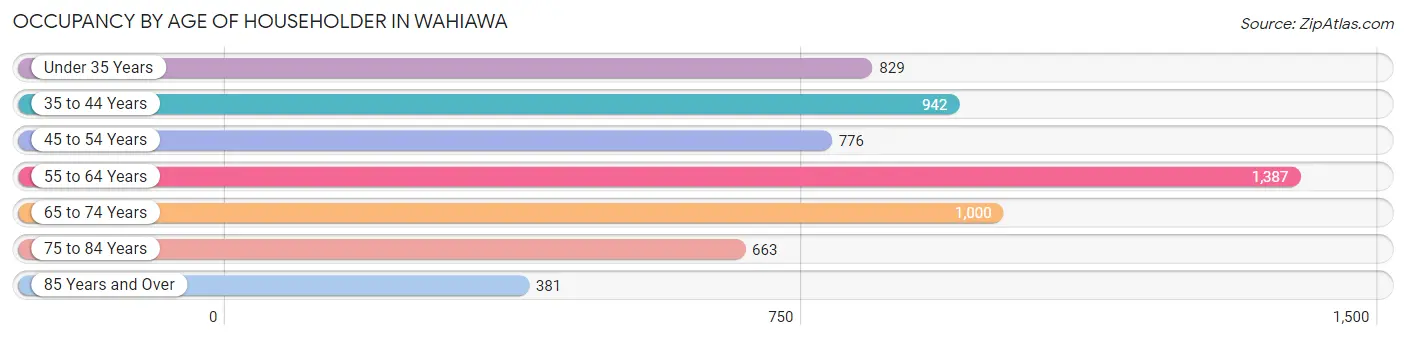
| Age Bracket | # Households | % Households |
| Under 35 Years | 829 | 13.9% |
| 35 to 44 Years | 942 | 15.8% |
| 45 to 54 Years | 776 | 13.0% |
| 55 to 64 Years | 1,387 | 23.2% |
| 65 to 74 Years | 1,000 | 16.7% |
| 75 to 84 Years | 663 | 11.1% |
| 85 Years and Over | 381 | 6.4% |
| Total | 5,978 | 100.0% |
Housing Finances in Wahiawa
Median Income by Occupancy in Wahiawa
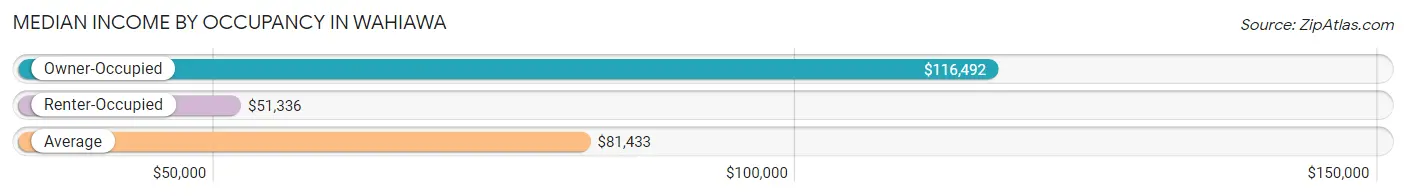
| Occupancy Type | # Households | Median Income |
| Owner-Occupied | 3,062 (51.2%) | $116,492 |
| Renter-Occupied | 2,916 (48.8%) | $51,336 |
| Average | 5,978 (100.0%) | $81,433 |
Occupancy by Householder Income Bracket in Wahiawa
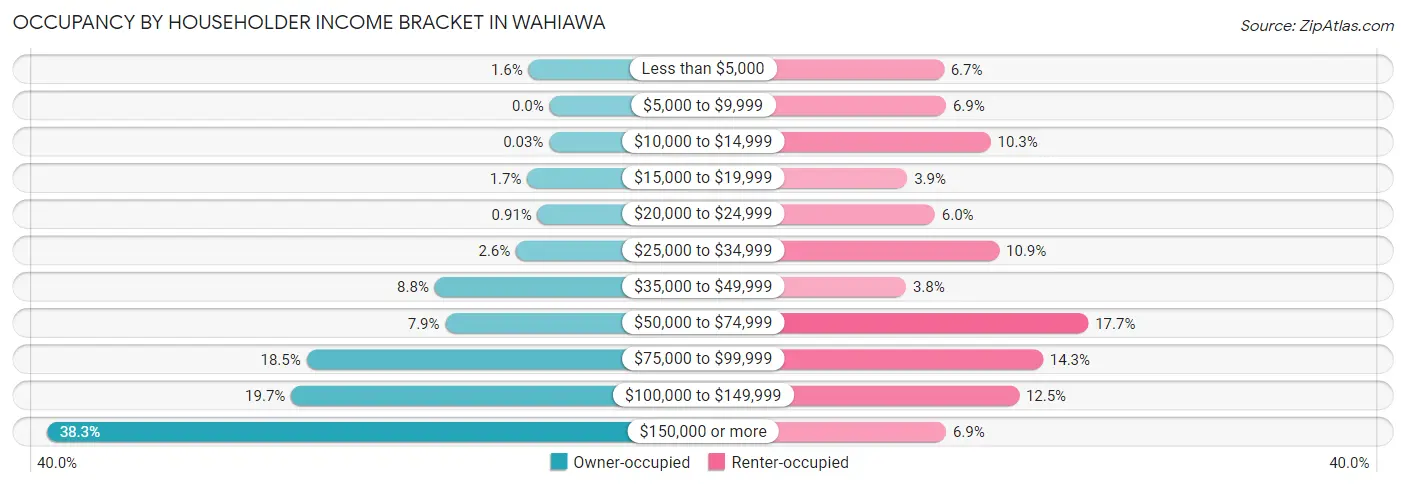
| Income Bracket | Owner-occupied | Renter-occupied |
| Less than $5,000 | 49 (1.6%) | 196 (6.7%) |
| $5,000 to $9,999 | 0 (0.0%) | 201 (6.9%) |
| $10,000 to $14,999 | 1 (0.0%) | 300 (10.3%) |
| $15,000 to $19,999 | 52 (1.7%) | 115 (3.9%) |
| $20,000 to $24,999 | 28 (0.9%) | 176 (6.0%) |
| $25,000 to $34,999 | 78 (2.5%) | 319 (10.9%) |
| $35,000 to $49,999 | 268 (8.7%) | 112 (3.8%) |
| $50,000 to $74,999 | 243 (7.9%) | 517 (17.7%) |
| $75,000 to $99,999 | 567 (18.5%) | 416 (14.3%) |
| $100,000 to $149,999 | 603 (19.7%) | 363 (12.4%) |
| $150,000 or more | 1,173 (38.3%) | 201 (6.9%) |
| Total | 3,062 (100.0%) | 2,916 (100.0%) |
Monthly Housing Cost Tiers in Wahiawa
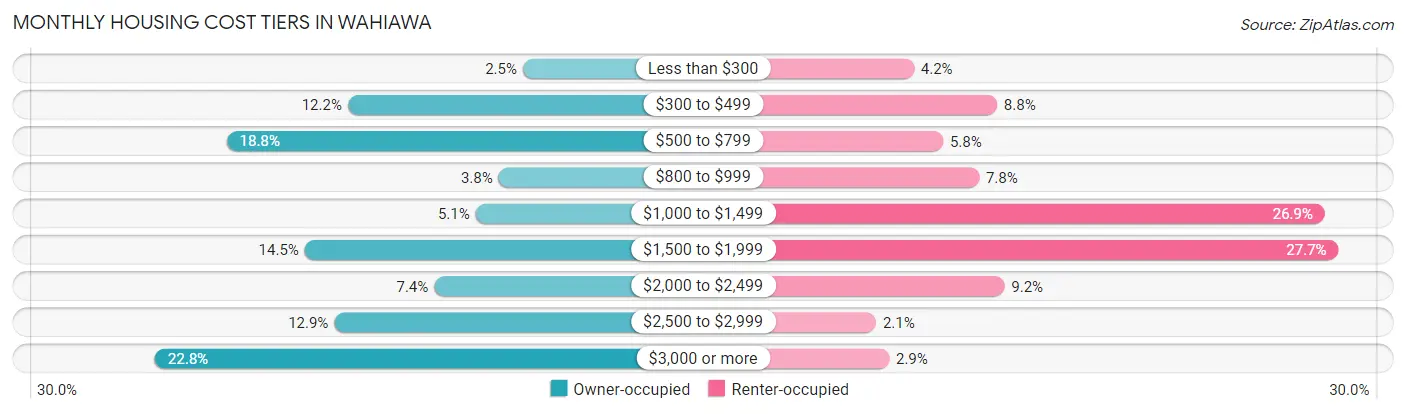
| Monthly Cost | Owner-occupied | Renter-occupied |
| Less than $300 | 76 (2.5%) | 123 (4.2%) |
| $300 to $499 | 372 (12.1%) | 257 (8.8%) |
| $500 to $799 | 577 (18.8%) | 170 (5.8%) |
| $800 to $999 | 117 (3.8%) | 228 (7.8%) |
| $1,000 to $1,499 | 156 (5.1%) | 785 (26.9%) |
| $1,500 to $1,999 | 445 (14.5%) | 807 (27.7%) |
| $2,000 to $2,499 | 226 (7.4%) | 269 (9.2%) |
| $2,500 to $2,999 | 395 (12.9%) | 62 (2.1%) |
| $3,000 or more | 698 (22.8%) | 83 (2.9%) |
| Total | 3,062 (100.0%) | 2,916 (100.0%) |
Physical Housing Characteristics in Wahiawa
Housing Structures in Wahiawa
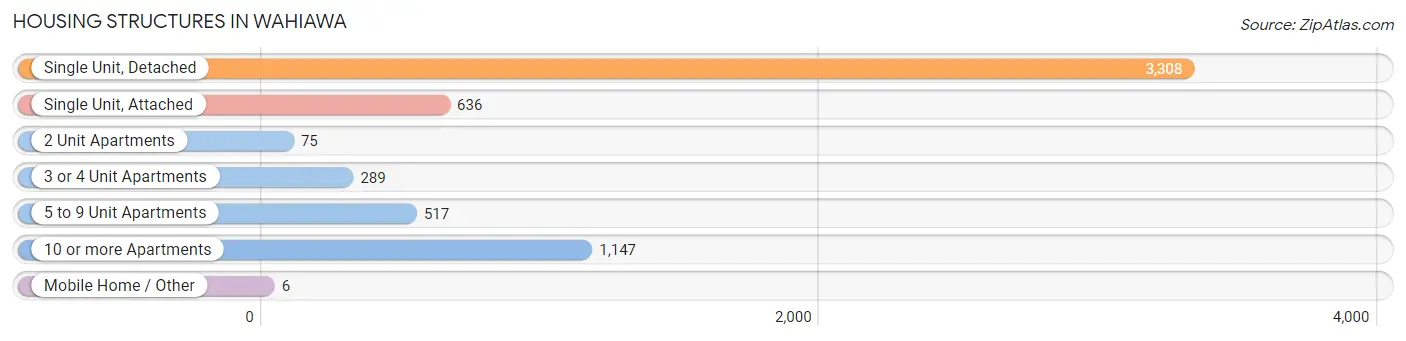
| Structure Type | # Housing Units | % Housing Units |
| Single Unit, Detached | 3,308 | 55.3% |
| Single Unit, Attached | 636 | 10.6% |
| 2 Unit Apartments | 75 | 1.3% |
| 3 or 4 Unit Apartments | 289 | 4.8% |
| 5 to 9 Unit Apartments | 517 | 8.6% |
| 10 or more Apartments | 1,147 | 19.2% |
| Mobile Home / Other | 6 | 0.1% |
| Total | 5,978 | 100.0% |
Housing Structures by Occupancy in Wahiawa
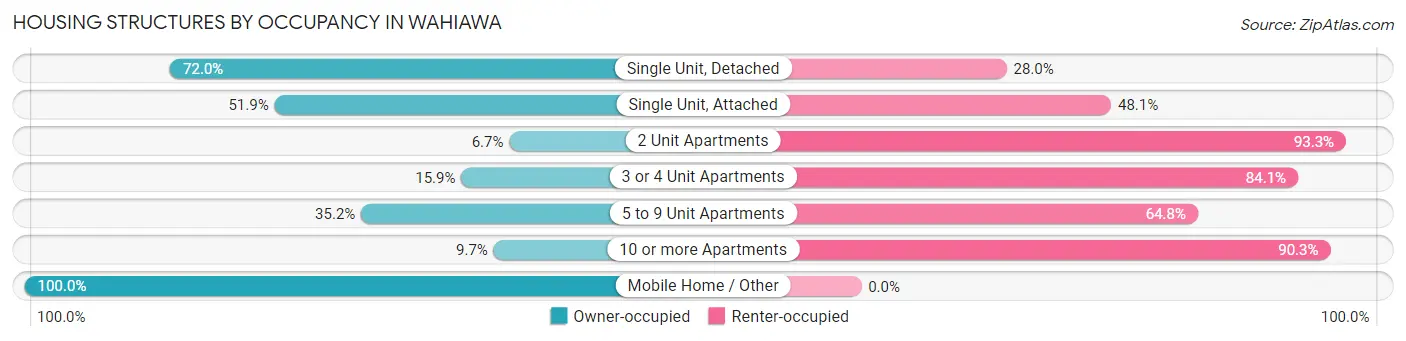
| Structure Type | Owner-occupied | Renter-occupied |
| Single Unit, Detached | 2,382 (72.0%) | 926 (28.0%) |
| Single Unit, Attached | 330 (51.9%) | 306 (48.1%) |
| 2 Unit Apartments | 5 (6.7%) | 70 (93.3%) |
| 3 or 4 Unit Apartments | 46 (15.9%) | 243 (84.1%) |
| 5 to 9 Unit Apartments | 182 (35.2%) | 335 (64.8%) |
| 10 or more Apartments | 111 (9.7%) | 1,036 (90.3%) |
| Mobile Home / Other | 6 (100.0%) | 0 (0.0%) |
| Total | 3,062 (51.2%) | 2,916 (48.8%) |
Housing Structures by Number of Rooms in Wahiawa
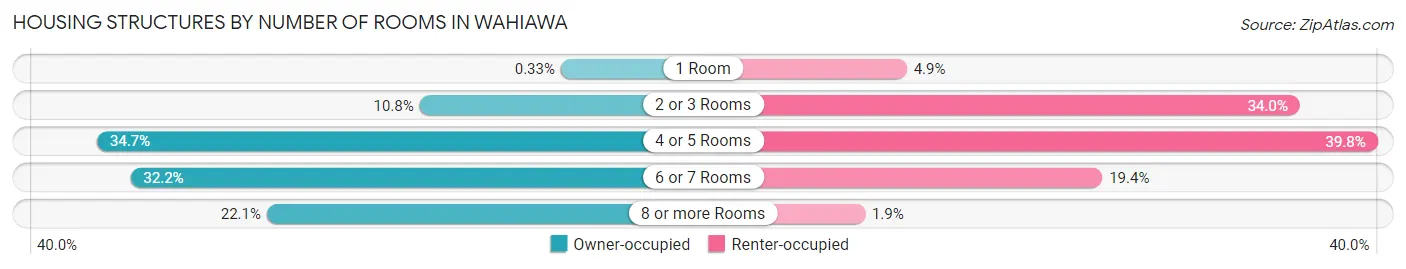
| Number of Rooms | Owner-occupied | Renter-occupied |
| 1 Room | 10 (0.3%) | 144 (4.9%) |
| 2 or 3 Rooms | 330 (10.8%) | 992 (34.0%) |
| 4 or 5 Rooms | 1,061 (34.6%) | 1,160 (39.8%) |
| 6 or 7 Rooms | 985 (32.2%) | 566 (19.4%) |
| 8 or more Rooms | 676 (22.1%) | 54 (1.8%) |
| Total | 3,062 (100.0%) | 2,916 (100.0%) |
Housing Structure by Heating Type in Wahiawa
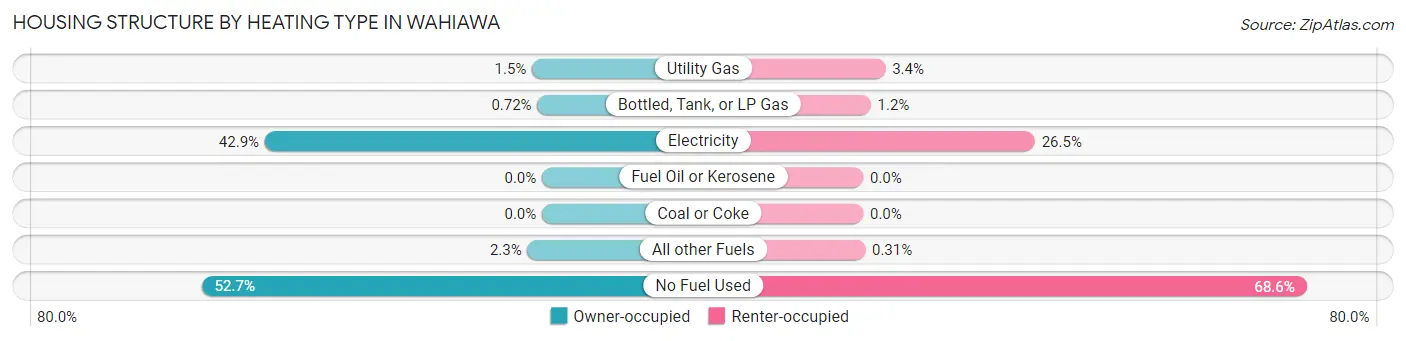
| Heating Type | Owner-occupied | Renter-occupied |
| Utility Gas | 47 (1.5%) | 100 (3.4%) |
| Bottled, Tank, or LP Gas | 22 (0.7%) | 34 (1.2%) |
| Electricity | 1,312 (42.8%) | 774 (26.5%) |
| Fuel Oil or Kerosene | 0 (0.0%) | 0 (0.0%) |
| Coal or Coke | 0 (0.0%) | 0 (0.0%) |
| All other Fuels | 69 (2.2%) | 9 (0.3%) |
| No Fuel Used | 1,612 (52.6%) | 1,999 (68.5%) |
| Total | 3,062 (100.0%) | 2,916 (100.0%) |
Household Vehicle Usage in Wahiawa
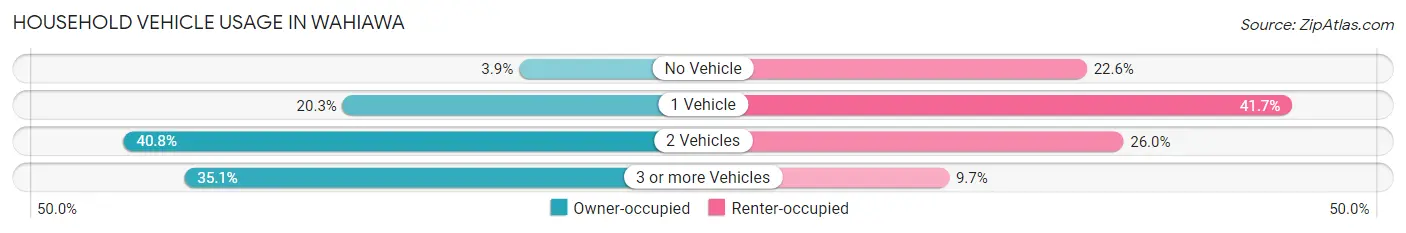
| Vehicles per Household | Owner-occupied | Renter-occupied |
| No Vehicle | 118 (3.8%) | 658 (22.6%) |
| 1 Vehicle | 622 (20.3%) | 1,217 (41.7%) |
| 2 Vehicles | 1,248 (40.8%) | 758 (26.0%) |
| 3 or more Vehicles | 1,074 (35.1%) | 283 (9.7%) |
| Total | 3,062 (100.0%) | 2,916 (100.0%) |
Real Estate & Mortgages in Wahiawa
Real Estate and Mortgage Overview in Wahiawa
| Characteristic | Without Mortgage | With Mortgage |
| Housing Units | 1,107 | 1,955 |
| Median Property Value | $611,100 | $687,000 |
| Median Household Income | $87,029 | $1,006 |
| Monthly Housing Costs | $581 | $698 |
| Real Estate Taxes | $1,881 | $216 |
Property Value by Mortgage Status in Wahiawa
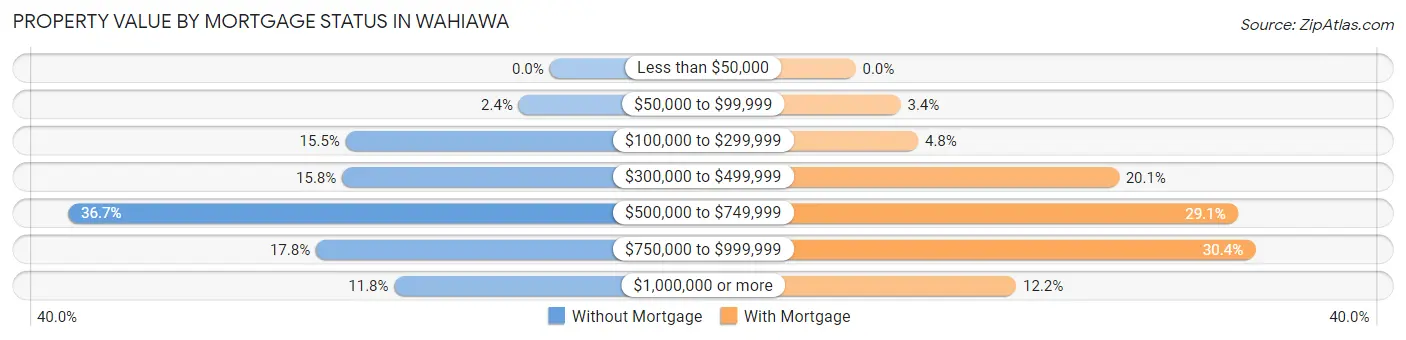
| Property Value | Without Mortgage | With Mortgage |
| Less than $50,000 | 0 (0.0%) | 0 (0.0%) |
| $50,000 to $99,999 | 26 (2.4%) | 67 (3.4%) |
| $100,000 to $299,999 | 172 (15.5%) | 93 (4.8%) |
| $300,000 to $499,999 | 175 (15.8%) | 392 (20.1%) |
| $500,000 to $749,999 | 406 (36.7%) | 569 (29.1%) |
| $750,000 to $999,999 | 197 (17.8%) | 595 (30.4%) |
| $1,000,000 or more | 131 (11.8%) | 239 (12.2%) |
| Total | 1,107 (100.0%) | 1,955 (100.0%) |
Household Income by Mortgage Status in Wahiawa
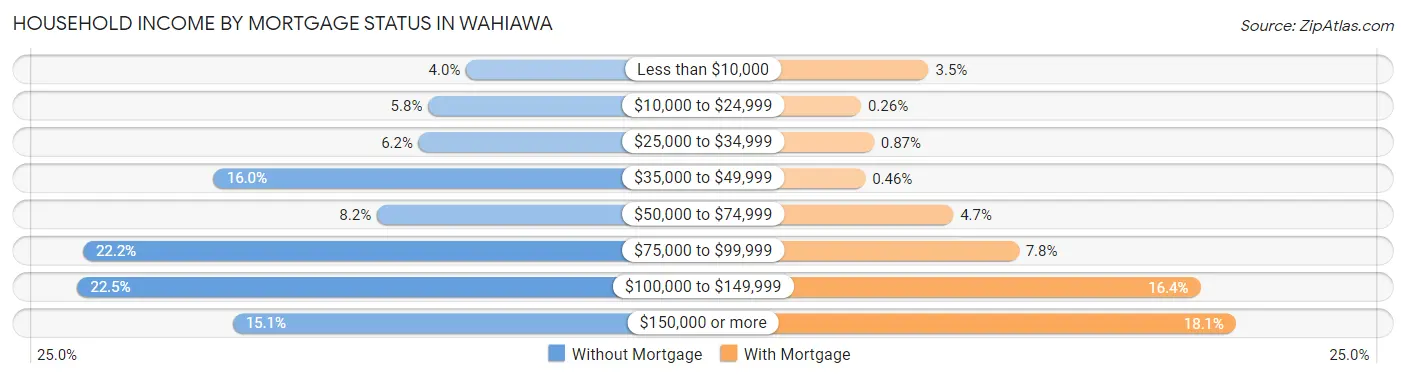
| Household Income | Without Mortgage | With Mortgage |
| Less than $10,000 | 44 (4.0%) | 68 (3.5%) |
| $10,000 to $24,999 | 64 (5.8%) | 5 (0.3%) |
| $25,000 to $34,999 | 69 (6.2%) | 17 (0.9%) |
| $35,000 to $49,999 | 177 (16.0%) | 9 (0.5%) |
| $50,000 to $74,999 | 91 (8.2%) | 91 (4.6%) |
| $75,000 to $99,999 | 246 (22.2%) | 152 (7.8%) |
| $100,000 to $149,999 | 249 (22.5%) | 321 (16.4%) |
| $150,000 or more | 167 (15.1%) | 354 (18.1%) |
| Total | 1,107 (100.0%) | 1,955 (100.0%) |
Property Value to Household Income Ratio in Wahiawa
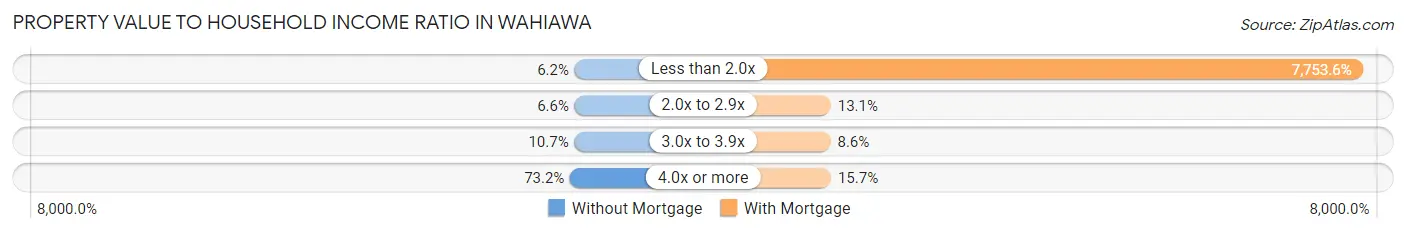
| Value-to-Income Ratio | Without Mortgage | With Mortgage |
| Less than 2.0x | 69 (6.2%) | 151,583 (7,753.6%) |
| 2.0x to 2.9x | 73 (6.6%) | 256 (13.1%) |
| 3.0x to 3.9x | 118 (10.7%) | 169 (8.6%) |
| 4.0x or more | 810 (73.2%) | 306 (15.7%) |
| Total | 1,107 (100.0%) | 1,955 (100.0%) |
Real Estate Taxes by Mortgage Status in Wahiawa
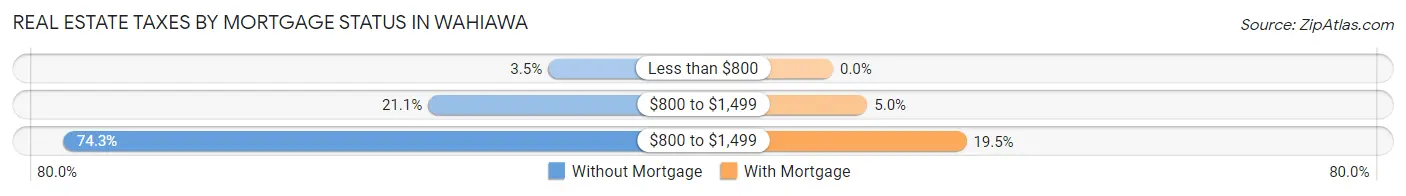
| Property Taxes | Without Mortgage | With Mortgage |
| Less than $800 | 39 (3.5%) | 0 (0.0%) |
| $800 to $1,499 | 233 (21.0%) | 98 (5.0%) |
| $800 to $1,499 | 822 (74.3%) | 381 (19.5%) |
| Total | 1,107 (100.0%) | 1,955 (100.0%) |
Health & Disability in Wahiawa
Health Insurance Coverage by Age in Wahiawa
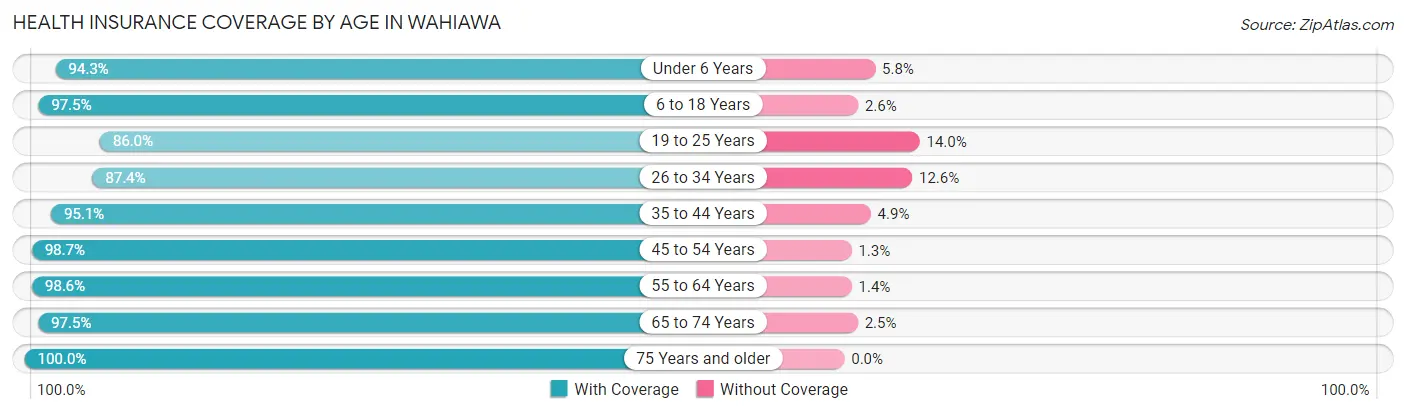
| Age Bracket | With Coverage | Without Coverage |
| Under 6 Years | 1,016 (94.3%) | 62 (5.8%) |
| 6 to 18 Years | 2,714 (97.5%) | 71 (2.5%) |
| 19 to 25 Years | 1,072 (86.0%) | 175 (14.0%) |
| 26 to 34 Years | 1,590 (87.4%) | 230 (12.6%) |
| 35 to 44 Years | 1,953 (95.1%) | 101 (4.9%) |
| 45 to 54 Years | 1,996 (98.7%) | 27 (1.3%) |
| 55 to 64 Years | 2,692 (98.6%) | 37 (1.4%) |
| 65 to 74 Years | 1,561 (97.5%) | 40 (2.5%) |
| 75 Years and older | 1,733 (100.0%) | 0 (0.0%) |
| Total | 16,327 (95.7%) | 743 (4.3%) |
Health Insurance Coverage by Citizenship Status in Wahiawa
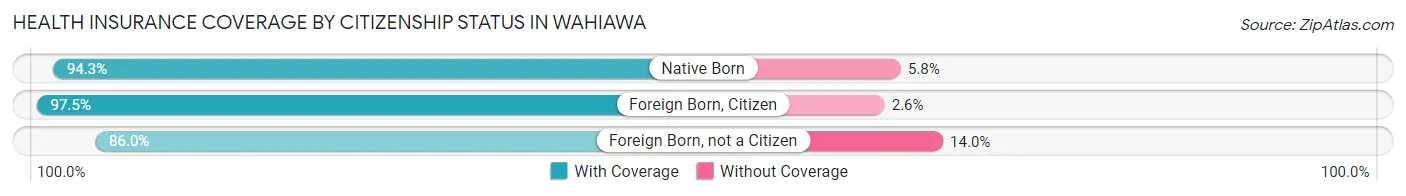
| Citizenship Status | With Coverage | Without Coverage |
| Native Born | 1,016 (94.3%) | 62 (5.8%) |
| Foreign Born, Citizen | 2,714 (97.5%) | 71 (2.5%) |
| Foreign Born, not a Citizen | 1,072 (86.0%) | 175 (14.0%) |
Health Insurance Coverage by Household Income in Wahiawa
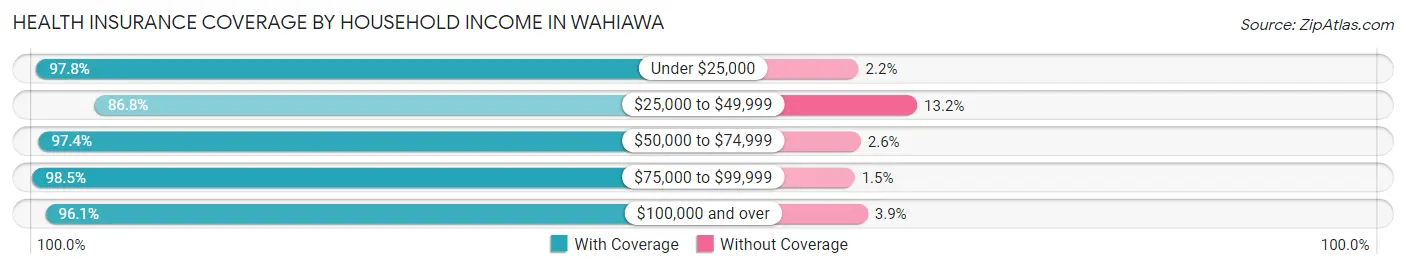
| Household Income | With Coverage | Without Coverage |
| Under $25,000 | 1,985 (97.8%) | 45 (2.2%) |
| $25,000 to $49,999 | 1,745 (86.8%) | 265 (13.2%) |
| $50,000 to $74,999 | 1,590 (97.4%) | 43 (2.6%) |
| $75,000 to $99,999 | 2,330 (98.5%) | 35 (1.5%) |
| $100,000 and over | 8,629 (96.1%) | 354 (3.9%) |
Public vs Private Health Insurance Coverage by Age in Wahiawa
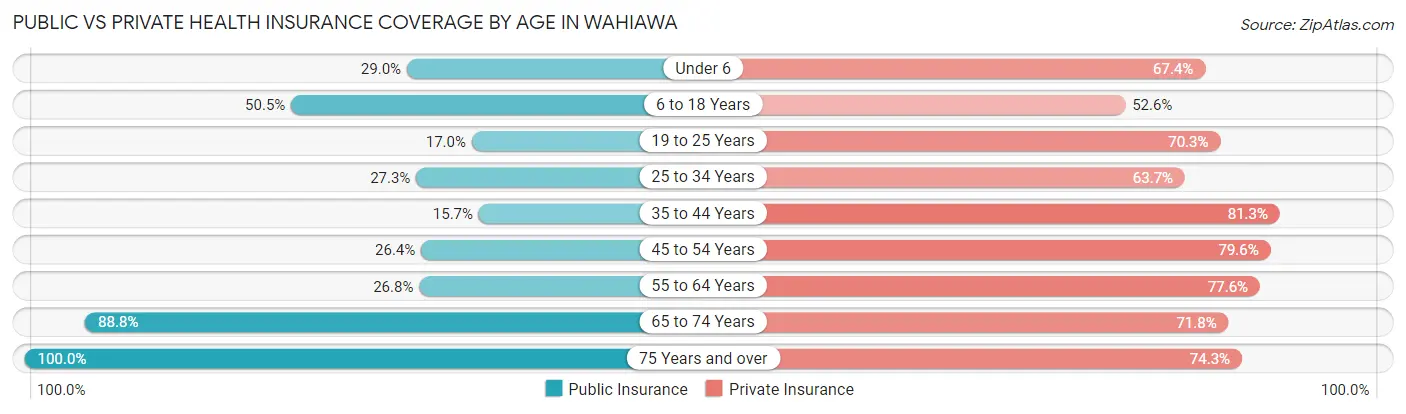
| Age Bracket | Public Insurance | Private Insurance |
| Under 6 | 313 (29.0%) | 727 (67.4%) |
| 6 to 18 Years | 1,407 (50.5%) | 1,465 (52.6%) |
| 19 to 25 Years | 212 (17.0%) | 876 (70.3%) |
| 25 to 34 Years | 497 (27.3%) | 1,159 (63.7%) |
| 35 to 44 Years | 322 (15.7%) | 1,670 (81.3%) |
| 45 to 54 Years | 534 (26.4%) | 1,610 (79.6%) |
| 55 to 64 Years | 730 (26.8%) | 2,118 (77.6%) |
| 65 to 74 Years | 1,421 (88.8%) | 1,149 (71.8%) |
| 75 Years and over | 1,733 (100.0%) | 1,287 (74.3%) |
| Total | 7,169 (42.0%) | 12,061 (70.7%) |
Disability Status by Sex by Age in Wahiawa
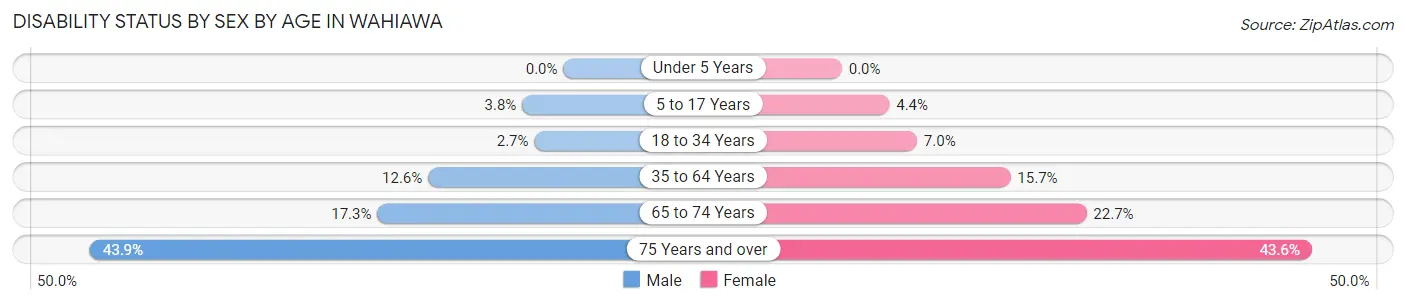
| Age Bracket | Male | Female |
| Under 5 Years | 0 (0.0%) | 0 (0.0%) |
| 5 to 17 Years | 52 (3.8%) | 58 (4.4%) |
| 18 to 34 Years | 42 (2.7%) | 123 (7.0%) |
| 35 to 64 Years | 442 (12.6%) | 514 (15.7%) |
| 65 to 74 Years | 119 (17.3%) | 207 (22.7%) |
| 75 Years and over | 301 (43.9%) | 457 (43.6%) |
Disability Class by Sex by Age in Wahiawa
Disability Class: Hearing Difficulty
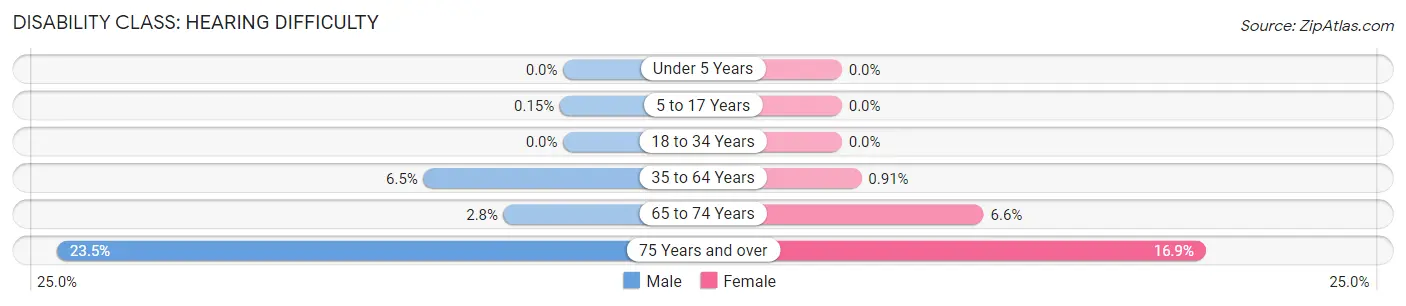
| Age Bracket | Male | Female |
| Under 5 Years | 0 (0.0%) | 0 (0.0%) |
| 5 to 17 Years | 2 (0.2%) | 0 (0.0%) |
| 18 to 34 Years | 0 (0.0%) | 0 (0.0%) |
| 35 to 64 Years | 228 (6.5%) | 30 (0.9%) |
| 65 to 74 Years | 19 (2.8%) | 60 (6.6%) |
| 75 Years and over | 161 (23.5%) | 177 (16.9%) |
Disability Class: Vision Difficulty
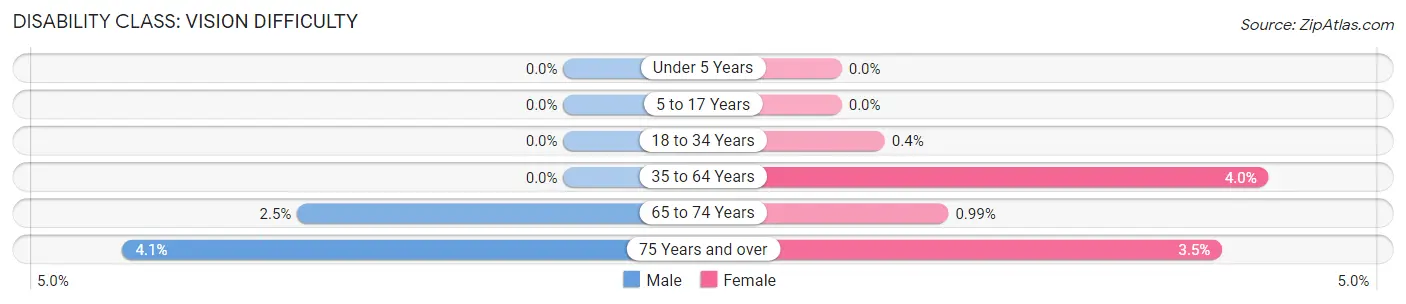
| Age Bracket | Male | Female |
| Under 5 Years | 0 (0.0%) | 0 (0.0%) |
| 5 to 17 Years | 0 (0.0%) | 0 (0.0%) |
| 18 to 34 Years | 0 (0.0%) | 7 (0.4%) |
| 35 to 64 Years | 0 (0.0%) | 130 (4.0%) |
| 65 to 74 Years | 17 (2.5%) | 9 (1.0%) |
| 75 Years and over | 28 (4.1%) | 37 (3.5%) |
Disability Class: Cognitive Difficulty
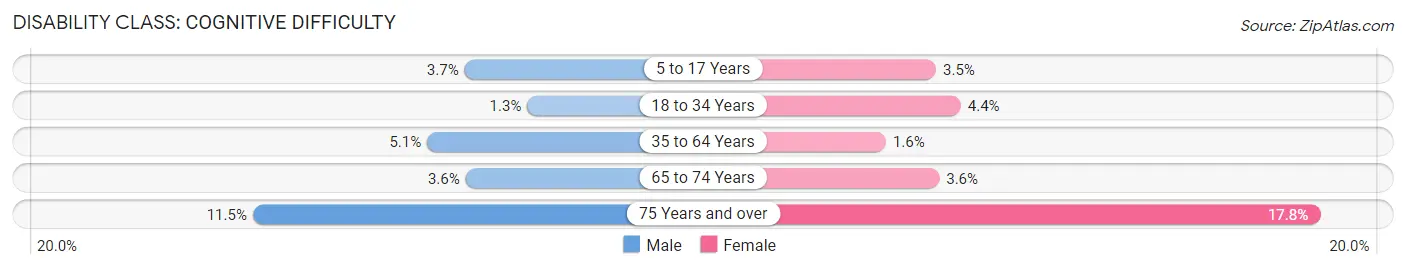
| Age Bracket | Male | Female |
| 5 to 17 Years | 50 (3.7%) | 46 (3.5%) |
| 18 to 34 Years | 21 (1.3%) | 78 (4.4%) |
| 35 to 64 Years | 178 (5.1%) | 54 (1.6%) |
| 65 to 74 Years | 25 (3.6%) | 33 (3.6%) |
| 75 Years and over | 79 (11.5%) | 186 (17.7%) |
Disability Class: Ambulatory Difficulty
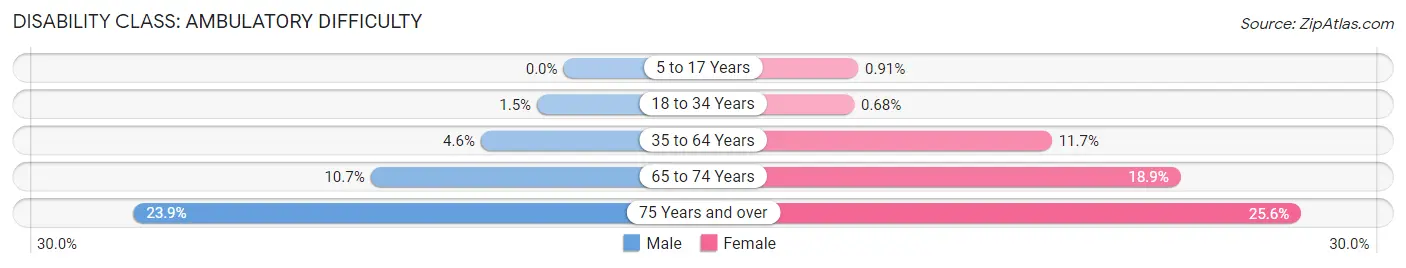
| Age Bracket | Male | Female |
| 5 to 17 Years | 0 (0.0%) | 12 (0.9%) |
| 18 to 34 Years | 23 (1.5%) | 12 (0.7%) |
| 35 to 64 Years | 162 (4.6%) | 384 (11.7%) |
| 65 to 74 Years | 74 (10.7%) | 172 (18.9%) |
| 75 Years and over | 164 (23.9%) | 268 (25.6%) |
Disability Class: Self-Care Difficulty
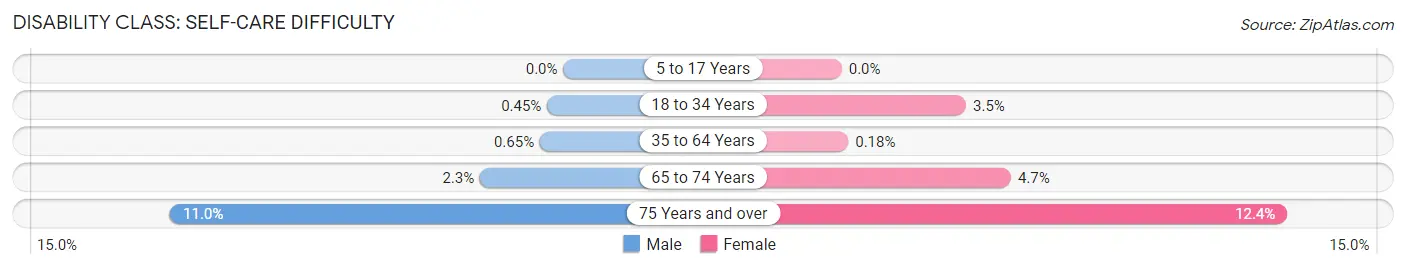
| Age Bracket | Male | Female |
| 5 to 17 Years | 0 (0.0%) | 0 (0.0%) |
| 18 to 34 Years | 7 (0.4%) | 61 (3.5%) |
| 35 to 64 Years | 23 (0.6%) | 6 (0.2%) |
| 65 to 74 Years | 16 (2.3%) | 43 (4.7%) |
| 75 Years and over | 75 (11.0%) | 130 (12.4%) |
Technology Access in Wahiawa
Computing Device Access in Wahiawa
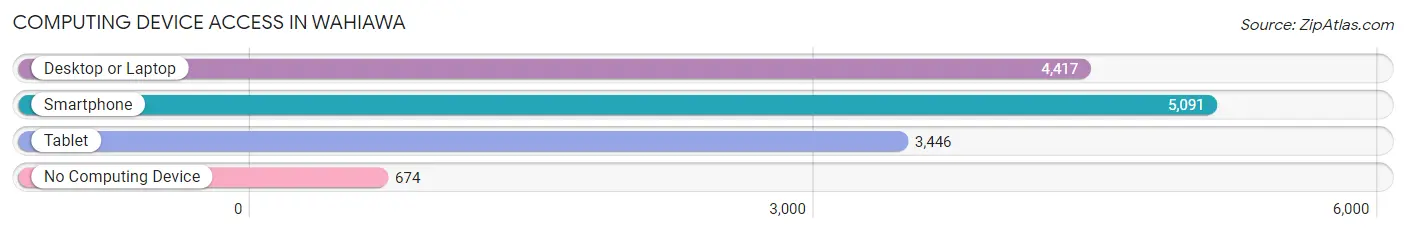
| Device Type | # Households | % Households |
| Desktop or Laptop | 4,417 | 73.9% |
| Smartphone | 5,091 | 85.2% |
| Tablet | 3,446 | 57.6% |
| No Computing Device | 674 | 11.3% |
| Total | 5,978 | 100.0% |
Internet Access in Wahiawa
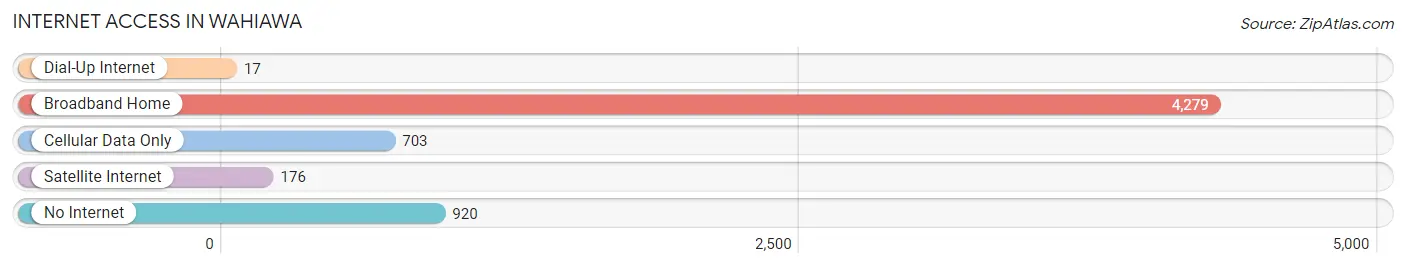
| Internet Type | # Households | % Households |
| Dial-Up Internet | 17 | 0.3% |
| Broadband Home | 4,279 | 71.6% |
| Cellular Data Only | 703 | 11.8% |
| Satellite Internet | 176 | 2.9% |
| No Internet | 920 | 15.4% |
| Total | 5,978 | 100.0% |
Wahiawa Summary
Wahiawa is a small city located in the central part of the island of Oahu in the state of Hawaii. It is located in the Wahiawa District of the City and County of Honolulu. The population of Wahiawa was 16,151 at the 2010 census.
History
The area of Wahiawa was originally inhabited by the native Hawaiian people. The area was known as Kolekole and was a major agricultural center for the Hawaiian people. The area was also known for its abundance of freshwater springs and streams.
In the late 1800s, the area was developed by the sugar industry. The first sugar plantation in the area was established in 1876 by the Hawaiian Sugar Company. The company built a mill and a railroad to transport the sugar cane to the harbor. The area was also home to a number of other sugar plantations, including the Oahu Sugar Company and the Waialua Sugar Company.
In the early 1900s, the area was developed further by the pineapple industry. The first pineapple plantation in the area was established in 1906 by the Hawaiian Pineapple Company. The company built a cannery and a railroad to transport the pineapple to the harbor. The area was also home to a number of other pineapple plantations, including the Dole Pineapple Company and the Wahiawa Pineapple Company.
In the 1920s, the area was developed further by the military. The U.S. Army established a base in the area in 1922 and the U.S. Navy established a base in the area in 1927. The military bases were used for training and operations during World War II.
Geography
Wahiawa is located in the central part of the island of Oahu in the state of Hawaii. It is located in the Wahiawa District of the City and County of Honolulu. The city is located at an elevation of about 500 feet above sea level.
The city is located in a valley between the Waianae Mountains to the west and the Koolau Mountains to the east. The city is located about 20 miles northwest of Honolulu and about 10 miles south of the North Shore.
The city is located in a tropical climate with temperatures ranging from the mid-70s to the mid-80s. The city receives an average of about 20 inches of rain per year.
Economy
The economy of Wahiawa is largely based on the military and agriculture. The city is home to two military bases, Schofield Barracks and Wheeler Army Airfield. The military bases provide jobs for many of the city’s residents.
The city is also home to a number of agricultural businesses, including pineapple and sugar plantations. The city is also home to a number of small businesses, including restaurants, retail stores, and service businesses.
Demographics
As of the 2010 census, the population of Wahiawa was 16,151. The racial makeup of the city was 44.3% White, 0.7% African American, 0.3% Native American, 24.2% Asian, 0.2% Pacific Islander, 0.1% from other races, and 30.4% from two or more races. Hispanic or Latino of any race were 8.2% of the population.
The median household income in the city was $50,945 and the median family income was $58,945. The per capita income in the city was $22,945. About 11.2% of the population was below the poverty line.
Common Questions
What is the Total Population of Wahiawa?
Total Population of Wahiawa is 17,400.
What is the Total Male Population of Wahiawa?
Total Male Population of Wahiawa is 8,592.
What is the Total Female Population of Wahiawa?
Total Female Population of Wahiawa is 8,808.
What is the Ratio of Males per 100 Females in Wahiawa?
There are 97.55 Males per 100 Females in Wahiawa.
What is the Ratio of Females per 100 Males in Wahiawa?
There are 102.51 Females per 100 Males in Wahiawa.
What is the Median Population Age in Wahiawa?
Median Population Age in Wahiawa is 41.8 Years.
What is the Average Family Size in Wahiawa
Average Family Size in Wahiawa is 3.5 People.
What is the Average Household Size in Wahiawa
Average Household Size in Wahiawa is 2.9 People.
What is Per Capita Income in Wahiawa?
Per Capita income in Wahiawa is $36,808.
What is the Median Family Income in Wahiawa?
Median Family Income in Wahiawa is $93,821.
What is the Median Household income in Wahiawa?
Median Household Income in Wahiawa is $81,433.
What is Income or Wage Gap in Wahiawa?
Income or Wage Gap in Wahiawa is 17.5%.
Women in Wahiawa earn 82.5 cents for every dollar earned by a man.
What is Family Income Deficit in Wahiawa?
Family Income Deficit in Wahiawa is $13,438.
Families that are below poverty line in Wahiawa earn $13,438 less on average than the poverty threshold level.
What is Inequality or Gini Index in Wahiawa?
Inequality or Gini Index in Wahiawa is 0.47.
How Large is the Labor Force in Wahiawa?
There are 8,575 People in the Labor Forcein in Wahiawa.
What is the Percentage of People in the Labor Force in Wahiawa?
60.0% of People are in the Labor Force in Wahiawa.
What is the Unemployment Rate in Wahiawa?
Unemployment Rate in Wahiawa is 3.6%.