Pahala, HI
Pahala Map
Pahala Overview
1,897
TOTAL POPULATION
866
MALE POPULATION
1,031
FEMALE POPULATION
84.00
MALES / 100 FEMALES
119.05
FEMALES / 100 MALES
26.2
MEDIAN AGE
5.0
AVG FAMILY SIZE
3.9
AVG HOUSEHOLD SIZE
$19,483
PER CAPITA INCOME
$78,393
AVG FAMILY INCOME
$59,432
AVG HOUSEHOLD INCOME
49.3%
WAGE / INCOME GAP [ % ]
50.7¢/ $1
WAGE / INCOME GAP [ $ ]
0.40
INEQUALITY / GINI INDEX
752
LABOR FORCE [ PEOPLE ]
57.2%
PERCENT IN LABOR FORCE
19.6%
UNEMPLOYMENT RATE
Pahala Zip Codes
Pahala Area Codes
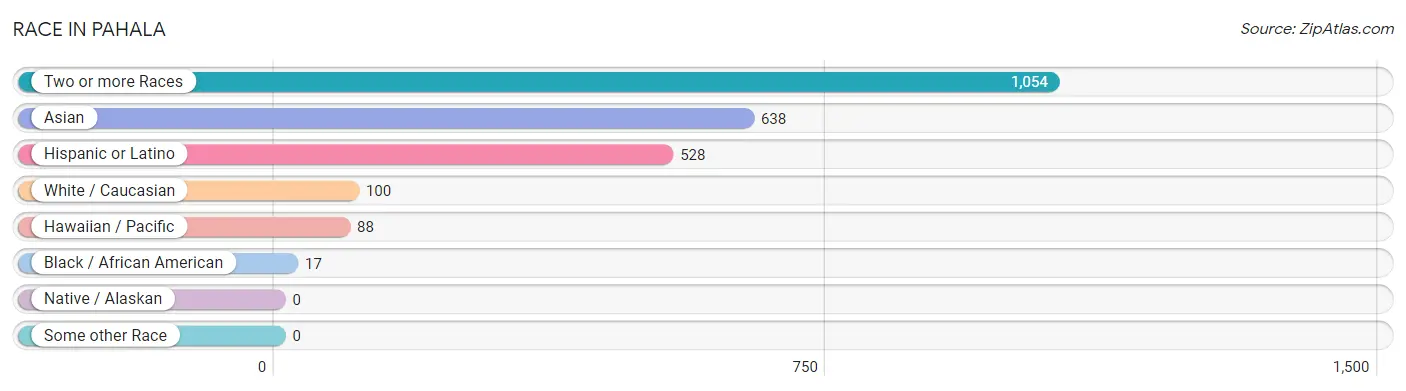
Race in Pahala
The most populous races in Pahala are Two or more Races (1,054 | 55.6%), Asian (638 | 33.6%), and Hispanic or Latino (528 | 27.8%).
| Race | # Population | % Population |
| Asian | 638 | 33.6% |
| Black / African American | 17 | 0.9% |
| Hawaiian / Pacific | 88 | 4.6% |
| Hispanic or Latino | 528 | 27.8% |
| Native / Alaskan | 0 | 0.0% |
| White / Caucasian | 100 | 5.3% |
| Two or more Races | 1,054 | 55.6% |
| Some other Race | 0 | 0.0% |
| Total | 1,897 | 100.0% |
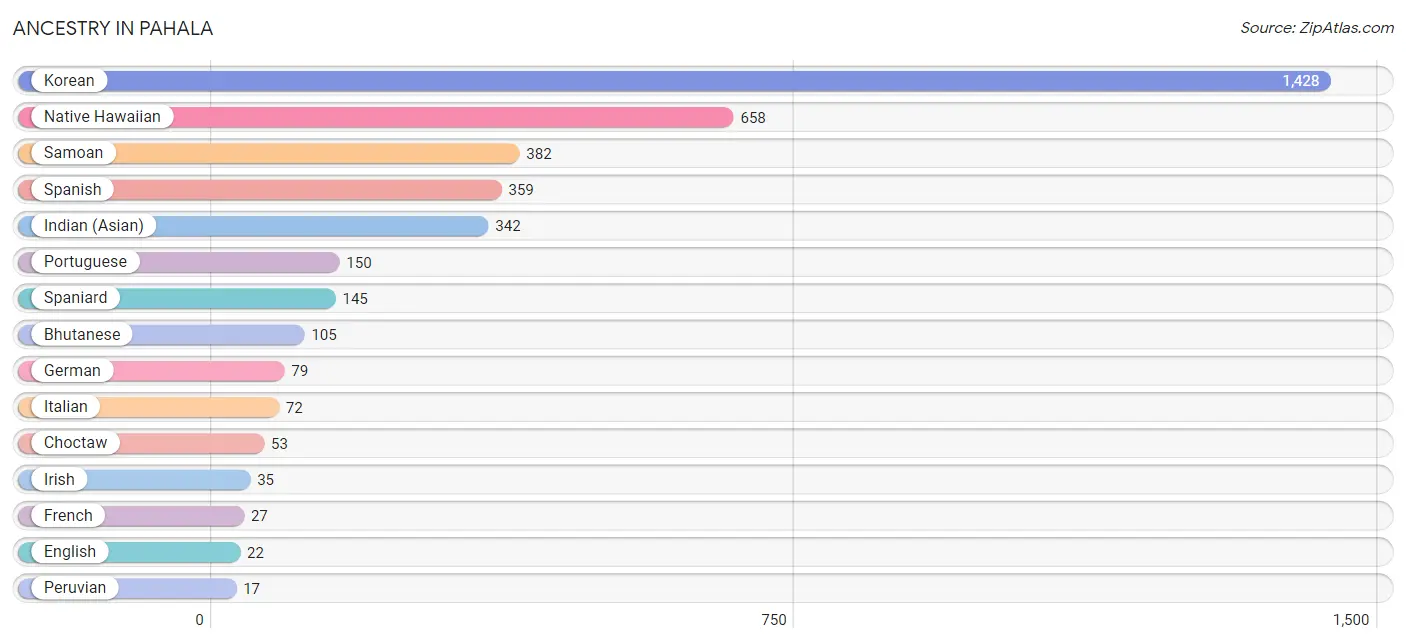
Ancestry in Pahala
The most populous ancestries reported in Pahala are Korean (1,428 | 75.3%), Native Hawaiian (658 | 34.7%), Samoan (382 | 20.1%), Spanish (359 | 18.9%), and Indian (Asian) (342 | 18.0%), together accounting for 167.1% of all Pahala residents.
| Ancestry | # Population | % Population |
| Bhutanese | 105 | 5.5% |
| Choctaw | 53 | 2.8% |
| English | 22 | 1.2% |
| European | 1 | 0.1% |
| French | 27 | 1.4% |
| German | 79 | 4.2% |
| Indian (Asian) | 342 | 18.0% |
| Irish | 35 | 1.8% |
| Italian | 72 | 3.8% |
| Korean | 1,428 | 75.3% |
| Native Hawaiian | 658 | 34.7% |
| Peruvian | 17 | 0.9% |
| Portuguese | 150 | 7.9% |
| Puerto Rican | 7 | 0.4% |
| Samoan | 382 | 20.1% |
| South American | 17 | 0.9% |
| Spaniard | 145 | 7.6% |
| Spanish | 359 | 18.9% |
| Swiss | 13 | 0.7% | View All 19 Rows |
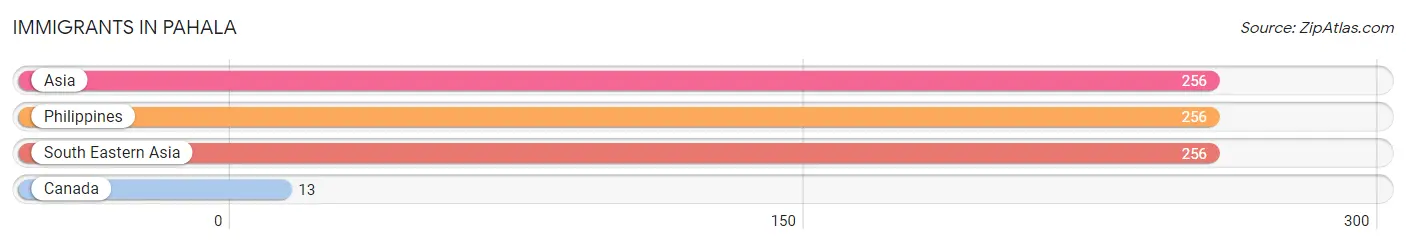
Immigrants in Pahala
The most numerous immigrant groups reported in Pahala came from Asia (256 | 13.5%), Philippines (256 | 13.5%), South Eastern Asia (256 | 13.5%), and Canada (13 | 0.7%), together accounting for 41.2% of all Pahala residents.
| Immigration Origin | # Population | % Population |
| Asia | 256 | 13.5% |
| Canada | 13 | 0.7% |
| Philippines | 256 | 13.5% |
| South Eastern Asia | 256 | 13.5% | View All 4 Rows |
Sex and Age in Pahala
Sex and Age in Pahala
The most populous age groups in Pahala are 15 to 19 Years (95 | 11.0%) for men and Under 5 Years (258 | 25.0%) for women.
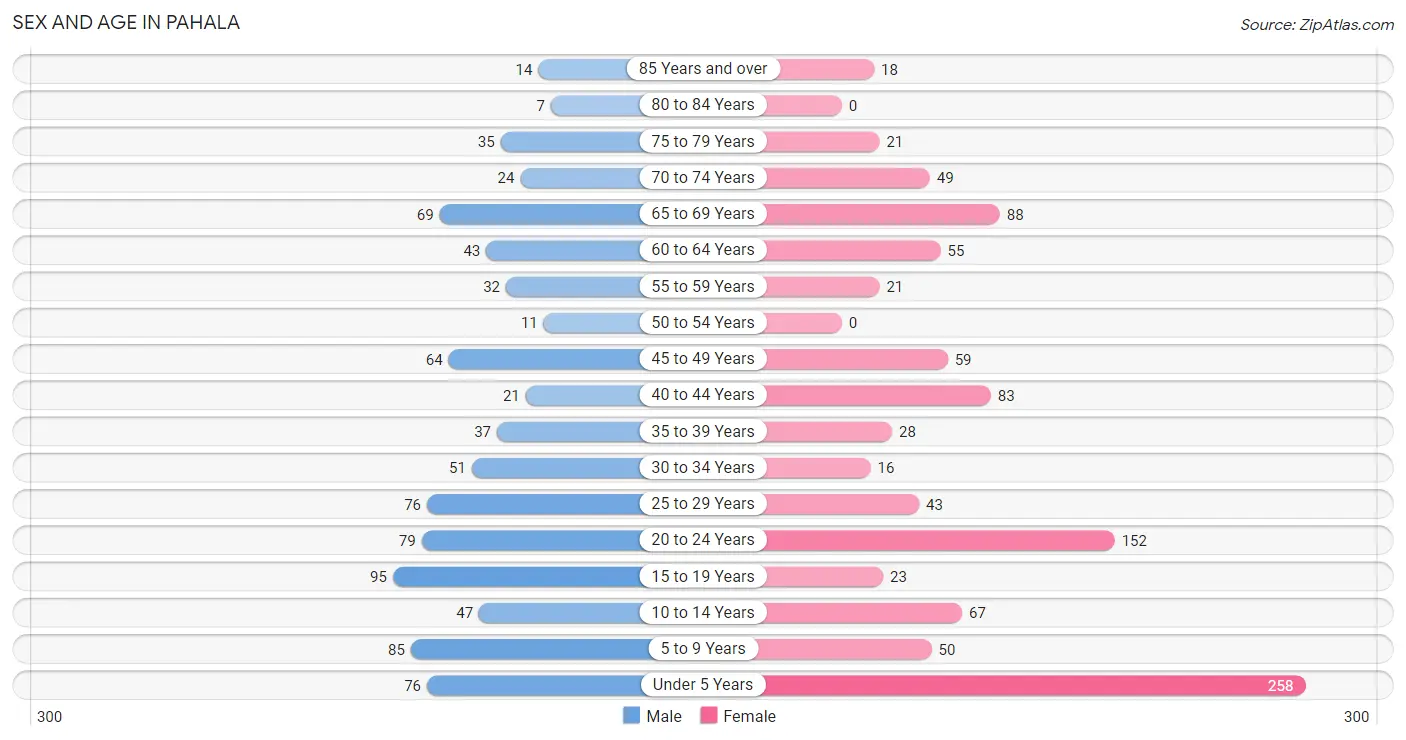
| Age Bracket | Male | Female |
| Under 5 Years | 76 (8.8%) | 258 (25.0%) |
| 5 to 9 Years | 85 (9.8%) | 50 (4.9%) |
| 10 to 14 Years | 47 (5.4%) | 67 (6.5%) |
| 15 to 19 Years | 95 (11.0%) | 23 (2.2%) |
| 20 to 24 Years | 79 (9.1%) | 152 (14.7%) |
| 25 to 29 Years | 76 (8.8%) | 43 (4.2%) |
| 30 to 34 Years | 51 (5.9%) | 16 (1.5%) |
| 35 to 39 Years | 37 (4.3%) | 28 (2.7%) |
| 40 to 44 Years | 21 (2.4%) | 83 (8.1%) |
| 45 to 49 Years | 64 (7.4%) | 59 (5.7%) |
| 50 to 54 Years | 11 (1.3%) | 0 (0.0%) |
| 55 to 59 Years | 32 (3.7%) | 21 (2.0%) |
| 60 to 64 Years | 43 (5.0%) | 55 (5.3%) |
| 65 to 69 Years | 69 (8.0%) | 88 (8.5%) |
| 70 to 74 Years | 24 (2.8%) | 49 (4.8%) |
| 75 to 79 Years | 35 (4.0%) | 21 (2.0%) |
| 80 to 84 Years | 7 (0.8%) | 0 (0.0%) |
| 85 Years and over | 14 (1.6%) | 18 (1.8%) |
| Total | 866 (100.0%) | 1,031 (100.0%) |
Families and Households in Pahala
Median Family Size in Pahala
The median family size in Pahala is 4.95 persons per family, with single male/father families (26 | 7.9%) accounting for the largest median family size of 15.23 persons per family. On the other hand, married-couple families (256 | 77.6%) represent the smallest median family size with 4.00 persons per family.
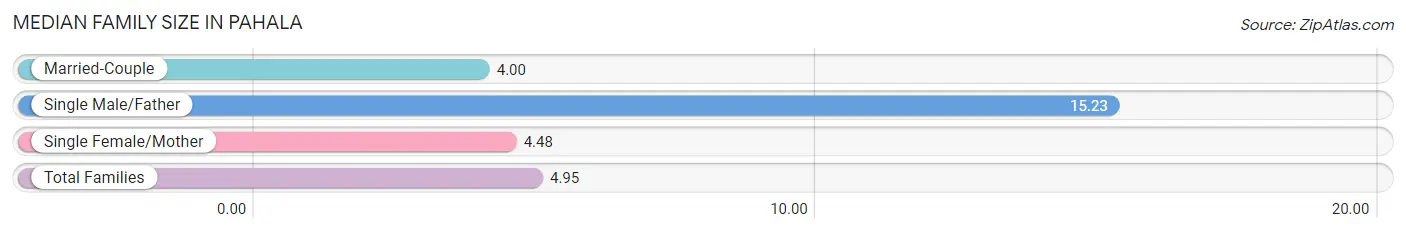
| Family Type | # Families | Family Size |
| Married-Couple | 256 (77.6%) | 4.00 |
| Single Male/Father | 26 (7.9%) | 15.23 |
| Single Female/Mother | 48 (14.5%) | 4.48 |
| Total Families | 330 (100.0%) | 4.95 |
Median Household Size in Pahala
The median household size in Pahala is 3.86 persons per household, with single male/father households (26 | 5.3%) accounting for the largest median household size of 15.85 persons per household. non-family households (157 | 32.2%) represent the smallest median household size with 1.10 persons per household.
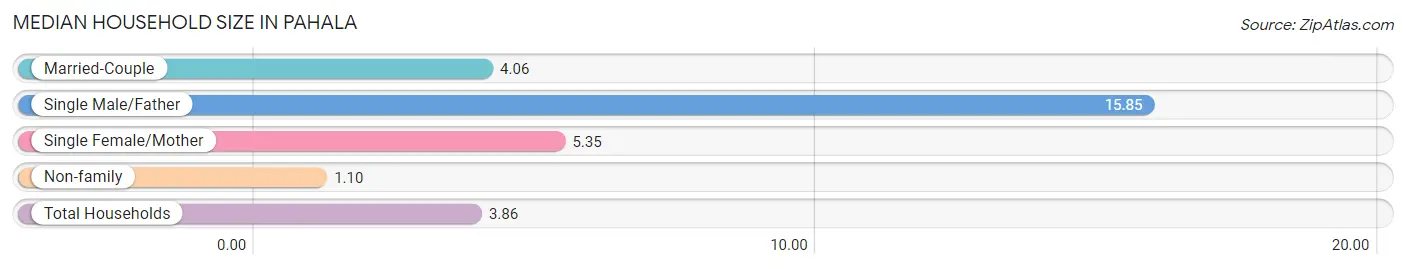
| Household Type | # Households | Household Size |
| Married-Couple | 256 (52.6%) | 4.06 |
| Single Male/Father | 26 (5.3%) | 15.85 |
| Single Female/Mother | 48 (9.9%) | 5.35 |
| Non-family | 157 (32.2%) | 1.10 |
| Total Households | 487 (100.0%) | 3.86 |
Household Size by Marriage Status in Pahala
Out of a total of 487 households in Pahala, 330 (67.8%) are family households, while 157 (32.2%) are nonfamily households. The most numerous type of family households are 2-person households, comprising 103, and the most common type of nonfamily households are 1-person households, comprising 139.
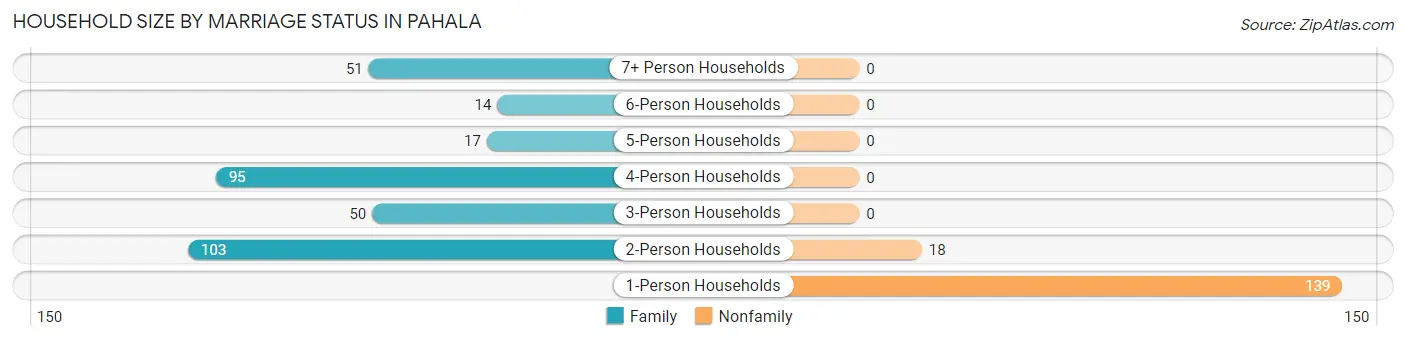
| Household Size | Family Households | Nonfamily Households |
| 1-Person Households | - | 139 (28.5%) |
| 2-Person Households | 103 (21.1%) | 18 (3.7%) |
| 3-Person Households | 50 (10.3%) | 0 (0.0%) |
| 4-Person Households | 95 (19.5%) | 0 (0.0%) |
| 5-Person Households | 17 (3.5%) | 0 (0.0%) |
| 6-Person Households | 14 (2.9%) | 0 (0.0%) |
| 7+ Person Households | 51 (10.5%) | 0 (0.0%) |
| Total | 330 (67.8%) | 157 (32.2%) |
Female Fertility in Pahala
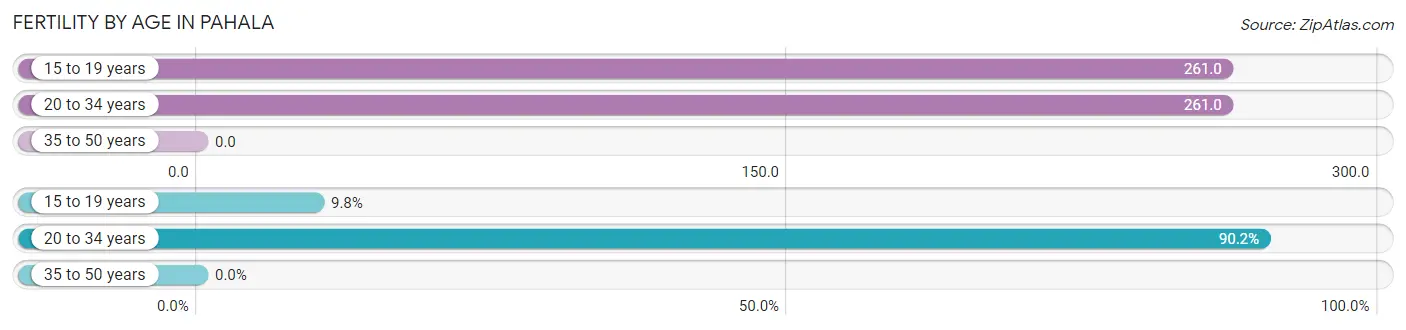
Fertility by Age in Pahala
Average fertility rate in Pahala is 151.0 births per 1,000 women. Women in the age bracket of 15 to 19 years have the highest fertility rate with 261.0 births per 1,000 women. Women in the age bracket of 20 to 34 years acount for 90.2% of all women with births.
| Age Bracket | Women with Births | Births / 1,000 Women |
| 15 to 19 years | 6 (9.8%) | 261.0 |
| 20 to 34 years | 55 (90.2%) | 261.0 |
| 35 to 50 years | 0 (0.0%) | 0.0 |
| Total | 61 (100.0%) | 151.0 |
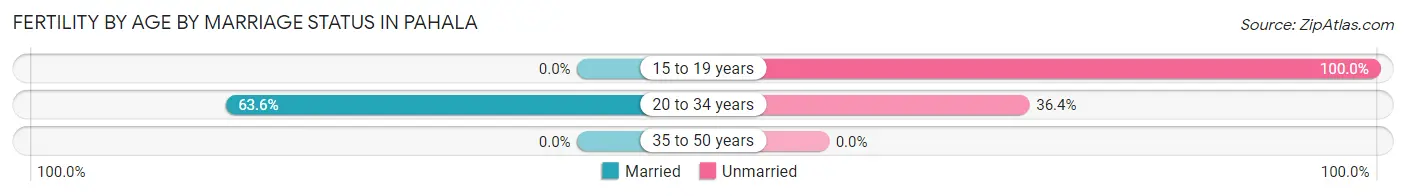
Fertility by Age by Marriage Status in Pahala
57.4% of women with births (61) in Pahala are married. The highest percentage of unmarried women with births falls into 15 to 19 years age bracket with 100.0% of them unmarried at the time of birth, while the lowest percentage of unmarried women with births belong to 20 to 34 years age bracket with 36.4% of them unmarried.
| Age Bracket | Married | Unmarried |
| 15 to 19 years | 0 (0.0%) | 6 (100.0%) |
| 20 to 34 years | 35 (63.6%) | 20 (36.4%) |
| 35 to 50 years | 0 (0.0%) | 0 (0.0%) |
| Total | 35 (57.4%) | 26 (42.6%) |
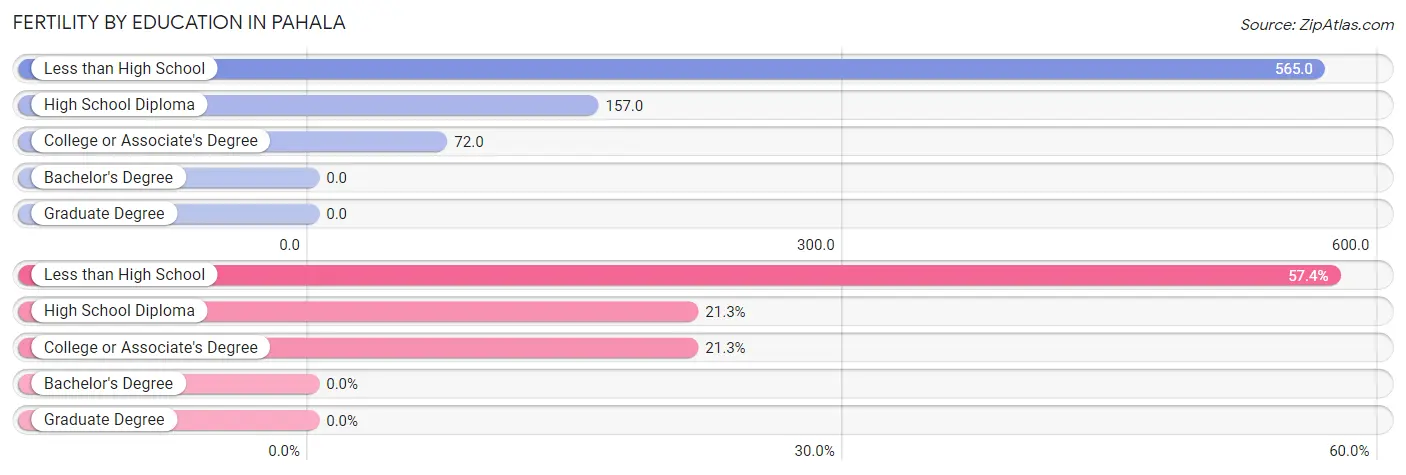
Fertility by Education in Pahala
| Educational Attainment | Women with Births | Births / 1,000 Women |
| Less than High School | 35 (57.4%) | 565.0 |
| High School Diploma | 13 (21.3%) | 157.0 |
| College or Associate's Degree | 13 (21.3%) | 72.0 |
| Bachelor's Degree | 0 (0.0%) | 0.0 |
| Graduate Degree | 0 (0.0%) | 0.0 |
| Total | 61 (100.0%) | 151.0 |
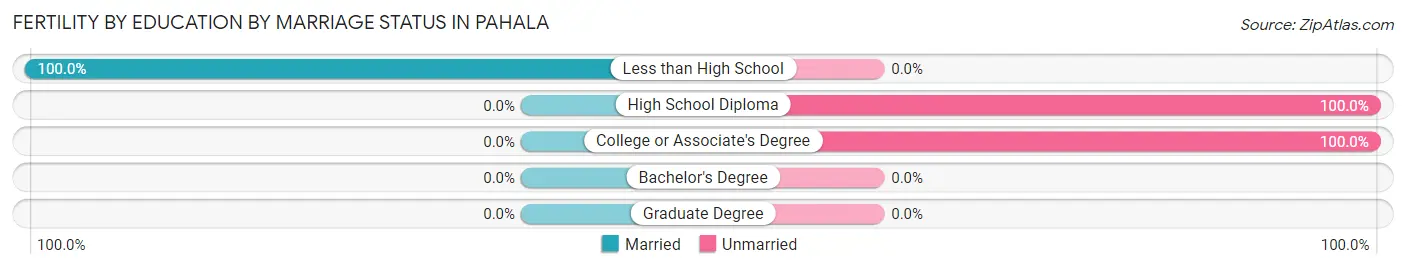
Fertility by Education by Marriage Status in Pahala
42.6% of women with births in Pahala are unmarried. Women with the educational attainment of less than high school are most likely to be married with 100.0% of them married at childbirth, while women with the educational attainment of high school diploma are least likely to be married with 100.0% of them unmarried at childbirth.
| Educational Attainment | Married | Unmarried |
| Less than High School | 35 (100.0%) | 0 (0.0%) |
| High School Diploma | 0 (0.0%) | 13 (100.0%) |
| College or Associate's Degree | 0 (0.0%) | 13 (100.0%) |
| Bachelor's Degree | 0 (0.0%) | 0 (0.0%) |
| Graduate Degree | 0 (0.0%) | 0 (0.0%) |
| Total | 35 (57.4%) | 26 (42.6%) |
Income in Pahala
Income Overview in Pahala
Per Capita Income in Pahala is $19,483, while median incomes of families and households are $78,393 and $59,432 respectively.
| Characteristic | Number | Measure |
| Per Capita Income | 1,897 | $19,483 |
| Median Family Income | 330 | $78,393 |
| Mean Family Income | 330 | $87,464 |
| Median Household Income | 487 | $59,432 |
| Mean Household Income | 487 | $71,607 |
| Income Deficit | 330 | $0 |
| Wage / Income Gap (%) | 1,897 | 49.30% |
| Wage / Income Gap ($) | 1,897 | 50.70¢ per $1 |
| Gini / Inequality Index | 1,897 | 0.40 |
Earnings by Sex in Pahala
Average Earnings in Pahala are $26,676, $38,125 for men and $19,330 for women, a difference of 49.3%.
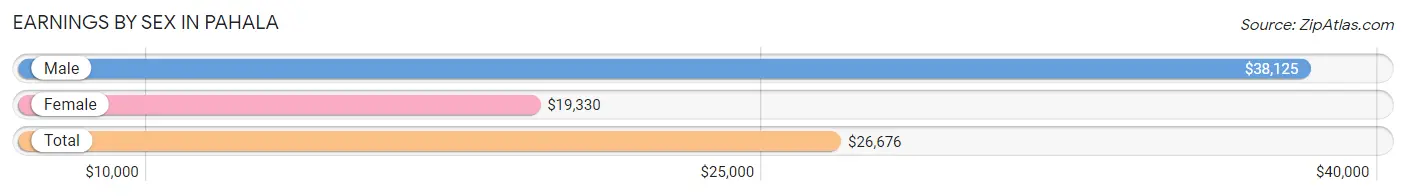
| Sex | Number | Average Earnings |
| Male | 438 (53.0%) | $38,125 |
| Female | 389 (47.0%) | $19,330 |
| Total | 827 (100.0%) | $26,676 |
Earnings by Sex by Income Bracket in Pahala
The most common earnings brackets in Pahala are $55,000 to $64,999 for men (78 | 17.8%) and $17,500 to $19,999 for women (69 | 17.7%).
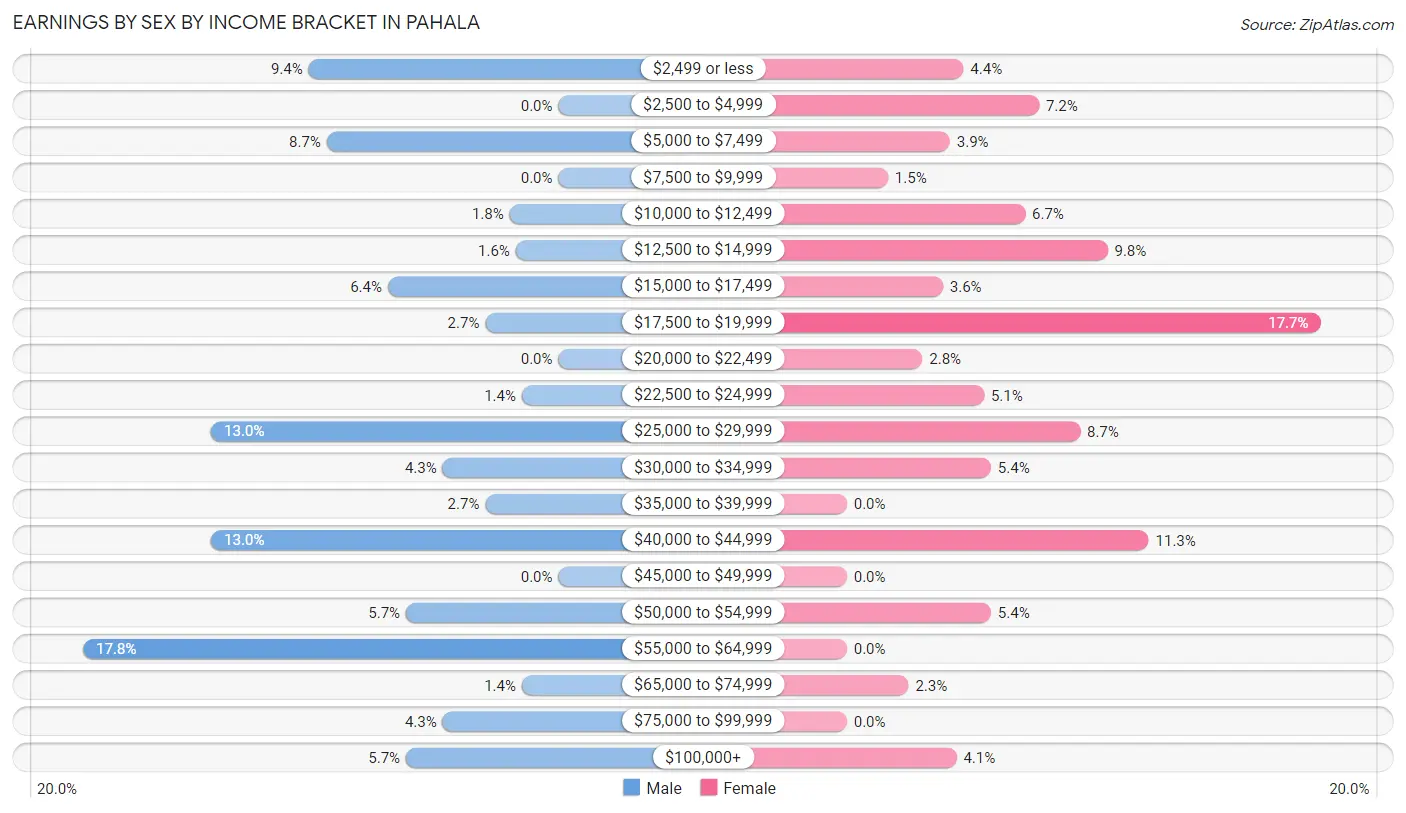
| Income | Male | Female |
| $2,499 or less | 41 (9.4%) | 17 (4.4%) |
| $2,500 to $4,999 | 0 (0.0%) | 28 (7.2%) |
| $5,000 to $7,499 | 38 (8.7%) | 15 (3.9%) |
| $7,500 to $9,999 | 0 (0.0%) | 6 (1.5%) |
| $10,000 to $12,499 | 8 (1.8%) | 26 (6.7%) |
| $12,500 to $14,999 | 7 (1.6%) | 38 (9.8%) |
| $15,000 to $17,499 | 28 (6.4%) | 14 (3.6%) |
| $17,500 to $19,999 | 12 (2.7%) | 69 (17.7%) |
| $20,000 to $22,499 | 0 (0.0%) | 11 (2.8%) |
| $22,500 to $24,999 | 6 (1.4%) | 20 (5.1%) |
| $25,000 to $29,999 | 57 (13.0%) | 34 (8.7%) |
| $30,000 to $34,999 | 19 (4.3%) | 21 (5.4%) |
| $35,000 to $39,999 | 12 (2.7%) | 0 (0.0%) |
| $40,000 to $44,999 | 57 (13.0%) | 44 (11.3%) |
| $45,000 to $49,999 | 0 (0.0%) | 0 (0.0%) |
| $50,000 to $54,999 | 25 (5.7%) | 21 (5.4%) |
| $55,000 to $64,999 | 78 (17.8%) | 0 (0.0%) |
| $65,000 to $74,999 | 6 (1.4%) | 9 (2.3%) |
| $75,000 to $99,999 | 19 (4.3%) | 0 (0.0%) |
| $100,000+ | 25 (5.7%) | 16 (4.1%) |
| Total | 438 (100.0%) | 389 (100.0%) |
Earnings by Sex by Educational Attainment in Pahala
Average earnings in Pahala are $40,516 for men and $23,438 for women, a difference of 42.1%. Men with an educational attainment of bachelor's degree enjoy the highest average annual earnings of $62,917, while those with high school diploma education earn the least with $27,863. Women with an educational attainment of bachelor's degree earn the most with the average annual earnings of $23,125, while those with college or associate's degree education have the smallest earnings of $19,063.
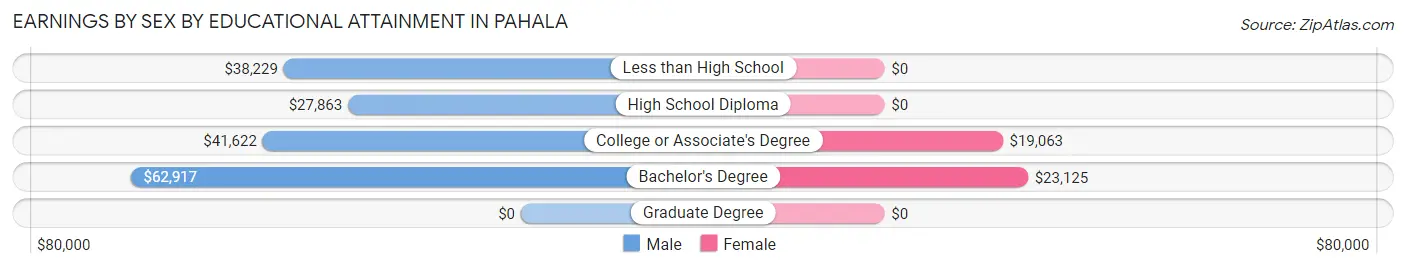
| Educational Attainment | Male Income | Female Income |
| Less than High School | $38,229 | $0 |
| High School Diploma | $27,863 | $0 |
| College or Associate's Degree | $41,622 | $19,063 |
| Bachelor's Degree | $62,917 | $23,125 |
| Graduate Degree | - | - |
| Total | $40,516 | $23,438 |
Family Income in Pahala
Family Income Brackets in Pahala
According to the Pahala family income data, there are 87 families falling into the $50,000 to $74,999 income range, which is the most common income bracket and makes up 26.4% of all families.
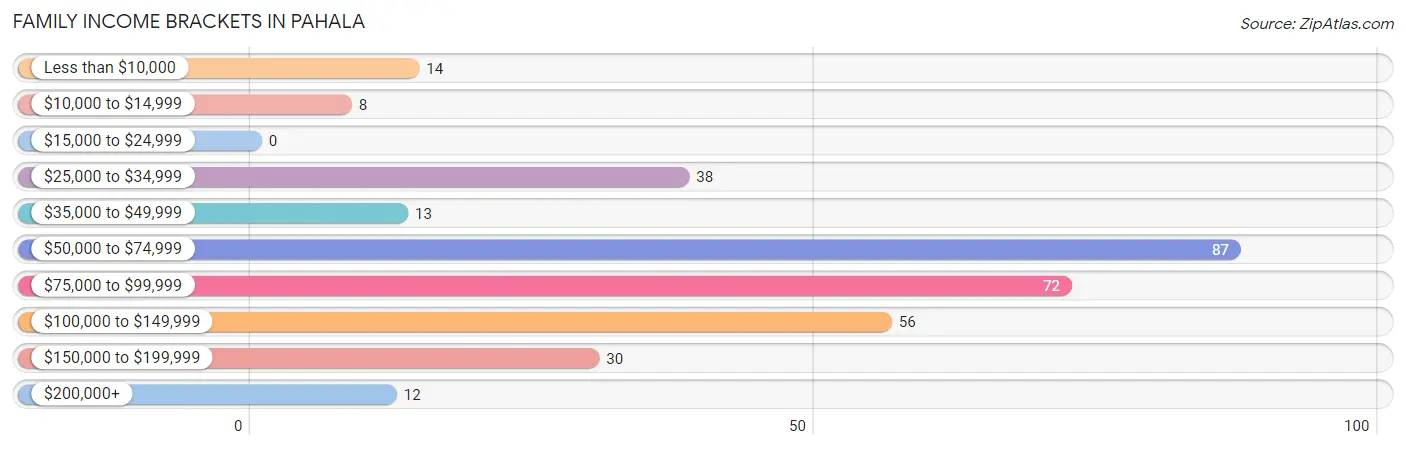
| Income Bracket | # Families | % Families |
| Less than $10,000 | 14 | 4.2% |
| $10,000 to $14,999 | 8 | 2.4% |
| $15,000 to $24,999 | 0 | 0.0% |
| $25,000 to $34,999 | 38 | 11.5% |
| $35,000 to $49,999 | 13 | 3.9% |
| $50,000 to $74,999 | 87 | 26.4% |
| $75,000 to $99,999 | 72 | 21.8% |
| $100,000 to $149,999 | 56 | 17.0% |
| $150,000 to $199,999 | 30 | 9.1% |
| $200,000+ | 12 | 3.6% |
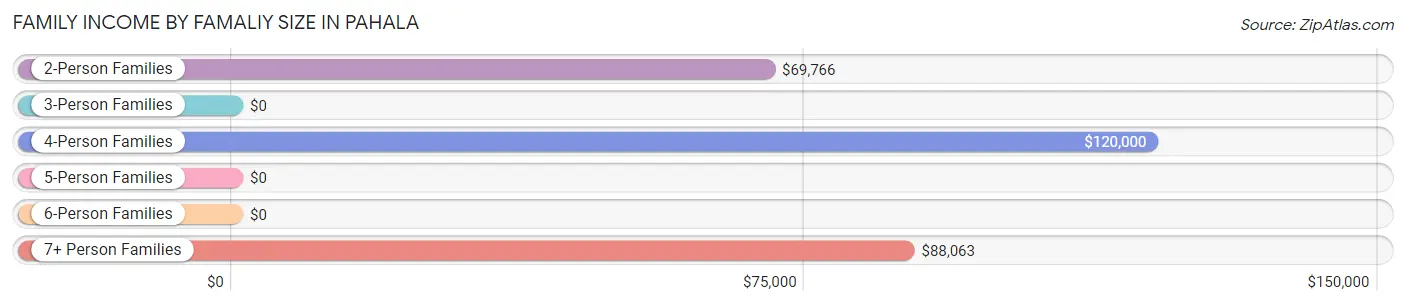
Family Income by Famaliy Size in Pahala
4-person families (64 | 19.4%) account for the highest median family income in Pahala with $120,000 per family, while 2-person families (103 | 31.2%) have the highest median income of $34,883 per family member.
| Income Bracket | # Families | Median Income |
| 2-Person Families | 103 (31.2%) | $69,766 |
| 3-Person Families | 91 (27.6%) | $0 |
| 4-Person Families | 64 (19.4%) | $120,000 |
| 5-Person Families | 7 (2.1%) | $0 |
| 6-Person Families | 14 (4.2%) | $0 |
| 7+ Person Families | 51 (15.4%) | $88,063 |
| Total | 330 (100.0%) | $78,393 |
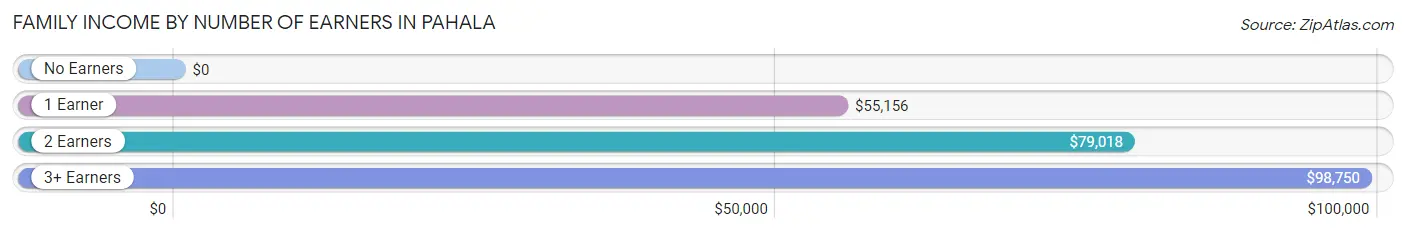
Family Income by Number of Earners in Pahala
| Number of Earners | # Families | Median Income |
| No Earners | 38 (11.5%) | $0 |
| 1 Earner | 85 (25.8%) | $55,156 |
| 2 Earners | 141 (42.7%) | $79,018 |
| 3+ Earners | 66 (20.0%) | $98,750 |
| Total | 330 (100.0%) | $78,393 |
Household Income in Pahala
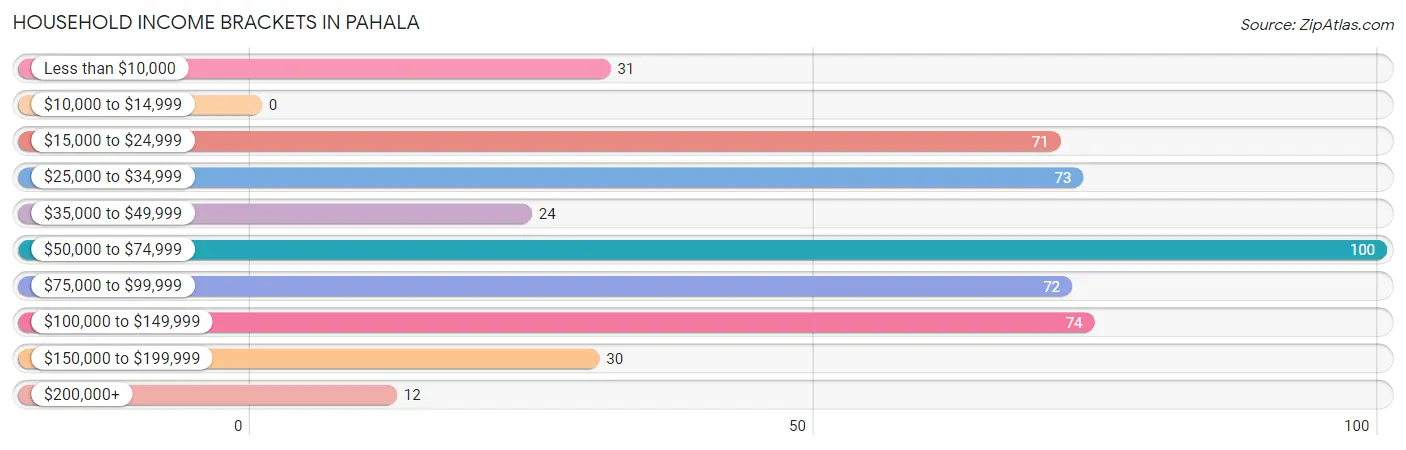
Household Income Brackets in Pahala
With 100 households falling in the category, the $50,000 to $74,999 income range is the most frequent in Pahala, accounting for 20.5% of all households.
| Income Bracket | # Households | % Households |
| Less than $10,000 | 31 | 6.4% |
| $10,000 to $14,999 | 0 | 0.0% |
| $15,000 to $24,999 | 71 | 14.6% |
| $25,000 to $34,999 | 73 | 15.0% |
| $35,000 to $49,999 | 24 | 4.9% |
| $50,000 to $74,999 | 100 | 20.5% |
| $75,000 to $99,999 | 72 | 14.8% |
| $100,000 to $149,999 | 74 | 15.2% |
| $150,000 to $199,999 | 30 | 6.2% |
| $200,000+ | 12 | 2.5% |
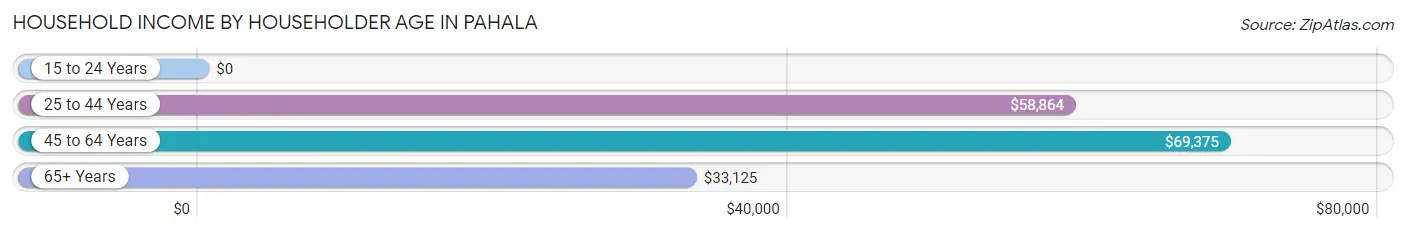
Household Income by Householder Age in Pahala
The median household income in Pahala is $59,432, with the highest median household income of $69,375 found in the 45 to 64 years age bracket for the primary householder. A total of 132 households (27.1%) fall into this category.
| Income Bracket | # Households | Median Income |
| 15 to 24 Years | 0 (0.0%) | $0 |
| 25 to 44 Years | 126 (25.9%) | $58,864 |
| 45 to 64 Years | 132 (27.1%) | $69,375 |
| 65+ Years | 229 (47.0%) | $33,125 |
| Total | 487 (100.0%) | $59,432 |
Poverty in Pahala
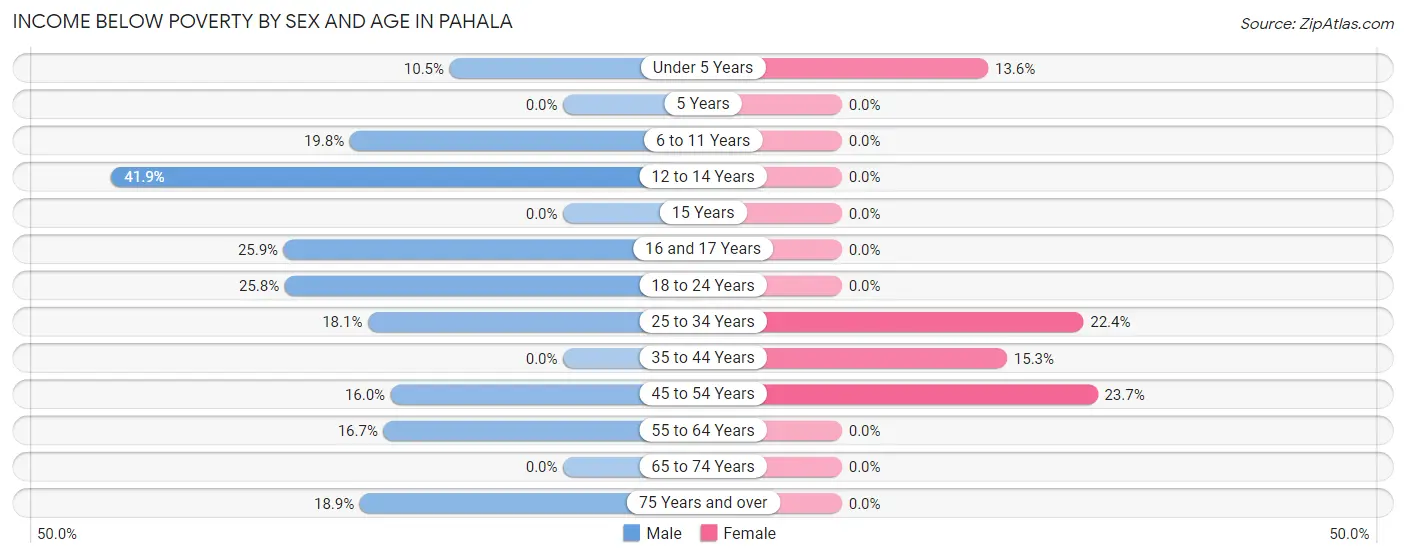
Income Below Poverty by Sex and Age in Pahala
With 16.6% poverty level for males and 7.7% for females among the residents of Pahala, 12 to 14 year old males and 45 to 54 year old females are the most vulnerable to poverty, with 13 males (41.9%) and 14 females (23.7%) in their respective age groups living below the poverty level.
| Age Bracket | Male | Female |
| Under 5 Years | 8 (10.5%) | 35 (13.6%) |
| 5 Years | 0 (0.0%) | 0 (0.0%) |
| 6 to 11 Years | 20 (19.8%) | 0 (0.0%) |
| 12 to 14 Years | 13 (41.9%) | 0 (0.0%) |
| 15 Years | 0 (0.0%) | 0 (0.0%) |
| 16 and 17 Years | 14 (25.9%) | 0 (0.0%) |
| 18 to 24 Years | 31 (25.8%) | 0 (0.0%) |
| 25 to 34 Years | 23 (18.1%) | 13 (22.4%) |
| 35 to 44 Years | 0 (0.0%) | 17 (15.3%) |
| 45 to 54 Years | 12 (16.0%) | 14 (23.7%) |
| 55 to 64 Years | 12 (16.7%) | 0 (0.0%) |
| 65 to 74 Years | 0 (0.0%) | 0 (0.0%) |
| 75 Years and over | 10 (18.9%) | 0 (0.0%) |
| Total | 143 (16.6%) | 79 (7.7%) |
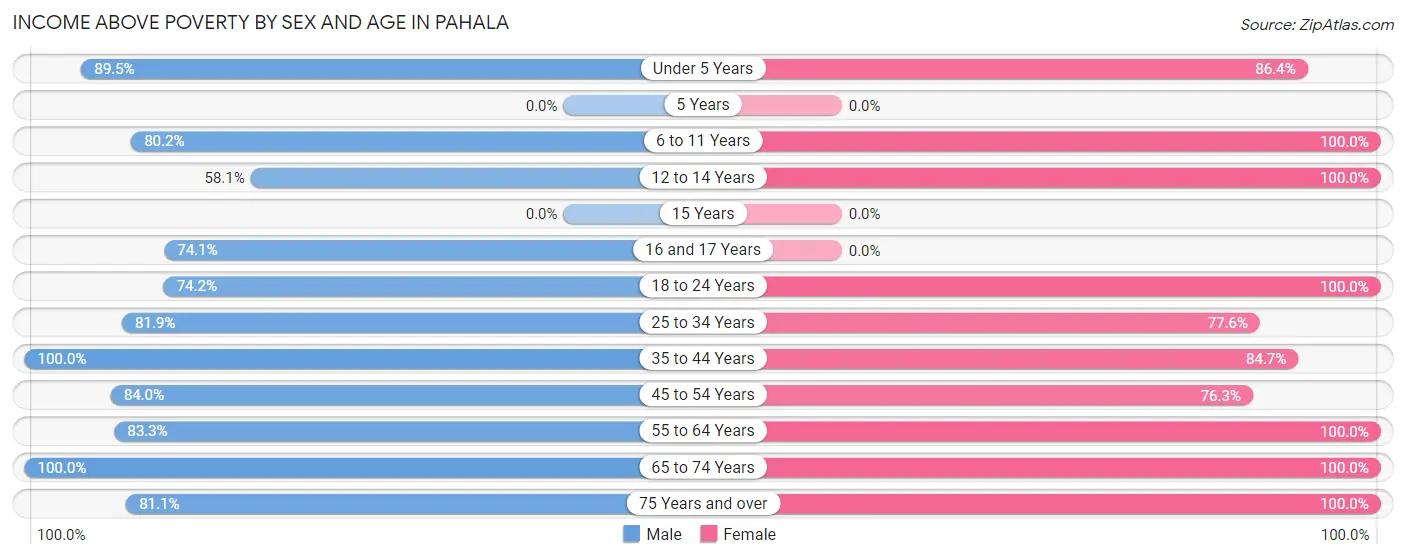
Income Above Poverty by Sex and Age in Pahala
According to the poverty statistics in Pahala, males aged 35 to 44 years and females aged 6 to 11 years are the age groups that are most secure financially, with 100.0% of males and 100.0% of females in these age groups living above the poverty line.
| Age Bracket | Male | Female |
| Under 5 Years | 68 (89.5%) | 223 (86.4%) |
| 5 Years | 0 (0.0%) | 0 (0.0%) |
| 6 to 11 Years | 81 (80.2%) | 66 (100.0%) |
| 12 to 14 Years | 18 (58.1%) | 51 (100.0%) |
| 15 Years | 0 (0.0%) | 0 (0.0%) |
| 16 and 17 Years | 40 (74.1%) | 0 (0.0%) |
| 18 to 24 Years | 89 (74.2%) | 175 (100.0%) |
| 25 to 34 Years | 104 (81.9%) | 45 (77.6%) |
| 35 to 44 Years | 58 (100.0%) | 94 (84.7%) |
| 45 to 54 Years | 63 (84.0%) | 45 (76.3%) |
| 55 to 64 Years | 60 (83.3%) | 76 (100.0%) |
| 65 to 74 Years | 93 (100.0%) | 136 (100.0%) |
| 75 Years and over | 43 (81.1%) | 31 (100.0%) |
| Total | 717 (83.4%) | 942 (92.3%) |
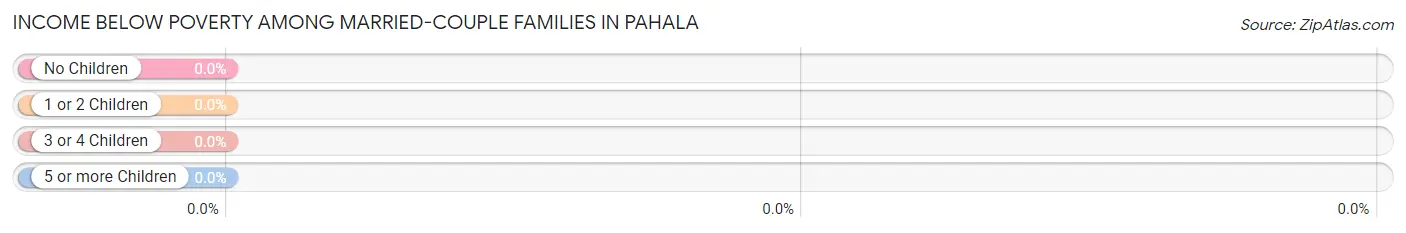
Income Below Poverty Among Married-Couple Families in Pahala
| Children | Above Poverty | Below Poverty |
| No Children | 137 (100.0%) | 0 (0.0%) |
| 1 or 2 Children | 78 (100.0%) | 0 (0.0%) |
| 3 or 4 Children | 21 (100.0%) | 0 (0.0%) |
| 5 or more Children | 20 (100.0%) | 0 (0.0%) |
| Total | 256 (100.0%) | 0 (0.0%) |
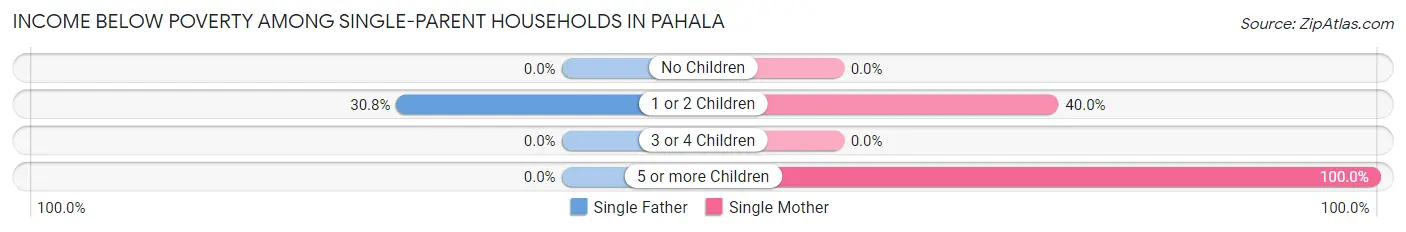
Income Below Poverty Among Single-Parent Households in Pahala
According to the poverty data in Pahala, 30.8% or 8 single-father households and 56.2% or 27 single-mother households are living below the poverty line. Among single-father households, those with 1 or 2 children have the highest poverty rate, with 8 households (30.8%) experiencing poverty. Likewise, among single-mother households, those with 5 or more children have the highest poverty rate, with 13 households (100.0%) falling below the poverty line.
| Children | Single Father | Single Mother |
| No Children | 0 (0.0%) | 0 (0.0%) |
| 1 or 2 Children | 8 (30.8%) | 14 (40.0%) |
| 3 or 4 Children | 0 (0.0%) | 0 (0.0%) |
| 5 or more Children | 0 (0.0%) | 13 (100.0%) |
| Total | 8 (30.8%) | 27 (56.2%) |
Income Below Poverty Among Married-Couple vs Single-Parent Households in Pahala
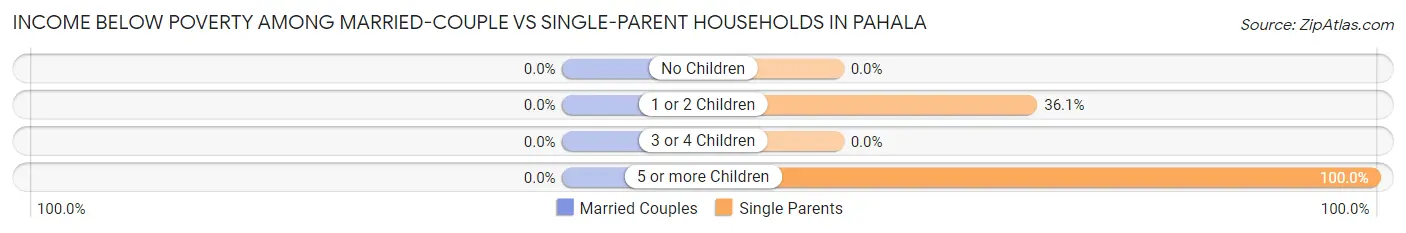
| Children | Married-Couple Families | Single-Parent Households |
| No Children | 0 (0.0%) | 0 (0.0%) |
| 1 or 2 Children | 0 (0.0%) | 22 (36.1%) |
| 3 or 4 Children | 0 (0.0%) | 0 (0.0%) |
| 5 or more Children | 0 (0.0%) | 13 (100.0%) |
| Total | 0 (0.0%) | 35 (47.3%) |
Employment Characteristics in Pahala
Employment by Class of Employer in Pahala
Among the 593 employed individuals in Pahala, private company employees (301 | 50.8%), state government employees (114 | 19.2%), and federal government employees (60 | 10.1%) make up the most common classes of employment.
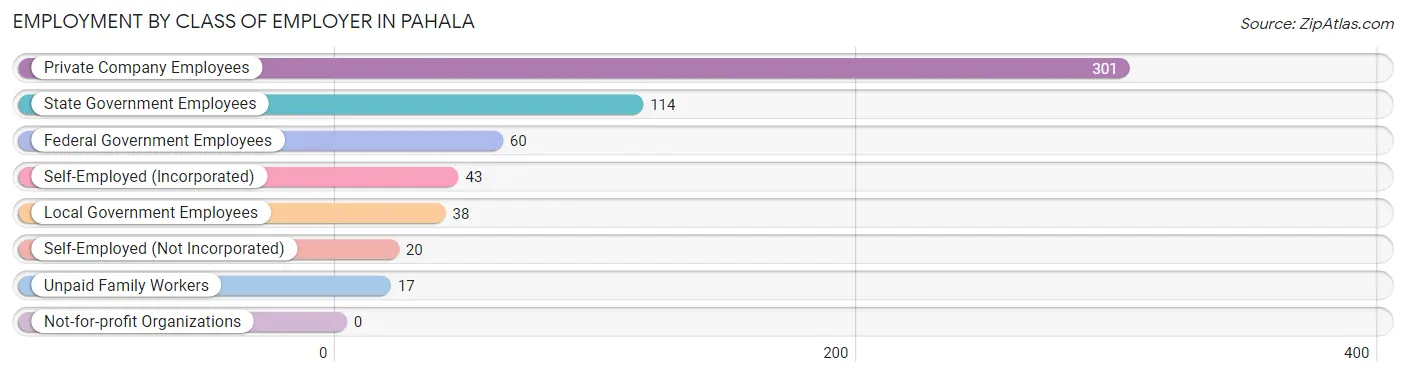
| Employer Class | # Employees | % Employees |
| Private Company Employees | 301 | 50.8% |
| Self-Employed (Incorporated) | 43 | 7.2% |
| Self-Employed (Not Incorporated) | 20 | 3.4% |
| Not-for-profit Organizations | 0 | 0.0% |
| Local Government Employees | 38 | 6.4% |
| State Government Employees | 114 | 19.2% |
| Federal Government Employees | 60 | 10.1% |
| Unpaid Family Workers | 17 | 2.9% |
| Total | 593 | 100.0% |
Employment Status by Age in Pahala
According to the labor force statistics for Pahala, out of the total population over 16 years of age (1,314), 57.2% or 752 individuals are in the labor force, with 19.6% or 147 of them unemployed. The age group with the highest labor force participation rate is 30 to 34 years, with 100.0% or 67 individuals in the labor force. Within the labor force, the 20 to 24 years age range has the highest percentage of unemployed individuals, with 72.9% or 70 of them being unemployed.
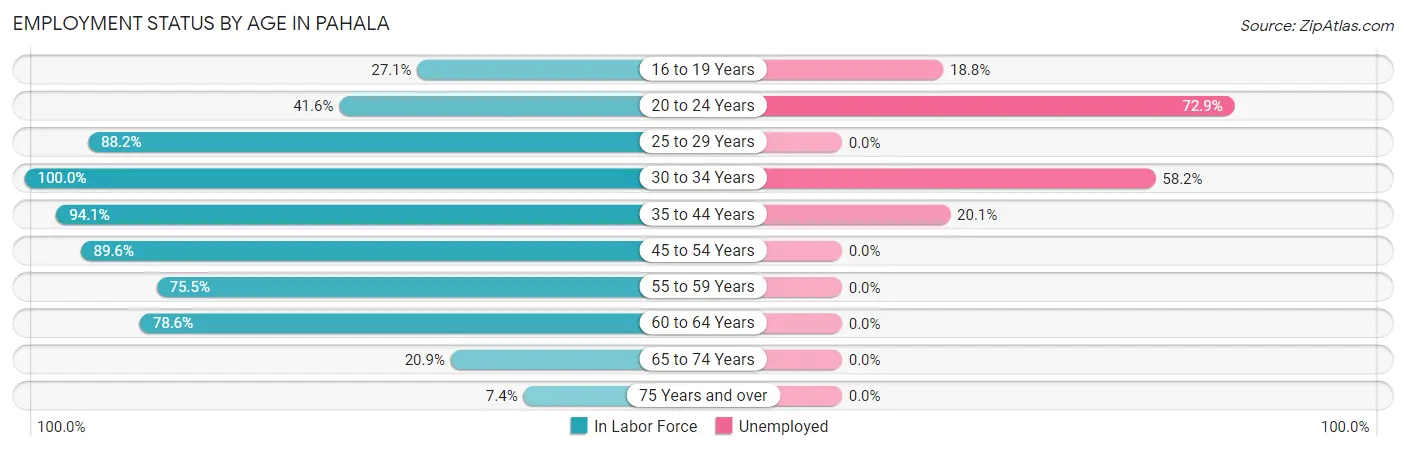
| Age Bracket | In Labor Force | Unemployed |
| 16 to 19 Years | 32 (27.1%) | 6 (18.8%) |
| 20 to 24 Years | 96 (41.6%) | 70 (72.9%) |
| 25 to 29 Years | 105 (88.2%) | 0 (0.0%) |
| 30 to 34 Years | 67 (100.0%) | 39 (58.2%) |
| 35 to 44 Years | 159 (94.1%) | 32 (20.1%) |
| 45 to 54 Years | 120 (89.6%) | 0 (0.0%) |
| 55 to 59 Years | 40 (75.5%) | 0 (0.0%) |
| 60 to 64 Years | 77 (78.6%) | 0 (0.0%) |
| 65 to 74 Years | 48 (20.9%) | 0 (0.0%) |
| 75 Years and over | 7 (7.4%) | 0 (0.0%) |
| Total | 752 (57.2%) | 147 (19.6%) |
Employment Status by Educational Attainment in Pahala
According to labor force statistics for Pahala, 88.8% of individuals (568) out of the total population between 25 and 64 years of age (640) are in the labor force, with 12.5% or 71 of them being unemployed. The group with the highest labor force participation rate are those with the educational attainment of bachelor's degree or higher, with 98.6% or 137 individuals in the labor force. Within the labor force, individuals with less than high school education have the highest percentage of unemployment, with 42.1% or 16 of them being unemployed.
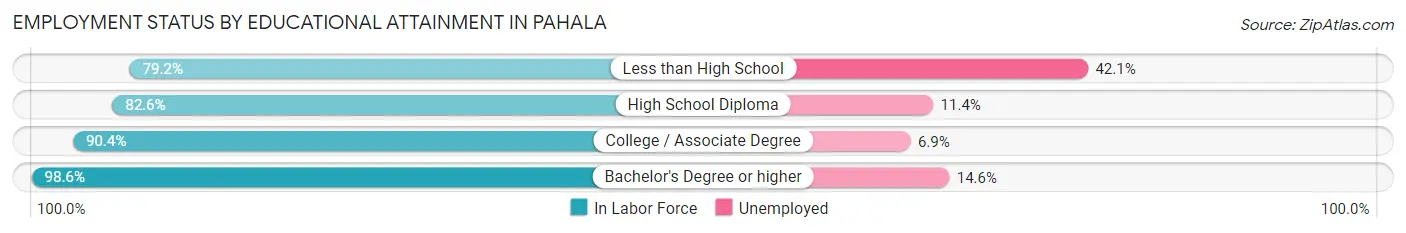
| Educational Attainment | In Labor Force | Unemployed |
| Less than High School | 38 (79.2%) | 20 (42.1%) |
| High School Diploma | 176 (82.6%) | 24 (11.4%) |
| College / Associate Degree | 217 (90.4%) | 17 (6.9%) |
| Bachelor's Degree or higher | 137 (98.6%) | 20 (14.6%) |
| Total | 568 (88.8%) | 80 (12.5%) |
Employment Occupations by Sex in Pahala
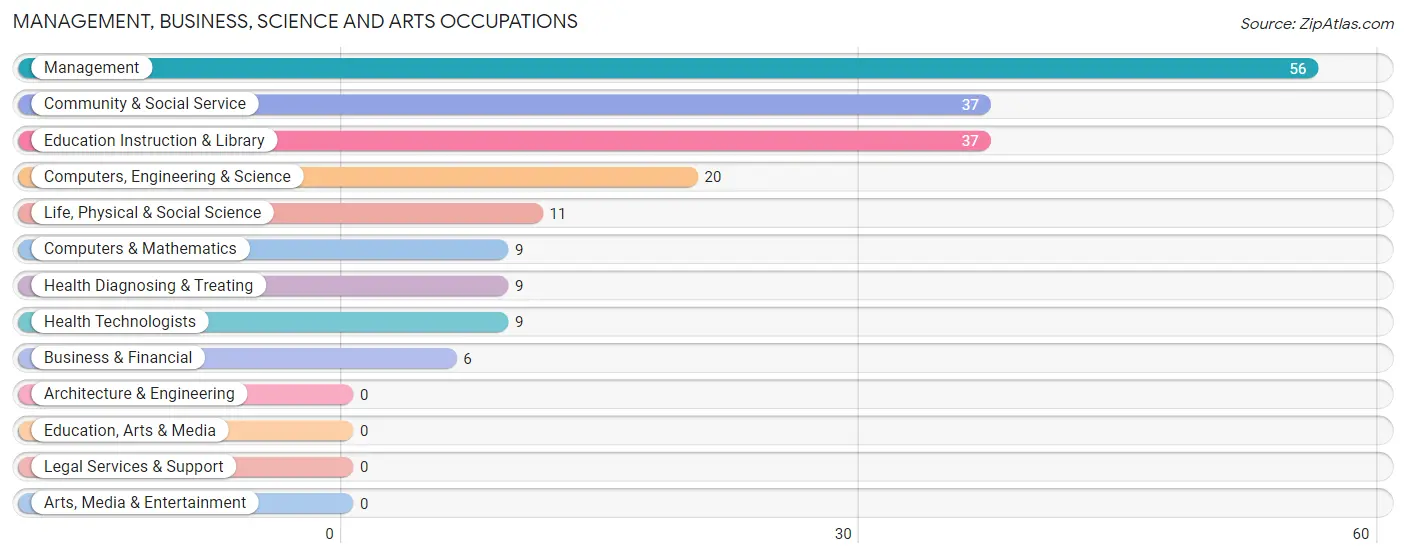
Management, Business, Science and Arts Occupations
The most common Management, Business, Science and Arts occupations in Pahala are Management (56 | 9.3%), Community & Social Service (37 | 6.1%), Education Instruction & Library (37 | 6.1%), Computers, Engineering & Science (20 | 3.3%), and Life, Physical & Social Science (11 | 1.8%).
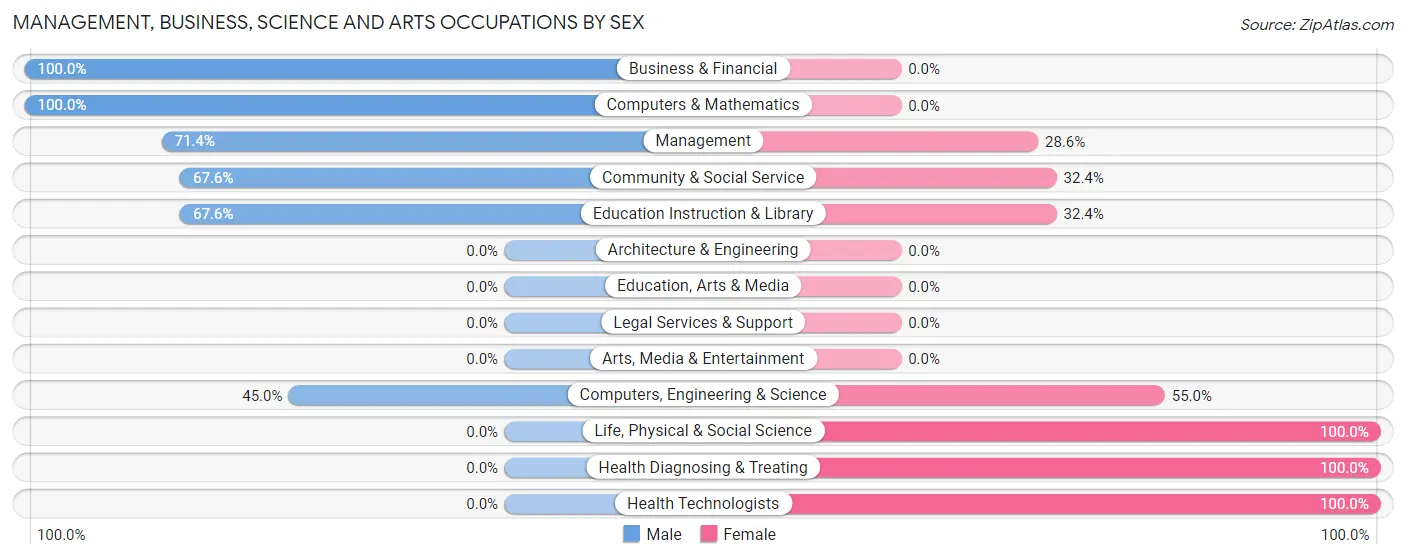
Management, Business, Science and Arts Occupations by Sex
Within the Management, Business, Science and Arts occupations in Pahala, the most male-oriented occupations are Business & Financial (100.0%), Computers & Mathematics (100.0%), and Management (71.4%), while the most female-oriented occupations are Life, Physical & Social Science (100.0%), Health Diagnosing & Treating (100.0%), and Health Technologists (100.0%).
| Occupation | Male | Female |
| Management | 40 (71.4%) | 16 (28.6%) |
| Business & Financial | 6 (100.0%) | 0 (0.0%) |
| Computers, Engineering & Science | 9 (45.0%) | 11 (55.0%) |
| Computers & Mathematics | 9 (100.0%) | 0 (0.0%) |
| Architecture & Engineering | 0 (0.0%) | 0 (0.0%) |
| Life, Physical & Social Science | 0 (0.0%) | 11 (100.0%) |
| Community & Social Service | 25 (67.6%) | 12 (32.4%) |
| Education, Arts & Media | 0 (0.0%) | 0 (0.0%) |
| Legal Services & Support | 0 (0.0%) | 0 (0.0%) |
| Education Instruction & Library | 25 (67.6%) | 12 (32.4%) |
| Arts, Media & Entertainment | 0 (0.0%) | 0 (0.0%) |
| Health Diagnosing & Treating | 0 (0.0%) | 9 (100.0%) |
| Health Technologists | 0 (0.0%) | 9 (100.0%) |
| Total (Category) | 80 (62.5%) | 48 (37.5%) |
| Total (Overall) | 355 (58.8%) | 249 (41.2%) |
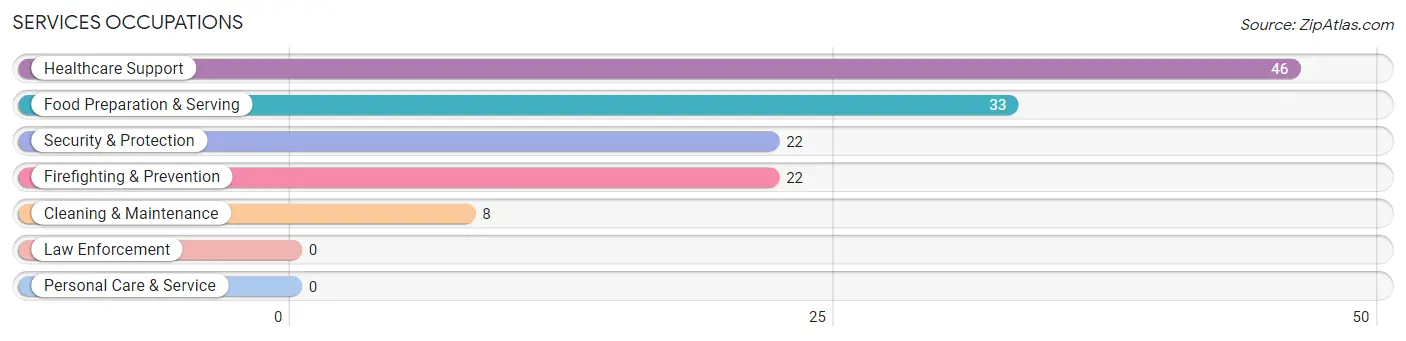
Services Occupations
The most common Services occupations in Pahala are Healthcare Support (46 | 7.6%), Food Preparation & Serving (33 | 5.5%), Security & Protection (22 | 3.6%), Firefighting & Prevention (22 | 3.6%), and Cleaning & Maintenance (8 | 1.3%).
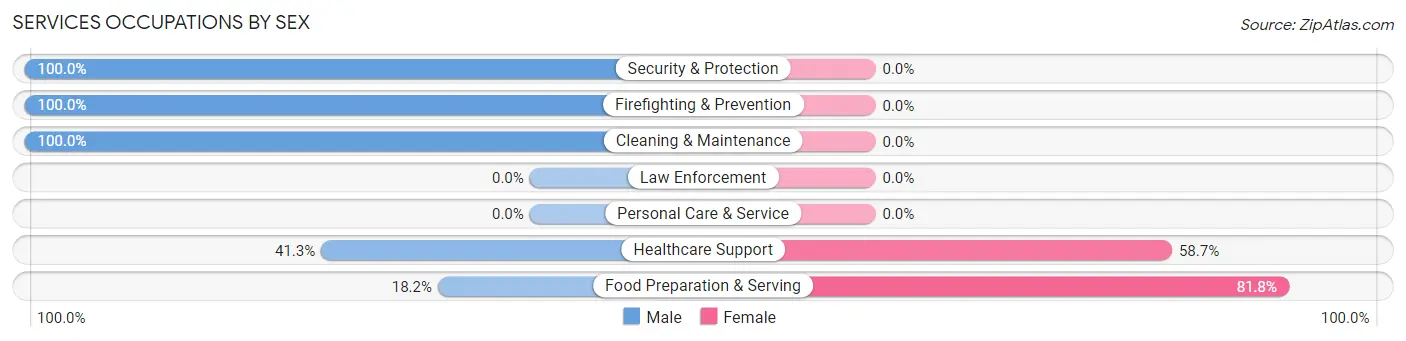
Services Occupations by Sex
Within the Services occupations in Pahala, the most male-oriented occupations are Security & Protection (100.0%), Firefighting & Prevention (100.0%), and Cleaning & Maintenance (100.0%), while the most female-oriented occupations are Food Preparation & Serving (81.8%), and Healthcare Support (58.7%).
| Occupation | Male | Female |
| Healthcare Support | 19 (41.3%) | 27 (58.7%) |
| Security & Protection | 22 (100.0%) | 0 (0.0%) |
| Firefighting & Prevention | 22 (100.0%) | 0 (0.0%) |
| Law Enforcement | 0 (0.0%) | 0 (0.0%) |
| Food Preparation & Serving | 6 (18.2%) | 27 (81.8%) |
| Cleaning & Maintenance | 8 (100.0%) | 0 (0.0%) |
| Personal Care & Service | 0 (0.0%) | 0 (0.0%) |
| Total (Category) | 55 (50.5%) | 54 (49.5%) |
| Total (Overall) | 355 (58.8%) | 249 (41.2%) |
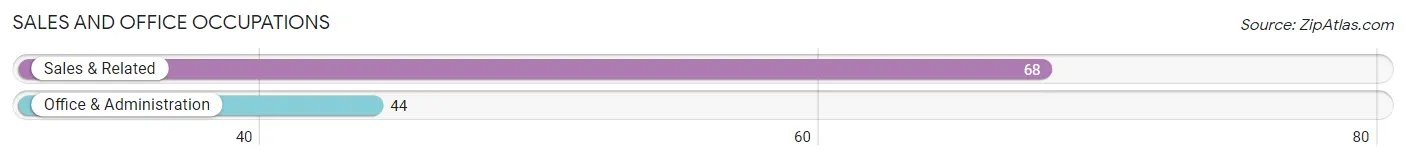
Sales and Office Occupations
The most common Sales and Office occupations in Pahala are Sales & Related (68 | 11.3%), and Office & Administration (44 | 7.3%).
Sales and Office Occupations by Sex
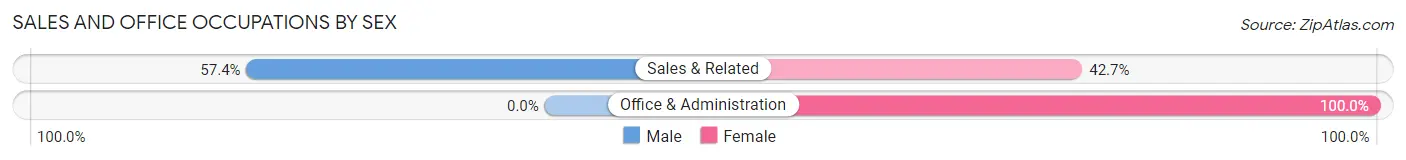
| Occupation | Male | Female |
| Sales & Related | 39 (57.4%) | 29 (42.6%) |
| Office & Administration | 0 (0.0%) | 44 (100.0%) |
| Total (Category) | 39 (34.8%) | 73 (65.2%) |
| Total (Overall) | 355 (58.8%) | 249 (41.2%) |
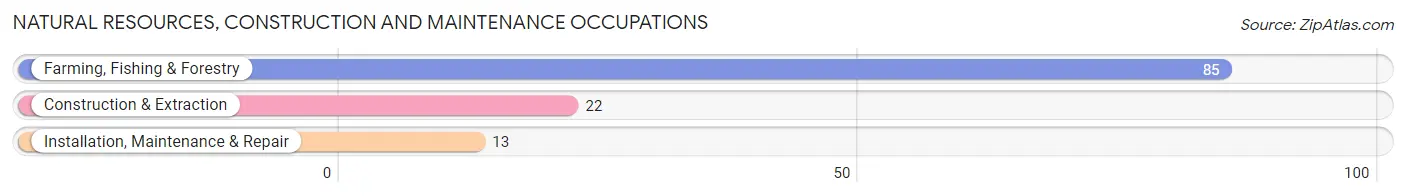
Natural Resources, Construction and Maintenance Occupations
The most common Natural Resources, Construction and Maintenance occupations in Pahala are Farming, Fishing & Forestry (85 | 14.1%), Construction & Extraction (22 | 3.6%), and Installation, Maintenance & Repair (13 | 2.1%).
Natural Resources, Construction and Maintenance Occupations by Sex
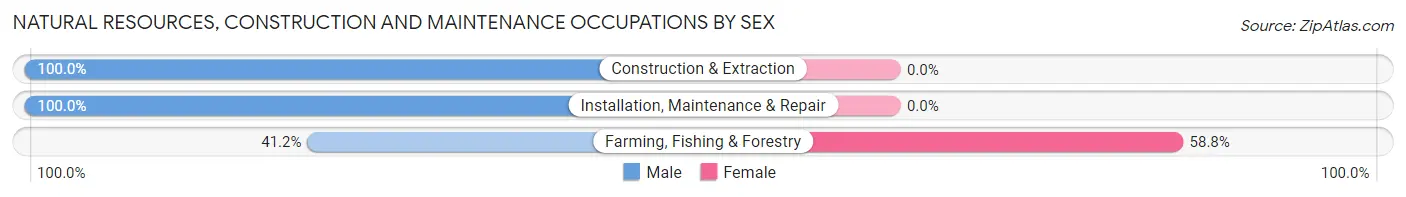
| Occupation | Male | Female |
| Farming, Fishing & Forestry | 35 (41.2%) | 50 (58.8%) |
| Construction & Extraction | 22 (100.0%) | 0 (0.0%) |
| Installation, Maintenance & Repair | 13 (100.0%) | 0 (0.0%) |
| Total (Category) | 70 (58.3%) | 50 (41.7%) |
| Total (Overall) | 355 (58.8%) | 249 (41.2%) |
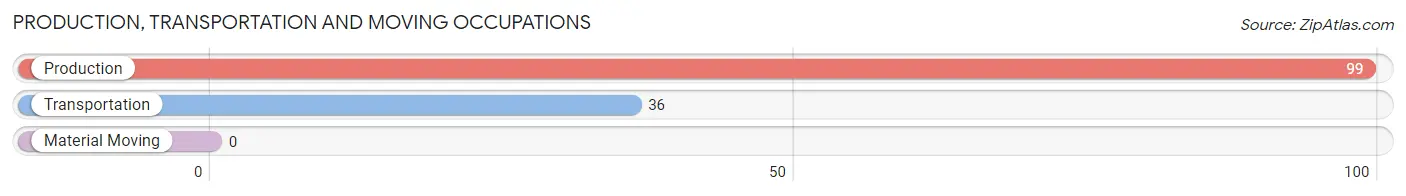
Production, Transportation and Moving Occupations
The most common Production, Transportation and Moving occupations in Pahala are Production (99 | 16.4%), and Transportation (36 | 6.0%).
Production, Transportation and Moving Occupations by Sex
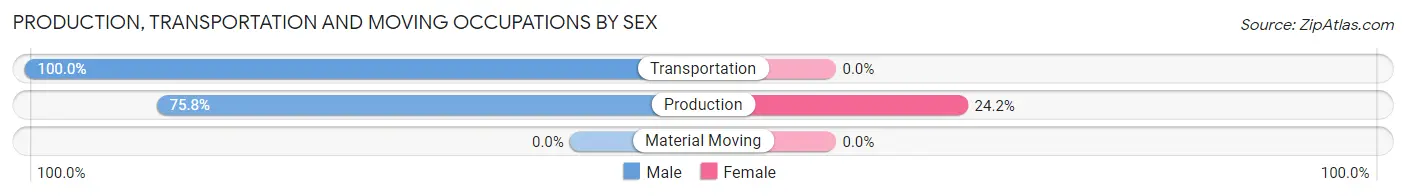
| Occupation | Male | Female |
| Production | 75 (75.8%) | 24 (24.2%) |
| Transportation | 36 (100.0%) | 0 (0.0%) |
| Material Moving | 0 (0.0%) | 0 (0.0%) |
| Total (Category) | 111 (82.2%) | 24 (17.8%) |
| Total (Overall) | 355 (58.8%) | 249 (41.2%) |
Employment Industries by Sex in Pahala
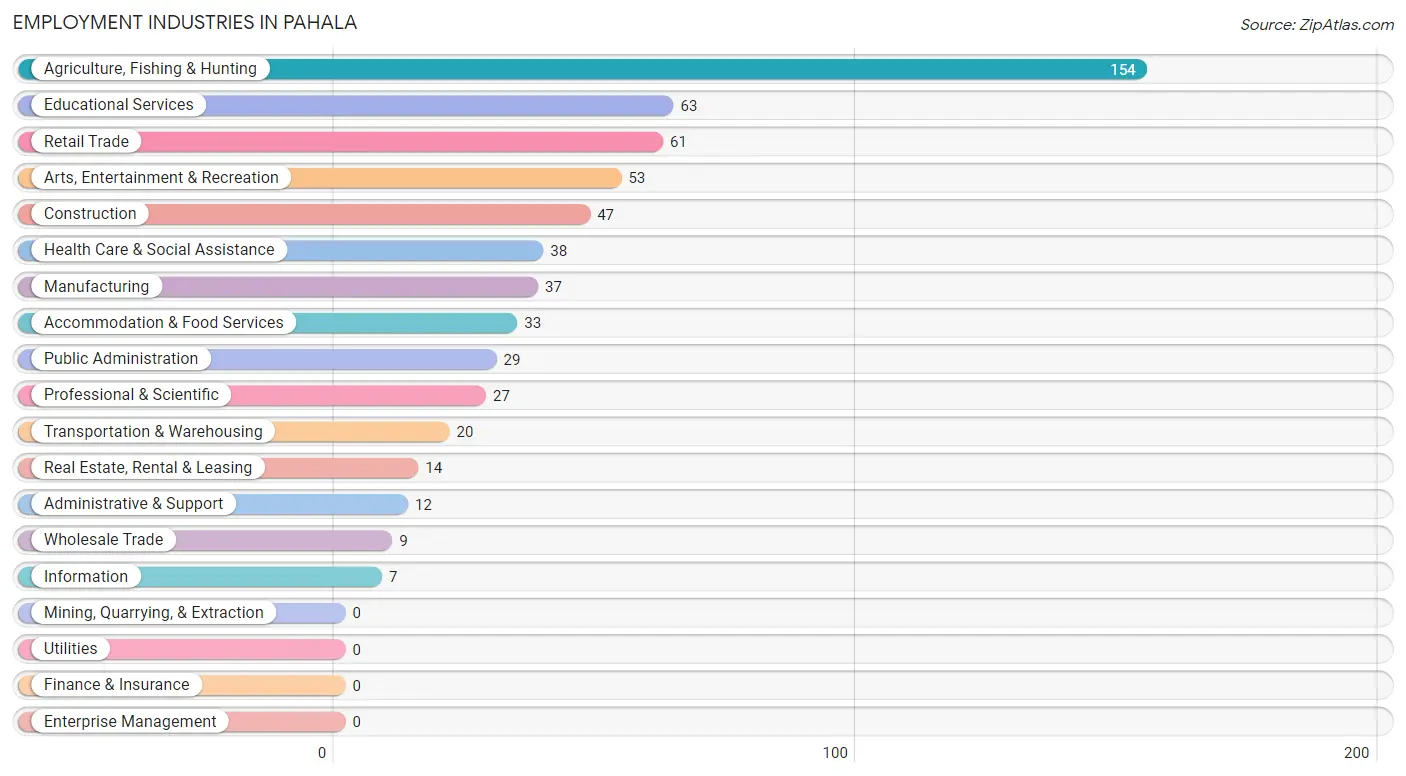
Employment Industries in Pahala
The major employment industries in Pahala include Agriculture, Fishing & Hunting (154 | 25.5%), Educational Services (63 | 10.4%), Retail Trade (61 | 10.1%), Arts, Entertainment & Recreation (53 | 8.8%), and Construction (47 | 7.8%).
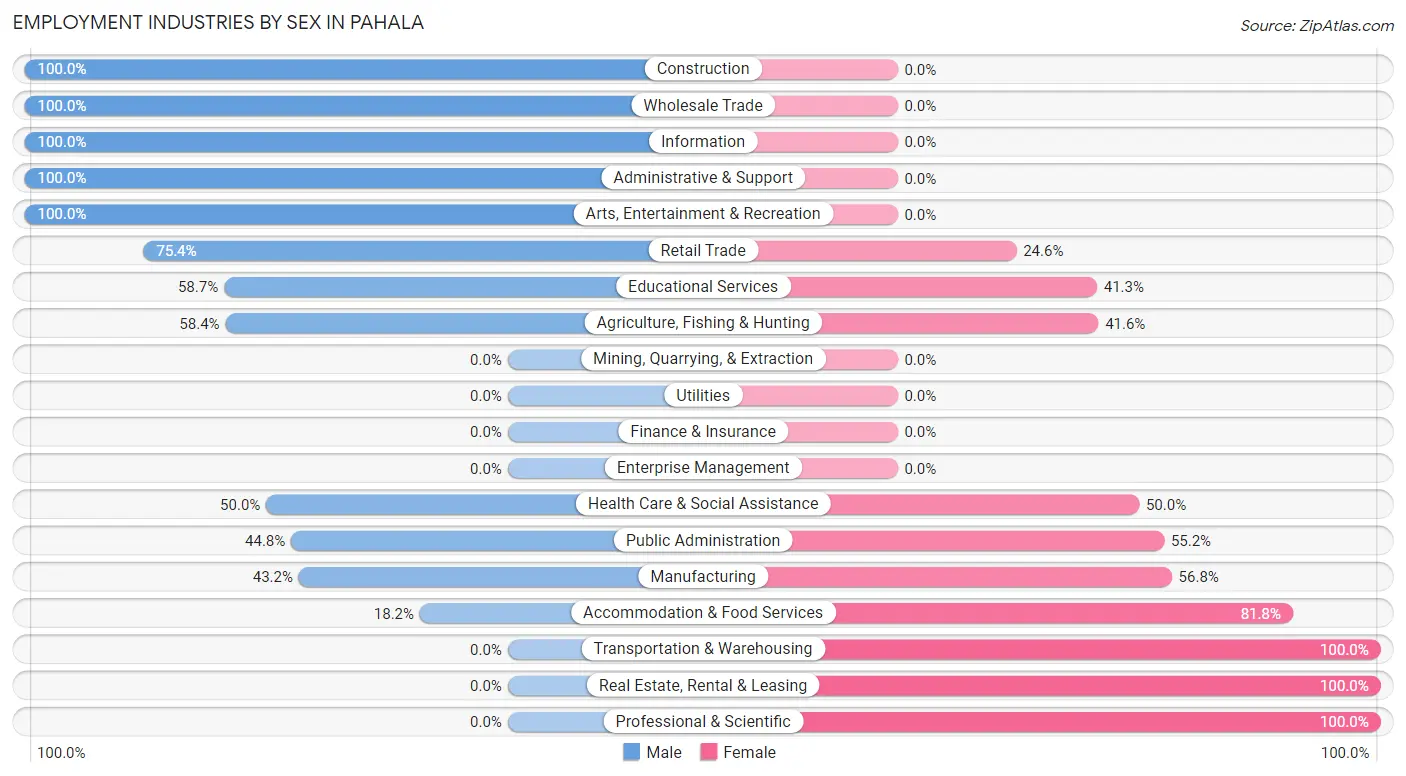
Employment Industries by Sex in Pahala
The Pahala industries that see more men than women are Construction (100.0%), Wholesale Trade (100.0%), and Information (100.0%), whereas the industries that tend to have a higher number of women are Transportation & Warehousing (100.0%), Real Estate, Rental & Leasing (100.0%), and Professional & Scientific (100.0%).
| Industry | Male | Female |
| Agriculture, Fishing & Hunting | 90 (58.4%) | 64 (41.6%) |
| Mining, Quarrying, & Extraction | 0 (0.0%) | 0 (0.0%) |
| Construction | 47 (100.0%) | 0 (0.0%) |
| Manufacturing | 16 (43.2%) | 21 (56.8%) |
| Wholesale Trade | 9 (100.0%) | 0 (0.0%) |
| Retail Trade | 46 (75.4%) | 15 (24.6%) |
| Transportation & Warehousing | 0 (0.0%) | 20 (100.0%) |
| Utilities | 0 (0.0%) | 0 (0.0%) |
| Information | 7 (100.0%) | 0 (0.0%) |
| Finance & Insurance | 0 (0.0%) | 0 (0.0%) |
| Real Estate, Rental & Leasing | 0 (0.0%) | 14 (100.0%) |
| Professional & Scientific | 0 (0.0%) | 27 (100.0%) |
| Enterprise Management | 0 (0.0%) | 0 (0.0%) |
| Administrative & Support | 12 (100.0%) | 0 (0.0%) |
| Educational Services | 37 (58.7%) | 26 (41.3%) |
| Health Care & Social Assistance | 19 (50.0%) | 19 (50.0%) |
| Arts, Entertainment & Recreation | 53 (100.0%) | 0 (0.0%) |
| Accommodation & Food Services | 6 (18.2%) | 27 (81.8%) |
| Public Administration | 13 (44.8%) | 16 (55.2%) |
| Total | 355 (58.8%) | 249 (41.2%) |
Education in Pahala
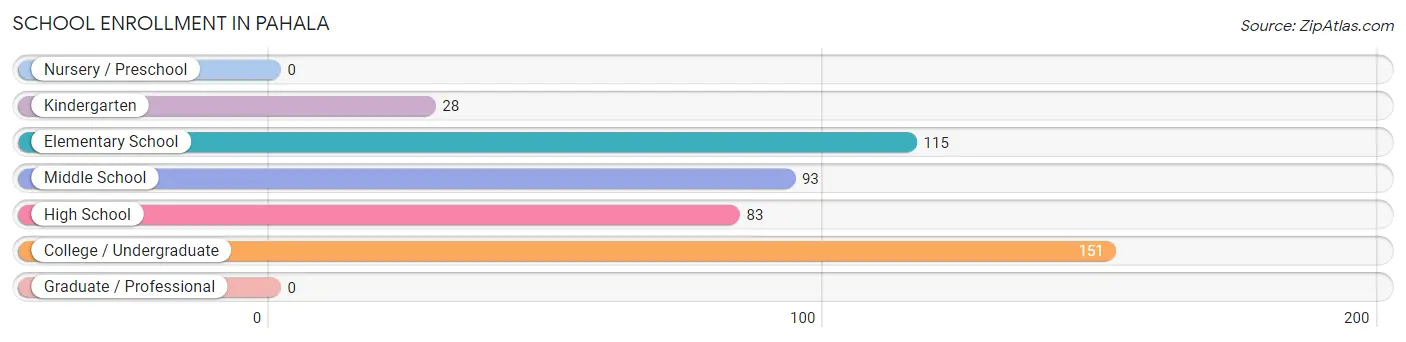
School Enrollment in Pahala
The most common levels of schooling among the 470 students in Pahala are college / undergraduate (151 | 32.1%), elementary school (115 | 24.5%), and middle school (93 | 19.8%).
| School Level | # Students | % Students |
| Nursery / Preschool | 0 | 0.0% |
| Kindergarten | 28 | 6.0% |
| Elementary School | 115 | 24.5% |
| Middle School | 93 | 19.8% |
| High School | 83 | 17.7% |
| College / Undergraduate | 151 | 32.1% |
| Graduate / Professional | 0 | 0.0% |
| Total | 470 | 100.0% |
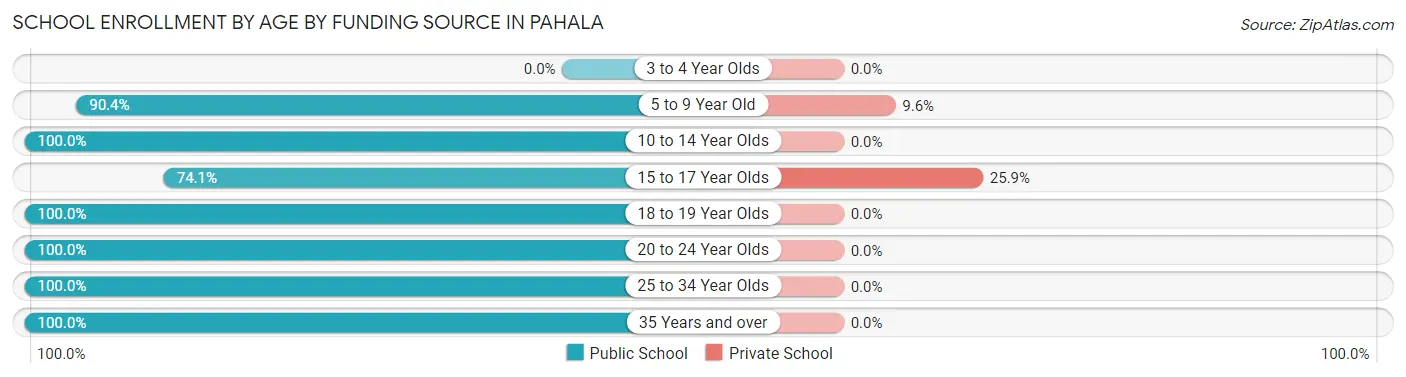
School Enrollment by Age by Funding Source in Pahala
Out of a total of 470 students who are enrolled in schools in Pahala, 27 (5.7%) attend a private institution, while the remaining 443 (94.3%) are enrolled in public schools. The age group of 15 to 17 year olds has the highest likelihood of being enrolled in private schools, with 14 (25.9% in the age bracket) enrolled. Conversely, the age group of 10 to 14 year olds has the lowest likelihood of being enrolled in a private school, with 114 (100.0% in the age bracket) attending a public institution.
| Age Bracket | Public School | Private School |
| 3 to 4 Year Olds | 0 (0.0%) | 0 (0.0%) |
| 5 to 9 Year Old | 122 (90.4%) | 13 (9.6%) |
| 10 to 14 Year Olds | 114 (100.0%) | 0 (0.0%) |
| 15 to 17 Year Olds | 40 (74.1%) | 14 (25.9%) |
| 18 to 19 Year Olds | 23 (100.0%) | 0 (0.0%) |
| 20 to 24 Year Olds | 86 (100.0%) | 0 (0.0%) |
| 25 to 34 Year Olds | 31 (100.0%) | 0 (0.0%) |
| 35 Years and over | 27 (100.0%) | 0 (0.0%) |
| Total | 443 (94.3%) | 27 (5.7%) |
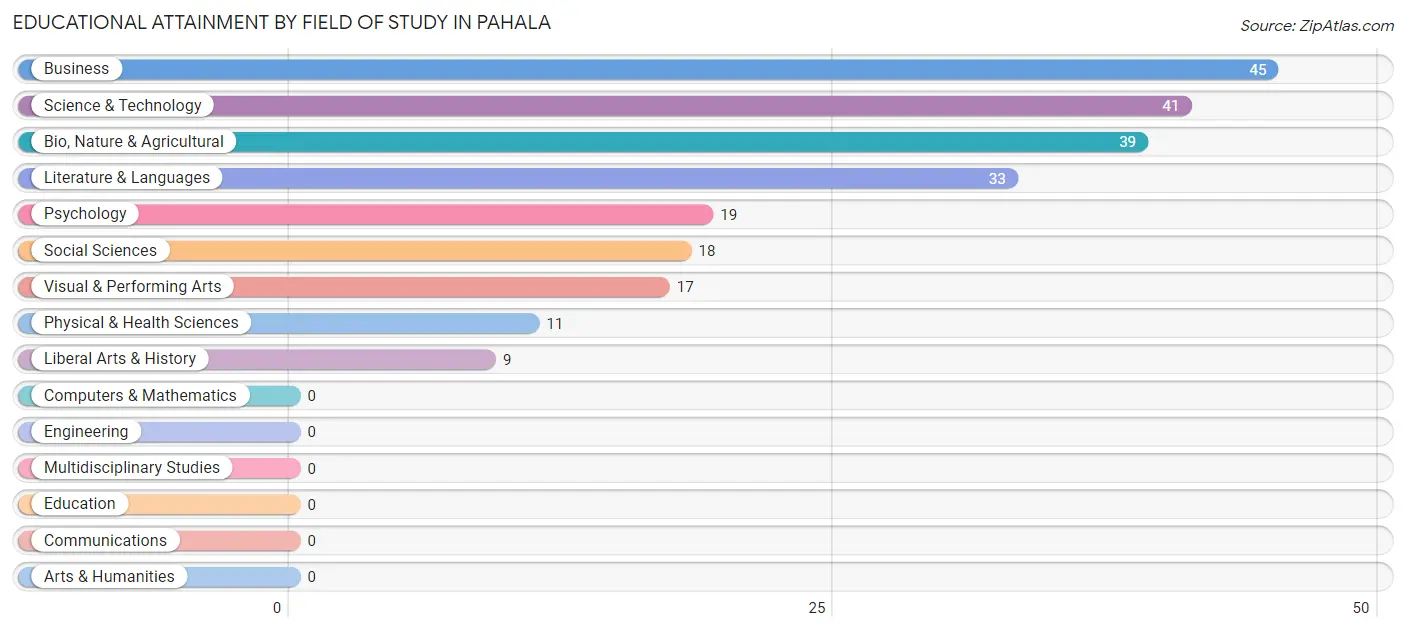
Educational Attainment by Field of Study in Pahala
Business (45 | 19.4%), science & technology (41 | 17.7%), bio, nature & agricultural (39 | 16.8%), literature & languages (33 | 14.2%), and psychology (19 | 8.2%) are the most common fields of study among 232 individuals in Pahala who have obtained a bachelor's degree or higher.
| Field of Study | # Graduates | % Graduates |
| Computers & Mathematics | 0 | 0.0% |
| Bio, Nature & Agricultural | 39 | 16.8% |
| Physical & Health Sciences | 11 | 4.7% |
| Psychology | 19 | 8.2% |
| Social Sciences | 18 | 7.8% |
| Engineering | 0 | 0.0% |
| Multidisciplinary Studies | 0 | 0.0% |
| Science & Technology | 41 | 17.7% |
| Business | 45 | 19.4% |
| Education | 0 | 0.0% |
| Literature & Languages | 33 | 14.2% |
| Liberal Arts & History | 9 | 3.9% |
| Visual & Performing Arts | 17 | 7.3% |
| Communications | 0 | 0.0% |
| Arts & Humanities | 0 | 0.0% |
| Total | 232 | 100.0% |
Transportation & Commute in Pahala
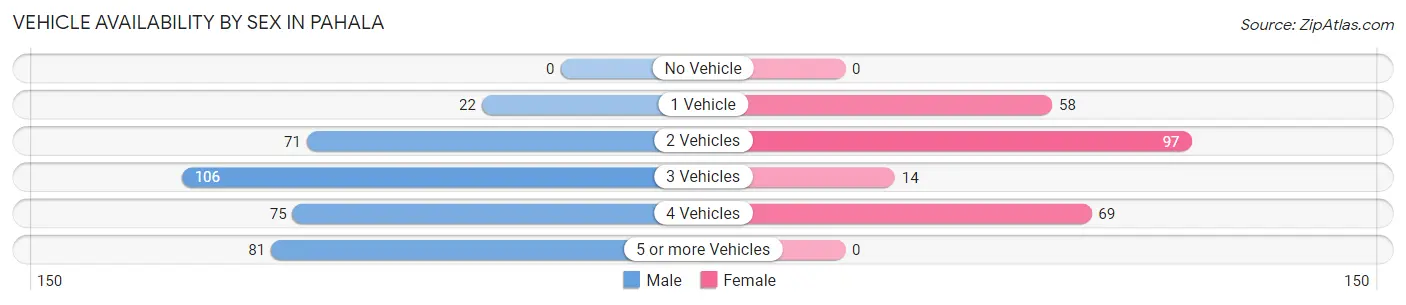
Vehicle Availability by Sex in Pahala
The most prevalent vehicle ownership categories in Pahala are males with 3 vehicles (106, accounting for 29.9%) and females with 3 vehicles (14, making up 44.5%).
| Vehicles Available | Male | Female |
| No Vehicle | 0 (0.0%) | 0 (0.0%) |
| 1 Vehicle | 22 (6.2%) | 58 (24.4%) |
| 2 Vehicles | 71 (20.0%) | 97 (40.8%) |
| 3 Vehicles | 106 (29.9%) | 14 (5.9%) |
| 4 Vehicles | 75 (21.1%) | 69 (29.0%) |
| 5 or more Vehicles | 81 (22.8%) | 0 (0.0%) |
| Total | 355 (100.0%) | 238 (100.0%) |
Commute Time in Pahala
The most frequently occuring commute durations in Pahala are 5 to 9 minutes (111 commuters, 21.8%), 60 to 89 minutes (85 commuters, 16.7%), and 45 to 59 minutes (70 commuters, 13.8%).
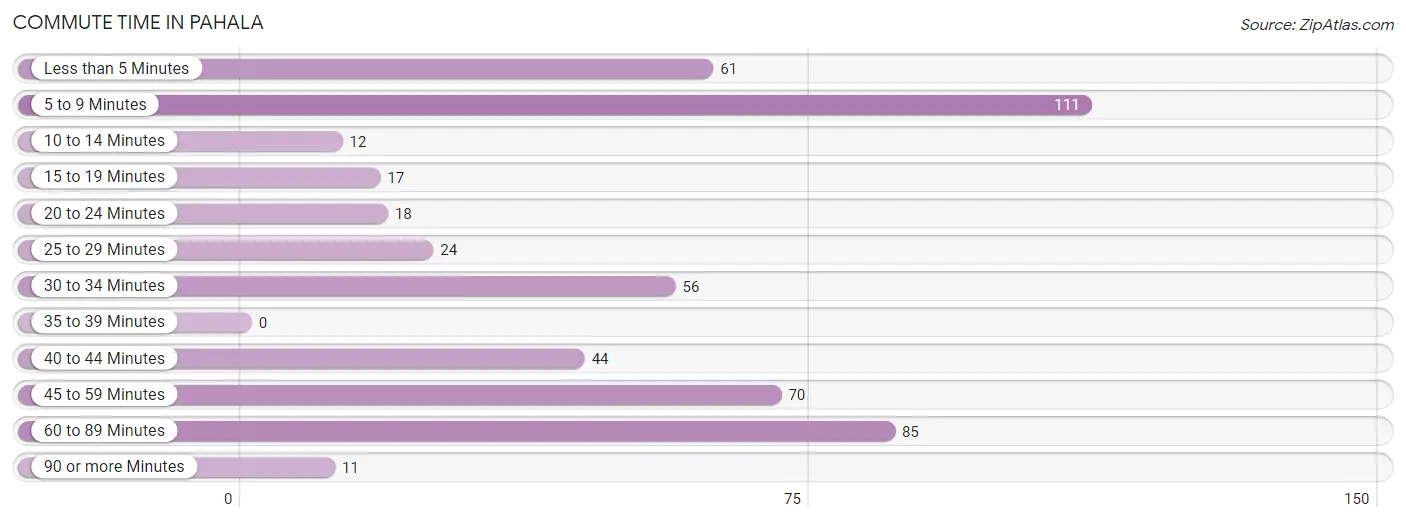
| Commute Time | # Commuters | % Commuters |
| Less than 5 Minutes | 61 | 12.0% |
| 5 to 9 Minutes | 111 | 21.8% |
| 10 to 14 Minutes | 12 | 2.4% |
| 15 to 19 Minutes | 17 | 3.3% |
| 20 to 24 Minutes | 18 | 3.5% |
| 25 to 29 Minutes | 24 | 4.7% |
| 30 to 34 Minutes | 56 | 11.0% |
| 35 to 39 Minutes | 0 | 0.0% |
| 40 to 44 Minutes | 44 | 8.6% |
| 45 to 59 Minutes | 70 | 13.8% |
| 60 to 89 Minutes | 85 | 16.7% |
| 90 or more Minutes | 11 | 2.2% |
Commute Time by Sex in Pahala
The most common commute times in Pahala are 5 to 9 minutes (70 commuters, 23.3%) for males and 45 to 59 minutes (64 commuters, 30.6%) for females.
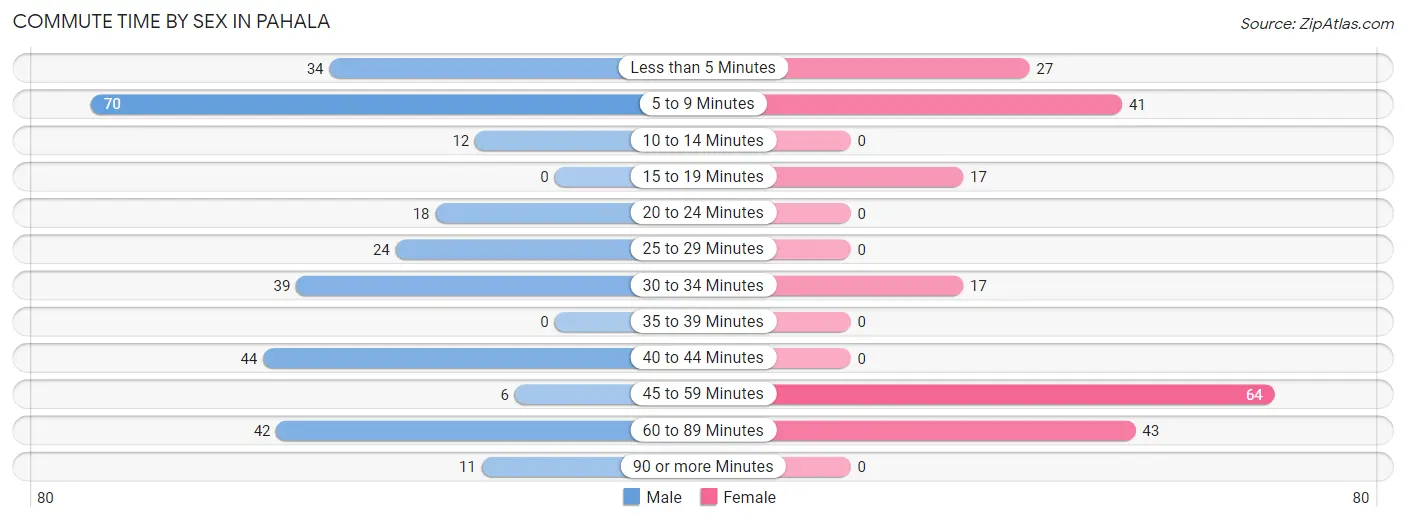
| Commute Time | Male | Female |
| Less than 5 Minutes | 34 (11.3%) | 27 (12.9%) |
| 5 to 9 Minutes | 70 (23.3%) | 41 (19.6%) |
| 10 to 14 Minutes | 12 (4.0%) | 0 (0.0%) |
| 15 to 19 Minutes | 0 (0.0%) | 17 (8.1%) |
| 20 to 24 Minutes | 18 (6.0%) | 0 (0.0%) |
| 25 to 29 Minutes | 24 (8.0%) | 0 (0.0%) |
| 30 to 34 Minutes | 39 (13.0%) | 17 (8.1%) |
| 35 to 39 Minutes | 0 (0.0%) | 0 (0.0%) |
| 40 to 44 Minutes | 44 (14.7%) | 0 (0.0%) |
| 45 to 59 Minutes | 6 (2.0%) | 64 (30.6%) |
| 60 to 89 Minutes | 42 (14.0%) | 43 (20.6%) |
| 90 or more Minutes | 11 (3.7%) | 0 (0.0%) |
Time of Departure to Work by Sex in Pahala
The most frequent times of departure to work in Pahala are 7:00 AM to 7:29 AM (85, 28.3%) for males and 6:00 AM to 6:29 AM (53, 25.4%) for females.
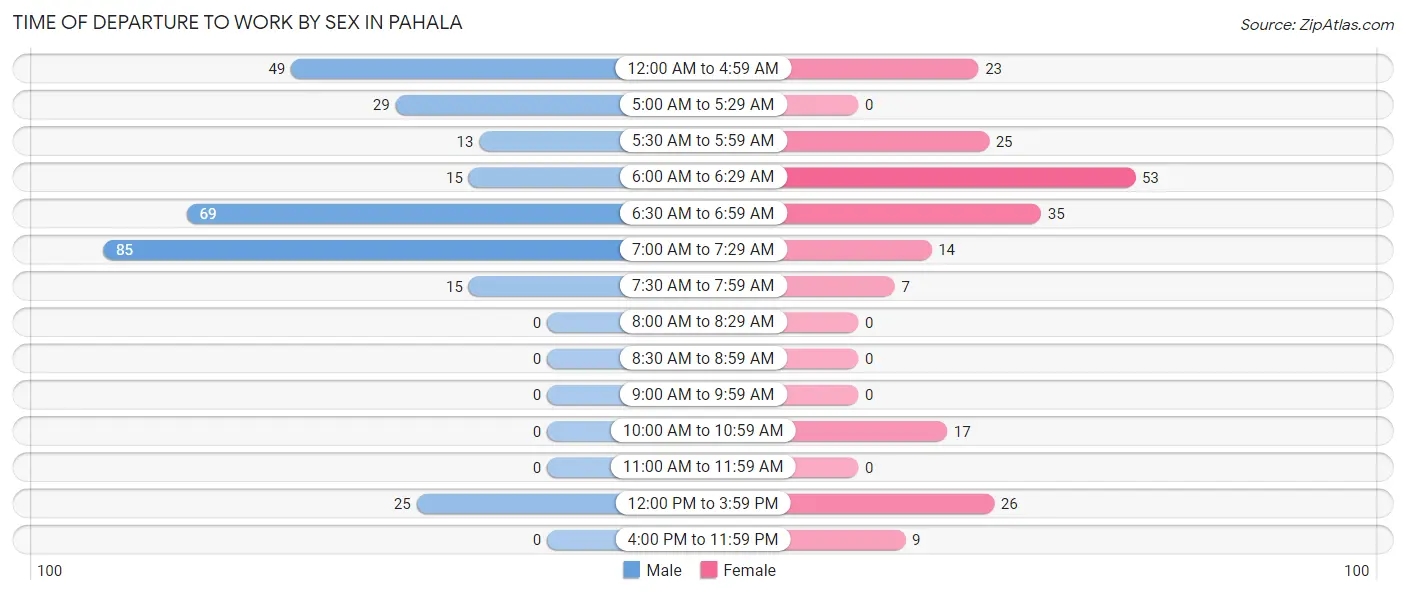
| Time of Departure | Male | Female |
| 12:00 AM to 4:59 AM | 49 (16.3%) | 23 (11.0%) |
| 5:00 AM to 5:29 AM | 29 (9.7%) | 0 (0.0%) |
| 5:30 AM to 5:59 AM | 13 (4.3%) | 25 (12.0%) |
| 6:00 AM to 6:29 AM | 15 (5.0%) | 53 (25.4%) |
| 6:30 AM to 6:59 AM | 69 (23.0%) | 35 (16.8%) |
| 7:00 AM to 7:29 AM | 85 (28.3%) | 14 (6.7%) |
| 7:30 AM to 7:59 AM | 15 (5.0%) | 7 (3.4%) |
| 8:00 AM to 8:29 AM | 0 (0.0%) | 0 (0.0%) |
| 8:30 AM to 8:59 AM | 0 (0.0%) | 0 (0.0%) |
| 9:00 AM to 9:59 AM | 0 (0.0%) | 0 (0.0%) |
| 10:00 AM to 10:59 AM | 0 (0.0%) | 17 (8.1%) |
| 11:00 AM to 11:59 AM | 0 (0.0%) | 0 (0.0%) |
| 12:00 PM to 3:59 PM | 25 (8.3%) | 26 (12.4%) |
| 4:00 PM to 11:59 PM | 0 (0.0%) | 9 (4.3%) |
| Total | 300 (100.0%) | 209 (100.0%) |
Housing Occupancy in Pahala
Occupancy by Ownership in Pahala
Of the total 487 dwellings in Pahala, owner-occupied units account for 391 (80.3%), while renter-occupied units make up 96 (19.7%).
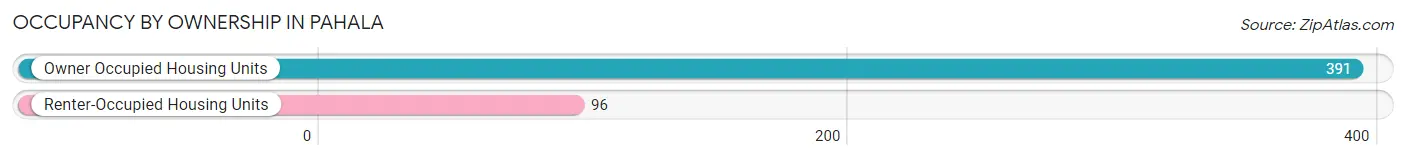
| Occupancy | # Housing Units | % Housing Units |
| Owner Occupied Housing Units | 391 | 80.3% |
| Renter-Occupied Housing Units | 96 | 19.7% |
| Total Occupied Housing Units | 487 | 100.0% |
Occupancy by Household Size in Pahala
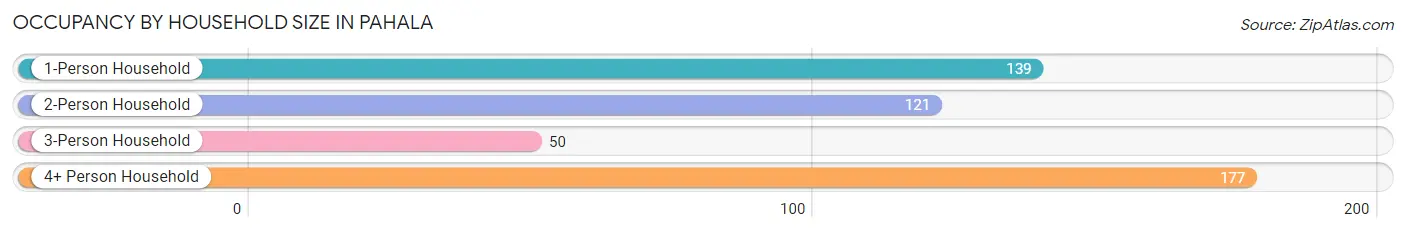
| Household Size | # Housing Units | % Housing Units |
| 1-Person Household | 139 | 28.5% |
| 2-Person Household | 121 | 24.8% |
| 3-Person Household | 50 | 10.3% |
| 4+ Person Household | 177 | 36.3% |
| Total Housing Units | 487 | 100.0% |
Occupancy by Ownership by Household Size in Pahala
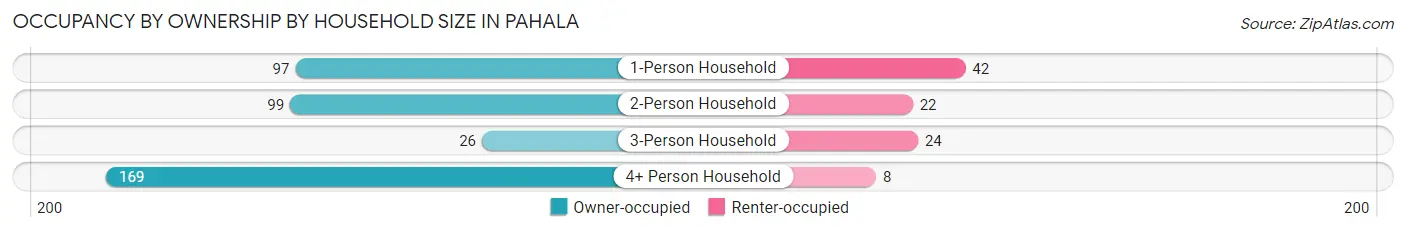
| Household Size | Owner-occupied | Renter-occupied |
| 1-Person Household | 97 (69.8%) | 42 (30.2%) |
| 2-Person Household | 99 (81.8%) | 22 (18.2%) |
| 3-Person Household | 26 (52.0%) | 24 (48.0%) |
| 4+ Person Household | 169 (95.5%) | 8 (4.5%) |
| Total Housing Units | 391 (80.3%) | 96 (19.7%) |
Occupancy by Educational Attainment in Pahala
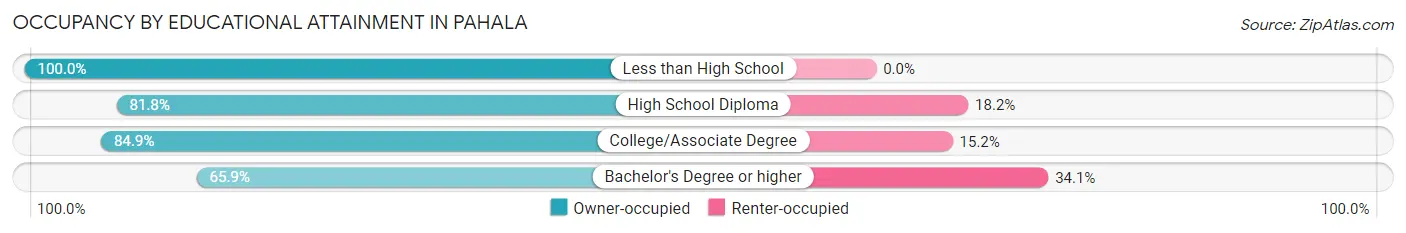
| Household Size | Owner-occupied | Renter-occupied |
| Less than High School | 45 (100.0%) | 0 (0.0%) |
| High School Diploma | 121 (81.8%) | 27 (18.2%) |
| College/Associate Degree | 140 (84.9%) | 25 (15.1%) |
| Bachelor's Degree or higher | 85 (65.9%) | 44 (34.1%) |
Occupancy by Age of Householder in Pahala
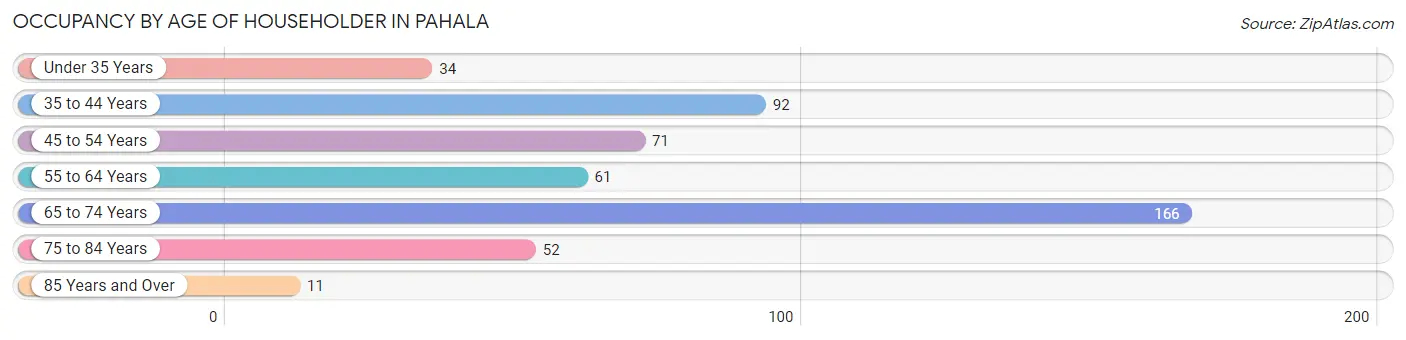
| Age Bracket | # Households | % Households |
| Under 35 Years | 34 | 7.0% |
| 35 to 44 Years | 92 | 18.9% |
| 45 to 54 Years | 71 | 14.6% |
| 55 to 64 Years | 61 | 12.5% |
| 65 to 74 Years | 166 | 34.1% |
| 75 to 84 Years | 52 | 10.7% |
| 85 Years and Over | 11 | 2.3% |
| Total | 487 | 100.0% |
Housing Finances in Pahala
Median Income by Occupancy in Pahala
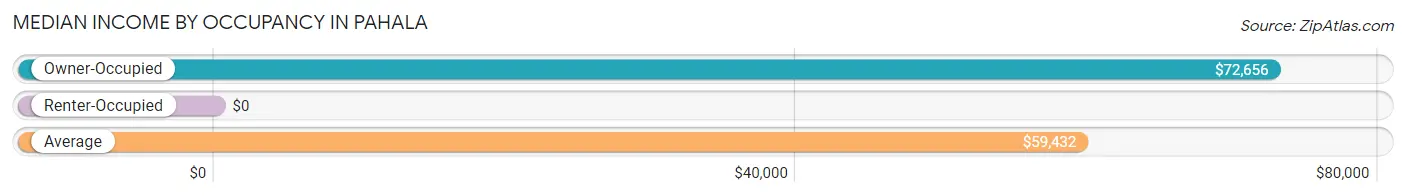
| Occupancy Type | # Households | Median Income |
| Owner-Occupied | 391 (80.3%) | $72,656 |
| Renter-Occupied | 96 (19.7%) | $0 |
| Average | 487 (100.0%) | $59,432 |
Occupancy by Householder Income Bracket in Pahala
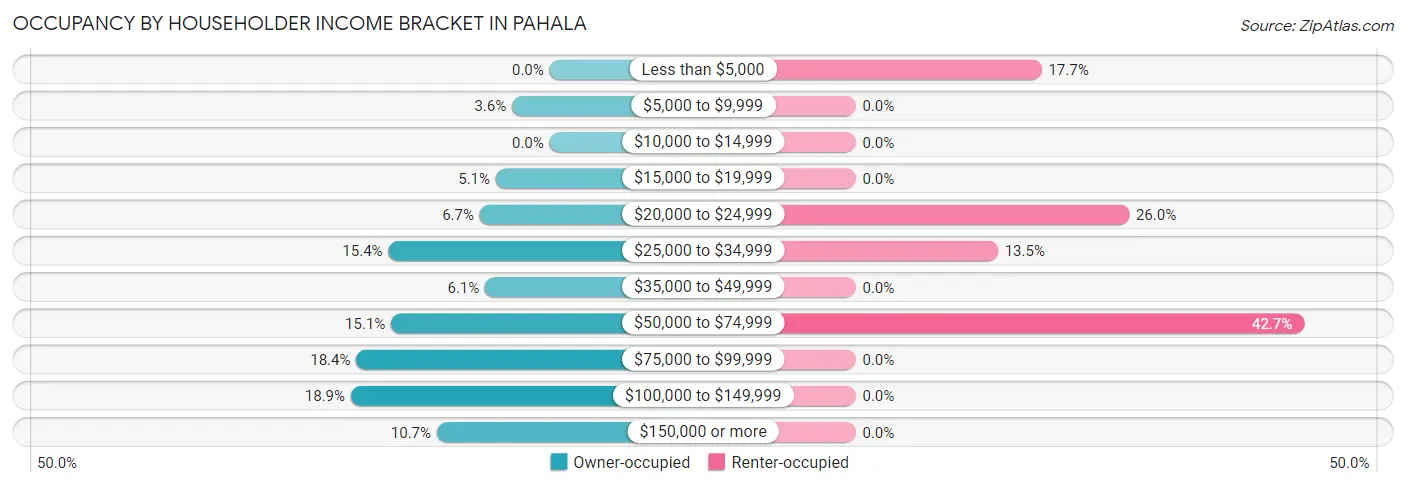
| Income Bracket | Owner-occupied | Renter-occupied |
| Less than $5,000 | 0 (0.0%) | 17 (17.7%) |
| $5,000 to $9,999 | 14 (3.6%) | 0 (0.0%) |
| $10,000 to $14,999 | 0 (0.0%) | 0 (0.0%) |
| $15,000 to $19,999 | 20 (5.1%) | 0 (0.0%) |
| $20,000 to $24,999 | 26 (6.7%) | 25 (26.0%) |
| $25,000 to $34,999 | 60 (15.3%) | 13 (13.5%) |
| $35,000 to $49,999 | 24 (6.1%) | 0 (0.0%) |
| $50,000 to $74,999 | 59 (15.1%) | 41 (42.7%) |
| $75,000 to $99,999 | 72 (18.4%) | 0 (0.0%) |
| $100,000 to $149,999 | 74 (18.9%) | 0 (0.0%) |
| $150,000 or more | 42 (10.7%) | 0 (0.0%) |
| Total | 391 (100.0%) | 96 (100.0%) |
Monthly Housing Cost Tiers in Pahala
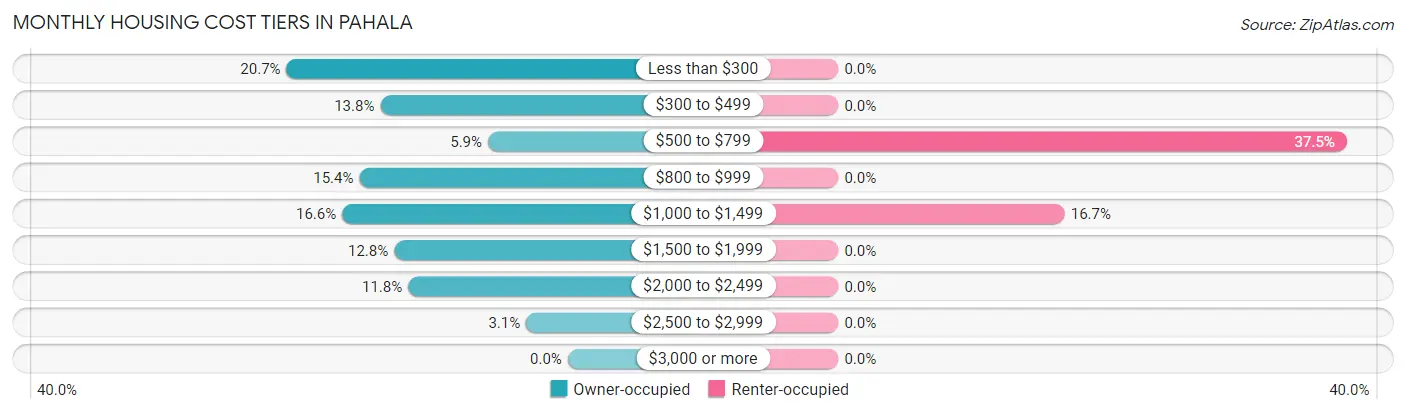
| Monthly Cost | Owner-occupied | Renter-occupied |
| Less than $300 | 81 (20.7%) | 0 (0.0%) |
| $300 to $499 | 54 (13.8%) | 0 (0.0%) |
| $500 to $799 | 23 (5.9%) | 36 (37.5%) |
| $800 to $999 | 60 (15.3%) | 0 (0.0%) |
| $1,000 to $1,499 | 65 (16.6%) | 16 (16.7%) |
| $1,500 to $1,999 | 50 (12.8%) | 0 (0.0%) |
| $2,000 to $2,499 | 46 (11.8%) | 0 (0.0%) |
| $2,500 to $2,999 | 12 (3.1%) | 0 (0.0%) |
| $3,000 or more | 0 (0.0%) | 0 (0.0%) |
| Total | 391 (100.0%) | 96 (100.0%) |
Physical Housing Characteristics in Pahala
Housing Structures in Pahala
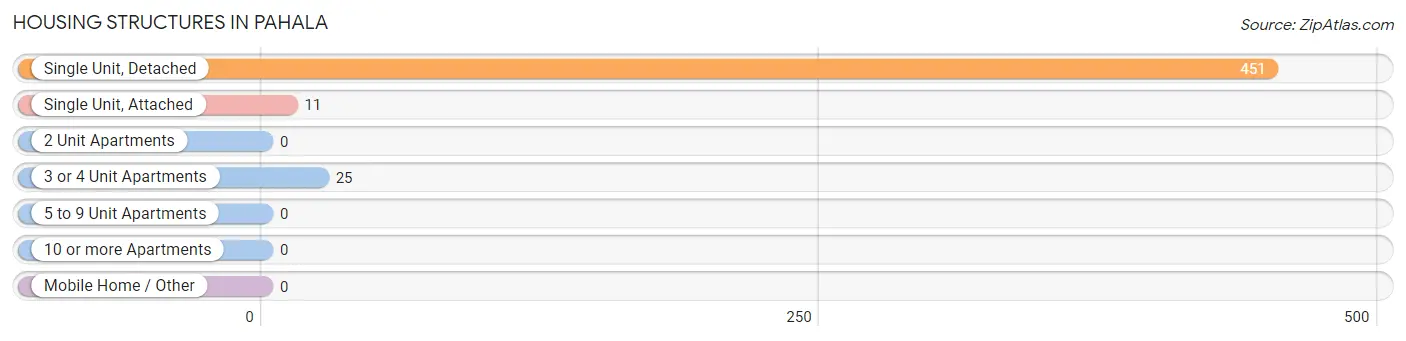
| Structure Type | # Housing Units | % Housing Units |
| Single Unit, Detached | 451 | 92.6% |
| Single Unit, Attached | 11 | 2.3% |
| 2 Unit Apartments | 0 | 0.0% |
| 3 or 4 Unit Apartments | 25 | 5.1% |
| 5 to 9 Unit Apartments | 0 | 0.0% |
| 10 or more Apartments | 0 | 0.0% |
| Mobile Home / Other | 0 | 0.0% |
| Total | 487 | 100.0% |
Housing Structures by Occupancy in Pahala
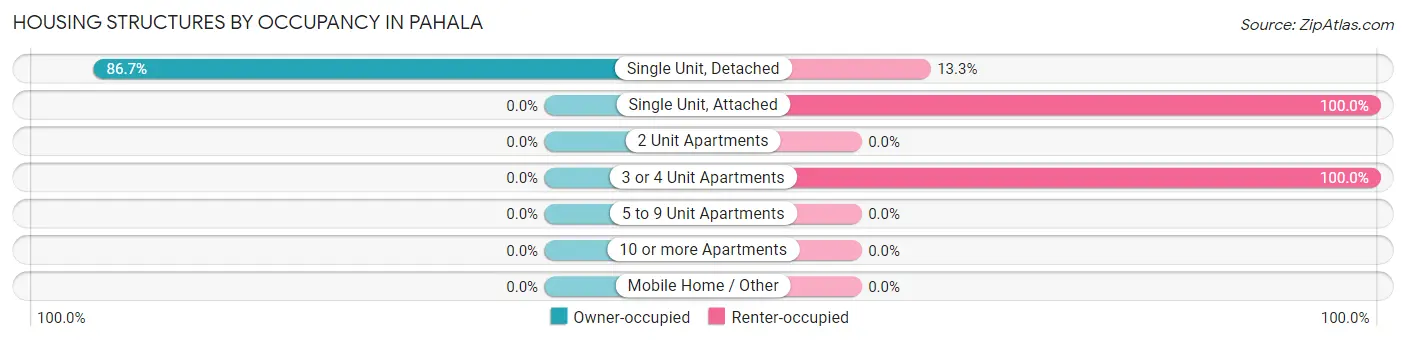
| Structure Type | Owner-occupied | Renter-occupied |
| Single Unit, Detached | 391 (86.7%) | 60 (13.3%) |
| Single Unit, Attached | 0 (0.0%) | 11 (100.0%) |
| 2 Unit Apartments | 0 (0.0%) | 0 (0.0%) |
| 3 or 4 Unit Apartments | 0 (0.0%) | 25 (100.0%) |
| 5 to 9 Unit Apartments | 0 (0.0%) | 0 (0.0%) |
| 10 or more Apartments | 0 (0.0%) | 0 (0.0%) |
| Mobile Home / Other | 0 (0.0%) | 0 (0.0%) |
| Total | 391 (80.3%) | 96 (19.7%) |
Housing Structures by Number of Rooms in Pahala
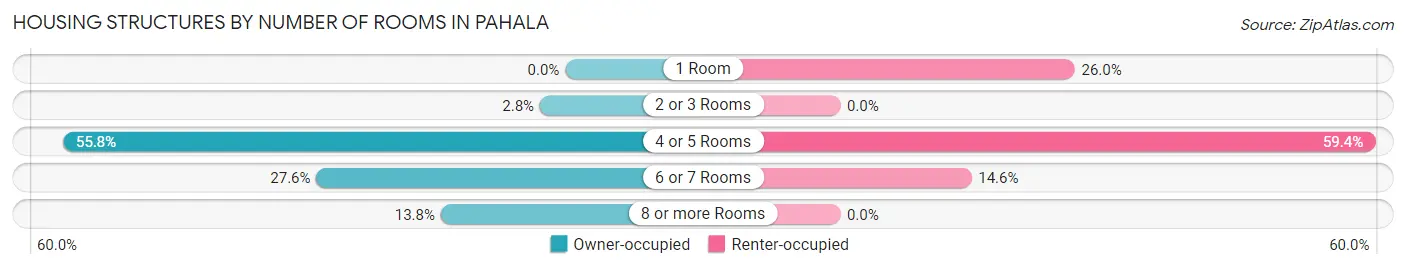
| Number of Rooms | Owner-occupied | Renter-occupied |
| 1 Room | 0 (0.0%) | 25 (26.0%) |
| 2 or 3 Rooms | 11 (2.8%) | 0 (0.0%) |
| 4 or 5 Rooms | 218 (55.7%) | 57 (59.4%) |
| 6 or 7 Rooms | 108 (27.6%) | 14 (14.6%) |
| 8 or more Rooms | 54 (13.8%) | 0 (0.0%) |
| Total | 391 (100.0%) | 96 (100.0%) |
Housing Structure by Heating Type in Pahala
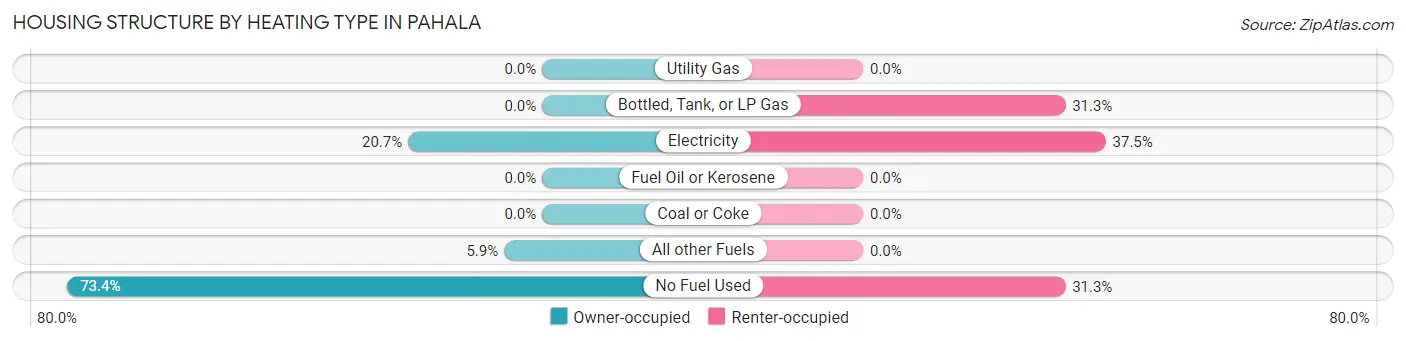
| Heating Type | Owner-occupied | Renter-occupied |
| Utility Gas | 0 (0.0%) | 0 (0.0%) |
| Bottled, Tank, or LP Gas | 0 (0.0%) | 30 (31.2%) |
| Electricity | 81 (20.7%) | 36 (37.5%) |
| Fuel Oil or Kerosene | 0 (0.0%) | 0 (0.0%) |
| Coal or Coke | 0 (0.0%) | 0 (0.0%) |
| All other Fuels | 23 (5.9%) | 0 (0.0%) |
| No Fuel Used | 287 (73.4%) | 30 (31.2%) |
| Total | 391 (100.0%) | 96 (100.0%) |
Household Vehicle Usage in Pahala
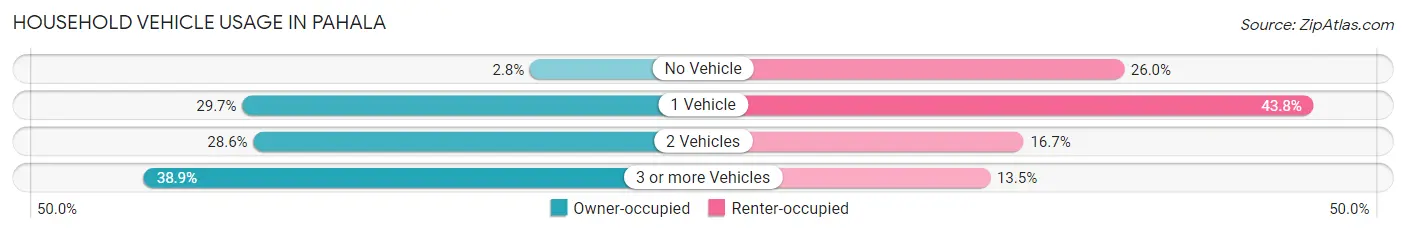
| Vehicles per Household | Owner-occupied | Renter-occupied |
| No Vehicle | 11 (2.8%) | 25 (26.0%) |
| 1 Vehicle | 116 (29.7%) | 42 (43.8%) |
| 2 Vehicles | 112 (28.6%) | 16 (16.7%) |
| 3 or more Vehicles | 152 (38.9%) | 13 (13.5%) |
| Total | 391 (100.0%) | 96 (100.0%) |
Real Estate & Mortgages in Pahala
Real Estate and Mortgage Overview in Pahala
| Characteristic | Without Mortgage | With Mortgage |
| Housing Units | 155 | 236 |
| Median Property Value | $195,100 | $220,200 |
| Median Household Income | $52,159 | $42 |
| Monthly Housing Costs | $295 | $0 |
| Real Estate Taxes | - | - |
Property Value by Mortgage Status in Pahala
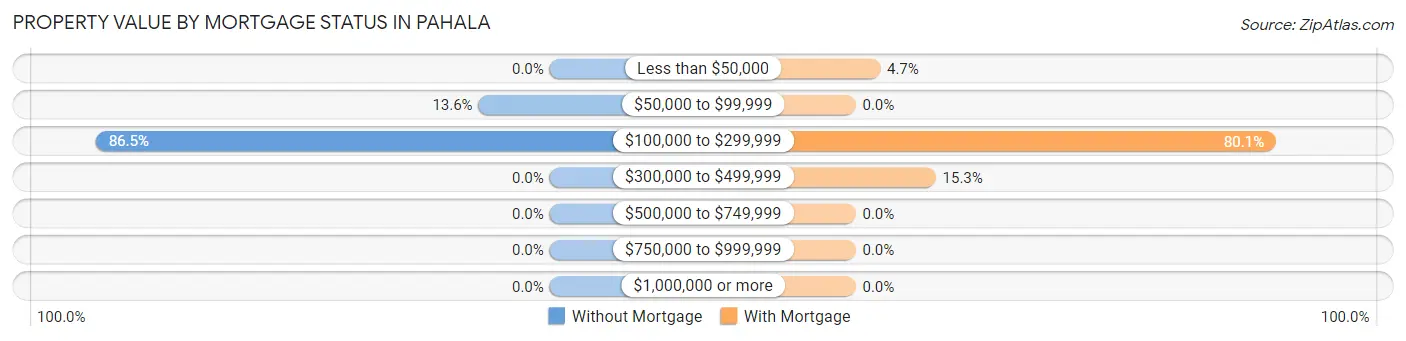
| Property Value | Without Mortgage | With Mortgage |
| Less than $50,000 | 0 (0.0%) | 11 (4.7%) |
| $50,000 to $99,999 | 21 (13.6%) | 0 (0.0%) |
| $100,000 to $299,999 | 134 (86.5%) | 189 (80.1%) |
| $300,000 to $499,999 | 0 (0.0%) | 36 (15.2%) |
| $500,000 to $749,999 | 0 (0.0%) | 0 (0.0%) |
| $750,000 to $999,999 | 0 (0.0%) | 0 (0.0%) |
| $1,000,000 or more | 0 (0.0%) | 0 (0.0%) |
| Total | 155 (100.0%) | 236 (100.0%) |
Household Income by Mortgage Status in Pahala
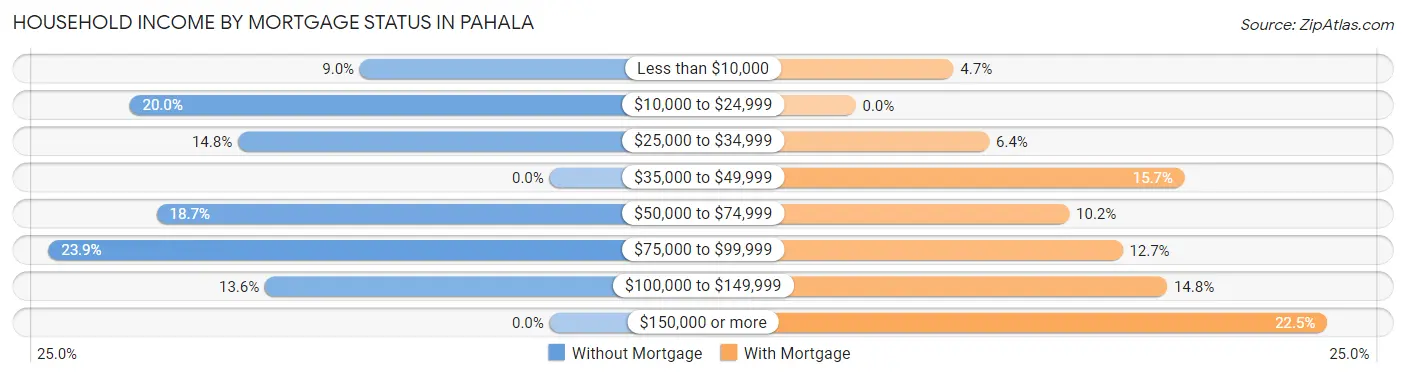
| Household Income | Without Mortgage | With Mortgage |
| Less than $10,000 | 14 (9.0%) | 11 (4.7%) |
| $10,000 to $24,999 | 31 (20.0%) | 0 (0.0%) |
| $25,000 to $34,999 | 23 (14.8%) | 15 (6.4%) |
| $35,000 to $49,999 | 0 (0.0%) | 37 (15.7%) |
| $50,000 to $74,999 | 29 (18.7%) | 24 (10.2%) |
| $75,000 to $99,999 | 37 (23.9%) | 30 (12.7%) |
| $100,000 to $149,999 | 21 (13.6%) | 35 (14.8%) |
| $150,000 or more | 0 (0.0%) | 53 (22.5%) |
| Total | 155 (100.0%) | 236 (100.0%) |
Property Value to Household Income Ratio in Pahala
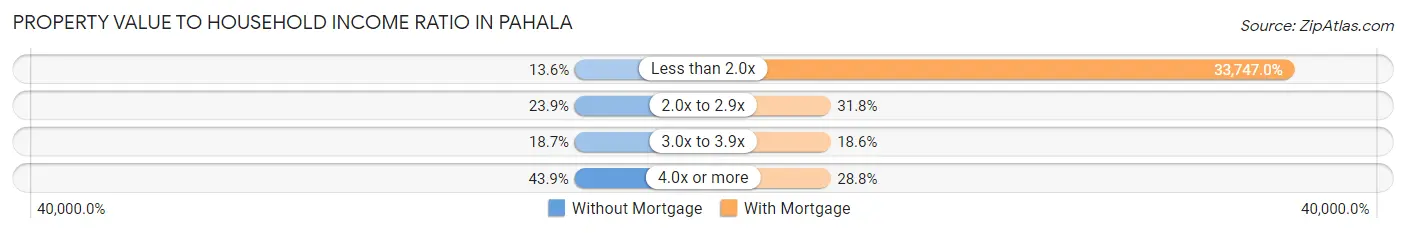
| Value-to-Income Ratio | Without Mortgage | With Mortgage |
| Less than 2.0x | 21 (13.6%) | 79,643 (33,747.0%) |
| 2.0x to 2.9x | 37 (23.9%) | 75 (31.8%) |
| 3.0x to 3.9x | 29 (18.7%) | 44 (18.6%) |
| 4.0x or more | 68 (43.9%) | 68 (28.8%) |
| Total | 155 (100.0%) | 236 (100.0%) |
Real Estate Taxes by Mortgage Status in Pahala
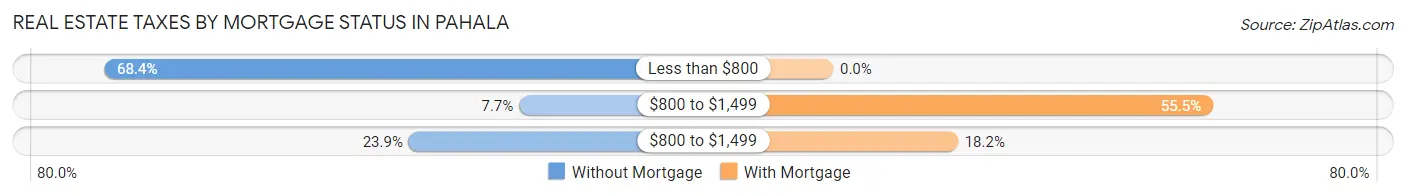
| Property Taxes | Without Mortgage | With Mortgage |
| Less than $800 | 106 (68.4%) | 0 (0.0%) |
| $800 to $1,499 | 12 (7.7%) | 131 (55.5%) |
| $800 to $1,499 | 37 (23.9%) | 43 (18.2%) |
| Total | 155 (100.0%) | 236 (100.0%) |
Health & Disability in Pahala
Health Insurance Coverage by Age in Pahala
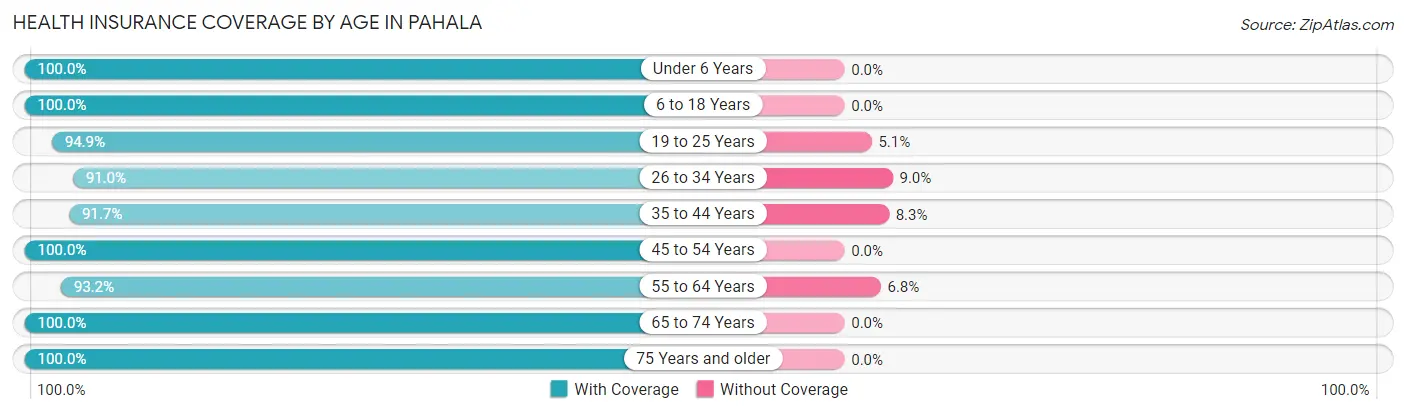
| Age Bracket | With Coverage | Without Coverage |
| Under 6 Years | 334 (100.0%) | 0 (0.0%) |
| 6 to 18 Years | 309 (100.0%) | 0 (0.0%) |
| 19 to 25 Years | 281 (94.9%) | 15 (5.1%) |
| 26 to 34 Years | 162 (91.0%) | 16 (9.0%) |
| 35 to 44 Years | 155 (91.7%) | 14 (8.3%) |
| 45 to 54 Years | 134 (100.0%) | 0 (0.0%) |
| 55 to 64 Years | 138 (93.2%) | 10 (6.8%) |
| 65 to 74 Years | 229 (100.0%) | 0 (0.0%) |
| 75 Years and older | 84 (100.0%) | 0 (0.0%) |
| Total | 1,826 (97.1%) | 55 (2.9%) |
Health Insurance Coverage by Citizenship Status in Pahala
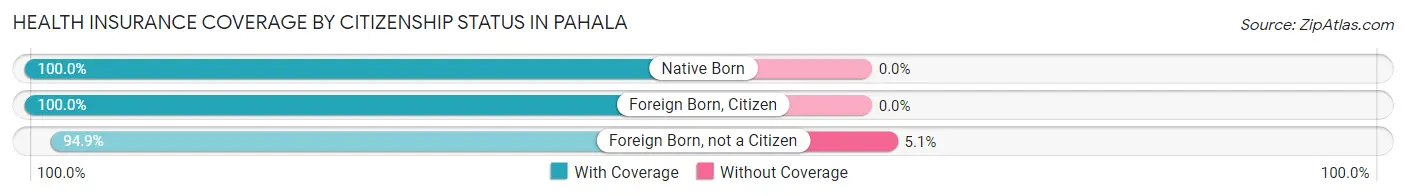
| Citizenship Status | With Coverage | Without Coverage |
| Native Born | 334 (100.0%) | 0 (0.0%) |
| Foreign Born, Citizen | 309 (100.0%) | 0 (0.0%) |
| Foreign Born, not a Citizen | 281 (94.9%) | 15 (5.1%) |
Health Insurance Coverage by Household Income in Pahala
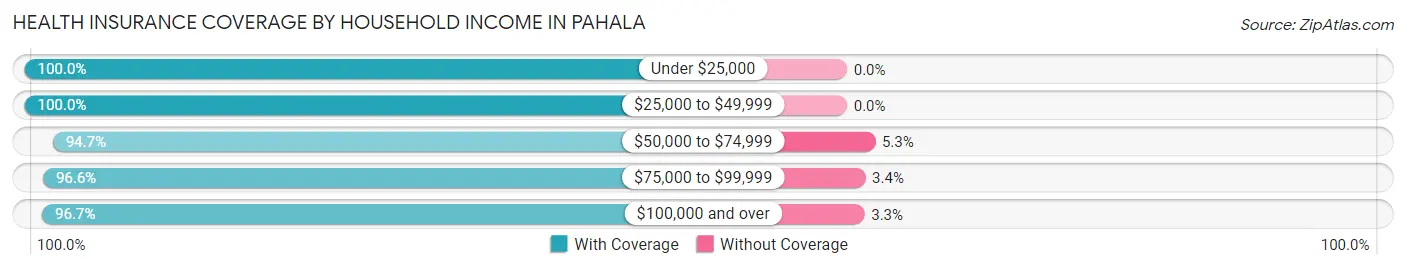
| Household Income | With Coverage | Without Coverage |
| Under $25,000 | 141 (100.0%) | 0 (0.0%) |
| $25,000 to $49,999 | 281 (100.0%) | 0 (0.0%) |
| $50,000 to $74,999 | 287 (94.7%) | 16 (5.3%) |
| $75,000 to $99,999 | 674 (96.6%) | 24 (3.4%) |
| $100,000 and over | 443 (96.7%) | 15 (3.3%) |
Public vs Private Health Insurance Coverage by Age in Pahala
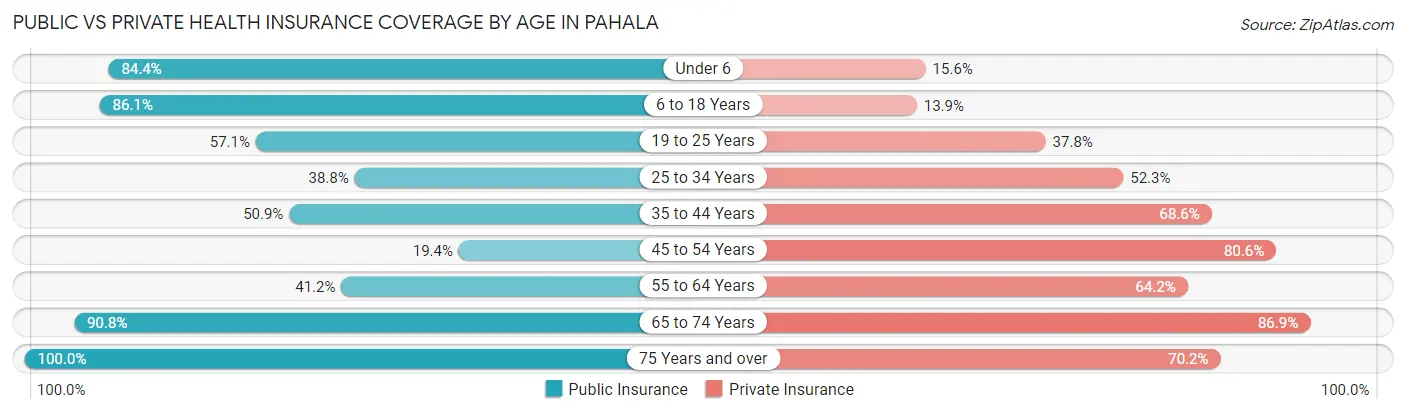
| Age Bracket | Public Insurance | Private Insurance |
| Under 6 | 282 (84.4%) | 52 (15.6%) |
| 6 to 18 Years | 266 (86.1%) | 43 (13.9%) |
| 19 to 25 Years | 169 (57.1%) | 112 (37.8%) |
| 25 to 34 Years | 69 (38.8%) | 93 (52.2%) |
| 35 to 44 Years | 86 (50.9%) | 116 (68.6%) |
| 45 to 54 Years | 26 (19.4%) | 108 (80.6%) |
| 55 to 64 Years | 61 (41.2%) | 95 (64.2%) |
| 65 to 74 Years | 208 (90.8%) | 199 (86.9%) |
| 75 Years and over | 84 (100.0%) | 59 (70.2%) |
| Total | 1,251 (66.5%) | 877 (46.6%) |
Disability Status by Sex by Age in Pahala
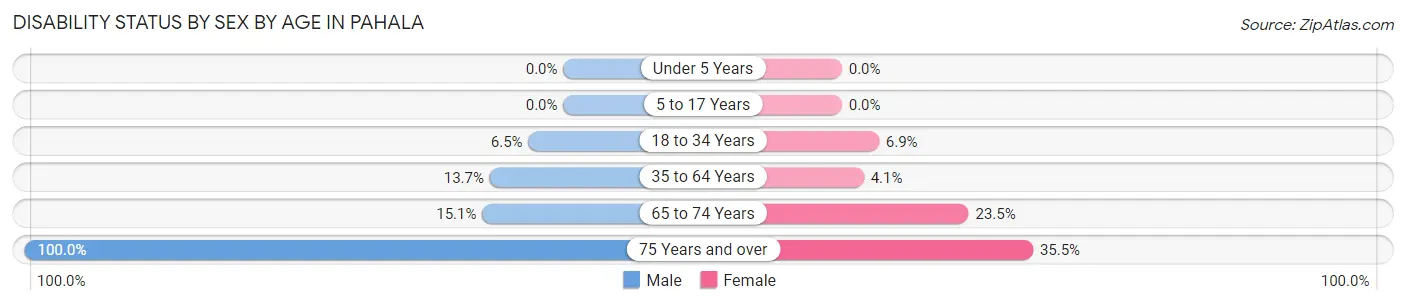
| Age Bracket | Male | Female |
| Under 5 Years | 0 (0.0%) | 0 (0.0%) |
| 5 to 17 Years | 0 (0.0%) | 0 (0.0%) |
| 18 to 34 Years | 16 (6.5%) | 16 (6.9%) |
| 35 to 64 Years | 28 (13.7%) | 10 (4.1%) |
| 65 to 74 Years | 14 (15.0%) | 32 (23.5%) |
| 75 Years and over | 53 (100.0%) | 11 (35.5%) |
Disability Class by Sex by Age in Pahala
Disability Class: Hearing Difficulty
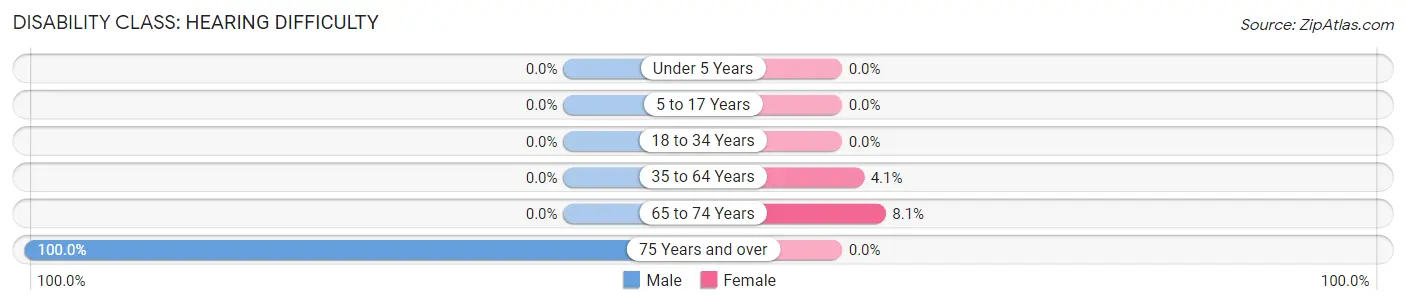
| Age Bracket | Male | Female |
| Under 5 Years | 0 (0.0%) | 0 (0.0%) |
| 5 to 17 Years | 0 (0.0%) | 0 (0.0%) |
| 18 to 34 Years | 0 (0.0%) | 0 (0.0%) |
| 35 to 64 Years | 0 (0.0%) | 10 (4.1%) |
| 65 to 74 Years | 0 (0.0%) | 11 (8.1%) |
| 75 Years and over | 53 (100.0%) | 0 (0.0%) |
Disability Class: Vision Difficulty
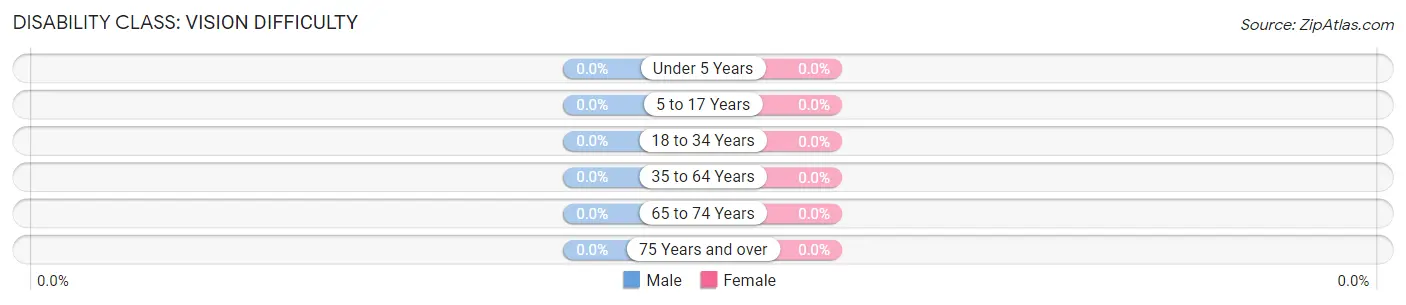
| Age Bracket | Male | Female |
| Under 5 Years | 0 (0.0%) | 0 (0.0%) |
| 5 to 17 Years | 0 (0.0%) | 0 (0.0%) |
| 18 to 34 Years | 0 (0.0%) | 0 (0.0%) |
| 35 to 64 Years | 0 (0.0%) | 0 (0.0%) |
| 65 to 74 Years | 0 (0.0%) | 0 (0.0%) |
| 75 Years and over | 0 (0.0%) | 0 (0.0%) |
Disability Class: Cognitive Difficulty
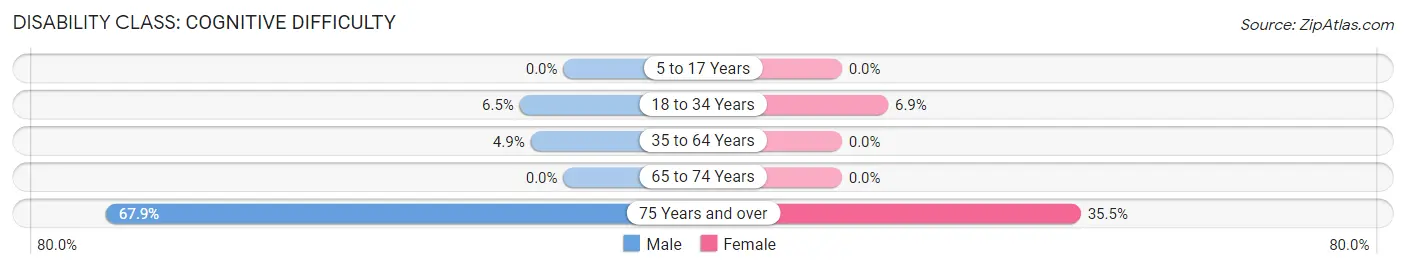
| Age Bracket | Male | Female |
| 5 to 17 Years | 0 (0.0%) | 0 (0.0%) |
| 18 to 34 Years | 16 (6.5%) | 16 (6.9%) |
| 35 to 64 Years | 10 (4.9%) | 0 (0.0%) |
| 65 to 74 Years | 0 (0.0%) | 0 (0.0%) |
| 75 Years and over | 36 (67.9%) | 11 (35.5%) |
Disability Class: Ambulatory Difficulty
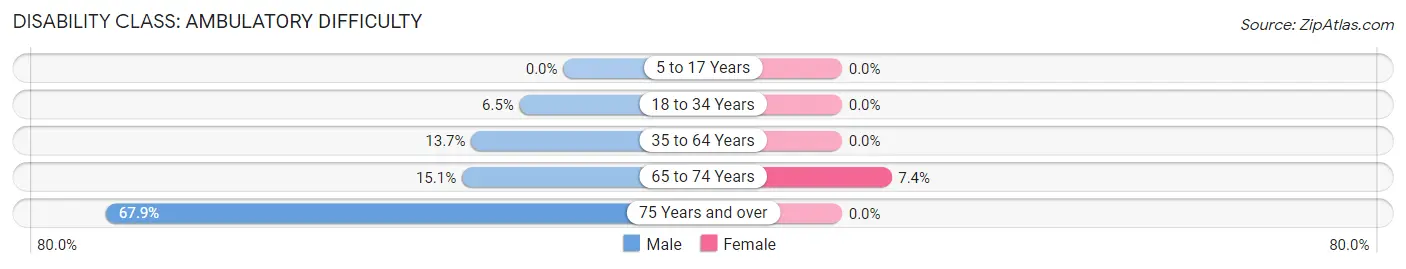
| Age Bracket | Male | Female |
| 5 to 17 Years | 0 (0.0%) | 0 (0.0%) |
| 18 to 34 Years | 16 (6.5%) | 0 (0.0%) |
| 35 to 64 Years | 28 (13.7%) | 0 (0.0%) |
| 65 to 74 Years | 14 (15.0%) | 10 (7.3%) |
| 75 Years and over | 36 (67.9%) | 0 (0.0%) |
Disability Class: Self-Care Difficulty
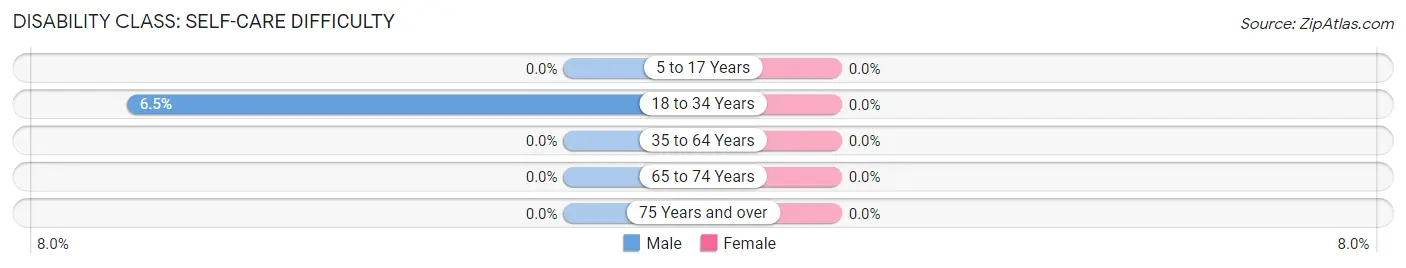
| Age Bracket | Male | Female |
| 5 to 17 Years | 0 (0.0%) | 0 (0.0%) |
| 18 to 34 Years | 16 (6.5%) | 0 (0.0%) |
| 35 to 64 Years | 0 (0.0%) | 0 (0.0%) |
| 65 to 74 Years | 0 (0.0%) | 0 (0.0%) |
| 75 Years and over | 0 (0.0%) | 0 (0.0%) |
Technology Access in Pahala
Computing Device Access in Pahala
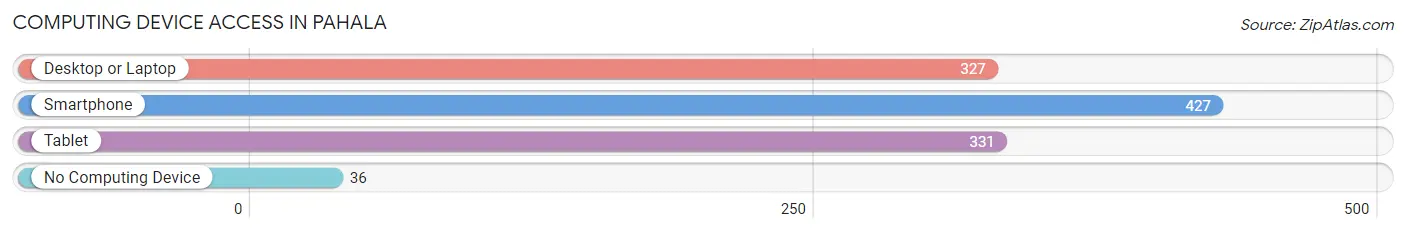
| Device Type | # Households | % Households |
| Desktop or Laptop | 327 | 67.1% |
| Smartphone | 427 | 87.7% |
| Tablet | 331 | 68.0% |
| No Computing Device | 36 | 7.4% |
| Total | 487 | 100.0% |
Internet Access in Pahala
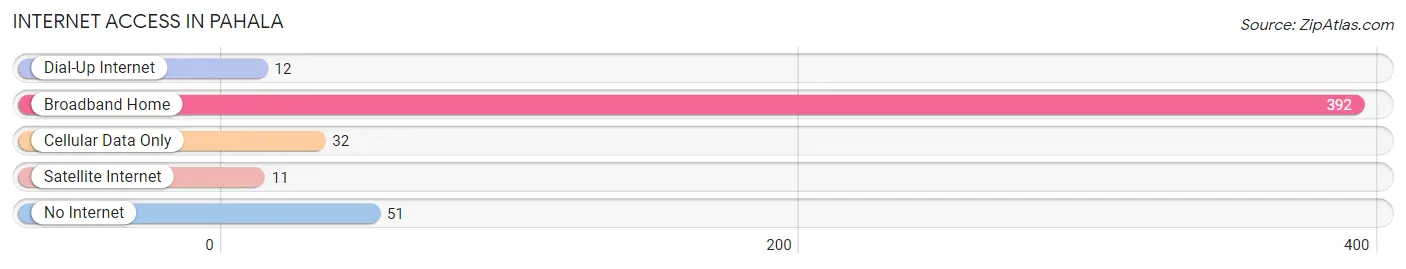
| Internet Type | # Households | % Households |
| Dial-Up Internet | 12 | 2.5% |
| Broadband Home | 392 | 80.5% |
| Cellular Data Only | 32 | 6.6% |
| Satellite Internet | 11 | 2.3% |
| No Internet | 51 | 10.5% |
| Total | 487 | 100.0% |
Pahala Summary
Pahala is a small unincorporated community located in the Kaʻū District on the Big Island of Hawaiʻi. It is located on the slopes of Mauna Loa, about 20 miles south of the town of Naʻalehu. The population of Pahala was 1,356 as of the 2010 census.
History
Pahala was founded in the late 19th century by Japanese immigrants who were looking for a place to grow sugar cane. The first sugar mill in Pahala was built in 1895 and the town quickly grew to become the largest sugar-producing area in the Kaʻū District. The town was named after the nearby Pahala River, which was named after a Hawaiian chief who lived in the area.
In the early 20th century, Pahala was a thriving community with a population of over 2,000 people. The town had a post office, a bank, a hotel, a movie theater, and several stores. The sugar industry was the main source of employment for the town's residents.
In the 1950s, the sugar industry began to decline and many of the town's residents moved away. By the 1970s, the population had dropped to just over 1,000 people.
Geography
Pahala is located on the slopes of Mauna Loa, about 20 miles south of the town of Naʻalehu. The town is situated at an elevation of 1,400 feet and is surrounded by lush tropical vegetation. The climate is warm and humid, with temperatures ranging from the mid-70s to the mid-80s.
The town is located near several beaches, including Punaluʻu Beach, which is known for its black sand. The nearby Kaʻū Forest Reserve is a popular destination for hikers and nature lovers.
Economy
The economy of Pahala is largely based on agriculture. The town is home to several farms that grow a variety of crops, including sugar cane, coffee, macadamia nuts, and tropical fruits.
The town is also home to several small businesses, including restaurants, shops, and a gas station. The nearby Punaluʻu Beach is a popular tourist destination, and the town is home to several bed and breakfasts.
Demographics
As of the 2010 census, the population of Pahala was 1,356. The racial makeup of the town was 57.3% White, 0.7% African American, 0.3% Native American, 0.2% Asian, 0.1% Pacific Islander, and 41.4% from other races.
The median household income in Pahala was $37,917, and the median family income was $45,000. The per capita income was $17,917. About 17.3% of the population was below the poverty line.
Common Questions
What is the Total Population of Pahala?
Total Population of Pahala is 1,897.
What is the Total Male Population of Pahala?
Total Male Population of Pahala is 866.
What is the Total Female Population of Pahala?
Total Female Population of Pahala is 1,031.
What is the Ratio of Males per 100 Females in Pahala?
There are 84.00 Males per 100 Females in Pahala.
What is the Ratio of Females per 100 Males in Pahala?
There are 119.05 Females per 100 Males in Pahala.
What is the Median Population Age in Pahala?
Median Population Age in Pahala is 26.2 Years.
What is the Average Family Size in Pahala
Average Family Size in Pahala is 5.0 People.
What is the Average Household Size in Pahala
Average Household Size in Pahala is 3.9 People.
What is Per Capita Income in Pahala?
Per Capita income in Pahala is $19,483.
What is the Median Family Income in Pahala?
Median Family Income in Pahala is $78,393.
What is the Median Household income in Pahala?
Median Household Income in Pahala is $59,432.
What is Income or Wage Gap in Pahala?
Income or Wage Gap in Pahala is 49.3%.
Women in Pahala earn 50.7 cents for every dollar earned by a man.
What is Inequality or Gini Index in Pahala?
Inequality or Gini Index in Pahala is 0.40.
How Large is the Labor Force in Pahala?
There are 752 People in the Labor Forcein in Pahala.
What is the Percentage of People in the Labor Force in Pahala?
57.2% of People are in the Labor Force in Pahala.
What is the Unemployment Rate in Pahala?
Unemployment Rate in Pahala is 19.6%.