Kenyan vs Immigrants from Zimbabwe Self-Care Disability
COMPARE
Kenyan
Immigrants from Zimbabwe
Self-Care Disability
Self-Care Disability Comparison
Kenyans
Immigrants from Zimbabwe
2.3%
SELF-CARE DISABILITY
99.7/ 100
METRIC RATING
51st/ 347
METRIC RANK
2.3%
SELF-CARE DISABILITY
99.9/ 100
METRIC RATING
29th/ 347
METRIC RANK
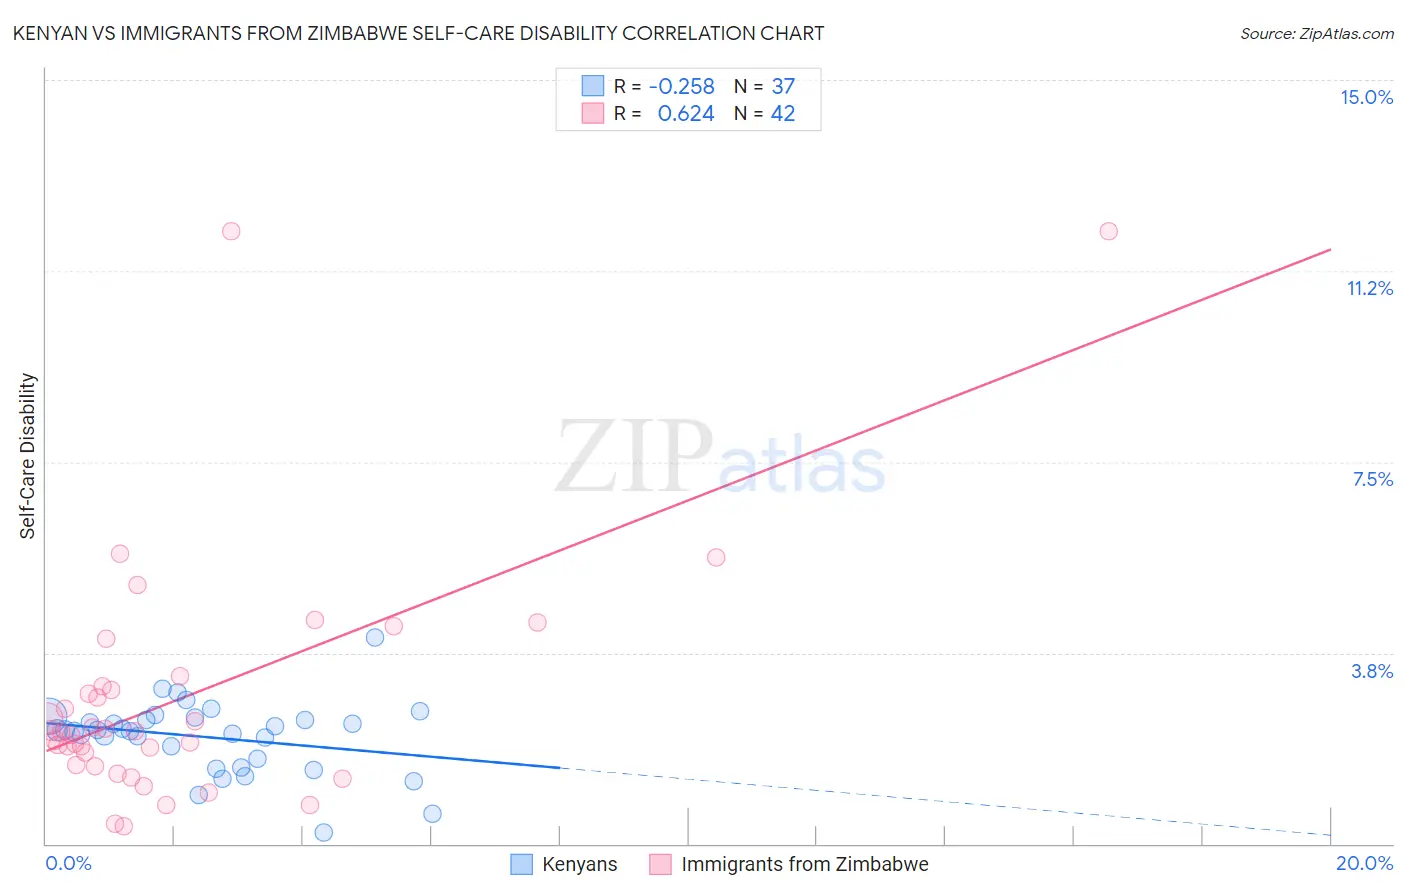
Kenyan vs Immigrants from Zimbabwe Self-Care Disability Correlation Chart
The statistical analysis conducted on geographies consisting of 168,082,411 people shows a weak negative correlation between the proportion of Kenyans and percentage of population with self-care disability in the United States with a correlation coefficient (R) of -0.258 and weighted average of 2.3%. Similarly, the statistical analysis conducted on geographies consisting of 117,788,572 people shows a significant positive correlation between the proportion of Immigrants from Zimbabwe and percentage of population with self-care disability in the United States with a correlation coefficient (R) of 0.624 and weighted average of 2.3%, a difference of 2.2%.
Self-Care Disability Correlation Summary
| Measurement | Kenyan | Immigrants from Zimbabwe |
| Minimum | 0.23% | 0.34% |
| Maximum | 4.1% | 12.0% |
| Range | 3.8% | 11.7% |
| Mean | 2.1% | 2.9% |
| Median | 2.2% | 2.2% |
| Interquartile 25% (IQ1) | 1.6% | 1.6% |
| Interquartile 75% (IQ3) | 2.5% | 3.1% |
| Interquartile Range (IQR) | 0.87% | 1.5% |
| Standard Deviation (Sample) | 0.71% | 2.4% |
| Standard Deviation (Population) | 0.70% | 2.4% |
Similar Demographics by Self-Care Disability
Demographics Similar to Kenyans by Self-Care Disability
In terms of self-care disability, the demographic groups most similar to Kenyans are Immigrants from Serbia (2.3%, a difference of 0.020%), Australian (2.3%, a difference of 0.060%), Argentinean (2.3%, a difference of 0.10%), Immigrants from Brazil (2.3%, a difference of 0.15%), and Latvian (2.3%, a difference of 0.17%).
| Demographics | Rating | Rank | Self-Care Disability |
| Immigrants | South Africa | 99.8 /100 | #44 | Exceptional 2.3% |
| Norwegians | 99.8 /100 | #45 | Exceptional 2.3% |
| Czechs | 99.8 /100 | #46 | Exceptional 2.3% |
| Jordanians | 99.7 /100 | #47 | Exceptional 2.3% |
| Immigrants | Malaysia | 99.7 /100 | #48 | Exceptional 2.3% |
| Latvians | 99.7 /100 | #49 | Exceptional 2.3% |
| Immigrants | Brazil | 99.7 /100 | #50 | Exceptional 2.3% |
| Kenyans | 99.7 /100 | #51 | Exceptional 2.3% |
| Immigrants | Serbia | 99.6 /100 | #52 | Exceptional 2.3% |
| Australians | 99.6 /100 | #53 | Exceptional 2.3% |
| Argentineans | 99.6 /100 | #54 | Exceptional 2.3% |
| Immigrants | France | 99.6 /100 | #55 | Exceptional 2.3% |
| Immigrants | Eastern Asia | 99.6 /100 | #56 | Exceptional 2.3% |
| Immigrants | Belgium | 99.6 /100 | #57 | Exceptional 2.3% |
| Immigrants | Cameroon | 99.6 /100 | #58 | Exceptional 2.3% |
Demographics Similar to Immigrants from Zimbabwe by Self-Care Disability
In terms of self-care disability, the demographic groups most similar to Immigrants from Zimbabwe are Inupiat (2.2%, a difference of 0.090%), Venezuelan (2.2%, a difference of 0.25%), Immigrants from Sri Lanka (2.2%, a difference of 0.26%), Turkish (2.2%, a difference of 0.33%), and Paraguayan (2.3%, a difference of 0.33%).
| Demographics | Rating | Rank | Self-Care Disability |
| Immigrants | Venezuela | 100.0 /100 | #22 | Exceptional 2.2% |
| Cambodians | 100.0 /100 | #23 | Exceptional 2.2% |
| Cypriots | 100.0 /100 | #24 | Exceptional 2.2% |
| Turks | 100.0 /100 | #25 | Exceptional 2.2% |
| Immigrants | Sri Lanka | 99.9 /100 | #26 | Exceptional 2.2% |
| Venezuelans | 99.9 /100 | #27 | Exceptional 2.2% |
| Inupiat | 99.9 /100 | #28 | Exceptional 2.2% |
| Immigrants | Zimbabwe | 99.9 /100 | #29 | Exceptional 2.3% |
| Paraguayans | 99.9 /100 | #30 | Exceptional 2.3% |
| Danes | 99.9 /100 | #31 | Exceptional 2.3% |
| Burmese | 99.9 /100 | #32 | Exceptional 2.3% |
| Immigrants | Korea | 99.9 /100 | #33 | Exceptional 2.3% |
| Immigrants | Turkey | 99.9 /100 | #34 | Exceptional 2.3% |
| Immigrants | Australia | 99.9 /100 | #35 | Exceptional 2.3% |
| Immigrants | Lithuania | 99.9 /100 | #36 | Exceptional 2.3% |