Immigrants from Venezuela vs U.S. Virgin Islander Self-Care Disability
COMPARE
Immigrants from Venezuela
U.S. Virgin Islander
Self-Care Disability
Self-Care Disability Comparison
Immigrants from Venezuela
U.S. Virgin Islanders
2.2%
SELF-CARE DISABILITY
100.0/ 100
METRIC RATING
22nd/ 347
METRIC RANK
2.7%
SELF-CARE DISABILITY
0.1/ 100
METRIC RATING
269th/ 347
METRIC RANK
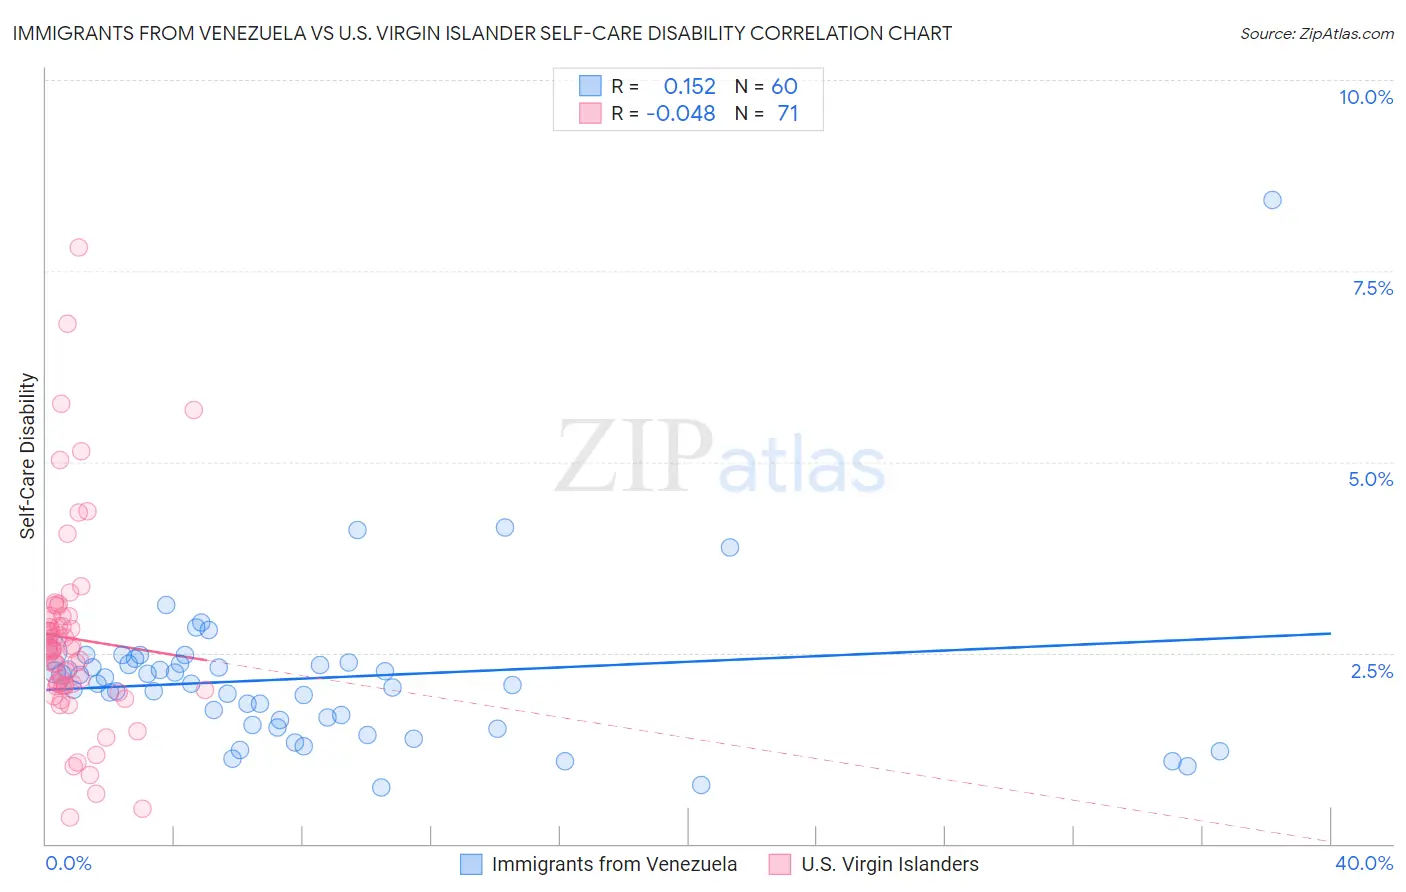
Immigrants from Venezuela vs U.S. Virgin Islander Self-Care Disability Correlation Chart
The statistical analysis conducted on geographies consisting of 287,724,504 people shows a poor positive correlation between the proportion of Immigrants from Venezuela and percentage of population with self-care disability in the United States with a correlation coefficient (R) of 0.152 and weighted average of 2.2%. Similarly, the statistical analysis conducted on geographies consisting of 87,500,828 people shows no correlation between the proportion of U.S. Virgin Islanders and percentage of population with self-care disability in the United States with a correlation coefficient (R) of -0.048 and weighted average of 2.7%, a difference of 19.8%.
Self-Care Disability Correlation Summary
| Measurement | Immigrants from Venezuela | U.S. Virgin Islander |
| Minimum | 0.74% | 0.34% |
| Maximum | 8.4% | 7.8% |
| Range | 7.7% | 7.5% |
| Mean | 2.2% | 2.7% |
| Median | 2.1% | 2.6% |
| Interquartile 25% (IQ1) | 1.6% | 2.1% |
| Interquartile 75% (IQ3) | 2.4% | 3.0% |
| Interquartile Range (IQR) | 0.78% | 0.92% |
| Standard Deviation (Sample) | 1.1% | 1.3% |
| Standard Deviation (Population) | 1.1% | 1.3% |
Similar Demographics by Self-Care Disability
Demographics Similar to Immigrants from Venezuela by Self-Care Disability
In terms of self-care disability, the demographic groups most similar to Immigrants from Venezuela are Bulgarian (2.2%, a difference of 0.040%), Cambodian (2.2%, a difference of 0.21%), Tongan (2.2%, a difference of 0.29%), Immigrants from Eritrea (2.2%, a difference of 0.36%), and Cypriot (2.2%, a difference of 0.52%).
| Demographics | Rating | Rank | Self-Care Disability |
| Okinawans | 100.0 /100 | #15 | Exceptional 2.2% |
| Immigrants | Kuwait | 100.0 /100 | #16 | Exceptional 2.2% |
| Immigrants | Saudi Arabia | 100.0 /100 | #17 | Exceptional 2.2% |
| Immigrants | Taiwan | 100.0 /100 | #18 | Exceptional 2.2% |
| Immigrants | Eritrea | 100.0 /100 | #19 | Exceptional 2.2% |
| Tongans | 100.0 /100 | #20 | Exceptional 2.2% |
| Bulgarians | 100.0 /100 | #21 | Exceptional 2.2% |
| Immigrants | Venezuela | 100.0 /100 | #22 | Exceptional 2.2% |
| Cambodians | 100.0 /100 | #23 | Exceptional 2.2% |
| Cypriots | 100.0 /100 | #24 | Exceptional 2.2% |
| Turks | 100.0 /100 | #25 | Exceptional 2.2% |
| Immigrants | Sri Lanka | 99.9 /100 | #26 | Exceptional 2.2% |
| Venezuelans | 99.9 /100 | #27 | Exceptional 2.2% |
| Inupiat | 99.9 /100 | #28 | Exceptional 2.2% |
| Immigrants | Zimbabwe | 99.9 /100 | #29 | Exceptional 2.3% |
Demographics Similar to U.S. Virgin Islanders by Self-Care Disability
In terms of self-care disability, the demographic groups most similar to U.S. Virgin Islanders are Immigrants from Micronesia (2.7%, a difference of 0.040%), Trinidadian and Tobagonian (2.7%, a difference of 0.10%), Immigrants from Laos (2.7%, a difference of 0.14%), Immigrants from Mexico (2.7%, a difference of 0.17%), and Yaqui (2.7%, a difference of 0.22%).
| Demographics | Rating | Rank | Self-Care Disability |
| Shoshone | 0.2 /100 | #262 | Tragic 2.7% |
| Immigrants | Latin America | 0.2 /100 | #263 | Tragic 2.7% |
| Immigrants | Iran | 0.2 /100 | #264 | Tragic 2.7% |
| Immigrants | Nicaragua | 0.2 /100 | #265 | Tragic 2.7% |
| Immigrants | Cambodia | 0.1 /100 | #266 | Tragic 2.7% |
| Yaqui | 0.1 /100 | #267 | Tragic 2.7% |
| Immigrants | Mexico | 0.1 /100 | #268 | Tragic 2.7% |
| U.S. Virgin Islanders | 0.1 /100 | #269 | Tragic 2.7% |
| Immigrants | Micronesia | 0.1 /100 | #270 | Tragic 2.7% |
| Trinidadians and Tobagonians | 0.1 /100 | #271 | Tragic 2.7% |
| Immigrants | Laos | 0.1 /100 | #272 | Tragic 2.7% |
| Mexicans | 0.1 /100 | #273 | Tragic 2.7% |
| Yakama | 0.1 /100 | #274 | Tragic 2.7% |
| Immigrants | Trinidad and Tobago | 0.1 /100 | #275 | Tragic 2.7% |
| Japanese | 0.1 /100 | #276 | Tragic 2.7% |